
Activation of Cytotoxic Lymphocytes and Presence of Regulatory T Cells in the Trachea of Non-Vaccinated and Vaccinated Chickens as a Recall to an Infectious Laryngotracheitis Virus (ILTV) Challenge

 and
and 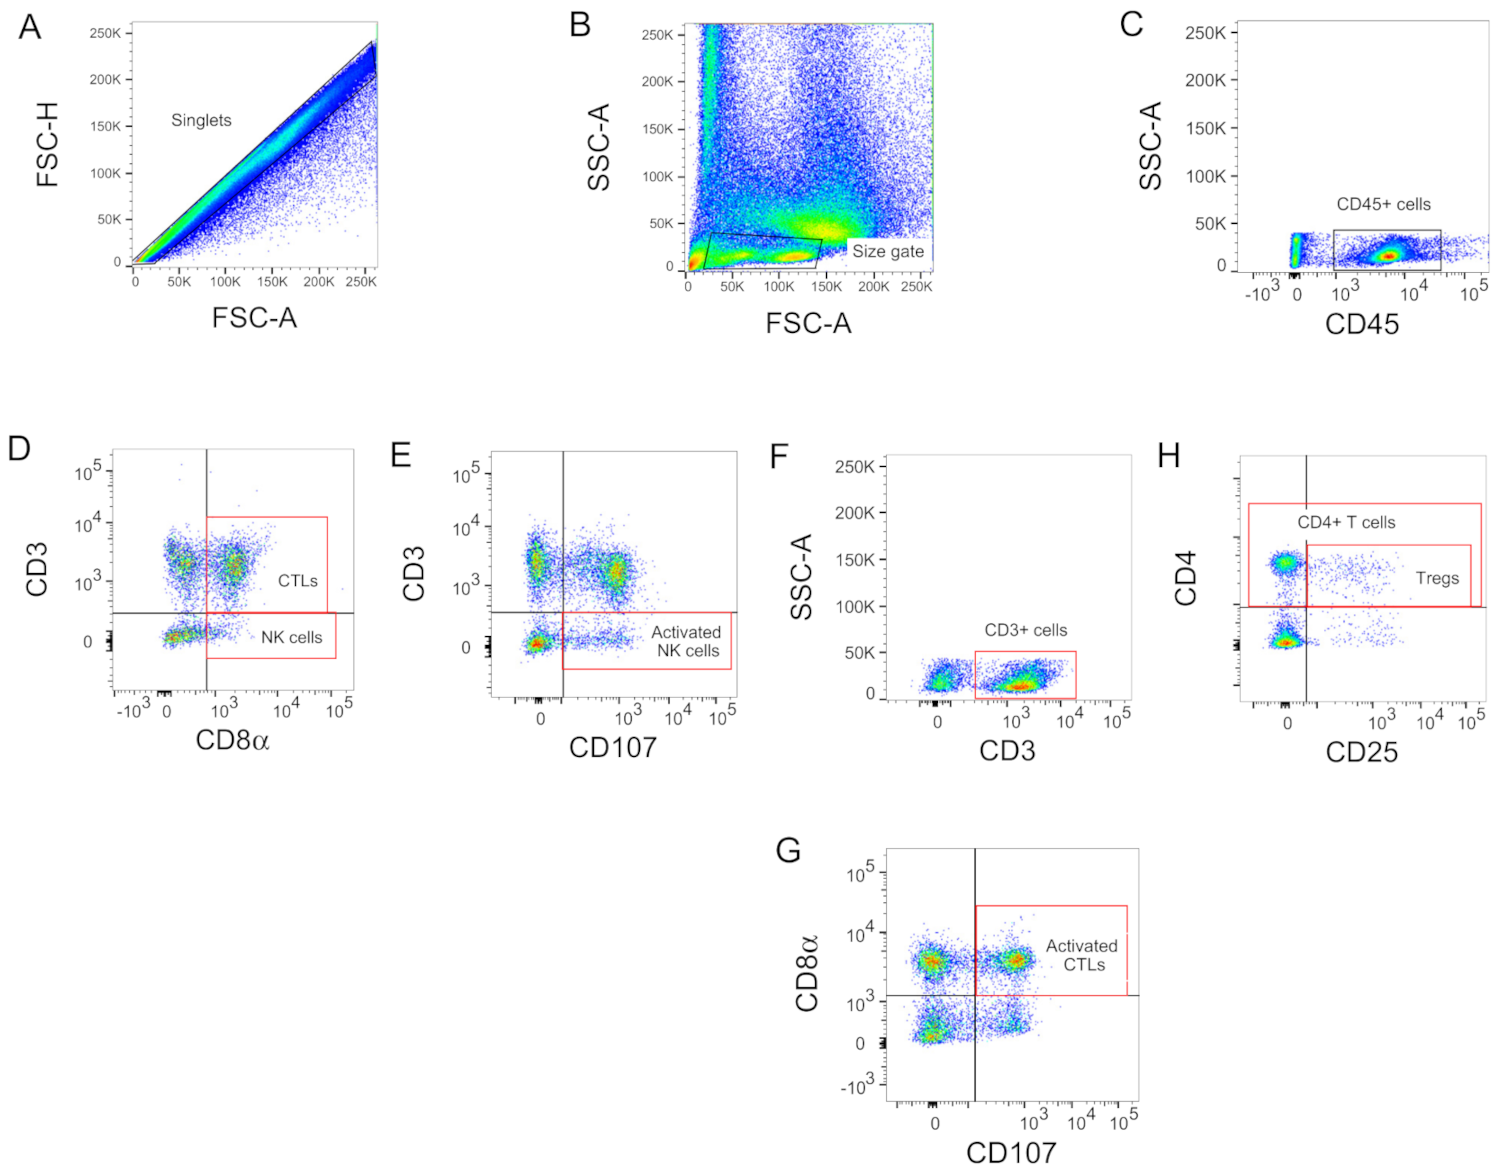
Abstract
:1. Introduction
2. Materials and Methods
2.1. Vaccines and Vaccines Titration
2.2. Challenge Virus
2.3. Experimental Design
2.4. Clinical Signs
2.5. DNA Extraction
2.6. Duplex ILTV Real-Time PCR
2.7. Histopathology
2.8. Single Cell Suspension
2.9. Flow Cytometry
2.10. CD107 Assay
2.11. Statistical Analysis
3. Results
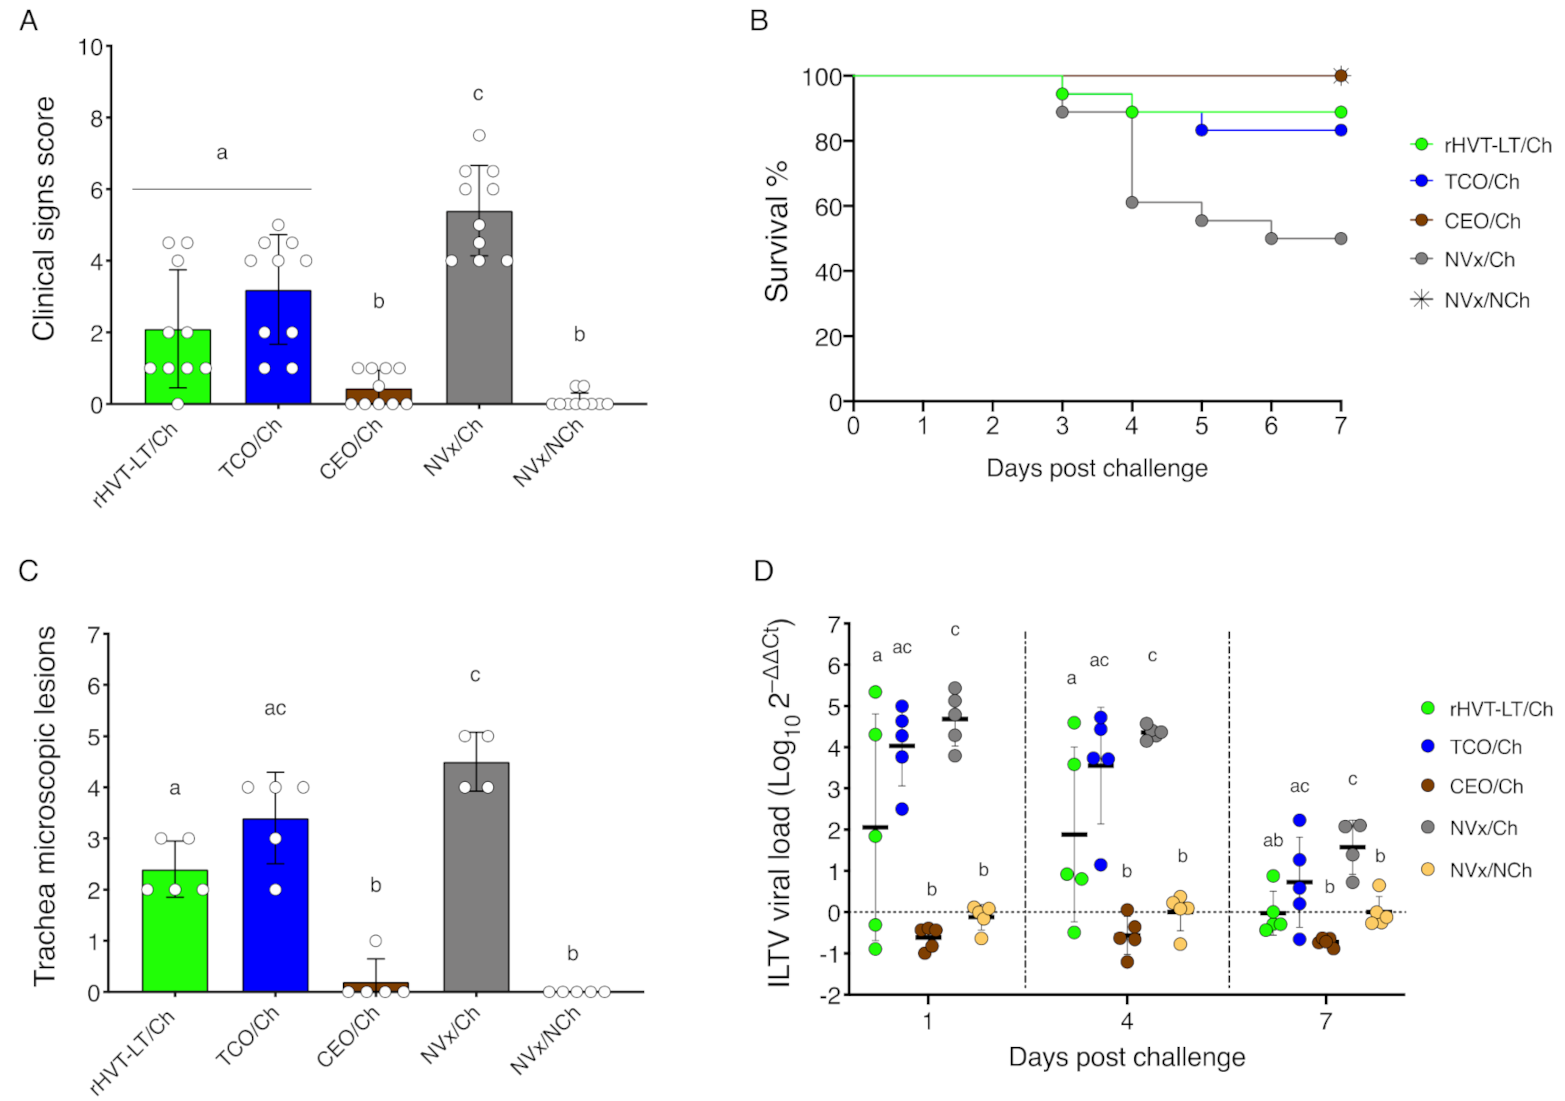
3.1. CEO Vaccine Showed the Best Protection against an ILTV Challenge
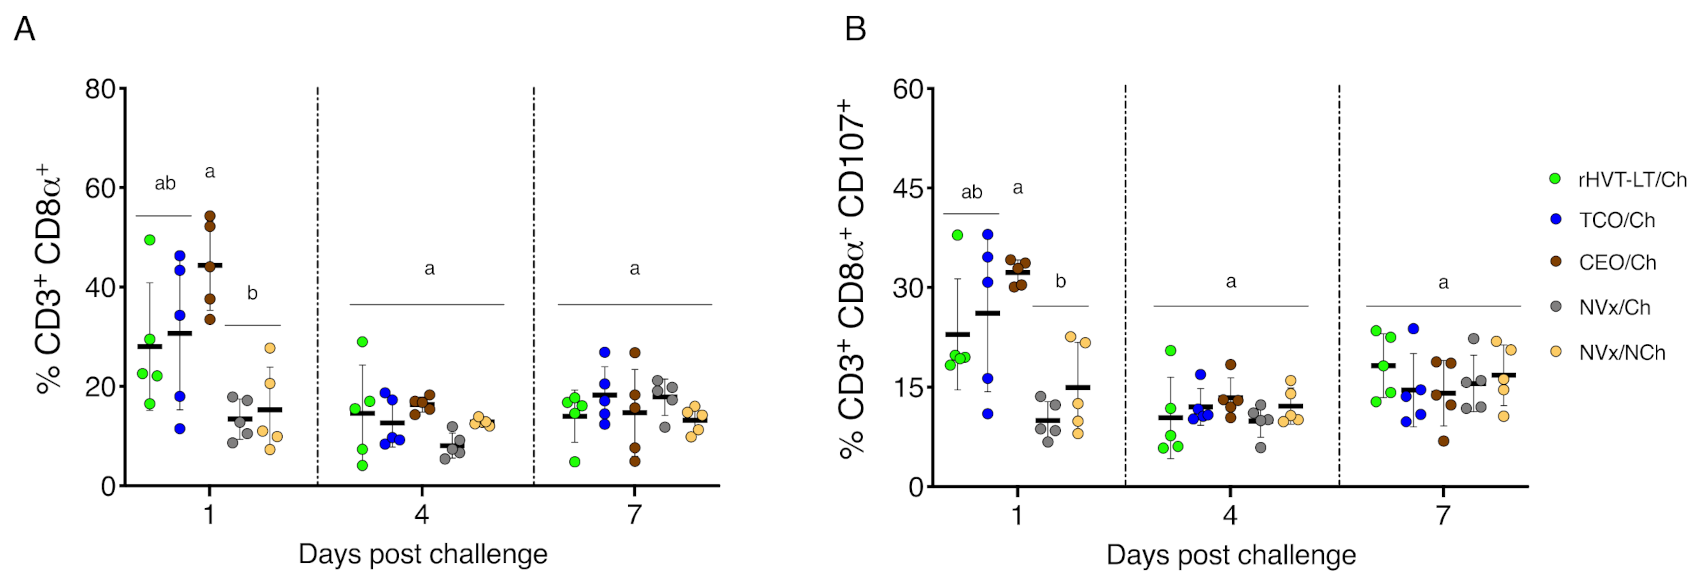
3.2. Early Increase of CTLs and Activated CTLs in Vaccinated Challenged Groups of Chickens
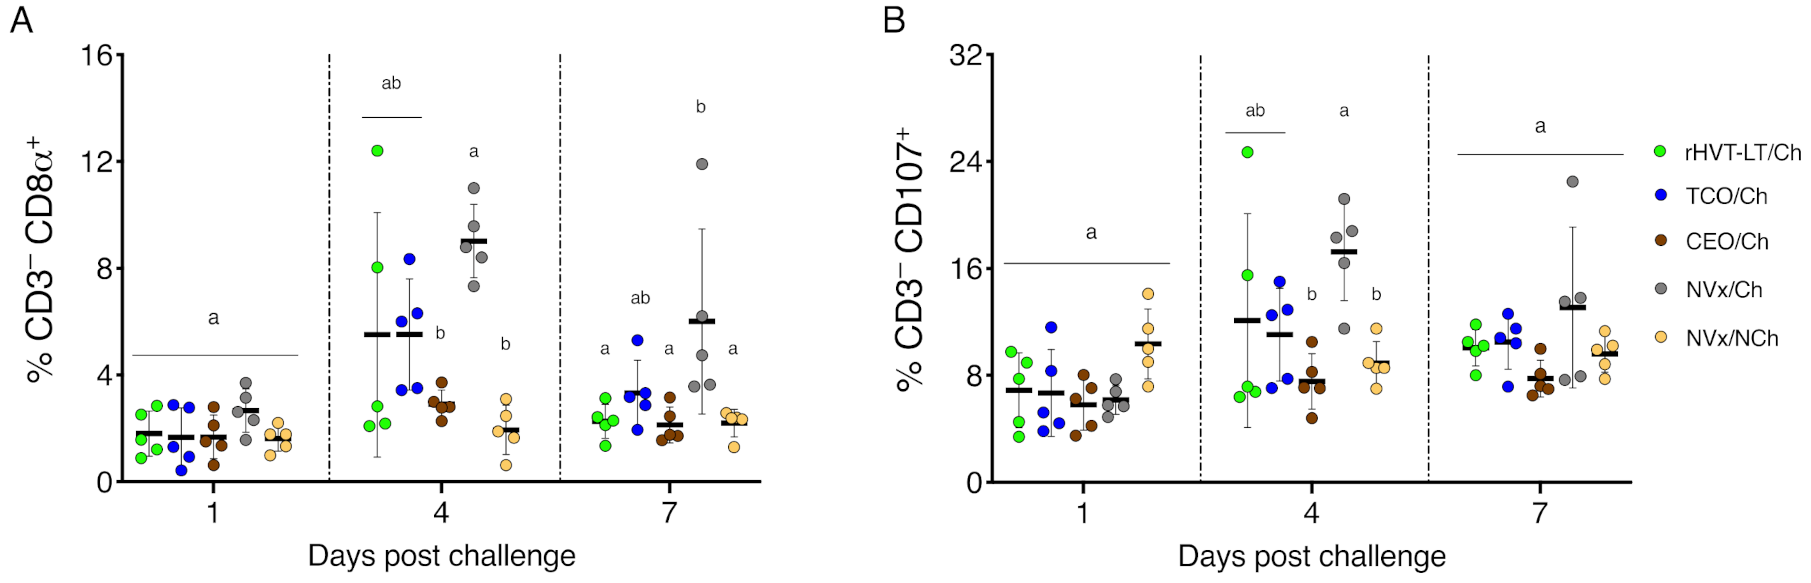
3.3. Late Increase of NK and Activated NK Cells in the Non-Vaccinated Challenged Group of Chickens
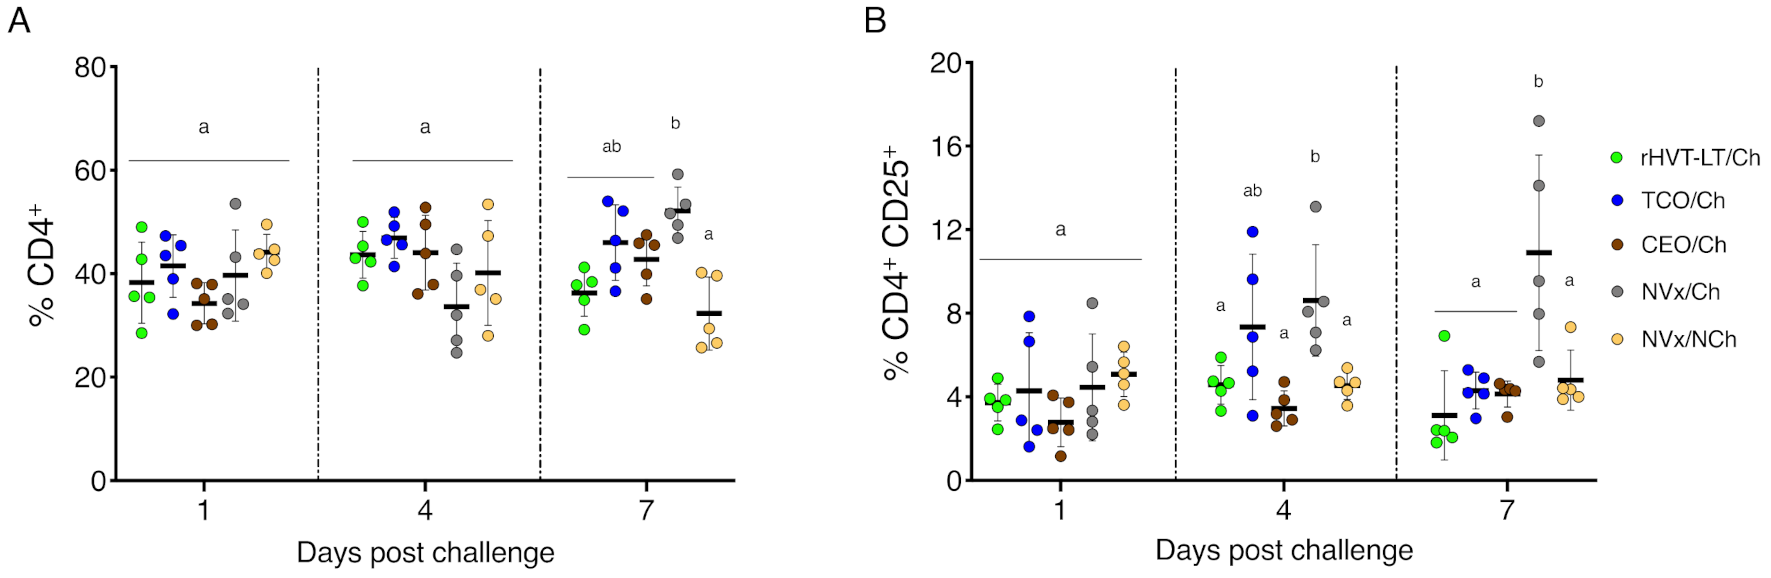
3.4. Increase of Tregs Populations Only Observed in the Non-Vaccinated Challenged Group of Chickens
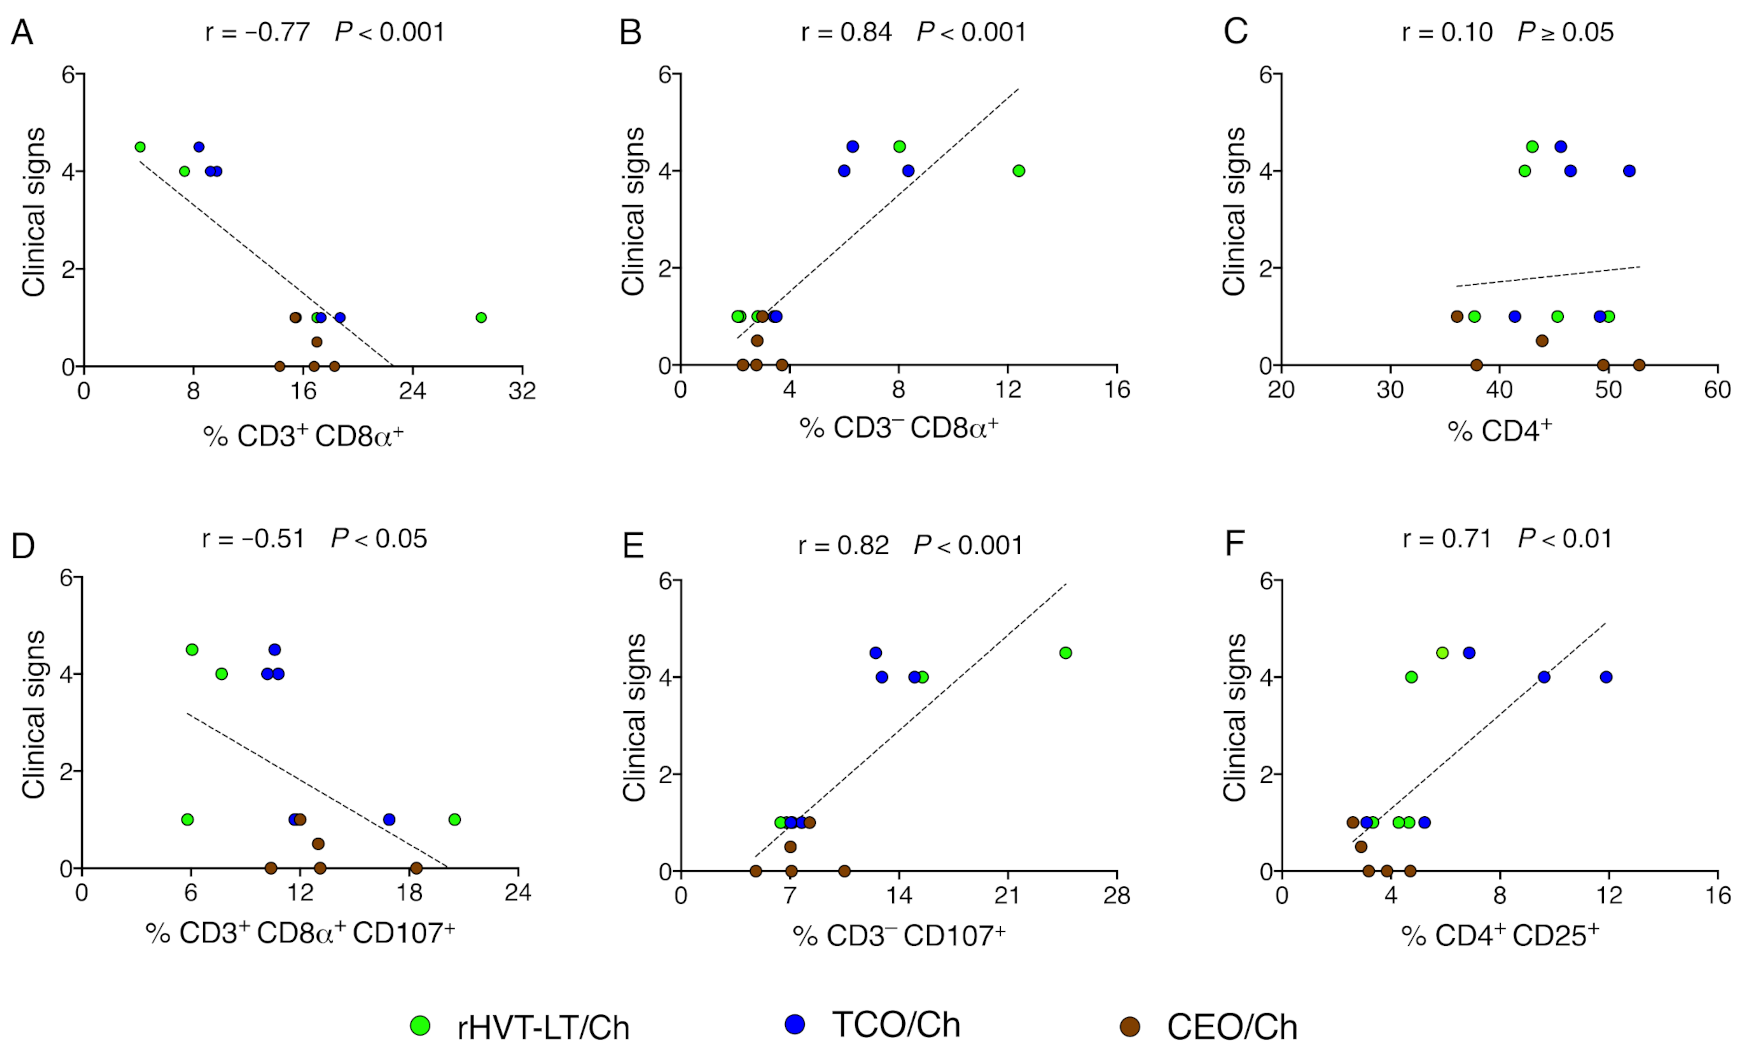
3.5. Reduction of Clinical Signs in Vaccinated Groups of Chickens Correlate with Increased Percent of CTLs
4. Discussion
5. Conclusions
Author Contributions
Funding
Institutional Review Board Statement
Informed Consent Statement
Data Availability Statement
Acknowledgments
Conflicts of Interest
References
- García, M.; Spatz, S. Infectious laryngotracheitis. In Diseases of Poultry, 14th ed.; Swayne, D.E., Boulianne, M., Logue, C.M., McDougald, L.R., Nair, V., Suarez, D.L., Eds.; Wiley-Blackwell: Hoboken, NJ, USA, 2020; pp. 189–209. [Google Scholar]
- Maekawa, D.; Riblet, S.M.; Newman, L.; Koopman, R.; Barbosa, T.; García, M. Evaluation of vaccination against infectious laryngotracheitis (ILT) with recombinant herpesvirus of turkey (rHVT-LT) and chicken embryo origin (CEO) vaccines applied alone or in combination. Avian Pathol. 2019, 48, 573–581. [Google Scholar] [CrossRef] [PubMed]
- Vagnozzi, A.; Zavala, G.; Riblet, S.M.; Mundt, A.; Garcia, M. Protection induced by commercially available live-attenuated and recombinant viral vector vaccines against infectious laryngotracheitis virus in broiler chickens. Avian Pathol. 2012, 41, 21–31. [Google Scholar] [CrossRef] [PubMed]
- Esaki, M.; Noland, L.; Eddins, T.; Godoy, A.; Saeki, S.; Saitoh, S.; Yasuda, A.; Moore, K. Safety and efficacy of a turkey herpesvirus vector laryngotracheitis vaccine for chickens. Avian Dis. 2013, 57, 192–198. [Google Scholar] [CrossRef]
- Guy, J.S.; Barnes, H.J.; Smith, L. Increased virulence of modified-live infectious laryngotracheitis vaccine virus following bird-to-bird passage. Avian Dis. 1991, 35, 348–355. [Google Scholar] [CrossRef] [PubMed]
- Rodríguez-Avila, A.; Oldoni, I.; Riblet, S.; García, M. Replication and transmission of live attenuated infectious laryngotracheitis virus (ILTV) vaccines. Avian Dis. 2007, 51, 905–911. [Google Scholar] [CrossRef] [PubMed]
- García, M.; Spatz, S.J.; Cheng, Y.; Riblet, S.M.; Volkening, J.D.; Schneiders, G.H. Attenuation and protection efficacy of ORF C gene-deleted recombinant of infectious laryngotracheitis virus. J. Gen. Virol. 2016, 97, 2352–2362. [Google Scholar] [CrossRef]
- Zavala, G. The old and new landscapes of infectious laryngotracheitis. Poult. Inf. Prof. 2011, 118, 1–7. [Google Scholar]
- Maekawa, D.; Beltrán, G.; Riblet, S.M.; García, M. Protection Efficacy of a recombinant herpesvirus of turkey vaccine against Infectious Laryngotracheitis virus administered in ovo to broilers at three standardized doses. Avian Dis. 2019, 6, 351–358. [Google Scholar] [CrossRef]
- Fahey, K.J.; Bagust, T.J.; York, J.J. Laryngotracheitis herpesvirus infection in the chicken: The role of humoral antibody in immunity to a graded challenge infection. Avian Pathol. 1983, 12, 505–514. [Google Scholar] [CrossRef] [PubMed]
- Fahey, K.J.; York, J.J.; Bagust, T.J. Laryngotracheitis herpesvirus infection in the chicken. II. The adoptive transfer of resistance with immune spleen cells. Avian Pathol. 1984, 13, 265–275. [Google Scholar] [CrossRef] [PubMed] [Green Version]
- Honda, T.; Okamura, H.; Taneno, A.; Yamada, S.; Takahashi, E. The role of cell-mediated immunity in chickens inoculated with the cell-associated vaccine of attenuated infectious laryngotracheitis virus. J. Vet. Med. Sci. 1994, 56, 1051–1055. [Google Scholar] [CrossRef] [PubMed] [Green Version]
- York, J.J.; Young, J.G.; Fahey, K.J. The appearance of viral antigen and antibody in the trachea of naïve and vaccinated chickens infected with infectious laryngotracheitis virus. Avian Pathol. 1989, 18, 643–658. [Google Scholar] [CrossRef] [PubMed]
- Coppo, M.J.; Hartley, C.A.; Devlin, J.M. Immune responses to infectious laryngotracheitis virus. Dev. Comp. Immunol. 2013, 41, 454–462. [Google Scholar] [CrossRef] [PubMed]
- Seo, S.H.; Collisson, E.W. Specific cytotoxic T lymphocytes are involved in in vivo clearance of infectious bronchitis virus. J. Virol. 1997, 1, 5173–5177. [Google Scholar] [CrossRef] [Green Version]
- Bertzbach, L.D.; van Haarlem, D.A.; Härtle, S.; Kaufer, B.B.; Jansen, C.A. Marek’s Disease virus infection of natural killer cells. Microorganisms 2019, 7, 588. [Google Scholar] [CrossRef] [Green Version]
- Umthong, S.; Dunn, J.R.; Cheng, H.H. Depletion of CD8αβ + T cells in chickens demonstrates their involvement in protective immunity towards Marek’s Disease with respect to tumor incidence and vaccinal protection. Vaccines 2020, 24, 557. [Google Scholar] [CrossRef]
- Yang, Y.; Dong, M.; Hao, X.; Qin, A.; Shang, S. Revisiting cellular immune response to oncogenic Marek’s disease virus: The rising of avian T-cell immunity. Cell. Mol. Life Sci. 2020, 77, 3103–3116. [Google Scholar] [CrossRef] [PubMed] [Green Version]
- Jansen, C.A.; de Geus, E.D.; van Haarlem, D.A.; van de Haar, P.M.; Löndt, B.Z.; Graham, S.P.; Göbel, T.W.; van Eden, W.; Brookes, S.M.; Vervelde, L. Differential lung NK cell responses in avian influenza virus infected chickens correlate with pathogenicity. Sci. Rep. 2013, 3, 2478. [Google Scholar] [CrossRef]
- Seo, S.H.; Peiris, M.; Webster, R.G. Protective cross-reactive cellular immunity to lethal A/Goose/Guangdong/1/96-like H5N1 influenza virus is correlated with the proportion of pulmonary CD8(+) T cells expressing gamma interferon. J. Virol. 2002, 76, 4886–4890. [Google Scholar] [CrossRef] [Green Version]
- Uzhachenko, R.V.; Shanker, A. CD8(+) T Lymphocyte and NK cell network: Circuitry in the cytotoxic domain of immunity. Front. Immunol. 2019, 10, 1906. [Google Scholar] [CrossRef] [PubMed] [Green Version]
- Lanier, L.L. NK cell recognition. Annu. Rev. Immunol. 2005, 23, 225–274. [Google Scholar] [CrossRef] [PubMed]
- Van Dommelen, S.L.; Sumaria, N.; Schreiber, R.D.; Scalzo, A.A.; Smyth, M.J.; Degli-Esposti, M.A. Perforin and granzymes have distinct roles in defensive immunity and immunopathology. Immunity 2006, 25, 835–848. [Google Scholar] [CrossRef] [PubMed] [Green Version]
- Göbel, T.W.; Chen, C.L.; Shrimpf, J.; Grossi, C.E.; Bernot, A.; Bucy, R.P.; Auffray, C.; Cooper, M.D. Characterization of avian natural killer cells and their intracellular CD3 protein complex. Eur. J. Immunol. 1994, 24, 1685–1691. [Google Scholar] [CrossRef] [PubMed] [Green Version]
- Jansen, C.A.; van de Haar, P.M.; van Haarlem, D.; van Kooten, P.; de Wit, S.; van Eden, W.; Viertlböck, B.C.; Göbel, T.W.; Vervelde, L. Identification of new populations of chicken natural killer (NK) cells. Dev. Comp. Immunol. 2010, 34, 759–767. [Google Scholar] [CrossRef] [Green Version]
- Tregaskes, C.A.; Kong, F.K.; Paramithiotis, E.; Chen, C.L.; Ratcliffe, M.J.; Davison, T.F.; Young, J.R. Identification and analysis of the expression of CD8 alpha beta and CD8 alpha alpha isoforms in chickens reveals a major TCR-gamma delta CD8 alpha beta subset of intestinal intraepithelial lymphocytes. J. Immunol. 1995, 15, 4485–4494. [Google Scholar]
- Betts, M.R.; Koup, R.A. Detection of T-cell degranulation: CD107a and b. Methods Cell. Biol. 2004, 75, 497–512. [Google Scholar]
- Vervelde, L.; Matthijs, M.G.; van Haarlem, D.A.; de Wit, J.J.; Jansen, C.A. Rapid NK-cell activation in chicken after infection with infectious bronchitis virus M41. Vet. Immunol. Immunopathol. 2013, 151, 337–341. [Google Scholar] [CrossRef]
- Wattrang, E.; Dalgaard, T.S.; Norup, L.R.; Kjærup, R.B.; Lundén, A.; Juul-Madsen, H.R. CD107a as a marker of activation in chicken cytotoxic T cells. J. Immunol. Methods. 2015, 419, 35–47. [Google Scholar] [CrossRef]
- Luckheeram, R.V.; Zhou, R.; Verma, A.D.; Xia, B. CD4⁺T cells: Differentiation and functions. Clin. Dev. Immunol. 2012, 2012, 925135. [Google Scholar] [CrossRef] [PubMed] [Green Version]
- Luhtala, M. Chicken CD4, CD8alphabeta, and CD8alphaalpha T cell co-receptor molecules. Poult. Sci. 1998, 77, 1858–1873. [Google Scholar] [CrossRef]
- Selvaraj, R.K. Avian CD4(+)CD25(+) regulatory T cells: Properties and therapeutic applications. Dev. Comp. Immunol. 2013, 41, 397–402. [Google Scholar] [CrossRef] [PubMed]
- Shanmugasundaram, R.; Selvaraj, R.K. Regulatory T cell properties of chicken CD4+CD25+ cells. J. Immunol. 2011, 186, 1997–2002. [Google Scholar] [CrossRef] [Green Version]
- Gurung, A.; Kamble, N.; Kaufer, B.B.; Pathan, A.; Behboudi, S. Association of Marek’s Disease induced immunosuppression with activation of a novel regulatory T-cells in chickens. PLoS Pathog. 2017, 13, e1006745. [Google Scholar] [CrossRef] [PubMed] [Green Version]
- Veiga-Parga, T.; Sehrawat, S.; Rouse, B.T. Role of regulatory T-cells during virus infection. Immunol. Rev. 2013, 255, 182–196. [Google Scholar] [CrossRef]
- Sharma, A.; Rudra, D. Emerging Functions of Regulatory T Cells in Tissue Homeostasis. Front. Immunol. 2018, 9, 883. [Google Scholar] [CrossRef]
- Reed, L.J.; Muench, H. A simple method of estimating fifty percent endpoints. Am. J. Epidemiol. 1938, 27, 493–497. [Google Scholar] [CrossRef]
- Oldoni, I.; Rodríguez-Avila, A.; Riblet, S.M.; Zavala, G.; García, M. Pathogenicity and growth characteristics of selected infectious laryngotracheitis virus strains from the United States. Avian Pathol. 2009, 38, 47–53. [Google Scholar] [CrossRef] [PubMed]
- Rodríguez-Avila, A.; Oldoni, I.; Riblet, S.; Garcia, M. Evaluation of the protection elicited by direct and indirect exposure to live attenuated infectious laryngotracheitis virus vaccines against a recent challenge strain from the United States. Avian Pathol. 2008, 37, 287–292. [Google Scholar] [CrossRef] [PubMed]
- Williams, C.J.; Hopkins, B.A. Field evaluation of the accuracy of vaccine deposition by two different available in ovo injection systems. Poult. Sci. 2011, 90, 223–226. [Google Scholar] [CrossRef] [PubMed]
- Livak, K.J.; Schmittgen, T.D. Analysis of relative gene expression data using real-time quantitative PCR and the 2(-Delta Delta C(T)) Method. Methods 2001, 25, 402–408. [Google Scholar] [CrossRef]
- Guy, J.S.; Barnes, H.J.; Morgan, L.M. Virulence of infectious laryngotracheitis viruses: Comparison of modified-live vaccine viruses and North Carolina field isolates. Avian Dis. 1990, 34, 106–113. [Google Scholar] [CrossRef]
- Kaech, S.M.; Wherry, E.J.; Ahmed, R. Effector and memory T-cell differentiation: Implications for vaccine development. Nat. Rev. Immunol. 2002, 2, 251–262. [Google Scholar] [CrossRef]
- Maekawa, D.; Whang, P.; Riblet, S.M.; Hurley, D.; García, M. Assessing the infiltration of T lymphocytes and macrophages in the upper trachea of non-vaccinated and vaccinated chickens after an Infectious laryngotracheitis virus (ILTV) challenge. Avian Pathol. 2021, submitted. [Google Scholar]
- Schenkel, J.M.; Masopust, D. Tissue-resident memory T-cells. Immunity 2014, 41, 886–897. [Google Scholar] [CrossRef] [Green Version]
- Gimeno, I.M.; Cortes, A.L.; Guy, J.S.; Turpin, E.; Williams, C. Replication of recombinant herpesvirus of turkey expressing genes of infectious laryngotracheitis virus in specific pathogen free and broiler chickens following in ovo and subcutaneous vaccination. Avian Pathol. 2011, 40, 395–403. [Google Scholar] [CrossRef] [PubMed] [Green Version]
- Calnek, B.W.; Shek, W.R.; Schat, K.A. Latent infections with Marek’s disease virus and turkey herpesvirus. J. Natl. Cancer. Inst. 1981, 66, 585–590. [Google Scholar]
- Fabricant, J.; Calnek, B.W.; Schat, K.A. The early pathogenesis of turkey herpesvirus infection in chickens and turkeys. Avian Dis. 1982, 26, 257–264. [Google Scholar] [CrossRef] [PubMed]
- Hirai, K.; Ikuta, K.; Kitamoto, N.; Kato, S. Latency of herpesvirus of turkey and Marek’s disease virus genomes in a chicken T-lymphoblastoid cell line. J. Gen. Virol. 1981, 53, 133–143. [Google Scholar] [CrossRef]
- Koyanagi, N.; Kawaguchi, Y. Evasion of the cell-mediated immune response by Alphaherpesviruses. Viruses 2020, 12, 1354. [Google Scholar] [CrossRef]
- Kim, T.; Hunt, H.D.; Parcells, M.S.; van Santen, V.; Ewald, S.J. Two class I genes of the chicken MHC have different functions: BF1 is recognized by NK cells while BF2 is recognized by CTLs. Immunogenetics 2018, 70, 599–611. [Google Scholar] [CrossRef] [PubMed]
- Hao, X.; Li, S.; Li, J.; Yang, Y.; Qin, A.; Shang, S. An anti-tumor vaccine against Marek’s Disease virus induces differential activation and memory response of γδ T cells and CD8 T cells in chickens. Front. Immunol. 2021, 12, 645426. [Google Scholar] [CrossRef]


Publisher’s Note: MDPI stays neutral with regard to jurisdictional claims in published maps and institutional affiliations. |
© 2021 by the authors. Licensee MDPI, Basel, Switzerland. This article is an open access article distributed under the terms and conditions of the Creative Commons Attribution (CC BY) license (https://creativecommons.org/licenses/by/4.0/).
Share and Cite
Maekawa, D.; Riblet, S.M.; Whang, P.; Hurley, D.J.; Garcia, M. Activation of Cytotoxic Lymphocytes and Presence of Regulatory T Cells in the Trachea of Non-Vaccinated and Vaccinated Chickens as a Recall to an Infectious Laryngotracheitis Virus (ILTV) Challenge. Vaccines 2021, 9, 865. https://0-doi-org.brum.beds.ac.uk/10.3390/vaccines9080865
Maekawa D, Riblet SM, Whang P, Hurley DJ, Garcia M. Activation of Cytotoxic Lymphocytes and Presence of Regulatory T Cells in the Trachea of Non-Vaccinated and Vaccinated Chickens as a Recall to an Infectious Laryngotracheitis Virus (ILTV) Challenge. Vaccines. 2021; 9(8):865. https://0-doi-org.brum.beds.ac.uk/10.3390/vaccines9080865
Chicago/Turabian StyleMaekawa, Daniel, Sylva M. Riblet, Patrick Whang, David J. Hurley, and Maricarmen Garcia. 2021. "Activation of Cytotoxic Lymphocytes and Presence of Regulatory T Cells in the Trachea of Non-Vaccinated and Vaccinated Chickens as a Recall to an Infectious Laryngotracheitis Virus (ILTV) Challenge" Vaccines 9, no. 8: 865. https://0-doi-org.brum.beds.ac.uk/10.3390/vaccines9080865