
The Administration of Hyaluronic Acid into the Temporomandibular Joints’ Cavities Increases the Mandible’s Mobility: A Systematic Review and Meta-Analysis

 ,
,  ,
,
Abstract
:1. Introduction
1.1. Rationale
1.2. Objectives
2. Methods
2.1. Eligibility Criteria
2.2. Information Sources
2.3. Search Strategy
2.4. Selection Process
2.5. Data Collection Process
2.6. Data Items
2.7. Study Risk of Bias Assessment
2.8. Effect Measures
2.9. Synthesis Methods
2.9.1. Efficiency Evaluation
2.9.2. Regression Analysis
2.9.3. Correlation Analysis
2.10. Researchers’ Experience
3. Results
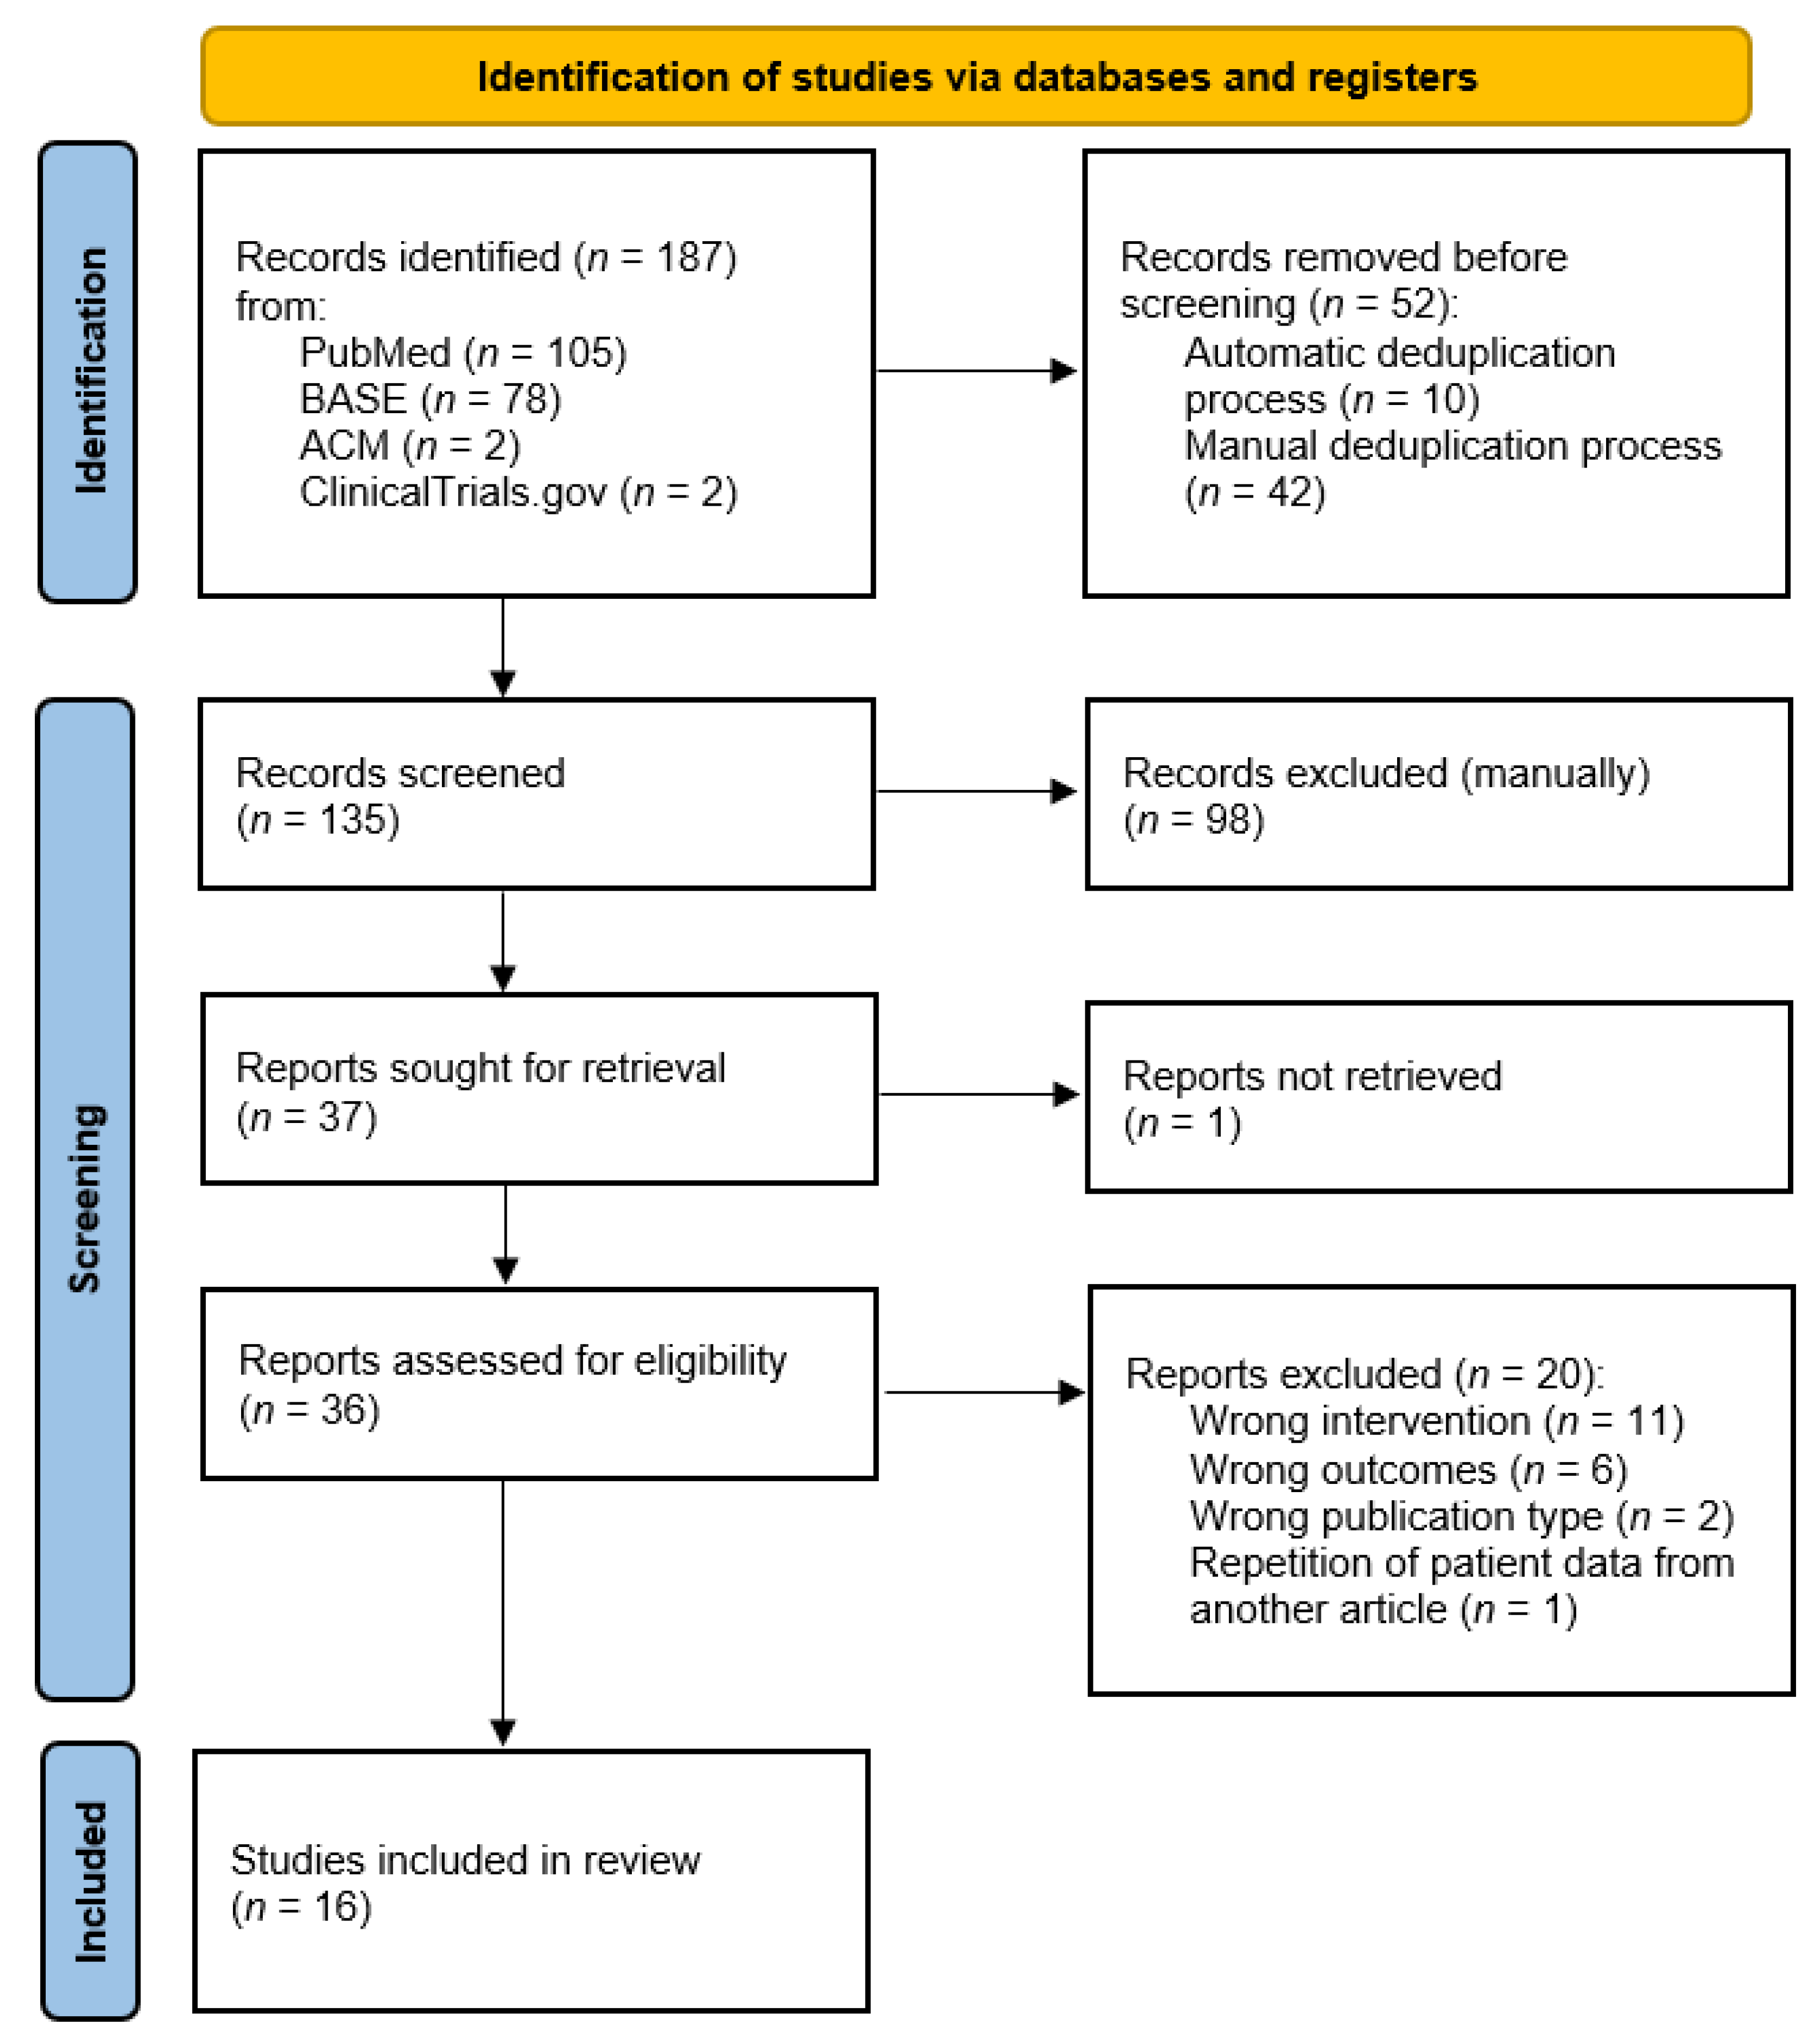
3.1. Study Selection
3.2. Study Characteristics
3.3. Risk of Bias in Studies
3.4. Results of Individual Studies
3.5. Results of Syntheses
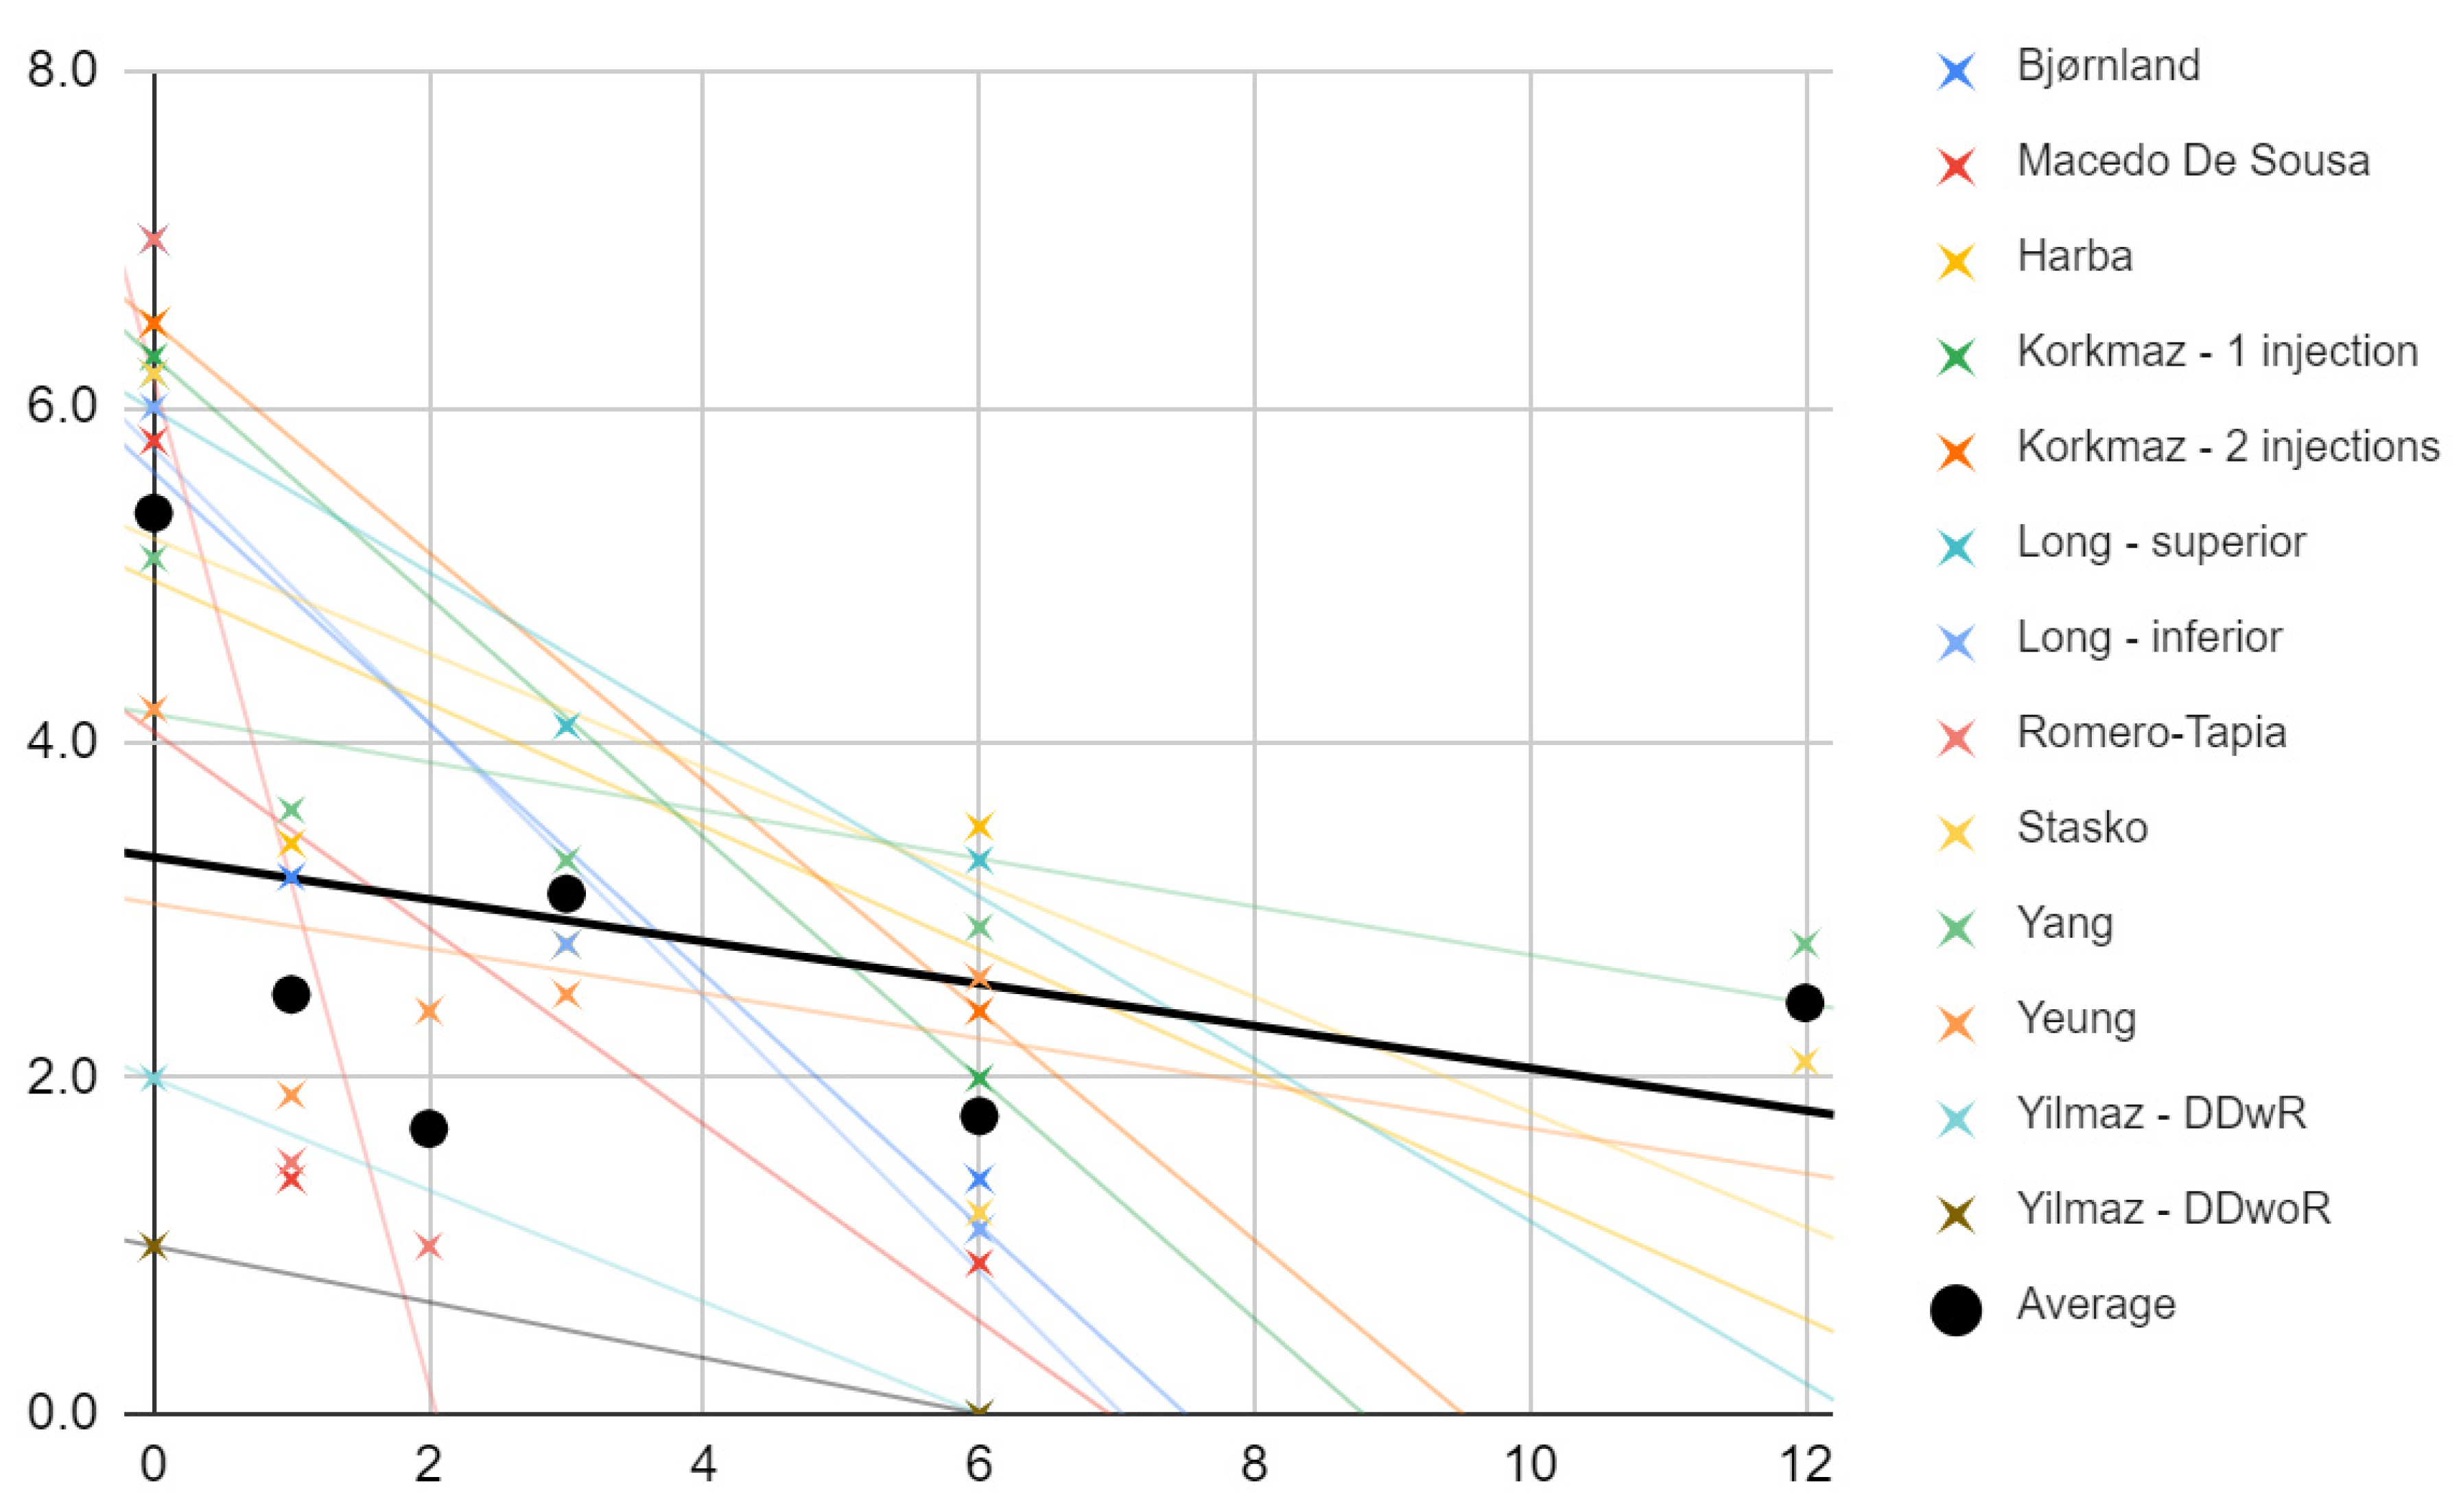
3.5.1. Pain
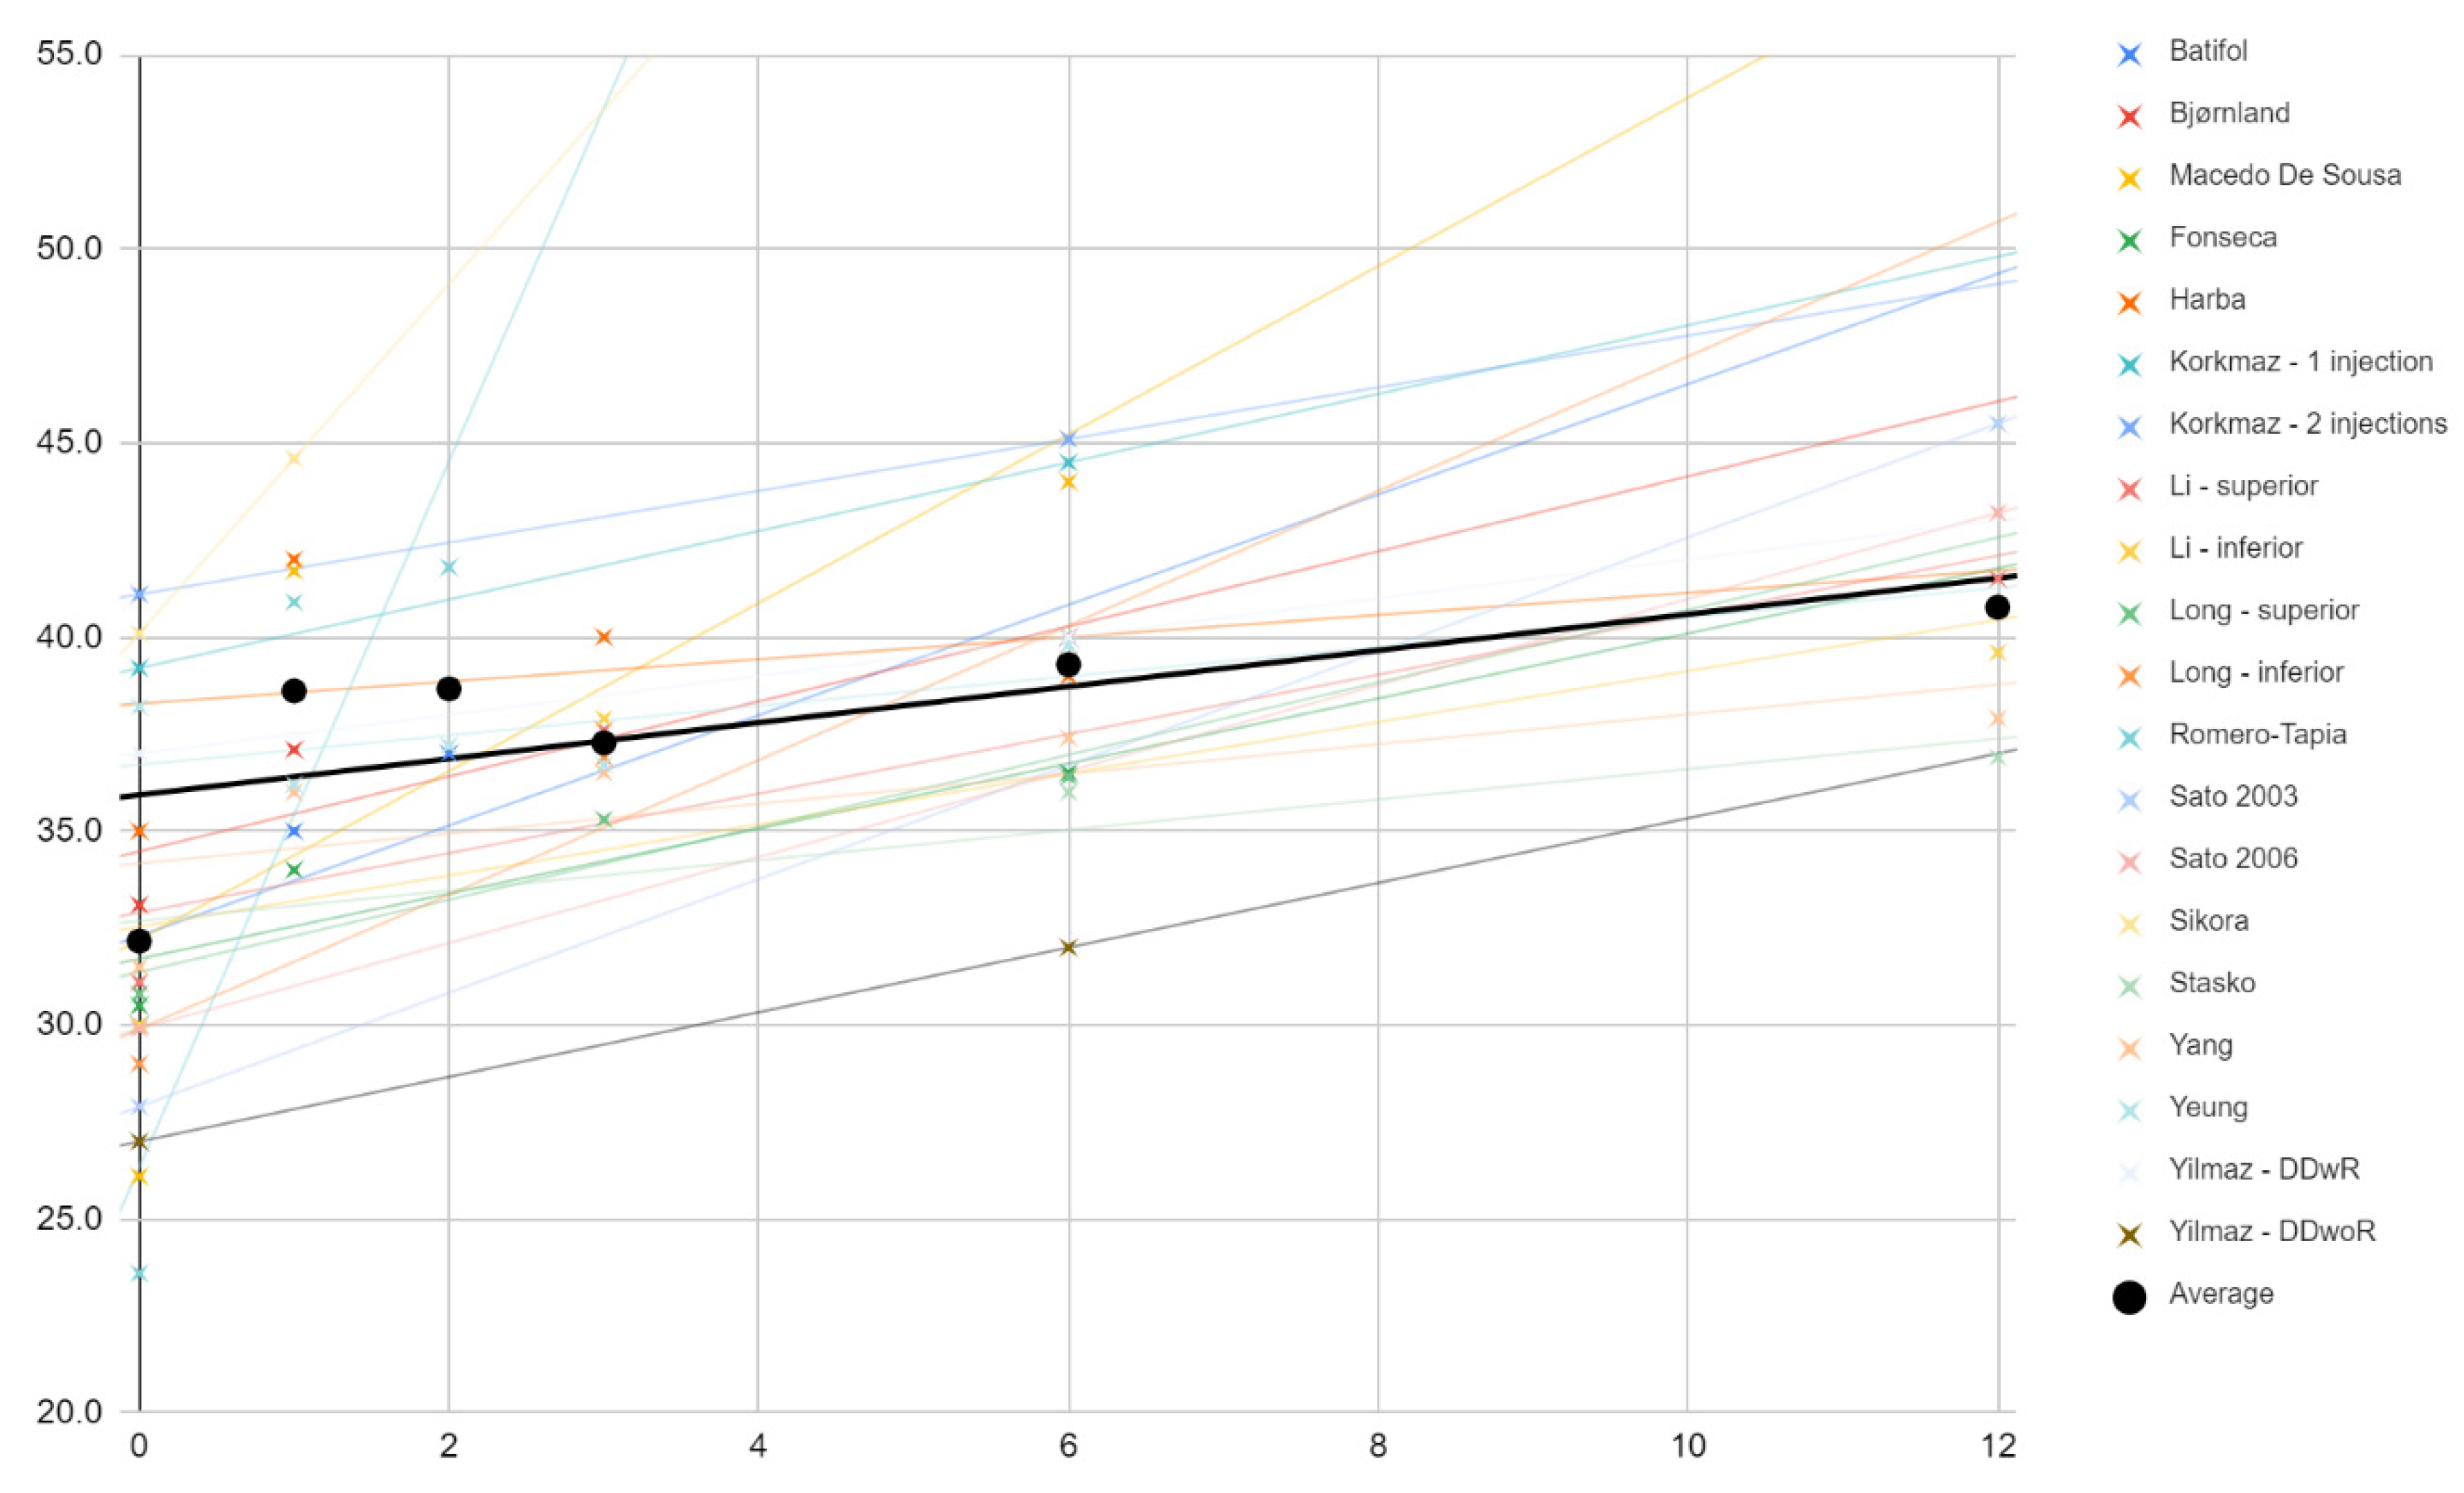
3.5.2. Abduction
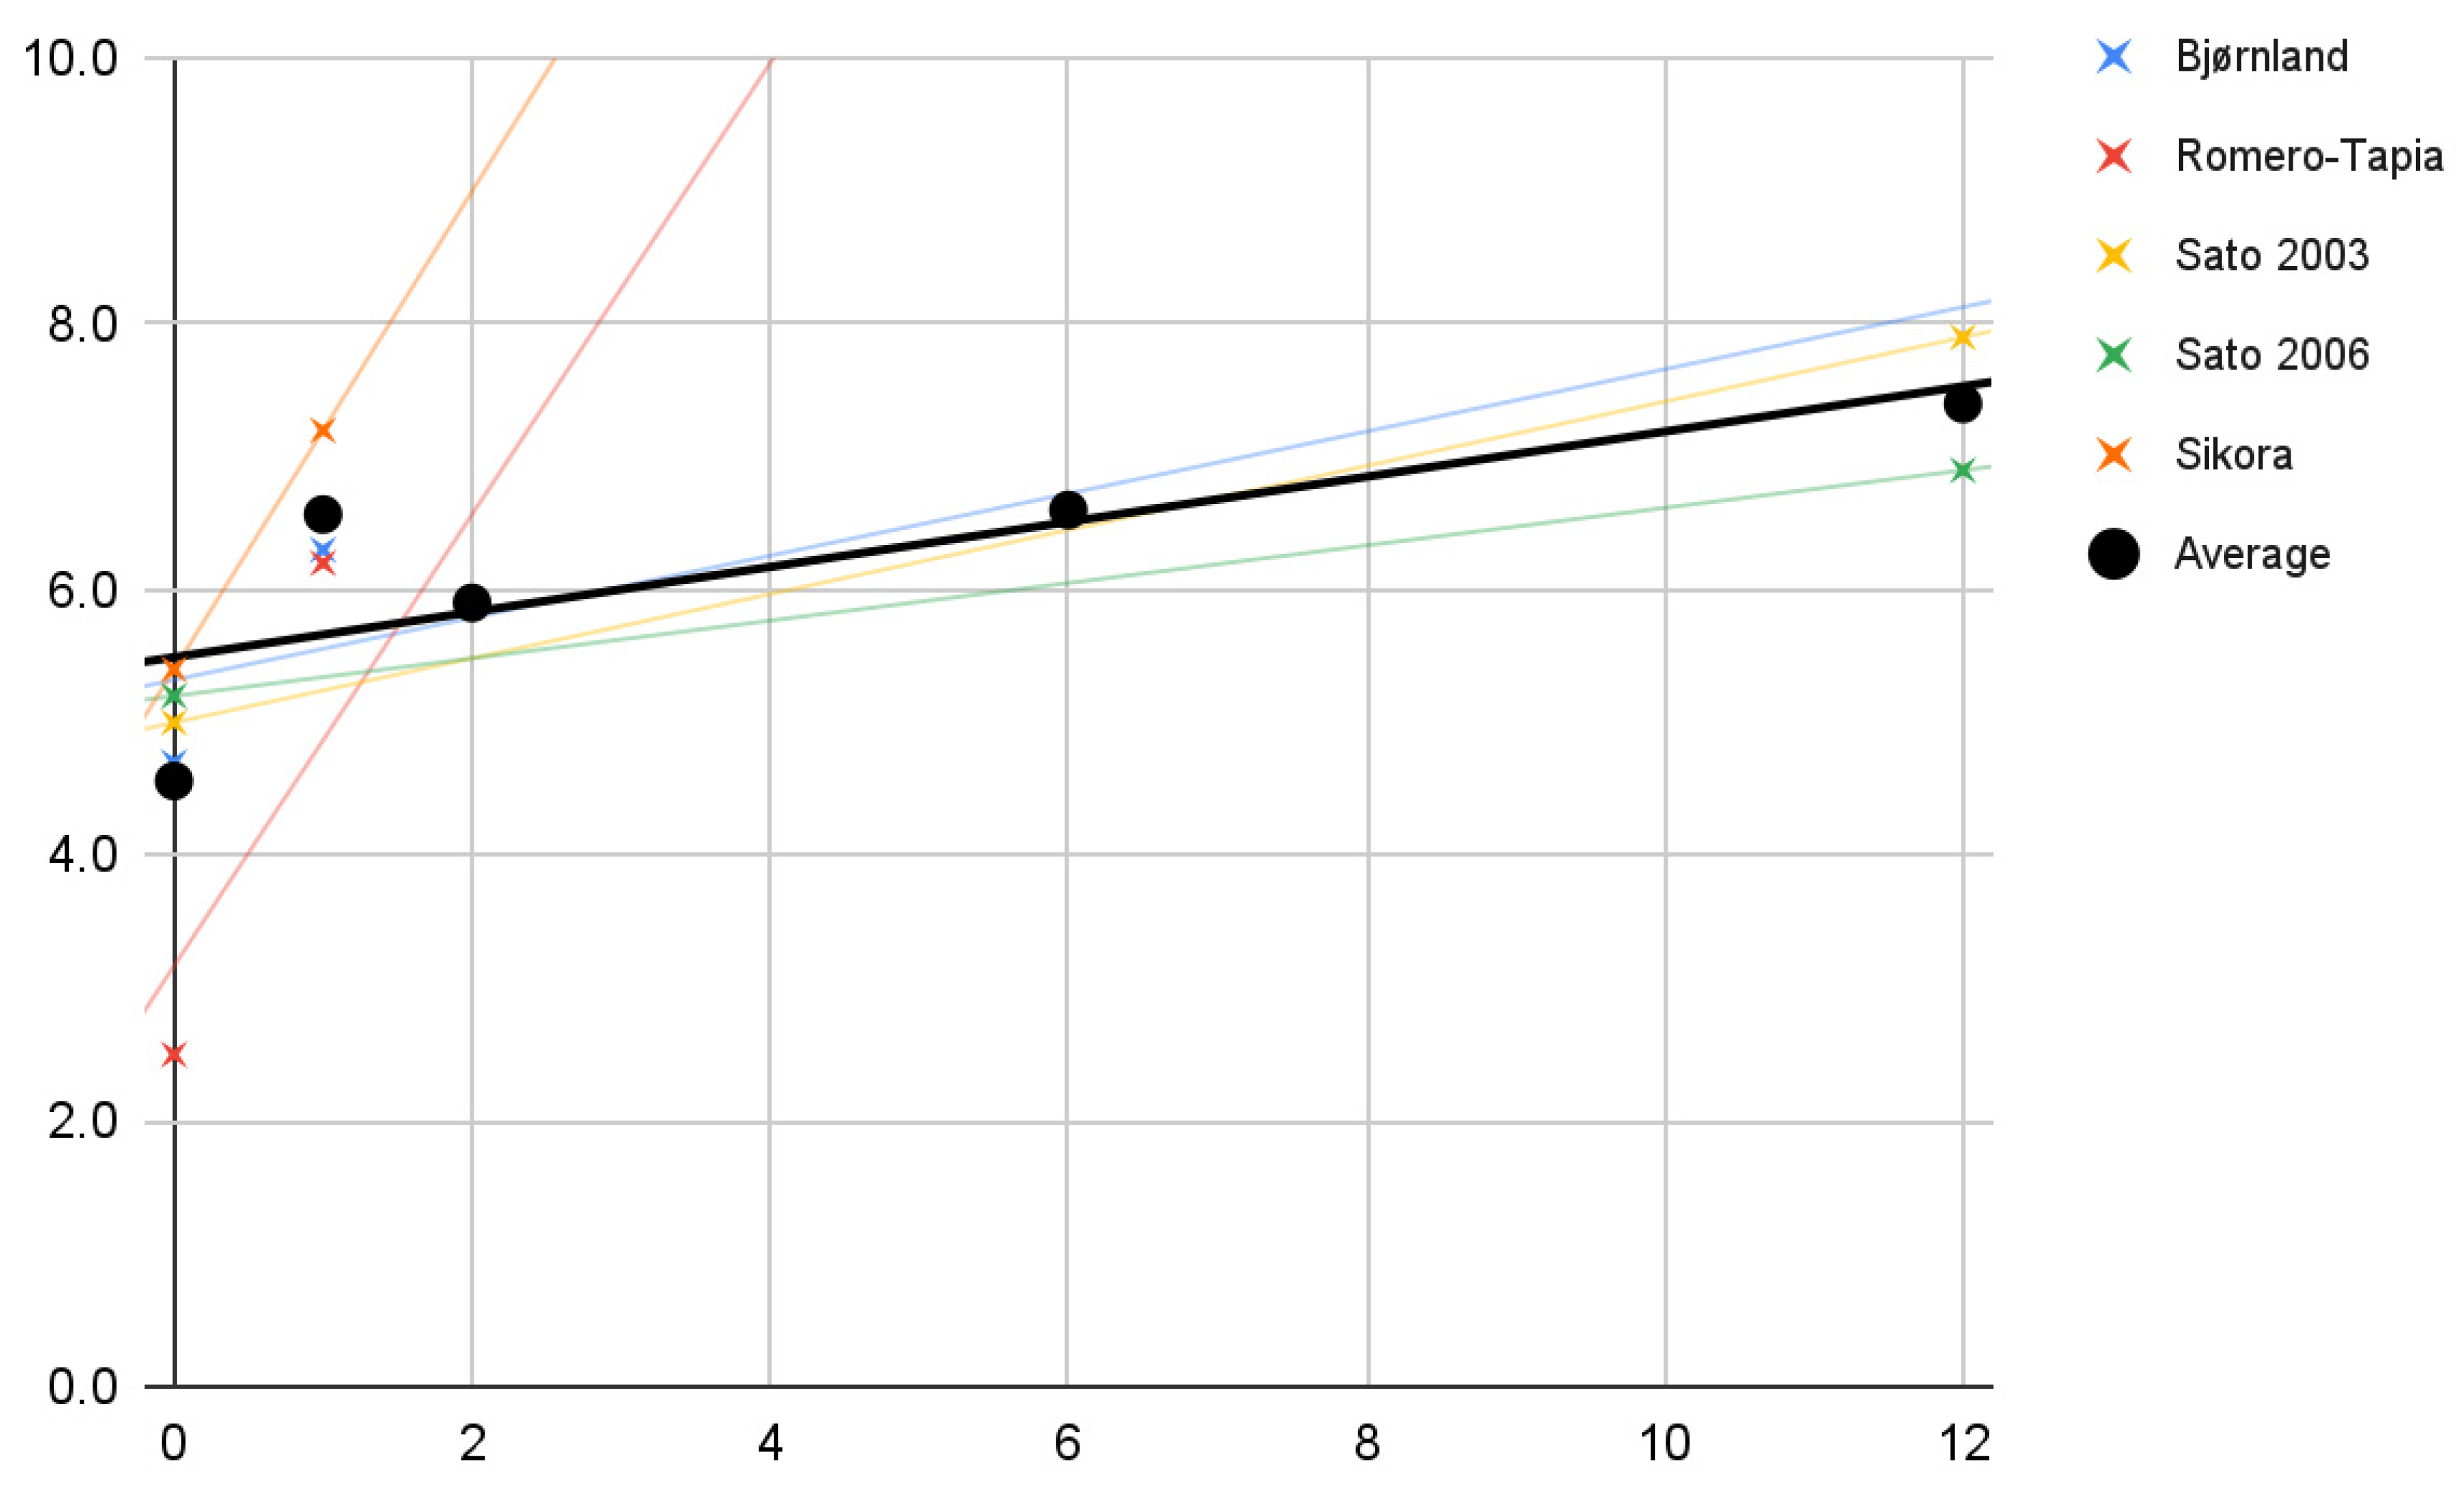
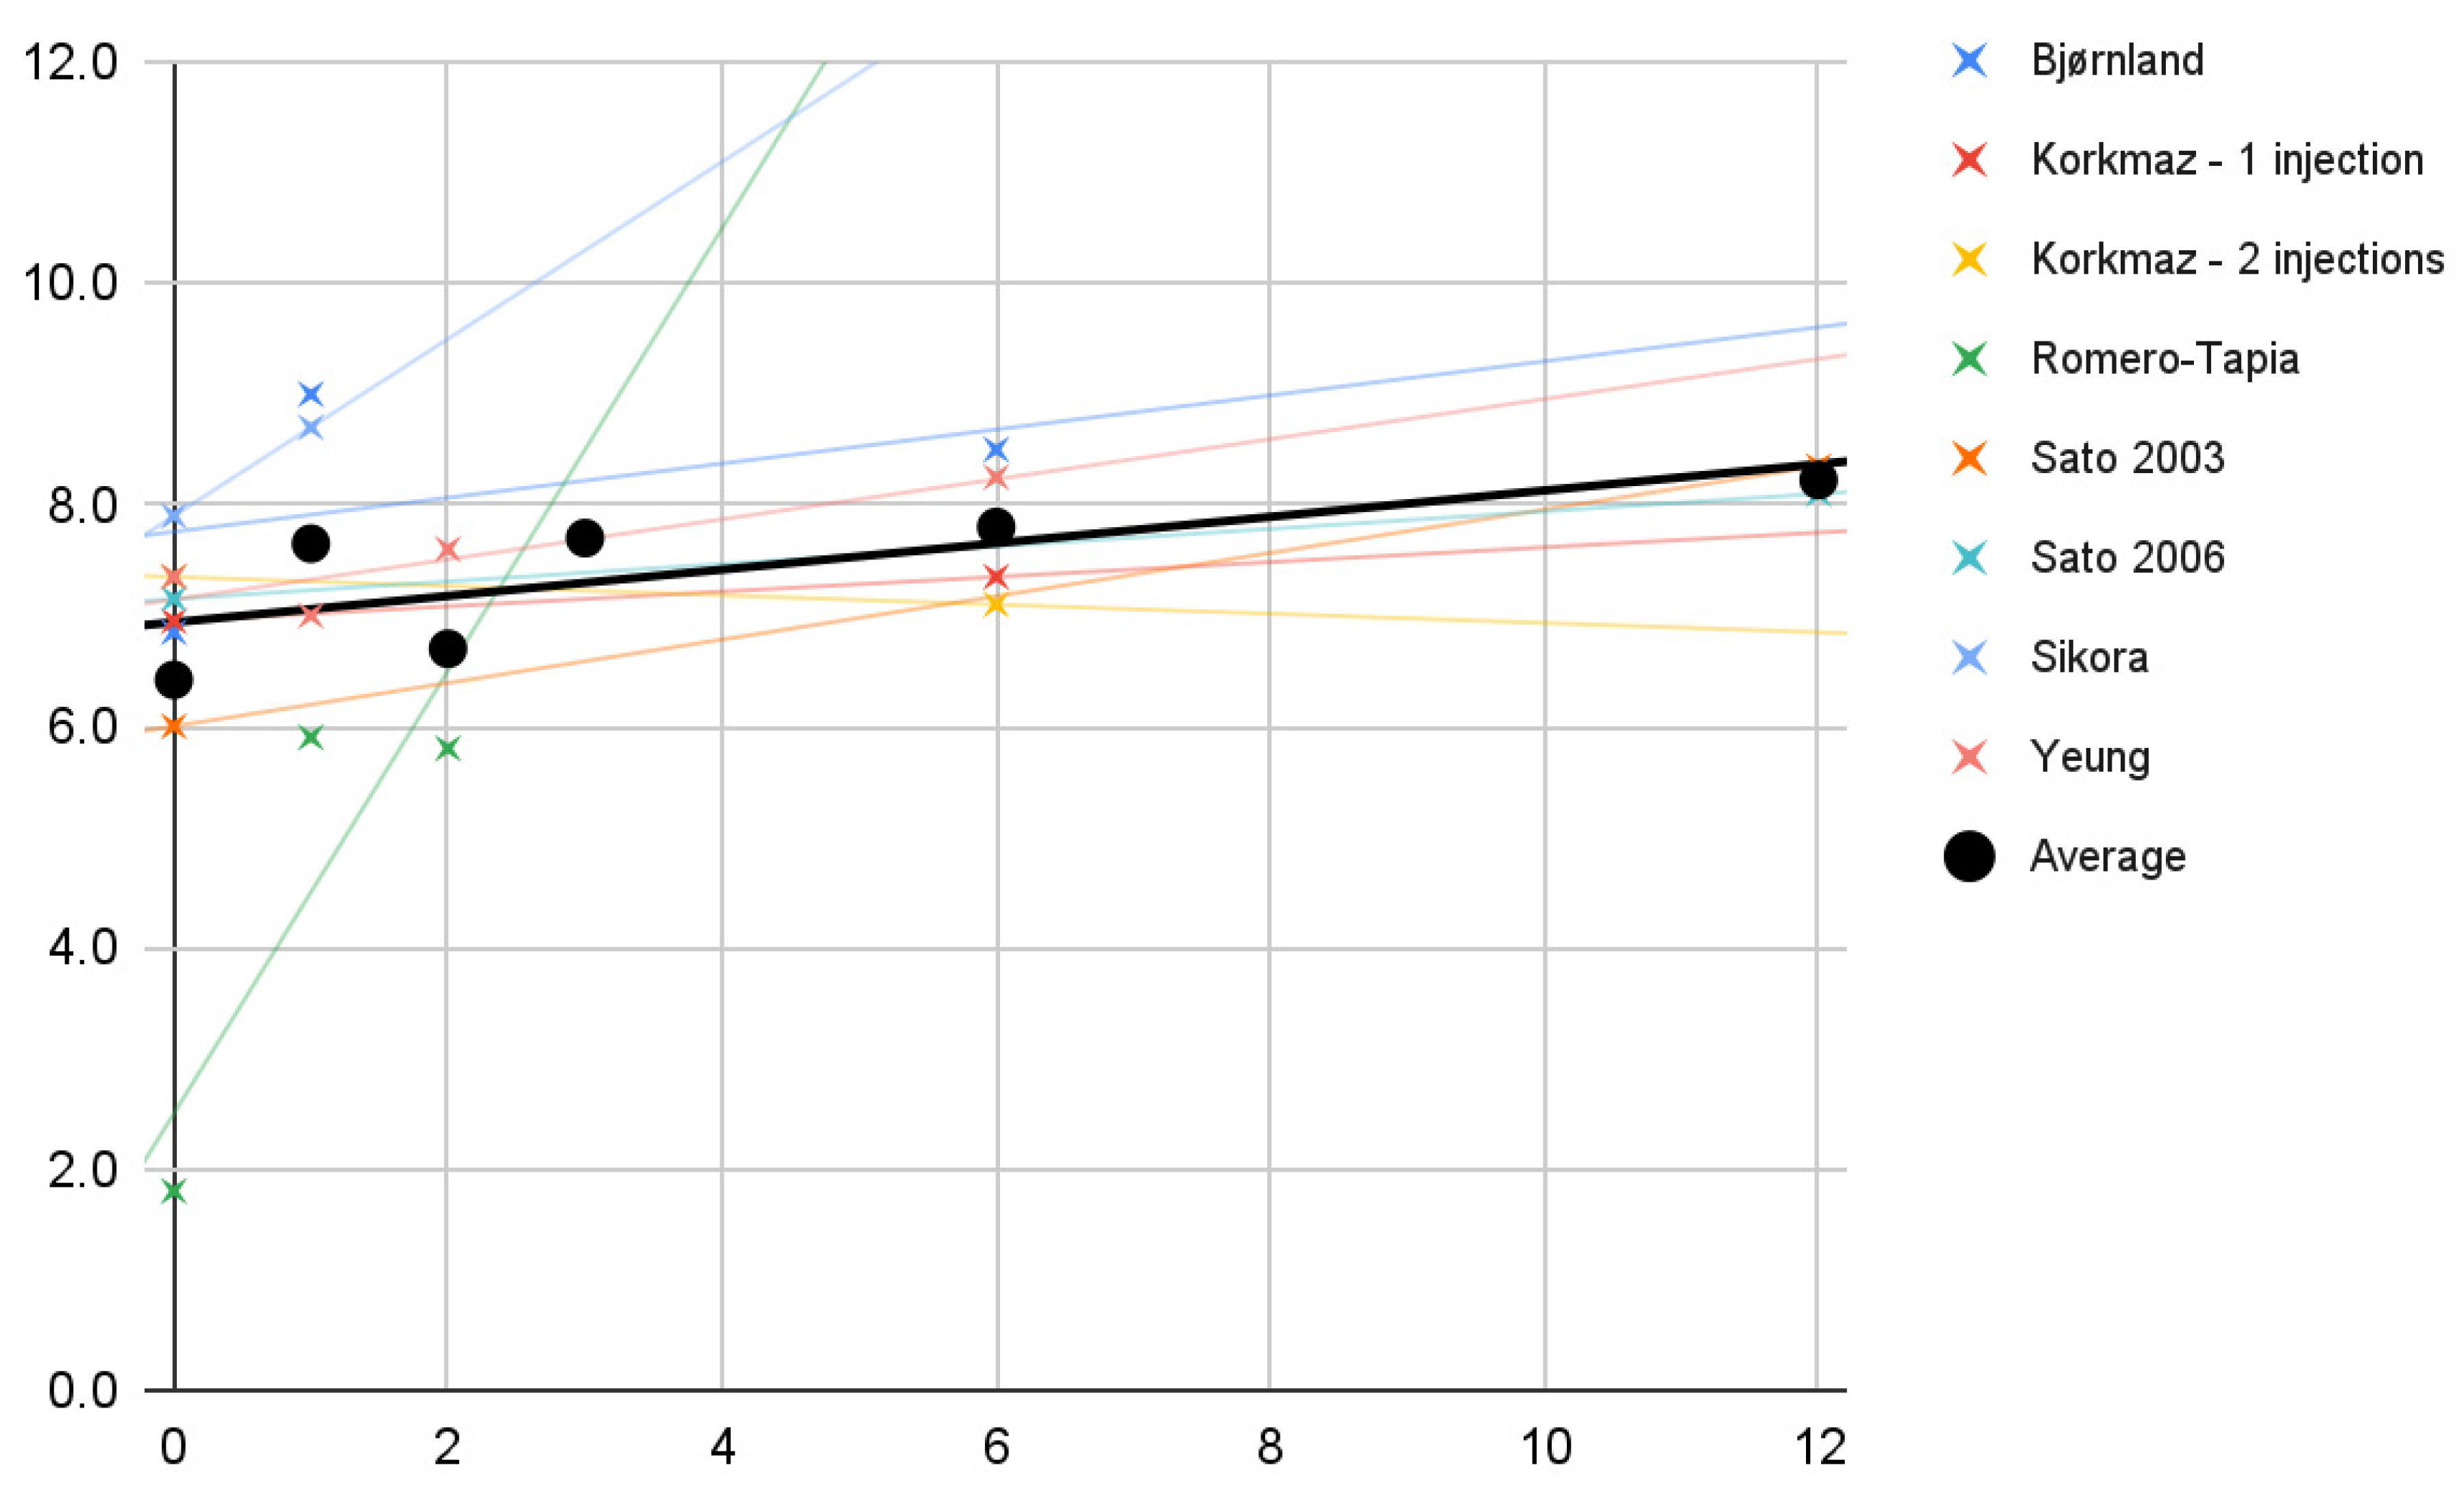
3.5.3. Protrusive Movement
3.5.4. Lateral Movements
3.6. Correlations
3.6.1. Pain
3.6.2. Abduction
3.7. Possible Causes of Heterogeneity
4. Discussion
4.1. HA vs. Stabilization Splint
4.2. HA vs. Arthrocentesis
4.3. HA vs. Blood Products
4.4. HA vs. Steroids
4.5. Limitations of the Evidence
4.5.1. Patient Description
4.5.2. Intervention Description
4.5.3. Comparators Description
4.5.4. Outcomes Description
4.6. Limitations of the Review Processes
4.6.1. Settings
4.6.2. Information Sources
5. Conclusions
Supplementary Materials
Author Contributions
Funding
Institutional Review Board Statement
Informed Consent Statement
Data Availability Statement
Acknowledgments
Conflicts of Interest
References
- International Classification of Orofacial Pain, 1st edition (ICOP). Cephalalgia 2020, 40, 129–221. [CrossRef] [PubMed] [Green Version]
- Schiffman, E.; Ohrbach, R.; Truelove, E.; Look, J.; Anderson, G.; Goulet, J.P.; List, T.; Svensson, P.; Gonzalez, Y.; Lobbezoo, F.; et al. Diagnostic Criteria for Temporomandibular Disorders (DC/TMD) for Clinical and Research Applications: Recommendations of the International RDC/TMD Consortium Network* and Orofacial Pain Special Interest Group†. J. Oral Facial Pain Headache 2014, 28, 6–27. [Google Scholar] [CrossRef] [PubMed]
- Sikora, M.; Czerwińska-Niezabitowska, B.; Chęciński, M.A.; Sielski, M.; Chlubek, D. Short-Term Effects of Intra-Articular Hyaluronic Acid Administration in Patients with Temporomandibular Joint Disorders. J. Clin. Med. 2020, 9, 1749. [Google Scholar] [CrossRef] [PubMed]
- Macedo De Sousa, B.M.; López-Valverde, N.; López-Valverde, A.; Caramelo, F.; Fraile, J.F.; Payo, J.H.; Rodrigues, M.J. Different Treatments in Patients with Temporomandibular Joint Disorders: A Comparative Randomized Study. Medicina 2020, 56, 113. [Google Scholar] [CrossRef] [PubMed] [Green Version]
- Kałużyński, K.; Trybek, G.; Smektała, T.; Masiuk, M.; Myśliwiec, L.; Sporniak-Tutak, K. Effect of methylprednisolone, hyaluronic acid and pioglitazone on histological remodeling of temporomandibular joint cartilage in rabbits affected by drug-induced osteoarthritis. Postepy Hig. Med. Dosw. 2016, 70, 74–79. [Google Scholar] [CrossRef] [PubMed]
- Gülses, A.; Flörke, C.; Wieker, H.; Wiltfang, J. A technical note on establishment of a high hydraulic outflow in arthrocentesis of the temporomandibular joint. Cranio 2021, 39, 549–551. [Google Scholar] [CrossRef] [PubMed]
- Gulses, A.; Bayar, G.R.; Aydintug, Y.S.; Sencimen, M.; Erdogan, E.; Agaoglu, R. Histological evaluation of the changes in temporomandibular joint capsule and retrodiscal ligaments following autologous blood injection. J. Craniomaxillofac. Surg. 2013, 41, 316–320. [Google Scholar] [CrossRef]
- Chiappelli, F.; Kasar, V.R.; Balenton, N.; Khakshooy, A. Quantitative Consensus in Systematic Reviews: Current and Future Challenges in Translational Science. Bioinformation 2018, 14, 86–92. [Google Scholar] [CrossRef] [Green Version]
- Gusenbauer, M.; Haddaway, N.R. Which academic search systems are suitable for systematic reviews or meta-analyses? Evaluating retrieval qualities of Google Scholar, PubMed, and 26 other resources. Res. Synth. Methods 2020, 11, 181–217. [Google Scholar] [CrossRef] [Green Version]
- Acm.org. About ACM DL. 2021. Available online: https://0-dl-acm-org.brum.beds.ac.uk/about (accessed on 31 December 2021).
- BASE—Bielefeld Academic Search Engine. What Is BASE? 2021. Available online: https://www.base-search.net/about/en/ (accessed on 31 December 2021).
- ClinicalTrials.gov. Background—ClinicalTrials.gov. 2016. Available online: https://clinicaltrials.gov/ct2/about-site/background (accessed on 31 December 2021).
- PubMed. About—PubMed. 2021. Available online: https://pubmed.ncbi.nlm.nih.gov/about/ (accessed on 31 December 2021).
- Page, M.J.; McKenzie, J.E.; Bossuyt, P.M.; Boutron, I.; Hoffmann, T.C.; Mulrow, C.D.; Shamseer, L.; Tetzlaff, J.M.; Akl, E.A.; Brennan, S.E.; et al. The PRISMA 2020 statement: An updated guideline for reporting systematic reviews. BMJ 2021, 372, n71. [Google Scholar] [CrossRef]
- Ouzzani, M.; Hammady, H.; Fedorowicz, Z.; Elmagarmid, A. Rayyan-a web and mobile app for systematic reviews. Syst. Rev. 2016, 5, 210. [Google Scholar] [CrossRef] [PubMed] [Green Version]
- McHugh, M.L. Interrater reliability: The kappa statistic. Biochem. Med. 2012, 22, 276–282. [Google Scholar] [CrossRef]
- Sterne, J.A.C.; Savović, J.; Page, M.J.; Elbers, R.G.; Blencowe, N.S.; Boutron, I.; Cates, C.J.; Cheng, H.-Y.; Corbett, M.S.; Eldridge, S.M.; et al. RoB 2: A revised tool for assessing risk of bias in randomised trials. BMJ 2019, 366, l4898. [Google Scholar] [CrossRef] [Green Version]
- Sterne, J.A.C.; Hernán, M.A.; Reeves, B.C.; Savović, J.; Berkman, N.D.; Viswanathan, M.; Henry, D.; Altman, D.G.; Ansari, M.T.; Boutron, I.; et al. ROBINS-I: A tool for assessing risk of bias in non-randomized studies of interventions. BMJ 2016, 355, i4919. [Google Scholar] [CrossRef] [PubMed] [Green Version]
- Checiński, M.; Rubinkiewicz, A.; Chęcińska, K. Mandibular mesiodens—A literature review. Nowa Stomatol. 2019, 24, 127–132. [Google Scholar] [CrossRef]
- Sikora, M.; Chęciński, M.; Chlubek, D. Retro-Auricular Approach to the Fractures of the Mandibular Condyle: A Systematic Review. J. Clin. Med. 2021, 10, 230. [Google Scholar] [CrossRef] [PubMed]
- Sikora, M.; Chęciński, M.; Nowak, Z.; Chlubek, D. Variants and Modifications of the Retroauricular Approach Using in Temporomandibular Joint Surgery: A Systematic Review. J. Clin. Med. 2021, 10, 2049. [Google Scholar] [CrossRef]
- Nowak, Z.; Chęciński, M.; Mokrysz, J.; Zadka, P.; Chęcińska, K. Analysis of the course of temporomandibular joint arthrocentesis with the single puncture technique: A review paper. Twój Przegląd Stomatol. 2021, 5, 46–52. [Google Scholar]
- Sikora, M.; Chęciński, M.; Nowak, Z.; Chęcińska, K.; Olszowski, T.; Chlubek, D. The Use of Titanium 3D Mini-Plates in the Surgical Treatment of Fractures of the Mandibular Condyle: A Systematic Review and Meta-Analysis of Clinical Trials. J. Clin. Med. 2021, 10, 3604. [Google Scholar] [CrossRef]
- Nowak, Z.; Chęciński, M.; Nitecka-Buchta, A.; Bulanda, S.; Ilczuk-Rypuła, D.; Postek-Stefańska, L.; Baron, S. Intramuscular Injections and Dry Needling within Masticatory Muscles in Management of Myofascial Pain. Systematic Review of Clinical Trials. Int. J. Environ. Res. Public Health 2021, 18, 9552. [Google Scholar] [CrossRef]
- Chęciński, M.; Zadka, P.; Nowak, Z.; Mokrysz, J.; Chęcińska, K.; Sikora, M.; Chlubek, D. Lead Airgun Projectiles Inside the Maxillary Sinuses—Therapeutic Approaches through the Years: A Systematic Review of Case Reports. Appl. Sci. 2021, 11, 11809. [Google Scholar] [CrossRef]
- Chęcińska, K.; Chęciński, M.; Sikora, M.; Nowak, Z.; Karwan, S.; Chlubek, D. The Effect of Zirconium Dioxide (ZrO2) Nanoparticles Addition on the Mechanical Parameters of Polymethyl Methacrylate (PMMA): A Systematic Review and Meta-Analysis of Experimental Studies. Polymers 2022, 14, 1047. [Google Scholar] [CrossRef] [PubMed]
- Kopp, S.; Akerman, S.; Nilner, M. Short-term effects of intra-articular sodium hyaluronate, glucocorticoid, and saline injections on rheumatoid arthritis of the temporomandibular joint. J. Craniomandib. Disord. 1991, 5, 231–238. [Google Scholar] [PubMed]
- Batifol, D.; Finiels, P.; Jammet, P. The Effect of Intra-Articular Injection of Hyaluronic Acid on the Degenerative Pathology of the Temporo-Mandibular Joint. Glob. Drugs Therap. 2018, 3, 1–4. [Google Scholar] [CrossRef] [Green Version]
- Bjørnland, T.; Gjaerum, A.A.; Møystad, A. Osteoarthritis of the temporomandibular joint: An evaluation of the effects and complications of corticosteroid injection compared with injection with sodium hyaluronate. J. Oral Rehabil. 2007, 34, 583–589. [Google Scholar] [CrossRef]
- Fonseca, R.M.D.F.B.; Januzzi, E.; Ferreira, L.A.; Grossmann, E.; Carvalho, A.C.P.; de Oliveira, P.G.; Vieira, É.L.M.; Teixeira, A.L.; Almeida-Leite, C.M. Effectiveness of Sequential Viscosupplementation in Temporomandibular Joint Internal Derangements and Symptomatology: A Case Series. Pain Res. Manag. 2018, 2018, 5392538. [Google Scholar] [CrossRef]
- Harba, A.N.; Harfoush, M. Evaluation of the participation of hyaluronic acid with platelet-rich plasma in the treatment of temporomandibular joint disorders. Dent. Med. Probl. 2021, 58, 81–88. [Google Scholar] [CrossRef]
- Korkmaz, Y.T.; Altıntas, N.Y.; Korkmaz, F.M.; Candırlı, C.; Coskun, U.; Durmuslar, M.C. Is Hyaluronic Acid Injection Effective for the Treatment of Temporomandibular Joint Disc Displacement with Reduction? J. Oral Maxillofac. Surg. 2016, 74, 1728–1740. [Google Scholar] [CrossRef]
- Li, C.; Long, X.; Deng, M.; Li, J.; Cai, H.; Meng, Q. Osteoarthritic changes after superior and inferior joint space injection of hyaluronic acid for the treatment of temporomandibular joint osteoarthritis with anterior disc displacement without reduction: A cone-beam computed tomographic evaluation. J. Oral Maxillofac. Surg. 2015, 73, 232–244. [Google Scholar] [CrossRef]
- Long, X.; Chen, G.; Cheng, A.H.; Cheng, Y.; Deng, M.; Cai, H.; Meng, Q. A randomized controlled trial of superior and inferior temporomandibular joint space injection with hyaluronic acid in treatment of anterior disc displacement without reduction. J. Oral Maxillofac. Surg. 2009, 67, 357–361. [Google Scholar] [CrossRef]
- Romero-Tapia, P.; Pérez-Vargas, F.; Sedano-Balbin, G.; Marín, J.; Mayta-Tovalino, F. Therapeutic Effect of Sodium Hyaluronate and Corticosteroid Injections on Pain and Temporomandibular Joint Dysfunction: A Quasi-experimental Study. J. Contemp. Dent. Pract. 2020, 21, 1084–1090. [Google Scholar] [CrossRef] [PubMed]
- Sato, S.; Nasu, F.; Motegi, K. Analysis of kinesiograph recordings and masticatory efficiency after treatment of non-reducing disk displacement of the temporomandibular joint. J. Oral Rehabil. 2003, 30, 708–713. [Google Scholar] [CrossRef] [PubMed]
- Sato, S.; Kawamura, H. Changes in condylar mobility and radiographic alterations after treatment in patients with non-reducing disc displacement of the temporomandibular joint. Dentomaxillofac. Radiol. 2006, 35, 289–294. [Google Scholar] [CrossRef]
- Stasko, J.; Statelova, D.; Janickova, M.; Mikuskova, K.; Bacinsky, M.; Sokol, J.; Frlickova, Z.; Hvizdos, D.; Malachovsky, I. Hyaluronic acid application vs. arthroscopy in treatment of internal temporomandibular joint disorders. Bratisl. Lek. Listy 2020, 121, 352–357. [Google Scholar] [CrossRef] [PubMed]
- Yang, W.; Liu, W.; Miao, C.; Sun, H.; Li, L.; Li, C. Oral Glucosamine Hydrochloride Combined with Hyaluronate Sodium Intra-Articular Injection for Temporomandibular Joint Osteoarthritis: A Double-Blind Randomized Controlled Trial. J. Oral Maxillofac. Surg. 2018, 76, 2066–2073. [Google Scholar] [CrossRef] [PubMed]
- Yeung, R.W.; Chow, R.L.; Samman, N.; Chiu, K. Short-term therapeutic outcome of intra-articular high molecular weight hyaluronic acid injection for nonreducing disc displacement of the temporomandibular joint. Oral Surg. Oral Med. Oral Pathol. Oral Radiol. Endod. 2006, 102, 453–461. [Google Scholar] [CrossRef]
- Yilmaz, O.; Korkmaz, Y.T.; Tuzuner, T. Comparison of treatment efficacy between hyaluronic acid and arthrocentesis plus hyaluronic acid in internal derangements of temporomandibular joint. J. Craniomaxillofac. Surg. 2019, 47, 1720–1727. [Google Scholar] [CrossRef]


| Criterion | Inclusion Criteria | Exclusion Criteria |
|---|---|---|
| Patient description | Patients diagnosed with pain in the temporomandibular joint according to ICOP Section 3 [1] | Animal patients |
| Intervention description | Administration of HA into the TMJ cavity | Concomitant other TMJ interventions (e.g., arthroscopy, arthrocentesis) or drug treatment of TMJ other than acute pain relief |
| Comparator description | Any or none | - |
| Outcome description | Primary outcomes: mandible abduction ranges Secondary outcomes: horizontal ranges of mandibular mobility and TMJ pain intensity values | No values of mandibular abduction measured before and after injection or series of injections |
| Settings | Primary studies with a minimum of 10 patients in the HA treatment group | Reports in languages other than English |
| Database | Database Query |
|---|---|
| ACM | [[All: temporomandibular] OR [All: tmj] OR [All: tmd]] AND [[All: hyaluronic] OR [All: hyaluronan] OR [All: hyaluronate] OR [All: viscosupplement]] AND [[All: injection] OR [All: administration] OR [All: viscosupplementation]] AND [[All: mouth] OR [All: jaw] OR [All: mandible] OR [All: mandibular]] AND [[All: opening] OR [All: abduction] OR [All: mobility] OR [All: protrusion] OR [All: movement]] |
| BASE | (temporomandibular tmj tmd) AND (hyaluronic hyaluronan hyaluronate viscosupplement) AND (injection administration viscosupplementation) AND (mouth jaw mandible mandibular) AND (opening abduction mobility protrusion movement) |
| ClinicalTrials.gov | (hyaluronic OR hyaluronan OR hyaluronate OR viscosupplement) AND (injection OR administration OR viscosupplementation) AND (mouth OR jaw OR mandible OR mandibular) AND (opening OR abduction OR mobility OR protrusion OR movement) | Completed Studies | Studies With Results | (temporomandibular OR tmj OR tmd) |
| PubMed | (temporomandibular OR tmj OR tmd) AND (hyaluronic OR hyaluronan OR hyaluronate OR viscosupplement) AND (injection OR administration OR viscosupplementation) AND (mouth OR jaw OR mandible OR mandibular) AND (opening OR abduction OR mobility OR protrusion OR movement) |
| First Author | Publication Year | Title | Type of Study |
|---|---|---|---|
| Batifol [28] | 2018 | The Effect of Intra-Articular Injection of Hyaluronic Acid on the Degenerative Pathology of the Temporo-Mandibular Joint | Retrospective |
| Bjørnland [29] | 2007 | Osteoarthritis of the temporomandibular joint: an evaluation of the effects and complications of corticosteroid injection compared with injection with sodium hyaluronate | Randomized controlled trial |
| Macedo De Sousa [4] | 2020 | Different Treatments in Patients with Temporomandibular Joint Disorders: A Comparative Randomized Study | Randomized controlled trial |
| Fonseca [30] | 2018 | Effectiveness of Sequential Viscosupplementation in Temporomandibular Joint Internal Derangements and Symptomatology: A Case Series | Case series |
| Harba [31] | 2021 | Evaluation of the participation of hyaluronic acid with platelet-rich plasma in the treatment of temporomandibular joint disorders | Randomized controlled trial |
| Korkmaz [32] | 2016 | Is Hyaluronic Acid Injection Effective for the Treatment of Temporomandibular Joint Disc Displacement With Reduction? | Randomized controlled trial |
| Li [33] | 2015 | Osteoarthritic changes after superior and inferior joint space injection of hyaluronic acid for the treatment of temporomandibular joint osteoarthritis with anterior disc displacement without reduction: a cone-beam computed tomographic evaluation | Randomized controlled trial |
| Long [34] | 2009 | A randomized controlled trial of superior and inferior temporomandibular joint space injection with hyaluronic acid in treatment of anterior disc displacement without reduction | Randomized controlled trial |
| Romero-Tapia [35] | 2020 | Therapeutic Effect of Sodium Hyaluronate and Corticosteroid Injections on Pain and Temporomandibular Joint Dysfunction: A Quasi-experimental Study | Randomized controlled trial |
| Sato [36] | 2003 | Analysis of kinesiograph recordings and masticatory efficiency after treatment of non-reducing disk displacement of the temporomandibular joint | Prospective, non-randomized |
| Sato [37] | 2006 | Changes in condylar mobility and radiographic alterations after treatment in patients with non-reducing disc displacement of the temporomandibular joint | Prospective, non-randomized |
| Sikora [3] | 2020 | Short-Term Effects of Intra-Articular Hyaluronic Acid Administration in Patients with Temporomandibular Joint Disorders | Prospective, non-randomized |
| Stasko [38] | 2020 | Hyaluronic acid application vs. arthroscopy in treatment of internal temporomandibular joint disorders | Retrospective |
| Yang [39] | 2018 | Oral Glucosamine Hydrochloride Combined With Hyaluronate Sodium Intra-Articular Injection for Temporomandibular Joint Osteoarthritis: A Double-Blind Randomized Controlled Trial | Randomized controlled trial |
| Yeung [40] | 2006 | Short-term therapeutic outcome of intra-articular high molecular weight hyaluronic acid injection for non-reducing disc displacement of the temporomandibular joint | Prospective, non-randomized |
| Yilmaz [41] | 2019 | Comparison of treatment efficacy between hyaluronic acid and arthrocentesis plus hyaluronic acid in internal derangements of temporomandibular joint | Randomized controlled trial |
| First Author—Study Group | Trade HA Name | HA per Injection, mL | HA Injections/Joint | Total HA Injected/Joint, mL | Treatment Duration, Weeks | Mean Injection Interval, Weeks | HA Injected Monthly/Joint, mL | Other Interventions | Study Group Size | Diagnosis | Number of Joints Treated | Number of Right Joints Treated | Number of Left Joints Treated | Joints Treated/Patient (Mean) |
|---|---|---|---|---|---|---|---|---|---|---|---|---|---|---|
| Batifol | Arthrum | 1.0 | 1 | 1.0 | 1 | N/A | 1.0 | None | 310 | N/S | 500 | N/S | N/S | 1.6 |
| Bjørnland | Synvisc Hylan G-F 20 | 0.7–1.0 | 2 | 2.0 | 2 | 2 | 1.4–2.0 | None | 20 | N/S | 20 | N/S | N/S | 1.0 |
| MacedoDe Sousa | Hyalart | 1.0 | 1 | 1.0 | N/A | N/A | 1.0 | Bite splint | 20 | N/S | 20 | N/S | N/S | 1.0 |
| Fonseca | Polireumin/Osteonil Mini | 1.0 | 4 | 4.0 | 16 | 4 | 1.0 | None | 10 | DDwR | 20 | 10 | 10 | 2.0 |
| Harba | Hyalgan | 1.0 | 4 | 4.0 | 8 | 2 | 2.0 | None | 12 | N/S | N/S | N/S | N/S | N/S |
| Korkmaz—1 injection | Orthovisc | 1.0 | 1 | 1.0 | N/A | N/A | 1.0 | None | 13 | DDwR | 20 | 10 | 10 | 1.5 |
| Korkmaz—2 injections | Orthovisc | 1.0 | 2 | 2.0 | 4 | 4 | 2.0 | None | 13 | DDwR | 15 | 10 | 5 | 1.2 |
| Li—superior | SJFBP | 1.0 | 3 | 3.0 | 6 | 2 | 2.0 | None | 73 | DDwoR | 73 | 43 | 30 | 1.0 |
| Li—inferior | SJFBP | 1.0 | 3 | 3.0 | 6 | 2 | 2.0 | None | 68 | DDwoR | 68 | 37 | 31 | 1.0 |
| Long—superior | SJFBP | 1.0 | 3 | 3.0 | 6 | 2 | 2.0 | None | 50 | DDwoR | 60 | 32 | 28 | 1.2 |
| Long—inferior | SJFBP | 1.0 | 3 | 3.0 | 6 | 2 | 2.0 | None | 54 | DDwoR | 66 | 30 | 36 | 1.2 |
| Romero-Tapia | Suprahyal | 1.0 | 1 | 1.0 | N/A | N/A | 1.0 | None | 15 | N/S | 15 | 10 | 5 | 1.0 |
| Sato 2003 | Artz | 1.0 | 5 | 5.0 | 5 | 1 | 4.0 | None | 20 | DDwoR | 20 | N/S | N/S | 1.0 |
| Sato 2006 | Artz | 1.0 | 5 | 5.0 | 5 | 1 | 4.0 | None | 55 | DDwoR | 55 | N/S | N/S | 1.0 |
| Sikora | Synocrom | 0.4 | 3–5 | 1.84 | 3–5 | 1 | 1.6 | None | 40 | N/S | 61 | N/S | N/S | 1.5 |
| Stasko | Sinovial Mini | 1.0 | 3 | 3.0 | 3 | 1 | 3.0 | None | 99 | N/S | 99 | 51 | 48 | 1.0 |
| Yang | Sofast | 2.0 | 4 | 8.0 | 4 | 1 | 8.0 | None | 72 | N/S | 87 | N/S | N/S | 1.2 |
| Yeung | Synvisc Hylan G-F 20 | 2.0 | 2 | 4.0 | 2 | 2 | 4.0 | None | 27 | DDwoR | 34 | 16 | 18 | 1.3 |
| Yilmaz—DDwR | Orthovisc | 2.0 | 1 | 2.0 | N/A | N/A | 2.0 | None | 18 | DDwR | 22 | 9 | 13 | 1.2 |
| Yilmaz—DDwoR | Orthovisc | 2.0 | 1 | 2.0 | N/A | N/A | 2.0 | None | 18 | DDwoR | 25 | 12 | 13 | 1.4 |
| First Author | Publication Year | Randomization Process | Deviations of Intended Interventions | Missing Outcome Data | Measurement of Outcomes | Selection of Reported Results | Overall Risk of Bias |
|---|---|---|---|---|---|---|---|
| Bjørnland | 2007 | Low | Moderate | Low | Moderate | Low | Moderate |
| Macedo De Sousa | 2020 | Moderate | Moderate | Low | Moderate | Low | Moderate |
| Harba | 2021 | Moderate | Moderate | Low | Moderate | Low | Moderate |
| Korkmaz | 2016 | Moderate | Moderate | Low | Low | Low | Moderate |
| Li | 2015 | Moderate | Moderate | Moderate | Low | Low | Moderate |
| Long | 2009 | Moderate | Moderate | Low | Moderate | Low | Moderate |
| Romero-Tapia | 2020 | High | Moderate | Low | Moderate | Low | Moderate |
| Yang | 2018 | Low | Low | Low | Low | Low | Low |
| Yilmaz | 2019 | Moderate | Moderate | Low | Low | Low | Moderate |
| First Author—Study Group | Pain Values (VAS) in Months | Maximum Mouth Opening (mm) in Months | Protrusive Movement (mm) in Months | Lateral Movements (mm) in Months | |||||||||||||||||||
|---|---|---|---|---|---|---|---|---|---|---|---|---|---|---|---|---|---|---|---|---|---|---|---|
| 0 | 1 | 2 | 3 | 6 | 12 | 0 | 1 | 2 | 3 | 6 | 12 | 0 | 1 | 2 | 6 | 12 | 0 | 1 | 2 | 3 | 6 | 12 | |
| Batifol | 30.0 | 35.0 | 37.0 | 40.0 | |||||||||||||||||||
| Bjørnland | 7.0 | 3.2 | 1.4 | 33.1 | 37.1 | 40.0 | 4.7 | 6.3 | 6.6 | 6.9 | 9.0 | 8.5 | |||||||||||
| Macedo De Sousa | 5.8 | 1.4 | 0.9 | 26.1 | 41.7 | 44.0 | |||||||||||||||||
| Fonseca | 30.5 | 34.0 | 36.5 | ||||||||||||||||||||
| Harba | 6.5 | 3.4 | 2.8 | 3.5 | 35.0 | 42.0 | 40.0 | 39.0 | |||||||||||||||
| Korkmaz—1 injection | 6.3 | 2.0 | 39.2 | 44.5 | 7.0 | 7.4 | |||||||||||||||||
| Korkmaz—2 injections | 6.5 | 2.4 | 41.1 | 45.1 | 7.4 | 7.1 | |||||||||||||||||
| Li—superior | 31.1 | 37.6 | 41.5 | ||||||||||||||||||||
| Li—inferior | 30.0 | 37.9 | 39.6 | ||||||||||||||||||||
| Long—superior | 6.2 | 4.1 | 3.3 | 30.8 | 35.3 | 36.4 | |||||||||||||||||
| Long—inferior | 6.0 | 2.8 | 1.1 | 29.0 | 36.9 | 39.4 | |||||||||||||||||
| Romero-Tapia | 7.0 | 1.5 | 1.0 | 23.6 | 40.9 | 41.8 | 2.5 | 6.2 | 5.9 | 1.8 | 5.9 | 5.8 | |||||||||||
| Sato 2003 | 27.9 | 45.5 | 5.0 | 7.9 | 6.0 | 8.4 | |||||||||||||||||
| Sato 2006 | 29.9 | 43.2 | 5.2 | 6.9 | 7.2 | 8.1 | |||||||||||||||||
| Sikora | 40.1 | 44.6 | 5.4 | 7.2 | 7.9 | 8.7 | |||||||||||||||||
| Stasko | 6.2 | 1.2 | 2.1 | 32.2 | 36.0 | 36.9 | |||||||||||||||||
| Yang | 5.1 | 3.6 | 3.3 | 2.9 | 2.8 | 31.5 | 36.0 | 36.5 | 37.4 | 37.9 | |||||||||||||
| Yeung | 4.2 | 1.9 | 2.4 | 2.5 | 2.6 | 38.2 | 36.2 | 37.2 | 36.7 | 39.8 | 7.4 | 7.0 | 7.6 | 7.7 | 8.3 | ||||||||
| Yilmaz—DDwR | 2.0 | 0.0 | 37.0 | 40.0 | |||||||||||||||||||
| Yilmaz—DDwoR | 1.0 | 0.0 | 27.0 | 32.0 | |||||||||||||||||||
| Average | 5.3 | 2.3 | 1.7 | 3.2 | 1.6 | 2.5 | 32.0 | 38.2 | 38.7 | 36.8 | 39.3 | 40.8 | 4.6 | 6.6 | 5.9 | 6.6 | 7.4 | 6.4 | 7.7 | 6.7 | 7.7 | 7.8 | 8.2 |
| Median | 6.1 | 1.9 | 1.7 | 3.1 | 1.4 | 2.5 | 30.8 | 36.7 | 37.2 | 36.8 | 39.8 | 40.6 | 5.0 | 6.3 | 5.9 | 6.6 | 7.4 | 7.1 | 7.9 | 6.7 | 7.7 | 7.8 | 8.2 |
| Standard deviation | 1.9 | 1.0 | 1.0 | 0.7 | 1.1 | 0.5 | 4.9 | 3.7 | 2.7 | 0.9 | 3.7 | 3.3 | 1.2 | 0.6 | 0.7 | 1.9 | 1.5 | 1.3 | 0.7 | 0.2 | |||
| First Author—Study Group | Pain Values (VAS) in Months | Maximum Mouth Opening (mm) in Months | Protrusive Movement (mm) in Months | Lateral Movements (mm) in Months | |||||||||||||||||||
|---|---|---|---|---|---|---|---|---|---|---|---|---|---|---|---|---|---|---|---|---|---|---|---|
| 0 | 1 | 2 | 3 | 6 | 12 | 0 | 1 | 2 | 3 | 6 | 12 | 0 | 1 | 2 | 6 | 12 | 0 | 1 | 2 | 3 | 6 | 12 | |
| Batifol | 100% | 117% | 123% | 133% | |||||||||||||||||||
| Bjørnland | 100% | 46% | 20% | 100% | 112% | 121% | 100% | 134% | 140% | 100% | 131% | 124% | |||||||||||
| Macedo De Sousa | 100% | 24% | 16% | 100% | 160% | 169% | |||||||||||||||||
| Fonseca | 100% | 111% | 120% | ||||||||||||||||||||
| Harba | 100% | 52% | 43% | 54% | 100% | 120% | 114% | 111% | |||||||||||||||
| Korkmaz—1 injection | 100% | 32% | 100% | 114% | 100% | 106% | |||||||||||||||||
| Korkmaz—2 injections | 100% | 37% | 100% | 110% | 100% | 97% | |||||||||||||||||
| Li—superior | 100% | 121% | 133% | ||||||||||||||||||||
| Li—inferior | 100% | 126% | 132% | ||||||||||||||||||||
| Long—superior | 100% | 66% | 53% | 100% | 115% | 118% | |||||||||||||||||
| Long—inferior | 100% | 47% | 18% | 100% | 127% | 136% | |||||||||||||||||
| Romero-Tapia | 100% | 21% | 14% | 100% | 173% | 177% | 100% | 248% | 236% | 100% | 328% | 322% | |||||||||||
| Sato 2003 | 100% | 163% | 100% | 158% | 100% | 139% | |||||||||||||||||
| Sato 2006 | 100% | 144% | 100% | 133% | 100% | 113% | |||||||||||||||||
| Sikora | 100% | 111% | 100% | 133% | 100% | 110% | |||||||||||||||||
| Stasko | 100% | 19% | 34% | 100% | 112% | 115% | |||||||||||||||||
| Yang | 100% | 71% | 65% | 57% | 55% | 100% | 114% | 116% | 119% | 120% | |||||||||||||
| Yeung | 100% | 45% | 57% | 60% | 62% | 100% | 95% | 97% | 96% | 104% | 100% | 95% | 103% | 105% | 112% | ||||||||
| Yilmaz—DDwR | 100% | 0% | 100% | 108% | |||||||||||||||||||
| Yilmaz—DDwoR | 100% | 0% | 100% | 119% | |||||||||||||||||||
| Average | 100% | 41% | 36% | 59% | 29% | 44% | 100% | 124% | 133% | 117% | 122% | 135% | 100% | 172% | 236% | 140% | 145% | 100% | 166% | 213% | 105% | 110% | 126% |
| HA per Injection, mL | HA Injections/Joint | Total HA Injected/Joint, mL | Treatment Duration, Weeks | Mean Injection Interval, Weeks | HA Injected Monthly/Joint, mL | Study Group Size | Number of Joints Treated | Number of Right Joints Treated | Number of Left Joints Treated | Joints Treated/Patient (Mean) | Initial Pain | Pain after 6 Months | Initial Opening | Opening after 6 Months | |
|---|---|---|---|---|---|---|---|---|---|---|---|---|---|---|---|
| HA per injection, mL | x | ||||||||||||||
| HA injections/joint | −0.28 | x | |||||||||||||
| Total HA injected/joint, mL | 0.34 | 0.75 | x | ||||||||||||
| Treatment duration, weeks | −0.16 | 0.47 | 0.21 | x | |||||||||||
| Mean injection interval, weeks | −0.06 | −0.43 | −0.35 | 0.55 | x | ||||||||||
| HA injected monthly/joint, mL | 0.50 | 0.49 | 0.89 | −0.25 | −0.51 | x | |||||||||
| Study group size | −0.10 | −0.12 | −0.10 | −0.41 | −0.54 | −0.01 | x | ||||||||
| Number of joints treated | −0.10 | −0.15 | −0.14 | −0.36 | −0.58 | −0.08 | 0.99 | x | |||||||
| Number of right joints treated | −0.40 | 0.59 | 0.40 | −0.36 | −0.85 | 0.37 | 0.99 | 0.99 | x | ||||||
| Number of left joints treated | −0.26 | 0.57 | 0.46 | −0.36 | −0.91 | 0.46 | 0.96 | 0.98 | 0.94 | x | |||||
| Joints treated/patient (mean) | 0.03 | −0.06 | −0.09 | 0.53 | 0.53 | −0.26 | 0.16 | 0.27 | −0.55 | −0.45 | x | ||||
| Initial pain | −0.85 | 0.34 | −0.06 | 0.29 | 0.29 | −0.16 | 0.12 | 0.12 | 0.32 | 0.17 | −0.47 | x | |||
| Pain after 6 months | −0.02 | 0.63 | 0.62 | 0.20 | −0.02 | 0.50 | 0.12 | 0.29 | 0.09 | −0.02 | 0.14 | 0.45 | x | ||
| Initial opening | 0.00 | 0.00 | −0.05 | −0.24 | 0.27 | 0.02 | −0.15 | −0.10 | −0.24 | −0.21 | 0.27 | 0.01 | 0.34 | x | |
| Opening after 6 months | −0.34 | −0.24 | −0.30 | 0.02 | −0.07 | −0.28 | 0.20 | 0.19 | 0.24 | 0.34 | −0.16 | 0.17 | −0.31 | −0.70 | x |
Publisher’s Note: MDPI stays neutral with regard to jurisdictional claims in published maps and institutional affiliations. |
© 2022 by the authors. Licensee MDPI, Basel, Switzerland. This article is an open access article distributed under the terms and conditions of the Creative Commons Attribution (CC BY) license (https://creativecommons.org/licenses/by/4.0/).
Share and Cite
Chęciński, M.; Sikora, M.; Chęcińska, K.; Nowak, Z.; Chlubek, D. The Administration of Hyaluronic Acid into the Temporomandibular Joints’ Cavities Increases the Mandible’s Mobility: A Systematic Review and Meta-Analysis. J. Clin. Med. 2022, 11, 1901. https://0-doi-org.brum.beds.ac.uk/10.3390/jcm11071901
Chęciński M, Sikora M, Chęcińska K, Nowak Z, Chlubek D. The Administration of Hyaluronic Acid into the Temporomandibular Joints’ Cavities Increases the Mandible’s Mobility: A Systematic Review and Meta-Analysis. Journal of Clinical Medicine. 2022; 11(7):1901. https://0-doi-org.brum.beds.ac.uk/10.3390/jcm11071901
Chicago/Turabian StyleChęciński, Maciej, Maciej Sikora, Kamila Chęcińska, Zuzanna Nowak, and Dariusz Chlubek. 2022. "The Administration of Hyaluronic Acid into the Temporomandibular Joints’ Cavities Increases the Mandible’s Mobility: A Systematic Review and Meta-Analysis" Journal of Clinical Medicine 11, no. 7: 1901. https://0-doi-org.brum.beds.ac.uk/10.3390/jcm11071901