Prediction of the Epidemic Peak of Coronavirus Disease in Japan, 2020


Graduate School of System Informatics, Kobe University, 1-1 Rokkodai-cho, Nada-ku, Kobe 657-8501, Japan
J. Clin. Med. 2020, 9(3), 789; https://0-doi-org.brum.beds.ac.uk/10.3390/jcm9030789
Submission received: 24 February 2020
/
Revised: 10 March 2020
/
Accepted: 10 March 2020
/
Published: 13 March 2020
(This article belongs to the Special Issue Real Time Clinical and Epidemiological Investigations on Novel Coronavirus - Part I)
Abstract
:The first case of coronavirus disease 2019 (COVID-19) in Japan was reported on 15 January 2020 and the number of reported cases has increased day by day. The purpose of this study is to give a prediction of the epidemic peak for COVID-19 in Japan by using the real-time data from 15 January to 29 February 2020. Taking into account the uncertainty due to the incomplete identification of infective population, we apply the well-known SEIR compartmental model for the prediction. By using a least-square-based method with Poisson noise, we estimate that the basic reproduction number for the epidemic in Japan is (CI, –) and the epidemic peak could possibly reach the early-middle summer. In addition, we obtain the following epidemiological insights: (1) the essential epidemic size is less likely to be affected by the rate of identification of the actual infective population; (2) the intervention has a positive effect on the delay of the epidemic peak; (3) intervention over a relatively long period is needed to effectively reduce the final epidemic size.
1. Introduction
In December 2019, the first case of respiratory disease caused by a novel coronavirus was identified in Wuhan City, Hubei Province, China. The outbreak of the disease is ongoing worldwide and the World Health Organization named it coronavirus disease 2019 (COVID-19) on 11 February 2020 [1]. In Japan, the first case was reported on 15 January 2020 and the number of reported laboratory-confirmed COVID-19 cases per week has increased day by day (see Table 1).
As seen in Table 1, the number of newly reported cases per week has increased and a serious outbreak in Japan is a realistic outcome. One of the greatest public concerns is whether the epidemic continues until summer so that it affects the Summer Olympics, which is planned to be held in Tokyo. The purpose of this study is to give a prediction of the epidemic peak of COVID-19 in Japan, which might help us to act appropriately to reduce the epidemic risk.
The epidemic data as shown in Table 1 would have mainly twofold uncertainty. The first one is due to the fact that asymptomatic infected people could spread the infection [3]. The second one is due to the lack of opportunity for the diagnostic test as sufficiently simple diagnostic test kits have not been developed yet and the diagnosis in the early stage in Japan was mainly restricted to people who visited Wuhan [4]. In this study, taking into account such uncertainty, we apply a simple and well-known mathematical model for the prediction. More precisely, we assume that only p () fraction of infective individuals can be identified by diagnosis.
2. Methods
2.1. Model
We apply the following well-known SEIR compartmental model (see, e.g., [5]) for the prediction.
where , , and denote the susceptible, exposed, infective and removed populations at time t, respectively. , and denote the infection rate, the onset rate and the removal rate, respectively. Note that and imply the average incubation period and the average infectious period, respectively. Let the unit time be 1 day. Based on the previous studies [6,7], we fix , and thus, and , respectively. We fix to be 1 so that each population implies the proportion to the total population. We assume that one infective person is identified at time among total number of people in Japan [8]. That is, , where
denotes the number of infective individuals who are identified at time t. Thus, we obtain . We assume that there is no exposed and removed populations at , that is, , and hence,
It was estimated in [9] that 77 cases were confirmed among the possible 940 infected population in February in Hokkaido, Japan. Based on this report, we assume that p ranges from to . The basic reproduction number , which means the expected value of secondary cases produced by one infective individual [10], is calculated as the maximum eigenvalue of the next generation matrix [11], where
Thus, we obtain
2.2. Sensitivity of the Basic Reproduction Number
It is obvious that the basic reproduction number is independent from the onset rate . The sensitivity of to other parameters , and p are calculated as follows:
where , and denote the normalized sensitivity indexes with respect to , and p, respectively. We see from Equation (3) that the k time’s increase in (resp. ) results in the k (resp. ) time’s increase in . In particular, we see from the third equation in Equation (3) that if . This implies that the identification rate p in a realistic range almost does not affect the size of .
2.3. Estimation of the Infection Rate
Let , be the number of daily reported cases of COVID-19 in Japan from 15 January () to 29 February () 2020. We perform the following least-square-based procedure with Poisson noise to estimate the infection rate .
Description 1
.
(P2) Calculate
where , denote random variables from a normal distribution with mean zero and variance 1 [12].
(P3) Calculate.
(P4) Run (P1)–(P3) forand findsuch that.
(P5) Repeat (P1)–(P4)times and obtain the distribution of.
(P6) Approximate the distribution ofby a normal distribution and obtain aconfidence interval.
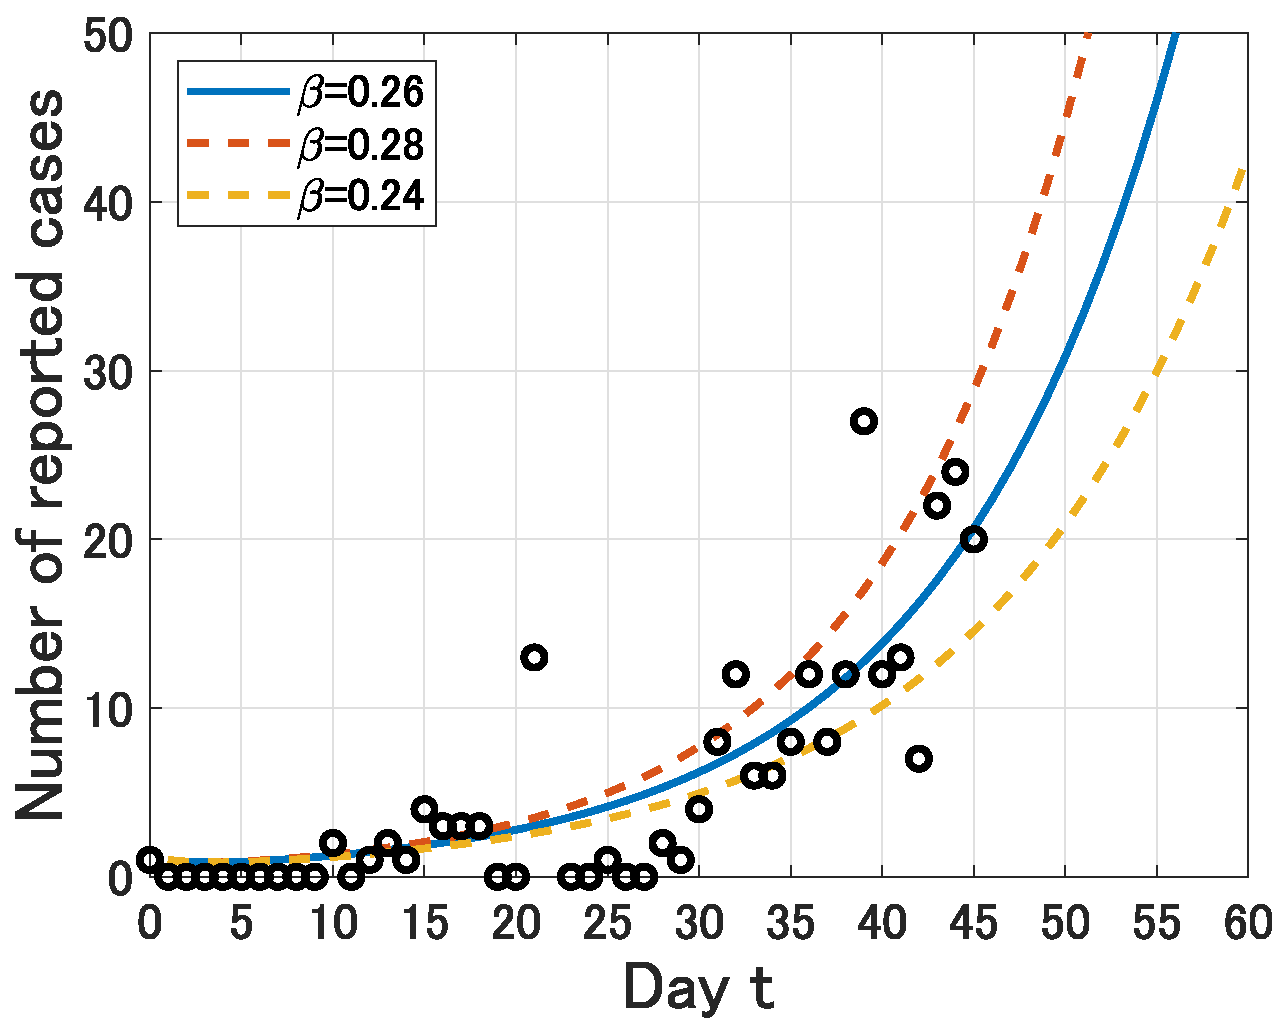
Note that for the reason stated above, the value of does not affect this estimation procedure. By (P1)–(P6), we obtain a normal distribution with mean and standard derivation . Thus, we obtain an estimation of as (CI, –) (see Figure 1). Moreover, by Equation (2), we obtain an estimation of as (CI, –) (see Table 2).
3. Results
3.1. Peak Prediction
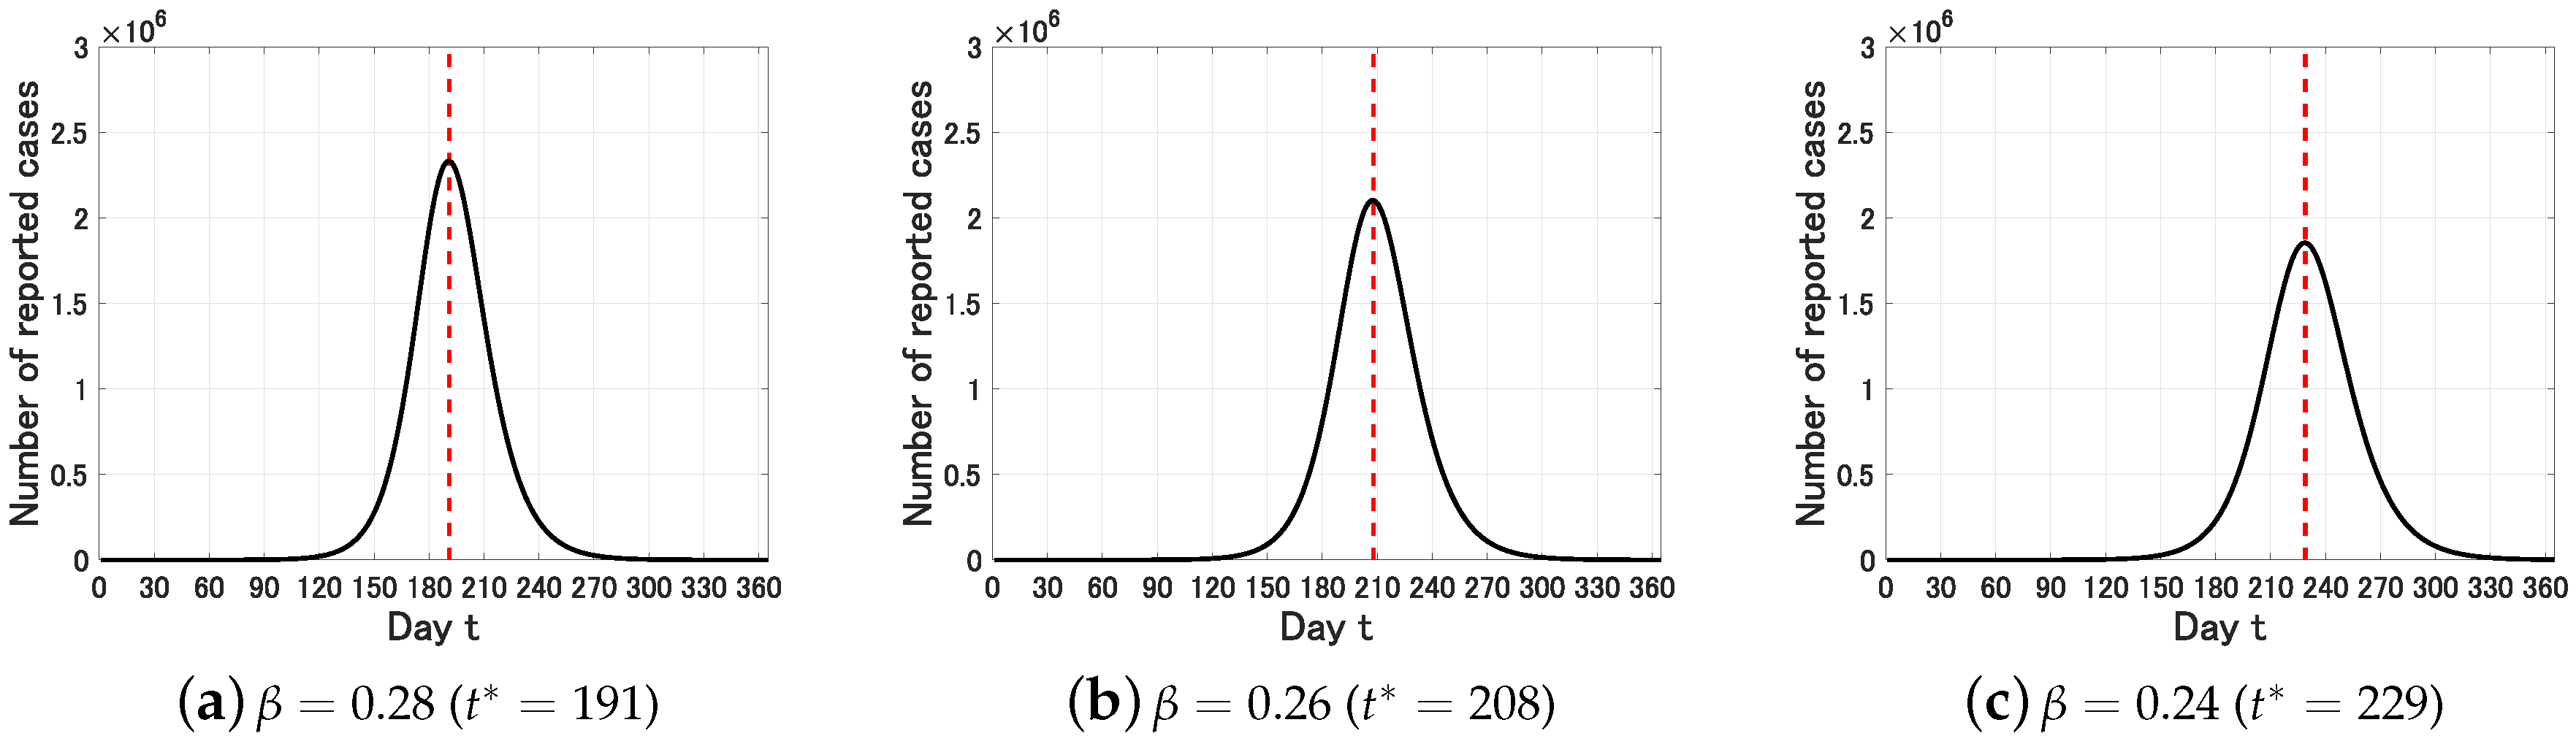
We define the epidemic peak by the time such that Y attains its maximum in 1 year, that is, . We first set . In this case, we obtain the following figure on the long time behavior of for , and .
We see from Figure 2 that the estimated epidemic peak is (CI, 191–229). That is, starting from 15 January (), the estimated epidemic peak is 10 August () and the uncertainty range is from 24 July () to 31 August ().
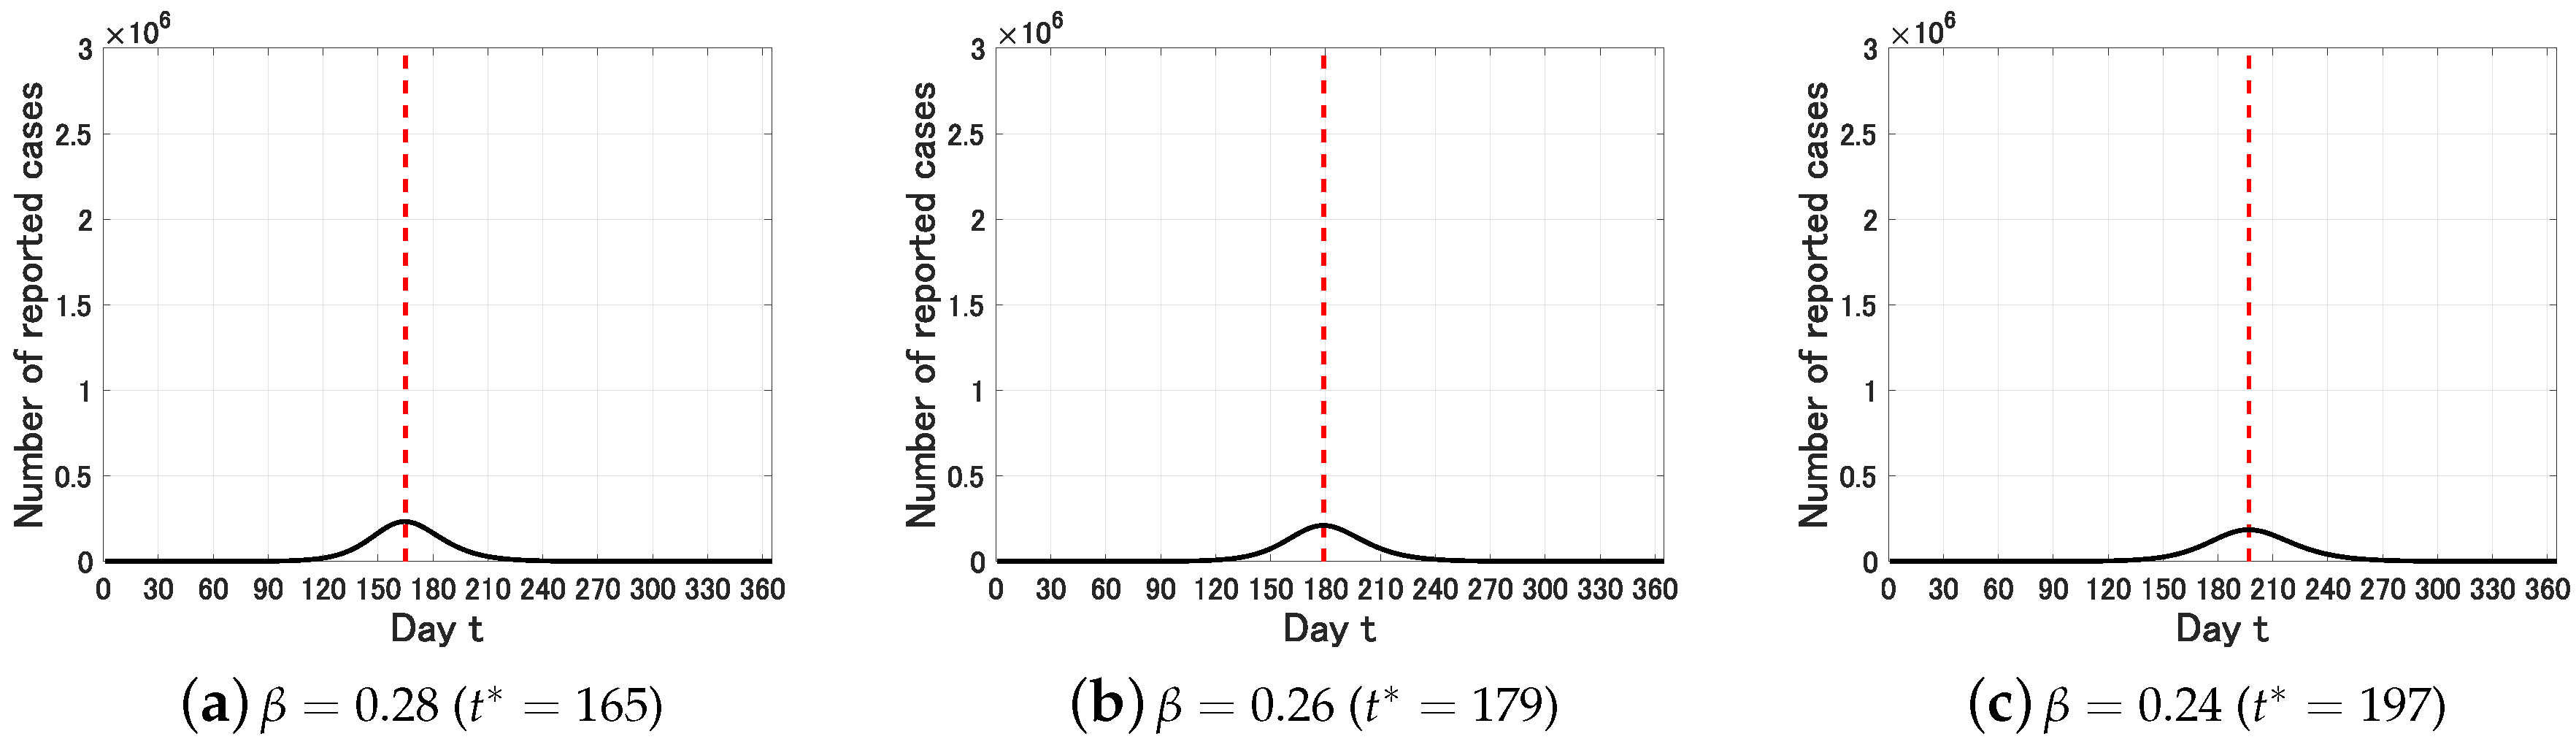
We next set . In this case, we obtain the following figure.
We see from Figure 3 that the estimated epidemic peak is (CI, 165–197). That is, starting from January 15 (), the estimated epidemic peak is July 12 () and the uncertainty range is from June 28 () to July 30 (). In contrast to , the epidemic peak and the (apparent) epidemic size are sensitive to the identification rate p. Note that the essential epidemic size, which is characterized by , is almost the same in both of and .
3.2. Possible Effect of Intervention
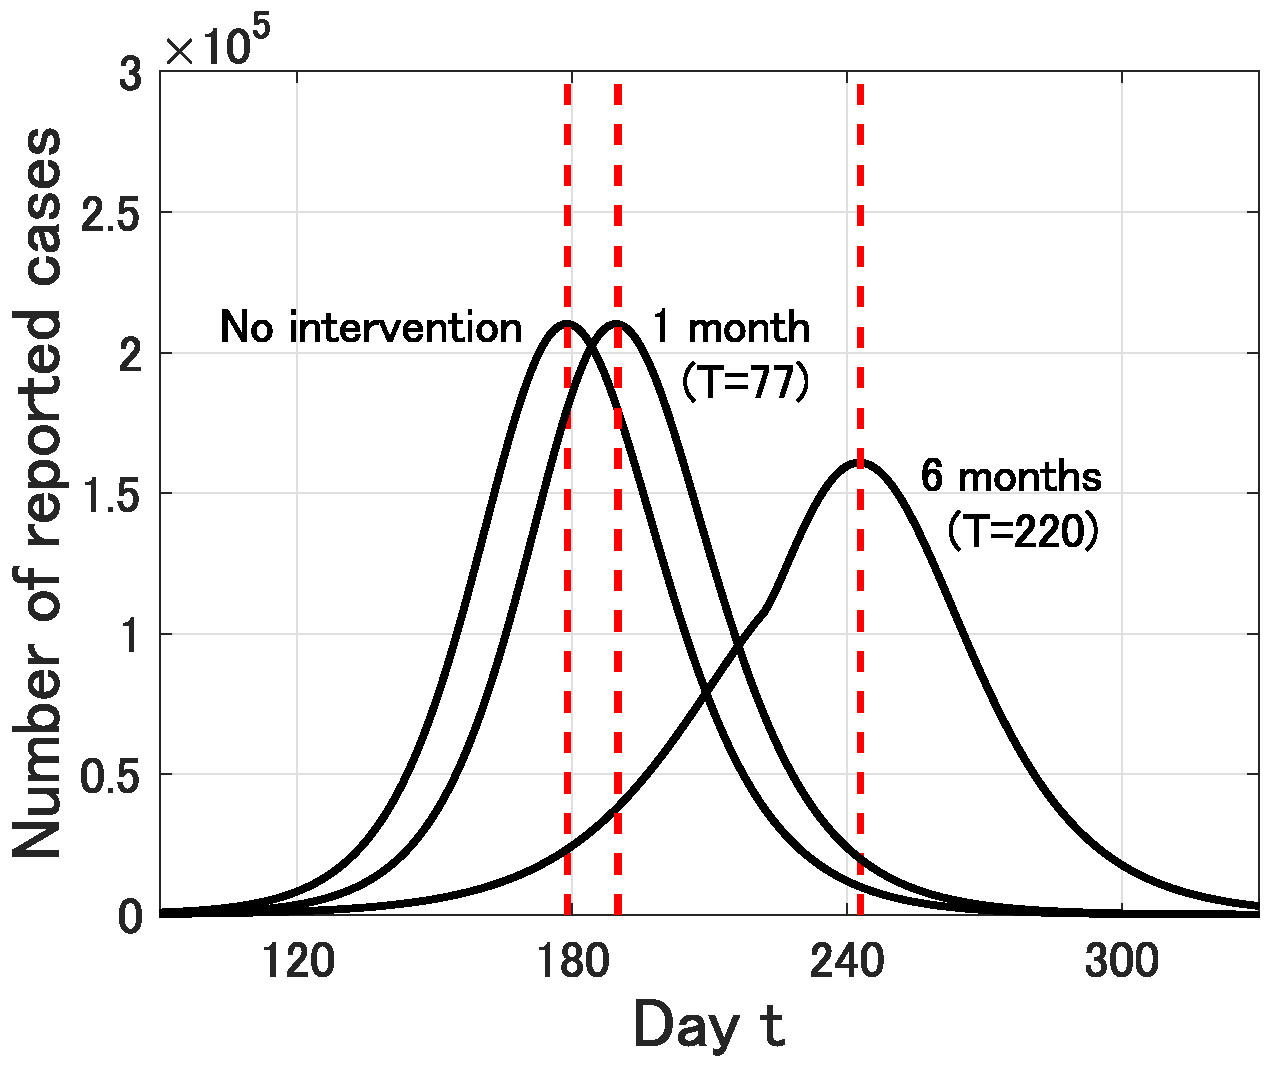
We next discuss the effect of intervention. In Japan, school closure has started in almost all prefectures from the beginning of March [13] and many social events have been cancelled off to reduce the contact risk. However, the exact effect of such social efforts is unclear and might be limited as the proportion of young people to the whole infected people of COVID-19 seems not so high ( of reported cases in China [14]). In this simulation, we assume that such social efforts successfully reduce the infection rate to during a period from 1 March () to a planned day (). In what follows, we fix .
First, we set , that is, the intervention is carried out for 1 month (from 1 March to 1 April). In this case, the epidemic peak is delayed from 179 (12 July) to 190 (23 July). However, the epidemic size is almost the same. On the other hand, if , that is, the intervention is carried out for 6 months (from 1 March to 1 September), then the epidemic peak is delayed from 179 (12 July) to 243 (14 September) and the epidemic size is effectively reduced (see Figure 4).
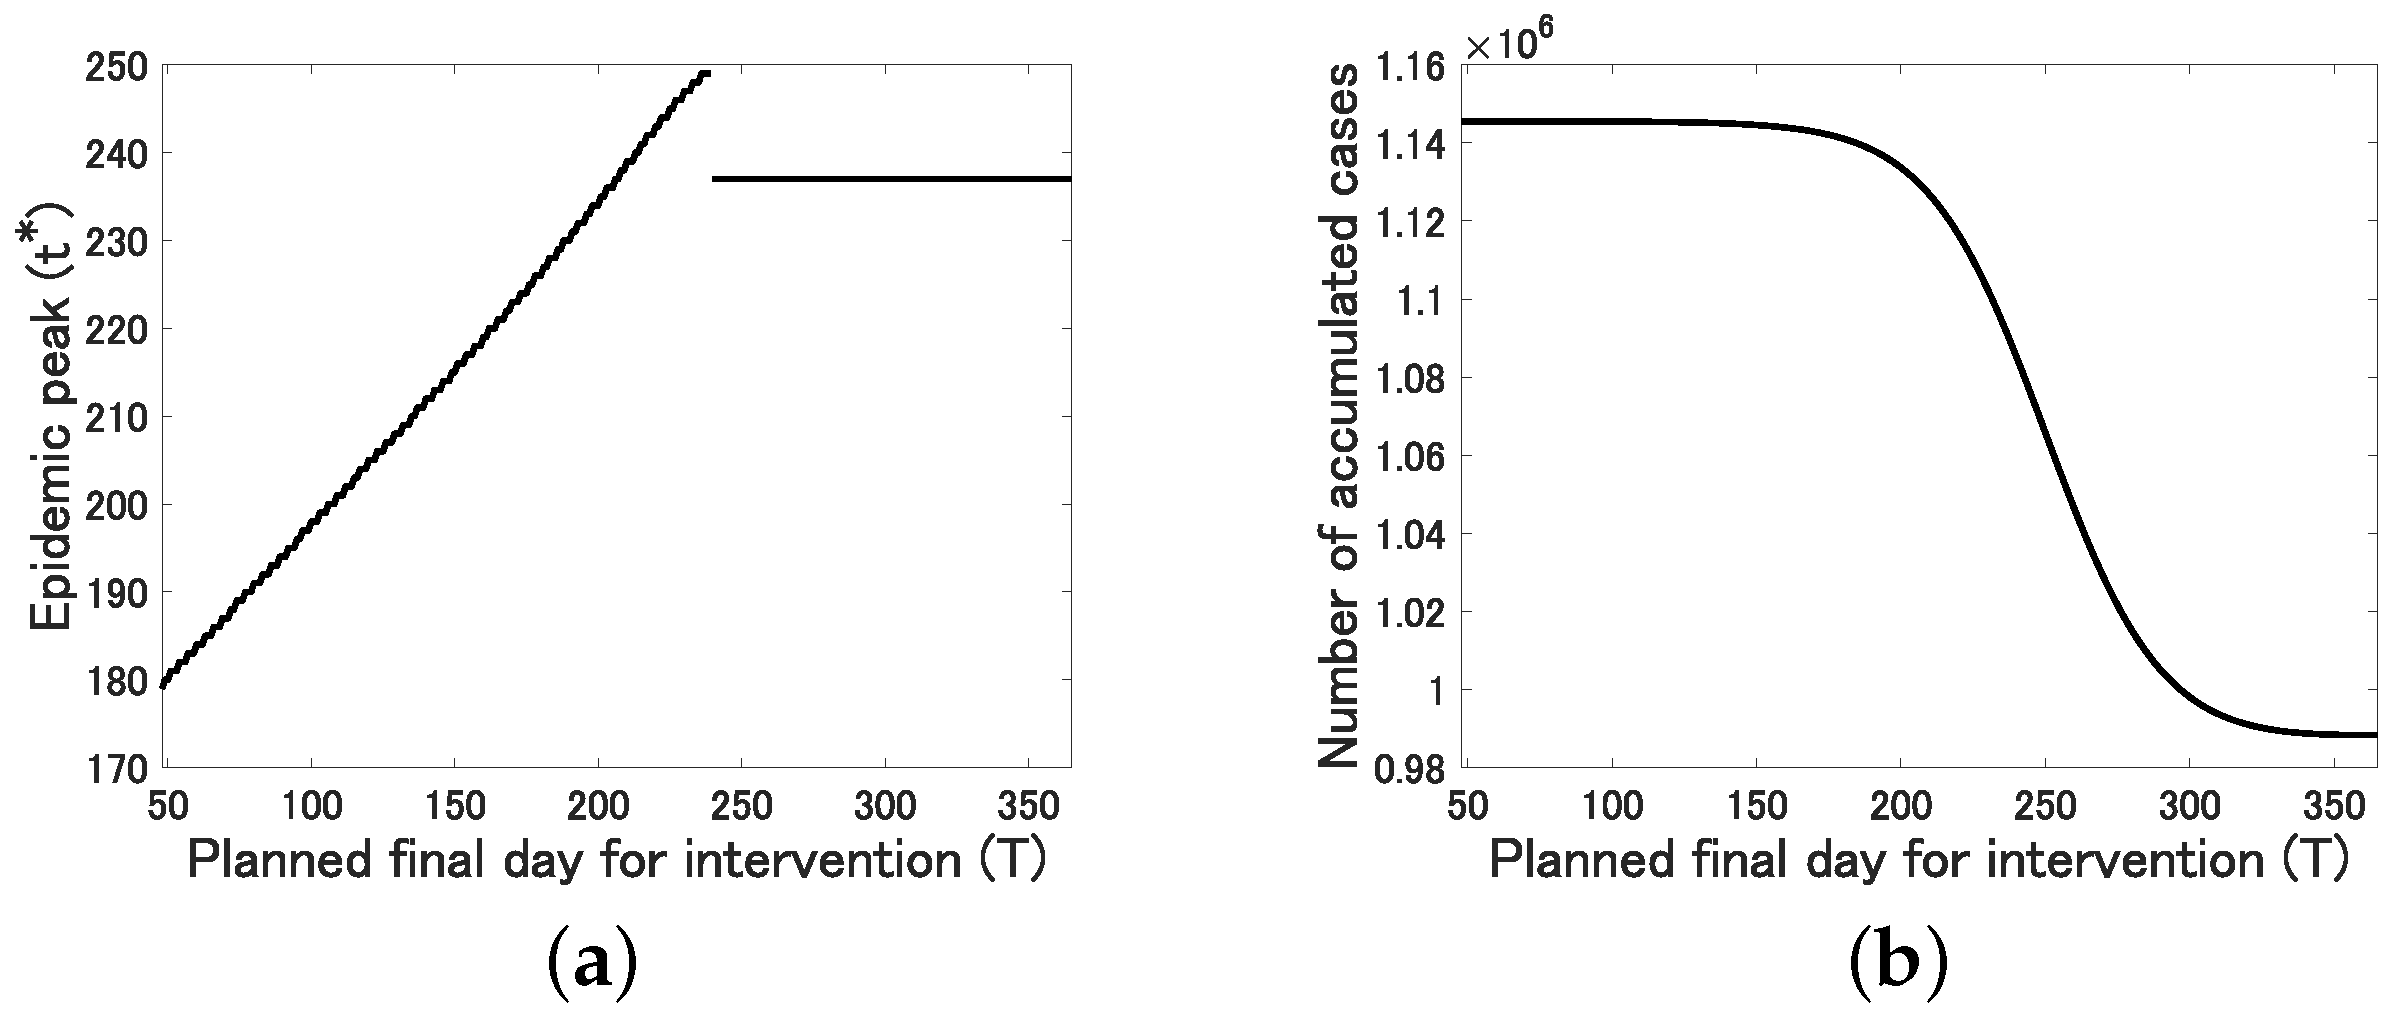
More precisely, we see from Figure 5a that the epidemic peak is delayed almost linearly for and fixed to for .
This implies that the intervention has a positive effect on the delay of the epidemic peak, which would contribute to improve the medical environment utilizing the extra time period. On the other hand, we see from Figure 5b that the number of accumulated cases at , which is calculated as , is monotonically decreasing and converges to as T increases. However, it almost does not change for small . This implies that the intervention over a relatively long duration is required to effectively reduce the final epidemic size.
4. Discussion
In this study, by applying the SEIR compartmental model to the daily reported cases of COVID-19 in Japan from 15 January to 29 February, we have estimated that the basic reproduction number is (CI, –) and the epidemic peak could possibly reach the early-middle summer. Of course, this kind of long range peak prediction would contain the essential uncertainty due to the possibility of some big changes in the social and natural (climate) situations. Nevertheless, our result suggests that the epidemic of COVID-19 in Japan would not end so quickly. This might be consistent with the WHO’s statement on 6 March 2020 that it is a false hope that COVID-19 will disappear in the summer like the flu [15].
The estimated value of the basic reproduction number in this study is not so different from early estimations: (CI, –) [16], (CI, –) [17], (CI, –) [18], (CI, –) [19] and (average of estimations in 12 studies) [20]. In addition, in this study, we have obtained the following epidemiological insights:
- The essential epidemic size, which is characterized by , would not be affected by the identification rate p in a realistic parameter range –, in particular, .
- The intervention exactly has a positive effect on the delay of the epidemic peak, which would contribute to improve the medical environment utilizing the extra time period.
- Intervention over a relatively long period is needed to effectively reduce the final epidemic size.
The first statement implies that underestimation of the actual infective population would not contribute to the reduction of the essential epidemic risk. Correct information based on an adequate diagnosis system would be desired for people to act appropriately.
Funding
This research was funded by the Japan Society for the Promotion of Science (JSPS) KAKENHI grant number 19K14594.
Acknowledgments
The author would like to thank the associate editor and the anonymous reviewers for their helpful comments that allowed me to improve the manuscript.
Conflicts of Interest
The author declares no conflict of interest.
References
- Centers for Disease Control and Prevention. Coronavirus Disease 2019 (COVID-19). Available online: https://www.cdc.gov/coronavirus/2019-ncov/index.html (accessed on 23 February 2020).
- World Health Organization. Coronavirus Disease 2019 (COVID-19) Situation Reports. Available online: https://www.who.int/emergencies/diseases/novel-coronavirus-2019/situation-reports/ (accessed on 5 March 2020).
- Rothe, C.; Schunk, M.; Sothmann, P.; Bretzel, G.; Froeschl, G.; Wallrauch, C.; Zimmer, T.; Thiel, V.; Jankem, C.; Guggemos, W.; et al. Transmission of 2019-nCoV Infection from an Asymptomatic Contact in Germany. New Eng. J. Med. 2020. [Google Scholar] [CrossRef] [PubMed] [Green Version]
- NHK World Japan. Japan Sets up Emergency Measures for Coronavirus. Available online: https://www3.nhk.or.jp/nhkworld/en/news/20200213_07/ (accessed on 17 February 2020).
- Inaba, H. Age-Structured Populatin Dynamics in Demography and Epidemiology; Springer: Berlin/Heidelberg, Germany, 2017. [Google Scholar]
- Linton, N.M.; Kobayashi, T.; Yang, Y.; Hayashi, K.; Akhmetzhanov, A.R.; Jung, S.; Yuan, B.; Kinoshita, R.; Nishiura, H. Incubation period and other epidemiological characteristics of 2019 novel coronavirus infections with right truncation: A statistical analysis of publicly available case data. J. Clin. Med. 2020, 9, 538. [Google Scholar] [CrossRef] [PubMed] [Green Version]
- Sun, H.; Qiu, Y.; Yan, H.; Huang, Y.; Zhu, Y.; Chen, S.X. Tracking and predicting COVID-19 epidemic in China mainland. medRxive 2020. [Google Scholar] [CrossRef] [Green Version]
- Statistics Bureau Japan. Population Estimates Monthly Report January. Available online: https://web.archive.org/web/20190623053923/http://www.stat.go.jp/english/data/jinsui/tsuki/index.html (accessed on 5 March 2020).
- Bloomberg. Japan’s Hokkaido may Have 940 Infected, Researcher Says. Available online: https://www.bloomberg.com/news/articles/2020-03-03/japan-s-hokkaido-could-have-up-to-940-infected-researcher-says (accessed on 5 March 2020).
- Diekmann, O.; Heesterbeek, J.A.P.; Metz, J.A.J. On the definition and the computation of the basic reproduction ratio R0 in models for infectious diseases in heterogeneous populations. J. Math. Biol. 1990, 28, 365–382. [Google Scholar] [CrossRef] [PubMed] [Green Version]
- van den Driessche, P.; Watmough, J. Reproduction numbers and sub-threshold endemic equilibria for compartmental models of disease transmission. Math. Biosci. 2002, 180, 29–48. [Google Scholar] [CrossRef]
- Capaldi, A.; Behrend, S.; Berman, B.; Smith, J.; Wright, J.; Lloyd, A.L. Parameter estimation and uncertainty quantification for an epidemic model. Math. Biosci. Eng. 2012, 9, 553–576. [Google Scholar] [PubMed]
- The Japan Times. Nearly All Prefectures in Japan Shut Schools Amid Coronavirus Outbreak. Available online: https://www.japantimes.co.jp/news/2020/03/02/national/japan-prefectures-shut-schools-covid-19/#.XmIKE0BuKUk (accessed on 6 March 2020).
- Wu, Z.; McGoogan, J.M. Characteristics of and imoprtant lessons from the coronavirus disease 2019 (COVID-19) outbreak in China. J. Am. Med. Assoc. 2020. [Google Scholar] [CrossRef] [PubMed]
- CNBC. It’s a ‘false hope’ Coronavirus will Disappear in the Summer like the Flu, WHO Says. Available online: https://www.cnbc.com/2020/03/06/its-a-false-hope-coronavirus-will-disappear-in-the-summer-like-the-flu-who-says.html (accessed on 8 March 2020).
- Imai, N.; Cori, A.; Dorigatti, I.; Baguelin, M.; Connelly, C.A.; Riley, S.; Ferguson, N.M. Report 3: Transmissibility of 2019-nCoV; Imperial College London: London, UK, 2020. [Google Scholar]
- Liu, T.; Hu, J.; Kang, M.; Lin, L.; Zhong, H.; Xiao, J.; He, G.; Song, T.; Huang, Q.; Rong, Z.; et al. Transmission dynamics of 2019 novel coronavirus (2019-nCoV). bioRxive 2020. [Google Scholar] [CrossRef] [Green Version]
- Read, J.M.; Bridgen, J.R.E.; Cummings, D.A.T.; Ho, A.; Jewell, C.P. Novel coronavirus 2019-nCoV: Ealry estimation of epidemiological parameters and epidemic predictions. medRxive 2020. [Google Scholar] [CrossRef] [Green Version]
- Zhao, S.; Lin, Q.; Ran, J.; Musa, S.S.; Yang, G.; Wang, W.; Lou, Y.; Gao, D.; Yang, L.; He, D.; et al. Preliminary estimation of the basic reproduction number of novel coronavirus (2019-nCoV) in China, from 2019 to 2020: A data-driven analysis in the early phase of the outbreak. Int. J. Infect. Dis. 2020, 92, 214–217. [Google Scholar] [CrossRef] [PubMed] [Green Version]
- Liu, Y.; Gayle, A.A.; Wilder-Smith, A.; Rocklöv, J. The reproductive number of COVID-19 is higher compared to SARS coronavirus. J. Travel. Med. 2020. [Google Scholar] [CrossRef] [PubMed] [Green Version]
Figure 1.
Comparison of with the estimated infection rate and the number of daily reported cases of COVID-19 in Japan from 15 January () to 29 February ().
Figure 1.
Comparison of with the estimated infection rate and the number of daily reported cases of COVID-19 in Japan from 15 January () to 29 February ().

Figure 2.
Time variation of the number of infective individuals who are identified at time t () for . The dot lines represent the epidemic peak .
Figure 2.
Time variation of the number of infective individuals who are identified at time t () for . The dot lines represent the epidemic peak .

Figure 3.
Time variation of the number of infective individuals who are identified at time t () for . The dot lines represent the epidemic peak .
Figure 3.
Time variation of the number of infective individuals who are identified at time t () for . The dot lines represent the epidemic peak .

Figure 4.
Time variation of the number of infective individuals who are identified at time t () for and no intervention, 1 month intervention () and 6 months intervention (). The dot lines represent the epidemic peak.
Figure 4.
Time variation of the number of infective individuals who are identified at time t () for and no intervention, 1 month intervention () and 6 months intervention (). The dot lines represent the epidemic peak.

Figure 5.
The relation between the planned final day for intervention T and (a) the epidemic peak ; (b) the number of accumulated cases at time : .
Figure 5.
The relation between the planned final day for intervention T and (a) the epidemic peak ; (b) the number of accumulated cases at time : .


Table 1.
Number of newly reported COVID-19 cases in Japan until 1 March 2020 [2].
Table 1.
Number of newly reported COVID-19 cases in Japan until 1 March 2020 [2].
| Week | Number of Newly Reported Cases | Number of Accumulated Cases |
|---|---|---|
| 12 January–18 January | 1 | 1 |
| 19 January–25 January | 2 | 3 |
| 26 January–1 February | 14 | 17 |
| 2 February–8 February | 8 | 25 |
| 9 February–16 February | 28 | 53 |
| 17 February–23 February | 79 | 132 |
| 24 February–1 March | 107 | 239 |
Table 2.
Parameter values for model Equation (1).
© 2020 by the author. Licensee MDPI, Basel, Switzerland. This article is an open access article distributed under the terms and conditions of the Creative Commons Attribution (CC BY) license (http://creativecommons.org/licenses/by/4.0/).
Share and Cite
MDPI and ACS Style
Kuniya, T. Prediction of the Epidemic Peak of Coronavirus Disease in Japan, 2020. J. Clin. Med. 2020, 9, 789. https://0-doi-org.brum.beds.ac.uk/10.3390/jcm9030789
AMA Style
Kuniya T. Prediction of the Epidemic Peak of Coronavirus Disease in Japan, 2020. Journal of Clinical Medicine. 2020; 9(3):789. https://0-doi-org.brum.beds.ac.uk/10.3390/jcm9030789
Chicago/Turabian StyleKuniya, Toshikazu. 2020. "Prediction of the Epidemic Peak of Coronavirus Disease in Japan, 2020" Journal of Clinical Medicine 9, no. 3: 789. https://0-doi-org.brum.beds.ac.uk/10.3390/jcm9030789
Note that from the first issue of 2016, this journal uses article numbers instead of page numbers. See further details here.