Artificial Neural Networks in the Prediction of Genetic Merit to Flowering Traits in Bean Cultivars

 ,
,  and
and 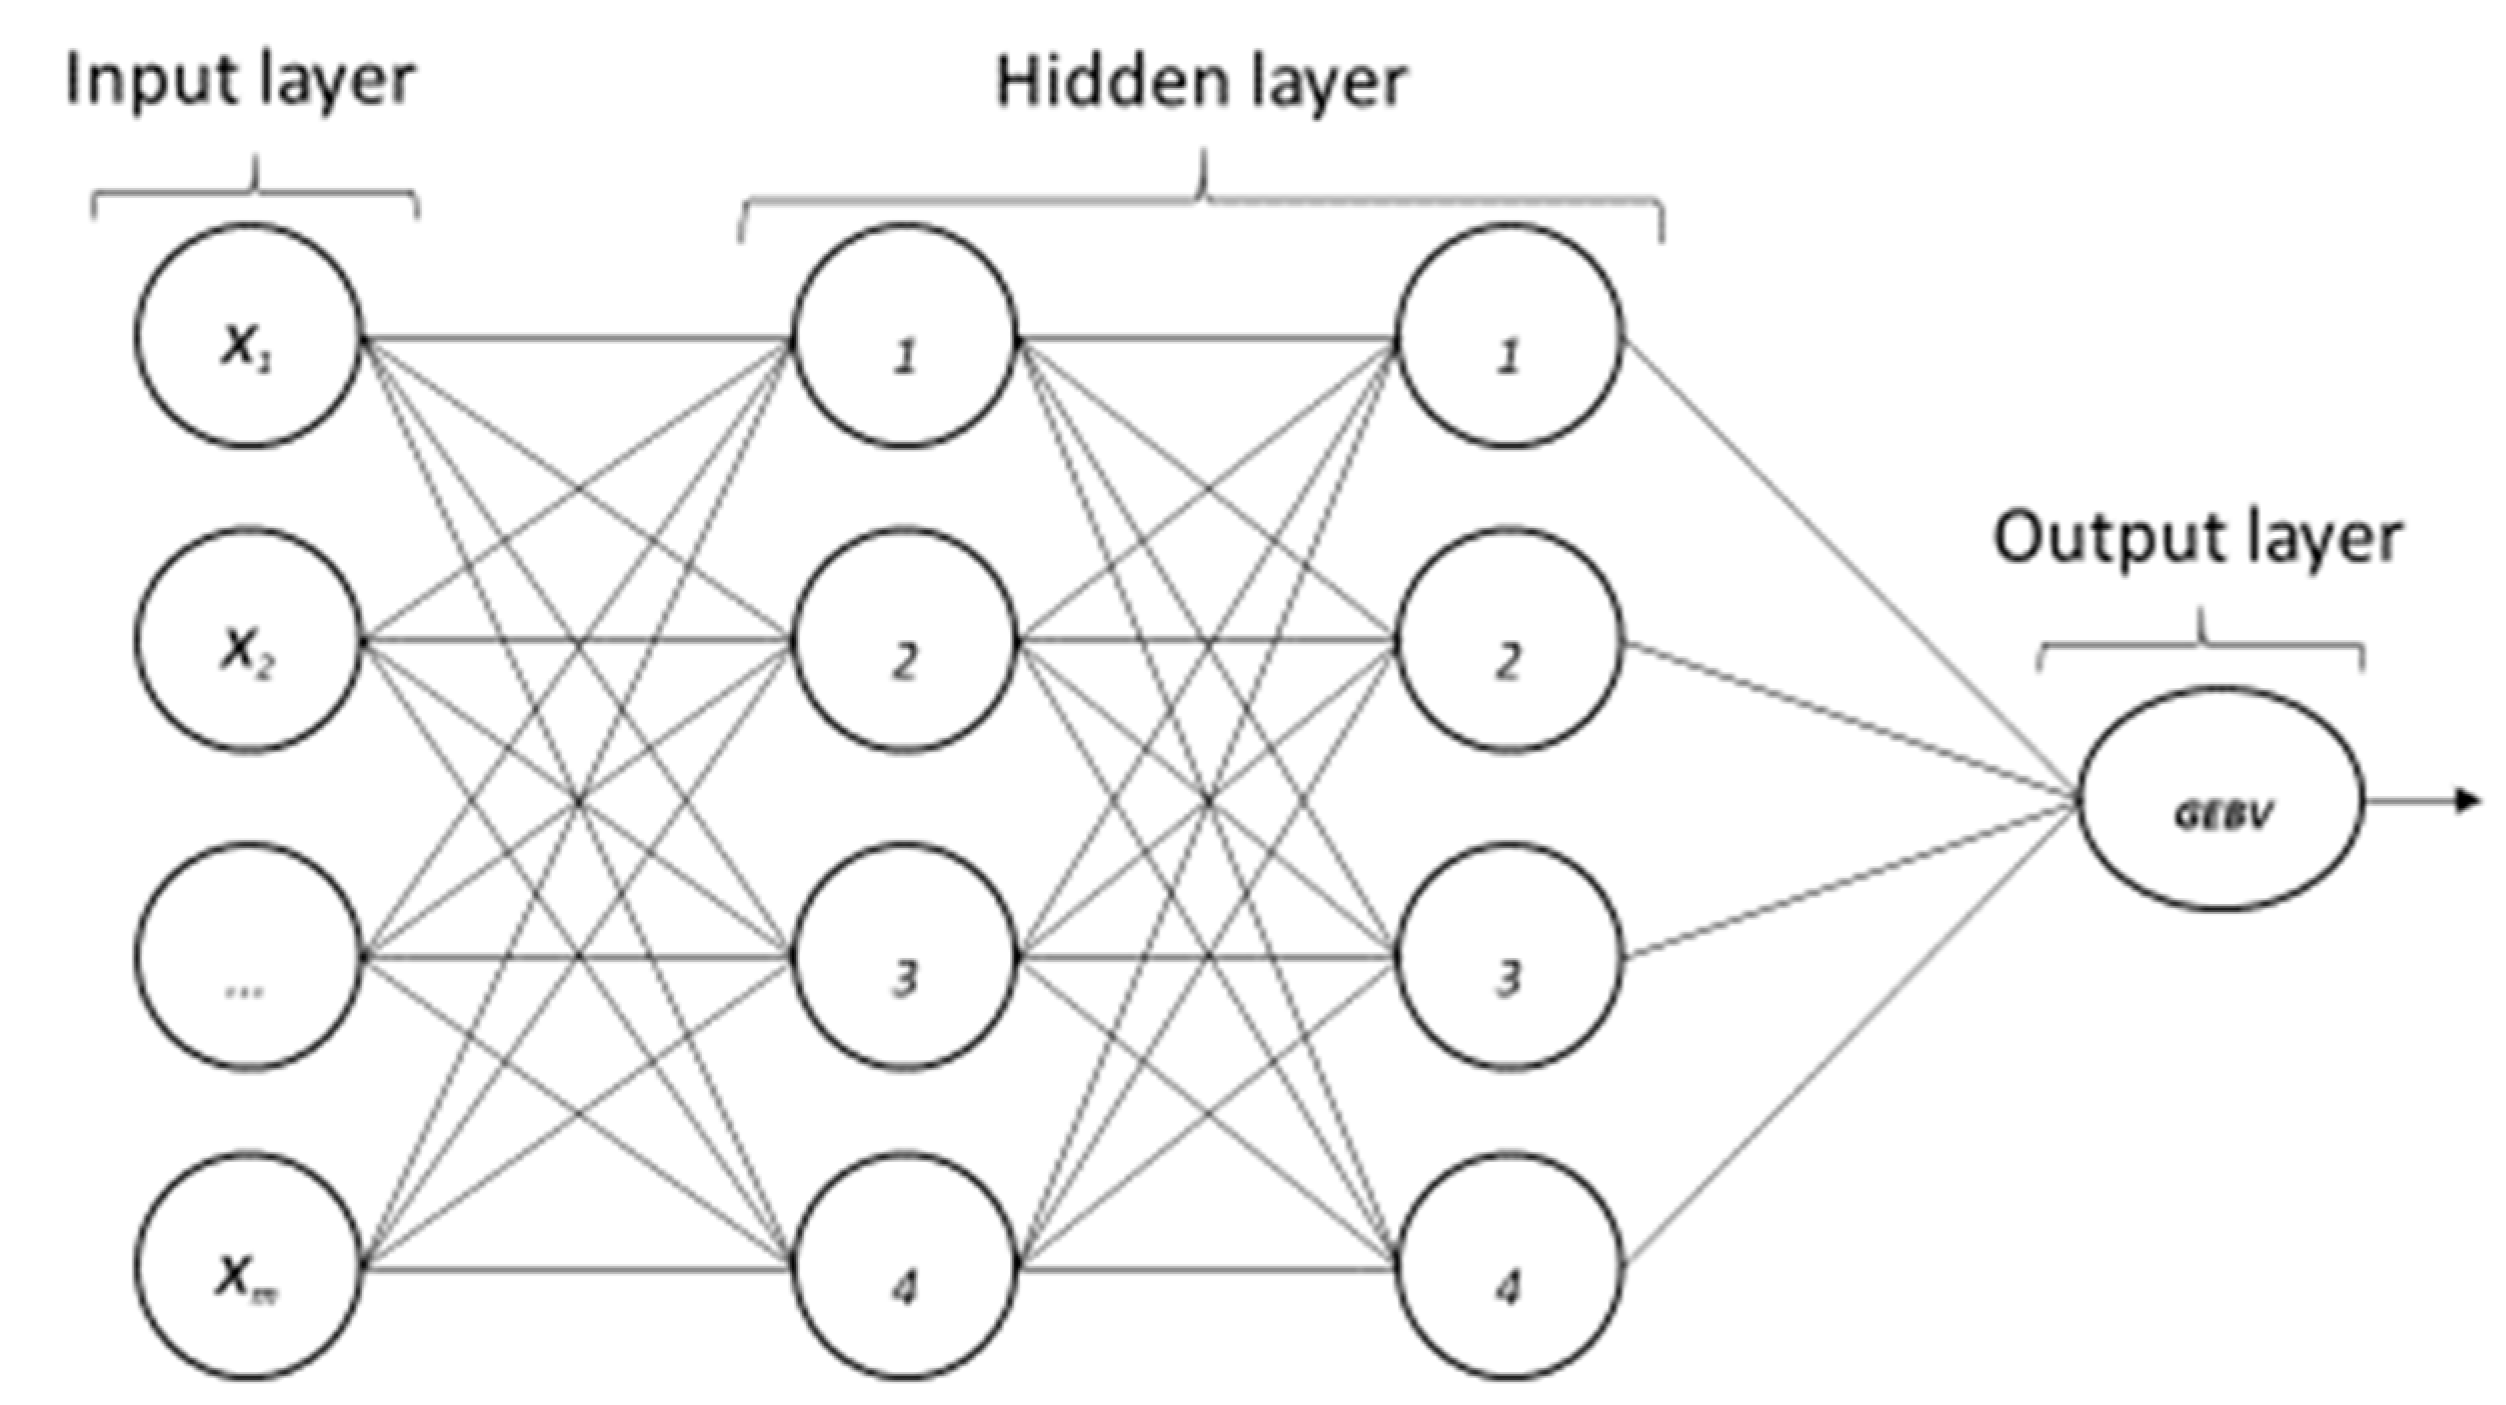
Abstract
:1. Introduction
2. Materials and Methods
2.1. Experiment and Experimental Material
2.2. Phenotypic Data Analysis
2.3. Prediction Models for Genomic Estimated Breeding Values
2.4. Artificial Neural Networks
2.4.1. Multilayer Perceptron (ANN—MLP)
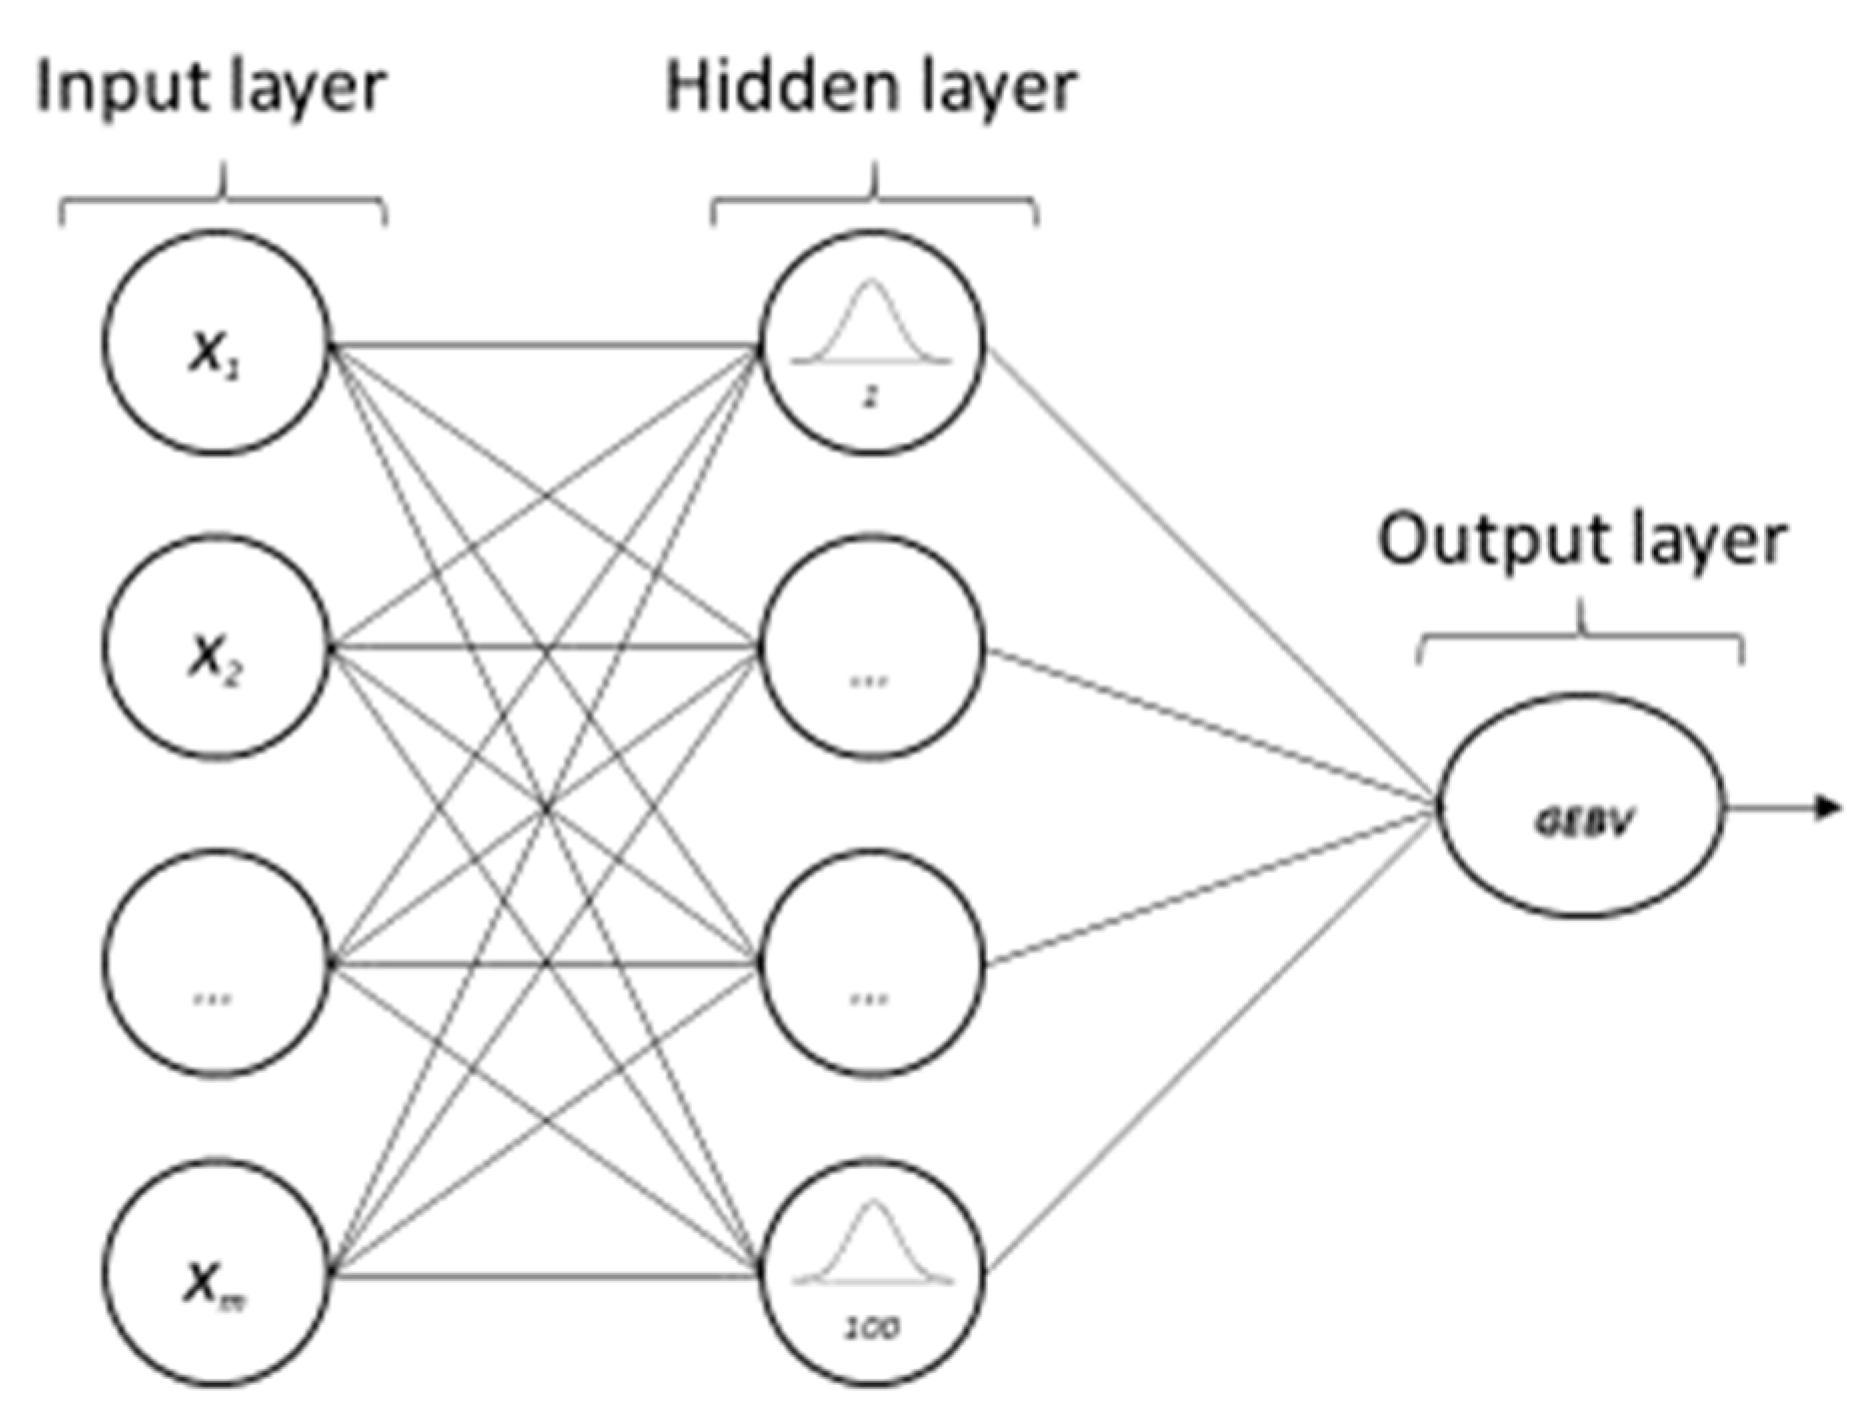
2.4.2. Artificial Neural Networks—Radial Basis Function Network (ANN-RBF)
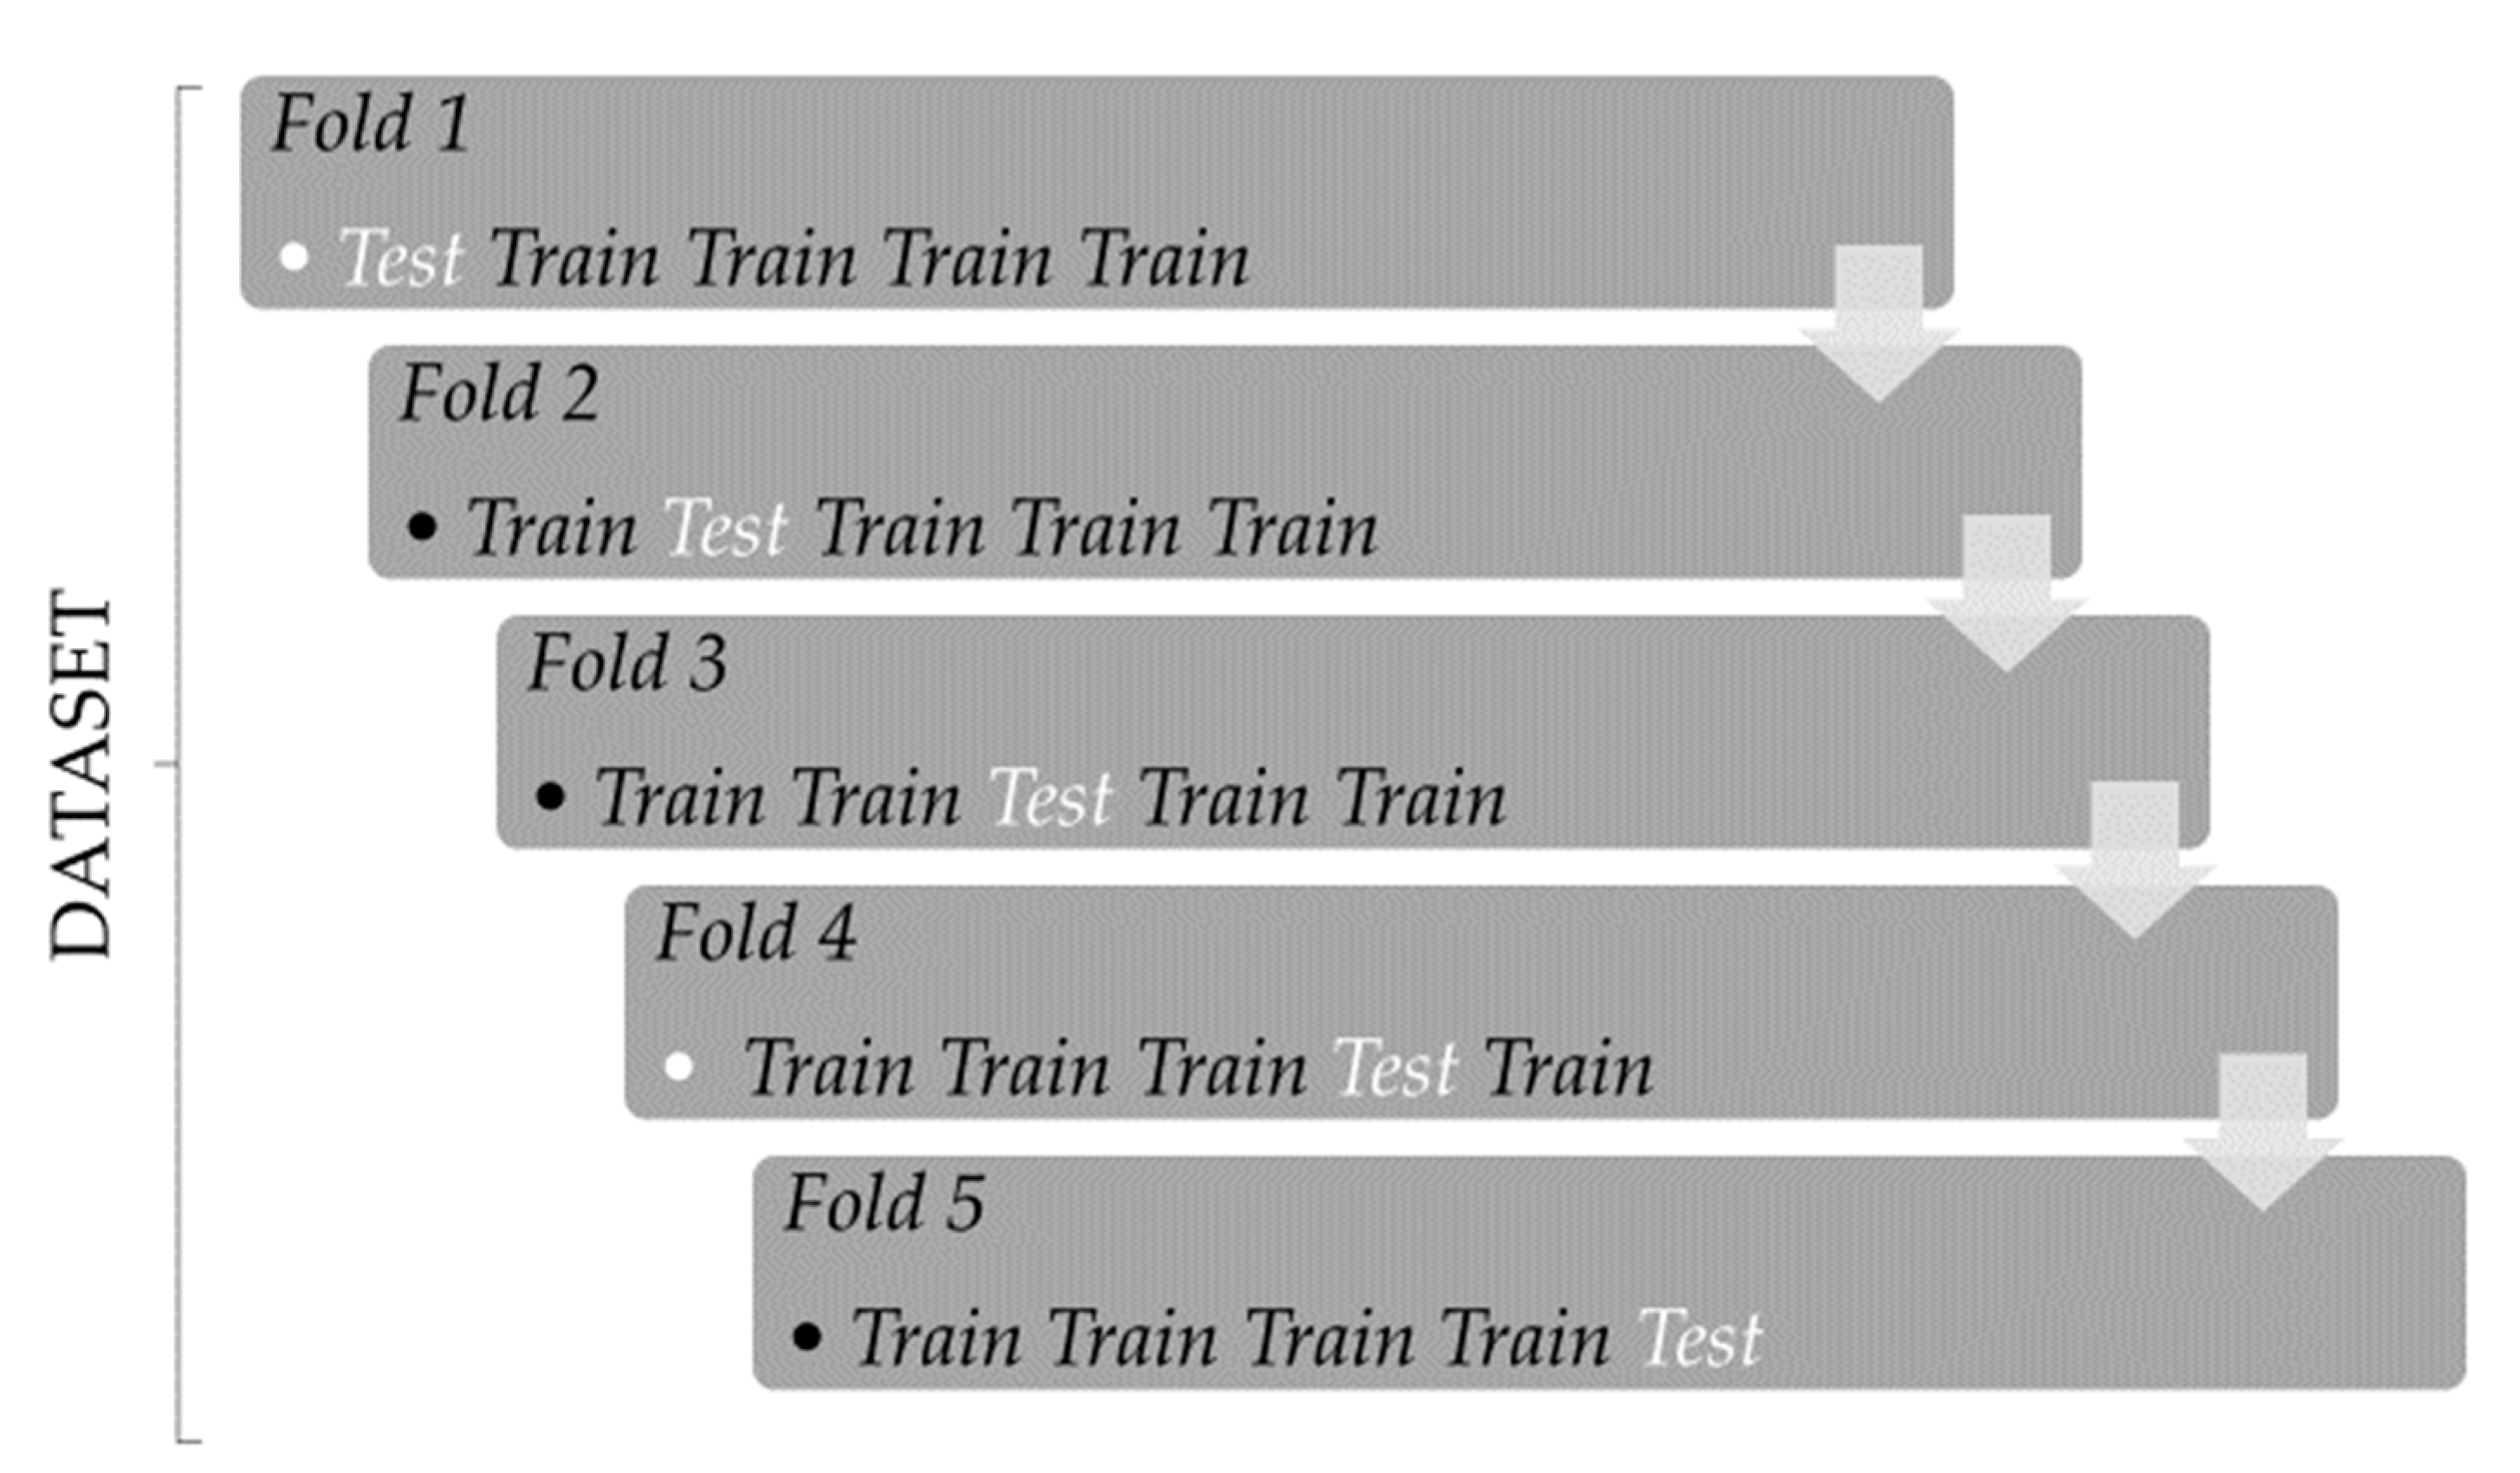
2.5. Comparison of ANN-RBF, ANN-MLP and RR-BLUP to Estimate GEBV in 5-Fold CV
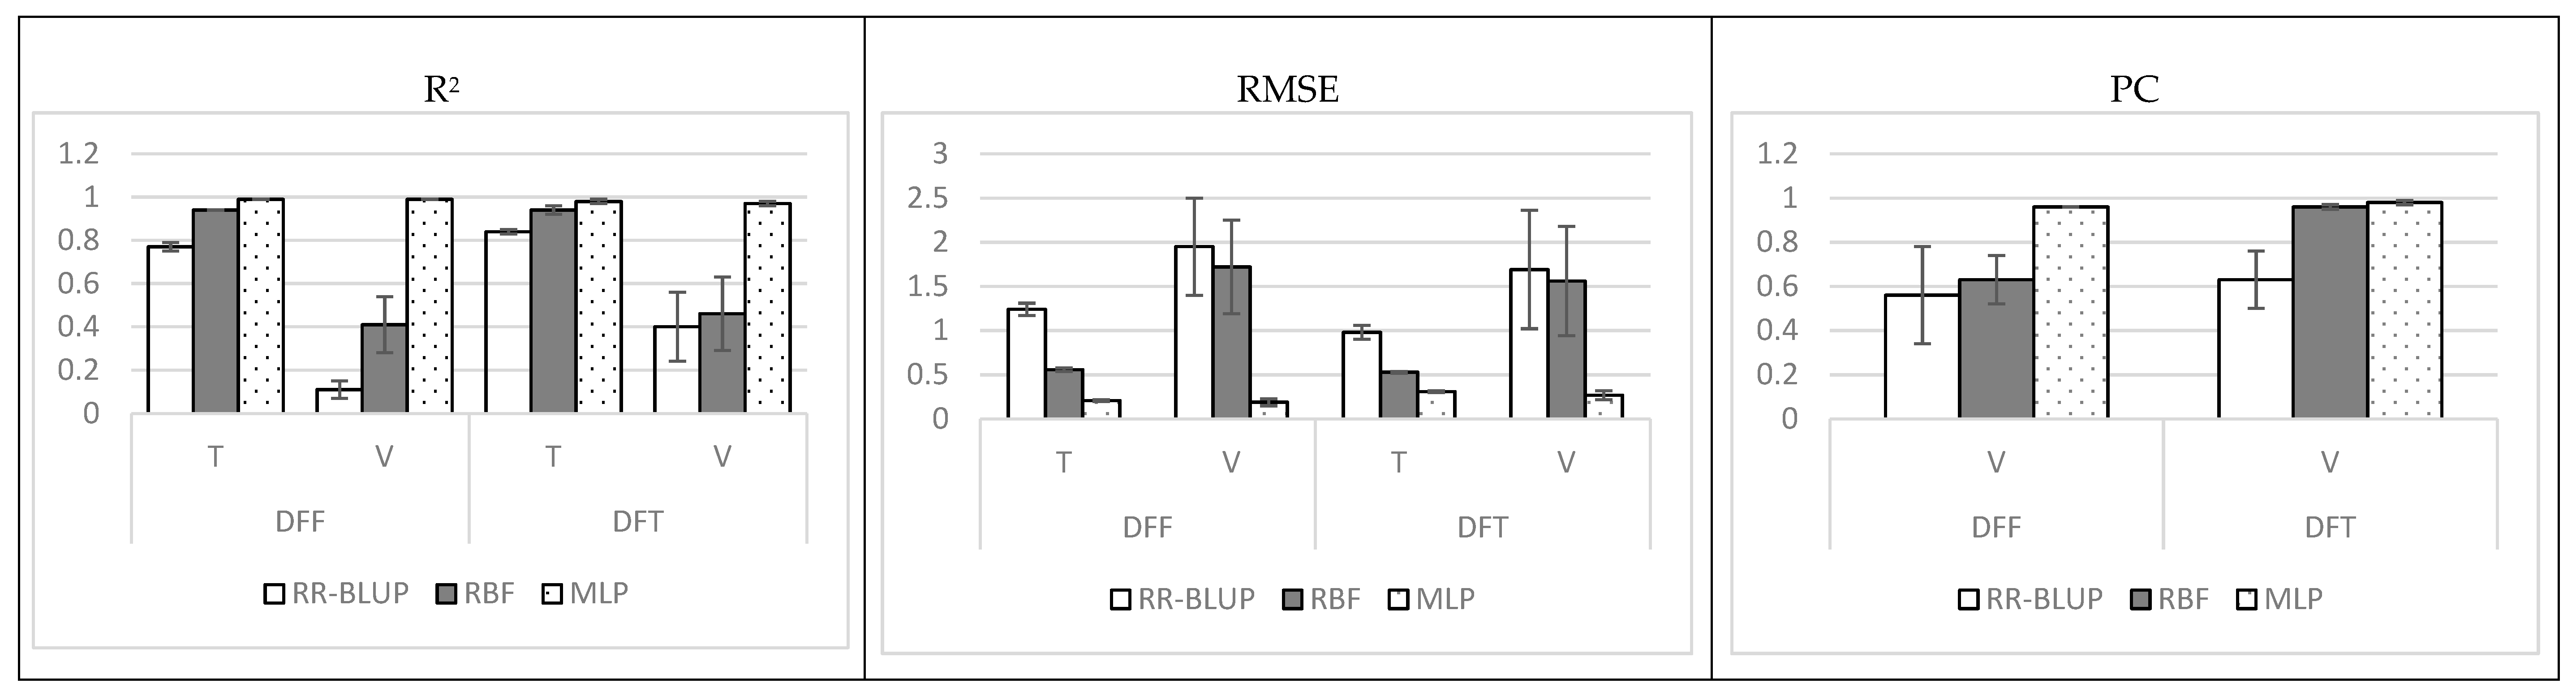
3. Results
4. Discussion
5. Conclusions
Author Contributions
Funding
Acknowledgments
Conflicts of Interest
References
- Garcia Bertoldo, J.; Pelisser, A.; Paz Da Silva, R.; Favreto, R.; Dias De Oliveira, A. Alternatives in bean fertilization to reduce the application of N-urea. Pesqui. Agropecu. Trop. 2015, 45, 348–355. [Google Scholar] [CrossRef]
- Conab Acompanhamento da Safra Brasileira Grãos: Levantamento safra 2018/2019; Conab: Brasilia, Brazil, 2019; ISSN 2318-6852.
- Ramalho, M.A.P.; Dias, L.A.D.S.; Carvalho, B.L. Contributions of plant breeding in Brazil: Progress and perspectives. Crop Breed. Appl. Biotechnol. 2012, 12, 111–120. [Google Scholar] [CrossRef] [Green Version]
- Barili, L.D.; Vale, N.M.; Moura, L.M.; Paula, R.G.; Silva, F.F.; Carneiro, J.E.S. Genetic progress resulting from forty-three years of breeding of the carioca common bean in Brazil. Genet. Mol. Res. 2016, 15, gmr.15038523. [Google Scholar] [CrossRef]
- Buratto, J.S.; Moda-Cirino, V.; Júnior, N.D.S.F.; Prete, C.E.C.; de Faria, R.T. de Agronomic performance and grain yield in early common bean genotypes in Paraná state. Semin. Ciências Agrárias 2007, 28, 373–380. [Google Scholar] [CrossRef] [Green Version]
- Nascimento, A.C.; Nascimento, M.; Azevedo, C.; Silva, F.; Barili, L.; Vale, N.; Carneiro, J.; Cruz, C.; Carneiro, P.C.; Serão, N. Quantile regression applied to genome-enabled prediction of traits related to flowering time in the common bean. Agronomy 2019, 9, 796. [Google Scholar] [CrossRef] [Green Version]
- Nascimento, M.; Nascimento, A.C.C.; Silva, F.F.E.; Barili, L.D.; Vale, N.M.D.; Carneiro, J.E.; Cruz, C.D.; Carneiro, P.C.S.; Serão, N.V.L. Quantile regression for genome-wide association study of flowering time-related traits in common bean. PLoS ONE 2018, 13, e0190303. [Google Scholar] [CrossRef] [Green Version]
- Meuwissen, T.H.E.; Hayes, B.J.; Goddard, M.E. Prediction of total genetic value using genome-wide dense marker maps. Genetics 2001, 157, 1819–1829. [Google Scholar] [PubMed]
- Wang, X.; Xu, Y.; Hu, Z.; Xu, C. Genomic selection methods for crop improvement: Current status and prospects. Crop J. 2018, 6, 330–340. [Google Scholar] [CrossRef]
- Toro, M.A.; Varona, L. A note on mate allocation for dominance handling in genomic selection. Genet. Sel. Evol. 2010, 42, 1–9. [Google Scholar] [CrossRef] [PubMed] [Green Version]
- Gianola, D.; Van Kaam, J.B. Reproducing kernel Hilbert spaces regression methods for genomic assisted prediction of quantitative traits. Genetics 2008, 178, 2289–2303. [Google Scholar] [CrossRef] [PubMed] [Green Version]
- de Almeida Filho, J.E.; Guimarães, J.F.R.; e Silva, F.F.; de Resende, M.D.V.; Muñoz, P.; Kirst, M.; De Resende, M.F.R. Genomic prediction of additive and non-additive effects using genetic markers and pedigrees. G3 Genes Genomes Genet. 2019, 9, 2739–2748. [Google Scholar] [CrossRef] [PubMed] [Green Version]
- Gianola, D.; Okut, H.; Weigel, K.A.; Rosa, G.J.M. Predicting complex quantitative traits with Bayesian neural networks: A case study with Jersey cows and wheat. BMC Genet. 2011, 12, 87. [Google Scholar] [CrossRef] [PubMed] [Green Version]
- Sousa, I.C.D.; Nascimento, M.; Silva, G.N.; Nascimento, A.C.C.; Cruz, C.D.; Almeida, D.P.D.; Pestana, K.N.; Azevedo, C.F.; Zambolim, L.; Caixeta, E.T. Genetics and Plant Breeding Genomic prediction of leaf rust resistance to Arabica coffee using machine learning algorithms. Sci. Agric. 2020, 78, e20200021. [Google Scholar] [CrossRef]
- de Castro Sant’Anna, I.; Nascimento, M.; Silva, G.N.; Cruz, C.D.; Azevedo, C.F.; Gloria, L.S.; e Silva, F.F. Genome-Enabled Prediction of Genetic Values for Using Radial Basis Function Neural Networks. Funct. Plant Breed. J. 2019, 1, 8. [Google Scholar]
- de Castro Sant’Anna, I.; Silva, G.N.; Nascimento, M.; Cruz, C.D. Subset selection of markers for the genome-enabled prediction of genetic values using radial basis function neural networks. Acta Sci. Agron. 2020, 43, 1–10. [Google Scholar] [CrossRef]
- Silva, G.N.; Nascimento, M.; de Castro Sant’Anna, I.; Cruz, C.D.; Caixeta, E.T.; Carneiro, P.C.S.; Rosado, R.D.S.; Pestana, K.N.; de Almeida, D.P.; da Silva Oliveira, M. Artificial neural networks compared with bayesian generalized linear regression for leaf rust resistance prediction in arabica coffee. Pesqui. Agropecu. Bras. 2017, 52, 186–193. [Google Scholar] [CrossRef] [Green Version]
- González-Camacho, J.M.; de Los Campos, G.; Pérez, P.; Gianola, D.; Cairns, J.E.; Mahuku, G.; Babu, R.; Crossa, J. Genome-enabled prediction of genetic values using radial basis function neural networks. Theor. Appl. Genet. 2012, 125, 759–771. [Google Scholar] [CrossRef] [Green Version]
- González-Camacho, J.M.; Crossa, J.; Pérez-Rodríguez, P.; Ornella, L.; Gianola, D. Genome-enabled prediction using probabilistic neural network classifiers. BMC Genom. 2016, 17, 208. [Google Scholar] [CrossRef] [Green Version]
- Krause, W.; Rodrigues, R.; Leal, N.R. Capacidade combinatória para características agronômicas em feijão-de-vagem. Rev. Ciência Agronômica 2012, 43, 522–531. [Google Scholar] [CrossRef] [Green Version]
- Nayak, N.J.; Maurya, P.K.; Maji, A.; Mandal, A.R.; Chattopadhyay, A. Combining Ability and Genetic Control of Pod Yield and Component Traits in Dolichos Bean. Int. J. Veg. Sci. 2018, 24, 390–403. [Google Scholar] [CrossRef]
- Barili, L.D.; Vale, N.M.D.; Prado, A.L.D.; Carneiro, J.E.D.S.; Silva, F.F.; Nascimento, M. Genotype-environment interaction in common bean cultivars with carioca grain, recommended for cultivation in Brazil in the last 40 years. Crop Breed. Appl. Biotechnol. 2015, 15, 244–250. [Google Scholar] [CrossRef] [Green Version]
- Lilliefors, H.W. On the Kolmogorov–Smirnov Test for Normality with Mean and Variance Unknown. J. Am. Stat. Assoc. 1967, 62, 399–402. [Google Scholar] [CrossRef]
- Scott, A.; Knott, M. Cluster-analysis method for grouping means in analysis of variance. Biometrics 1974, 30, 507–512. [Google Scholar] [CrossRef] [Green Version]
- Cruz, C.D. Programa Genes–Ampliado e integrado aos aplicativos R, Matlab e Selegen. Acta Sci. Agron. 2016, 38, 547–552. [Google Scholar] [CrossRef] [Green Version]
- Endelman, J.B. Ridge Regression and Other Kernels for Genomic Selection with R Package rrBLUP. Plant Genome 2011, 4, 250–255. [Google Scholar] [CrossRef] [Green Version]
- Matlab Version 7.10; The Math Works Inc.: Natick, MA, USA, 2011.
- R Core Team. R: A Language and Environment for Statistical Computing. Available online: https://www.R-project.org/ (accessed on 11 March 2020).
- Silva, G.N.; Tomaz, R.S.; Sant’Anna, I.D.C.; Nascimento, M.; Bhering, L.L.; Cruz, C.D. Neural networks for predicting breeding values and genetic gains. Sci. Agric. 2014, 71, 494–498. [Google Scholar] [CrossRef] [Green Version]
- Sant’Anna, I.C.; Tomaz, R.S.; Silva, G.N.; Nascimento, M.; Bhering, L.L.; Cruz, C.D. Superiority of artificial neural networks for a genetic classification procedure. Genet. Mol. Res. 2015, 14, 9898–9906. [Google Scholar] [CrossRef]
- Silva, G.N.; Tomaz, R.S.; Sant’Anna, I.C.; Carneiro, V.Q.; Cruz, C.D.; Nascimento, M. Evaluation of the efficiency of artificial neural networks for genetic value prediction. Genet. Mol. Res. 2016, 15, 1–11. [Google Scholar] [CrossRef]
- Chen, A.H.; Ge, W.; Metcalf, W.; Jakobsson, E.; Mainzer, L.S.; Lipka, A.E. An assessment of true and false positive detection rates of stepwise epistatic model selection as a function of sample size and number of markers. Heredity 2019, 122, 660–671. [Google Scholar] [CrossRef]
- Gianola, D.; de Los Campos, G. Inferring genetic values for quantitative traits non-parametrically. Genet. Res. 2008, 90, 525–540. [Google Scholar] [CrossRef]
- de Los Campos, G.; Gianola, D.; Rosa, G.J.M.; Weigel, K.A.; Crossa, J. Semi-parametric genomic-enabled prediction of genetic values using reproducing kernel Hilbert spaces methods. Genet. Res. 2010, 92, 295–308. [Google Scholar] [CrossRef] [PubMed] [Green Version]
- Olatoye, M.O.; Hu, Z.; Aikpokpodion, P.O. Epistasis detection and modeling for genomic selection in cowpea (Vigna unguiculata L. Walp.). Front. Genet. 2019, 10, 1–14. [Google Scholar] [CrossRef] [PubMed] [Green Version]
- Volis, S.; Shulgina, I.; Zaretsky, M.; Koren, O. Epistasis in natural populations of a predominantly selfing plant. Heredity 2011, 106, 300–309. [Google Scholar] [CrossRef] [PubMed] [Green Version]
- Mathew, B.; Léon, J.; Sannemann, W.; Sillanpää, M.J. Detection of epistasis for flowering time using bayesian multilocus estimation in a barley MAGIC population. Genetics 2018, 208, 525–536. [Google Scholar] [CrossRef] [Green Version]
- Li, X.; Guo, T.; Mu, Q.; Li, X.; Yu, J. Genomic and environmental determinants and their interplay underlying phenotypic plasticity. Proc. Natl. Acad. Sci. USA 2018, 115, 6679–6684. [Google Scholar] [CrossRef] [Green Version]
- Sun, X.; Ma, P.; Mumm, R.H. Nonparametric Method for Genomics-Based Prediction of Performance of Quantitative Traits Involving Epistasis in Plant Breeding. PLoS ONE 2012, 7, e50604. [Google Scholar] [CrossRef]
- Ahsan, A.; Monir, M.; Meng, X.; Rahaman, M.; Chen, H.; Chen, M. Identification of epistasis loci underlying rice flowering time by controlling population stratification and polygenic effect. DNA Res. 2019, 26, 119–130. [Google Scholar] [CrossRef]
- Huang, X.; Ding, J.; Effgen, S.; Turck, F.; Koornneef, M. Multiple loci and genetic interactions involving flowering time genes regulate stem branching among natural variants of Arabidopsis. New Phytol. 2013, 199, 843–857. [Google Scholar] [CrossRef]
- Juenger, T.E.; Sen, S.; Stowe, K.A.; Simms, E.L. Epistasis and genotype-environment interaction for quantitative trait loci affecting flowering time in Arabidopsis thaliana. Genetica 2005, 123, 87–105. [Google Scholar] [CrossRef]
- Durand, E.; Bouchet, S.; Bertin, P.; Ressayre, A.; Jamin, P.; Charcosset, A.; Dillmann, C.; Tenaillon, M.I. Flowering time in maize: Linkage and epistasis at a major effect locus. Genetics 2012, 190, 1547–1562. [Google Scholar] [CrossRef] [Green Version]
- Coutinho, A.E.; Neder, D.G.; Da Silva, M.C.; Arcelino, E.C.; De Brito, S.G.; Filho, J.L.S.D.C. Prediction of phenotypic and genotypic values by BLUP/GWS and neural networks. Rev. Caatinga 2018, 31, 532–540. [Google Scholar] [CrossRef]
- Marini, F.; Zupan, J.; Magrì, A.L. On the use of counterpropagation artificial neural networks to characterize Italian rice varieties. Anal. Chim. Acta 2004, 510, 231–240. [Google Scholar] [CrossRef]
- Barbosa, C.D.; Viana, A.P.; Silva, S.; Quintal, R.; Pereira, M.G. Artificial neural network analysis of genetic diversity in Carica papaya L. Crop Breed. Appl. Biotechnol. 2011, 11, 224–231. [Google Scholar] [CrossRef] [Green Version]
- Kaul, M.; Hill, R.L.; Walthall, C. Artificial neural networks for corn and soybean yield prediction. Agric. Syst. 2005, 85, 1–18. [Google Scholar] [CrossRef]
- Gareth, J.; Hastie, T.; Tibshirani, R.; Witten, D. An Introduction to Statistical Learning; Springer: New York, NY, USA, 2013. [Google Scholar]
- Carneiro, V.Q.; Silva, G.N.; Cruz, C.D.; Carneiro, P.C.S.; Nascimento, M.; Carneiro, J.E.S. Artificial neural networks as auxiliary tools for the improvement of bean plant architecture. Genet. Mol. Res. 2017, 16, gmr16029500. [Google Scholar] [CrossRef]
- Carneiro, V.Q.; Prado, A.L.D.; Cruz, C.D.; Carneiro, P.C.S.; Nascimento, M.; Carneiro, J.E.D.S. Fuzzy control systems for decision-making in cultivars recommendation. Acta Sci. Agron. 2018, 40, 39314. [Google Scholar] [CrossRef]
- Ribeiro, N.D.; Hoffmann, L., Jr.; Possebon, S.B. Genetic variability for cycle in black and Carioca commercial dry bean groups. Rev. Bras. Agrociência 2004, 10, 19–29. [Google Scholar]
- IAPAR. (Instituto Agronômico Do Paraná). Cultivar de Feijão IPR Andorinha. Available online: http://www.iapar.br/modules/conteudo/conteudo.php?conteudo=1960 (accessed on 30 May 2020).
- Delfini, J.; Moda-Cirino, V.; Ruas, C.D.F.; dos Santos Neto, J.; Ruas, P.M.; Buratto, J.S.; Ruas, E.A.; Azeredo Gonçalves, L.S. Distinctness of Brazilian common bean cultivars with carioca and black grain by means of morphoagronomic and molecular descriptors. PLoS ONE 2017, 12, e0188798. [Google Scholar] [CrossRef]
- Vale, N.M.D.; Barili, L.D.; Oliveira, H.M.D.; Carneiro, J.E.D.S.; Carneiro, P.C.S.; Silva, F.L.D. Escolha de genitores quanto à precocidade e produtividade de feijão tipo carioca. Pesqui. Agropecu. Bras. 2015, 50, 141–148. [Google Scholar] [CrossRef] [Green Version]
- Chiorato, A.F.; Carbonell, S.A.M.; Carvalho, C.R.L.; Barros, V.L.N.P.D.; Borges, W.L.B.; Ticelli, M.; Gallo, P.B.; Finoto, E.L.; Santos, N.C.B.D. “IAC IMPERADOR”: Early maturity ‘carioca’ bean cultivar. Crop Breed. Appl. Biotechnol. 2012, 12, 297–300. [Google Scholar] [CrossRef] [Green Version]
- Souza Filho, B.F.d. Indicação de novas cultivares de feijão para o Estado do Rio de Janeiro; Pesagro-Rio: Niterói, Brazil, 1985. Available online: http://www.pesagro.rj.gov.br/downloads/infonline/online48.pdf (accessed on 1 June 2020).
- Silva, F.B.; Ramalho, M.A.P.; Abreu, Â.D.F.B. Seleção recorrente fenotípica para florescimento precoce de feijoeiro “Carioca”. Pesqui. Agropecuária Bras. 2007, 42, 1437–1442. [Google Scholar] [CrossRef]
- dos Santos, J.B.; Vencovsky, R. Controle genético do início do florescimento em feijoeiro. Pesqui. Agropecu. Bras. 1985, 20, 841–845. [Google Scholar]
- Paula, T.D., Jr.; Carneiro, J.D.S.; Vieira, R.; Abreu, A.D.F.; Ramalho, M.; del Peloso, M.J.; Teixeira, H. Cultivares de feijão-comum para Minas Gerais. Available online: https://www.infoteca.cnptia.embrapa.br/bitstream/doc/210485/1/circ65.pdf (accessed on 1 June 2020).


Publisher’s Note: MDPI stays neutral with regard to jurisdictional claims in published maps and institutional affiliations. |
© 2020 by the authors. Licensee MDPI, Basel, Switzerland. This article is an open access article distributed under the terms and conditions of the Creative Commons Attribution (CC BY) license (http://creativecommons.org/licenses/by/4.0/).
Share and Cite
Rosado, R.D.S.; Cruz, C.D.; Barili, L.D.; de Souza Carneiro, J.E.; Carneiro, P.C.S.; Carneiro, V.Q.; da Silva, J.T.; Nascimento, M. Artificial Neural Networks in the Prediction of Genetic Merit to Flowering Traits in Bean Cultivars. Agriculture 2020, 10, 638. https://0-doi-org.brum.beds.ac.uk/10.3390/agriculture10120638
Rosado RDS, Cruz CD, Barili LD, de Souza Carneiro JE, Carneiro PCS, Carneiro VQ, da Silva JT, Nascimento M. Artificial Neural Networks in the Prediction of Genetic Merit to Flowering Traits in Bean Cultivars. Agriculture. 2020; 10(12):638. https://0-doi-org.brum.beds.ac.uk/10.3390/agriculture10120638
Chicago/Turabian StyleRosado, Renato Domiciano Silva, Cosme Damião Cruz, Leiri Daiane Barili, José Eustáquio de Souza Carneiro, Pedro Crescêncio Souza Carneiro, Vinicius Quintão Carneiro, Jackson Tavela da Silva, and Moyses Nascimento. 2020. "Artificial Neural Networks in the Prediction of Genetic Merit to Flowering Traits in Bean Cultivars" Agriculture 10, no. 12: 638. https://0-doi-org.brum.beds.ac.uk/10.3390/agriculture10120638