Validation of an Automated Body Condition Scoring System Using 3D Imaging

 , ,
, ,
Abstract
:1. Introduction
2. Materials and Methods
2.1. Data Collection
2.2. Data Analysis
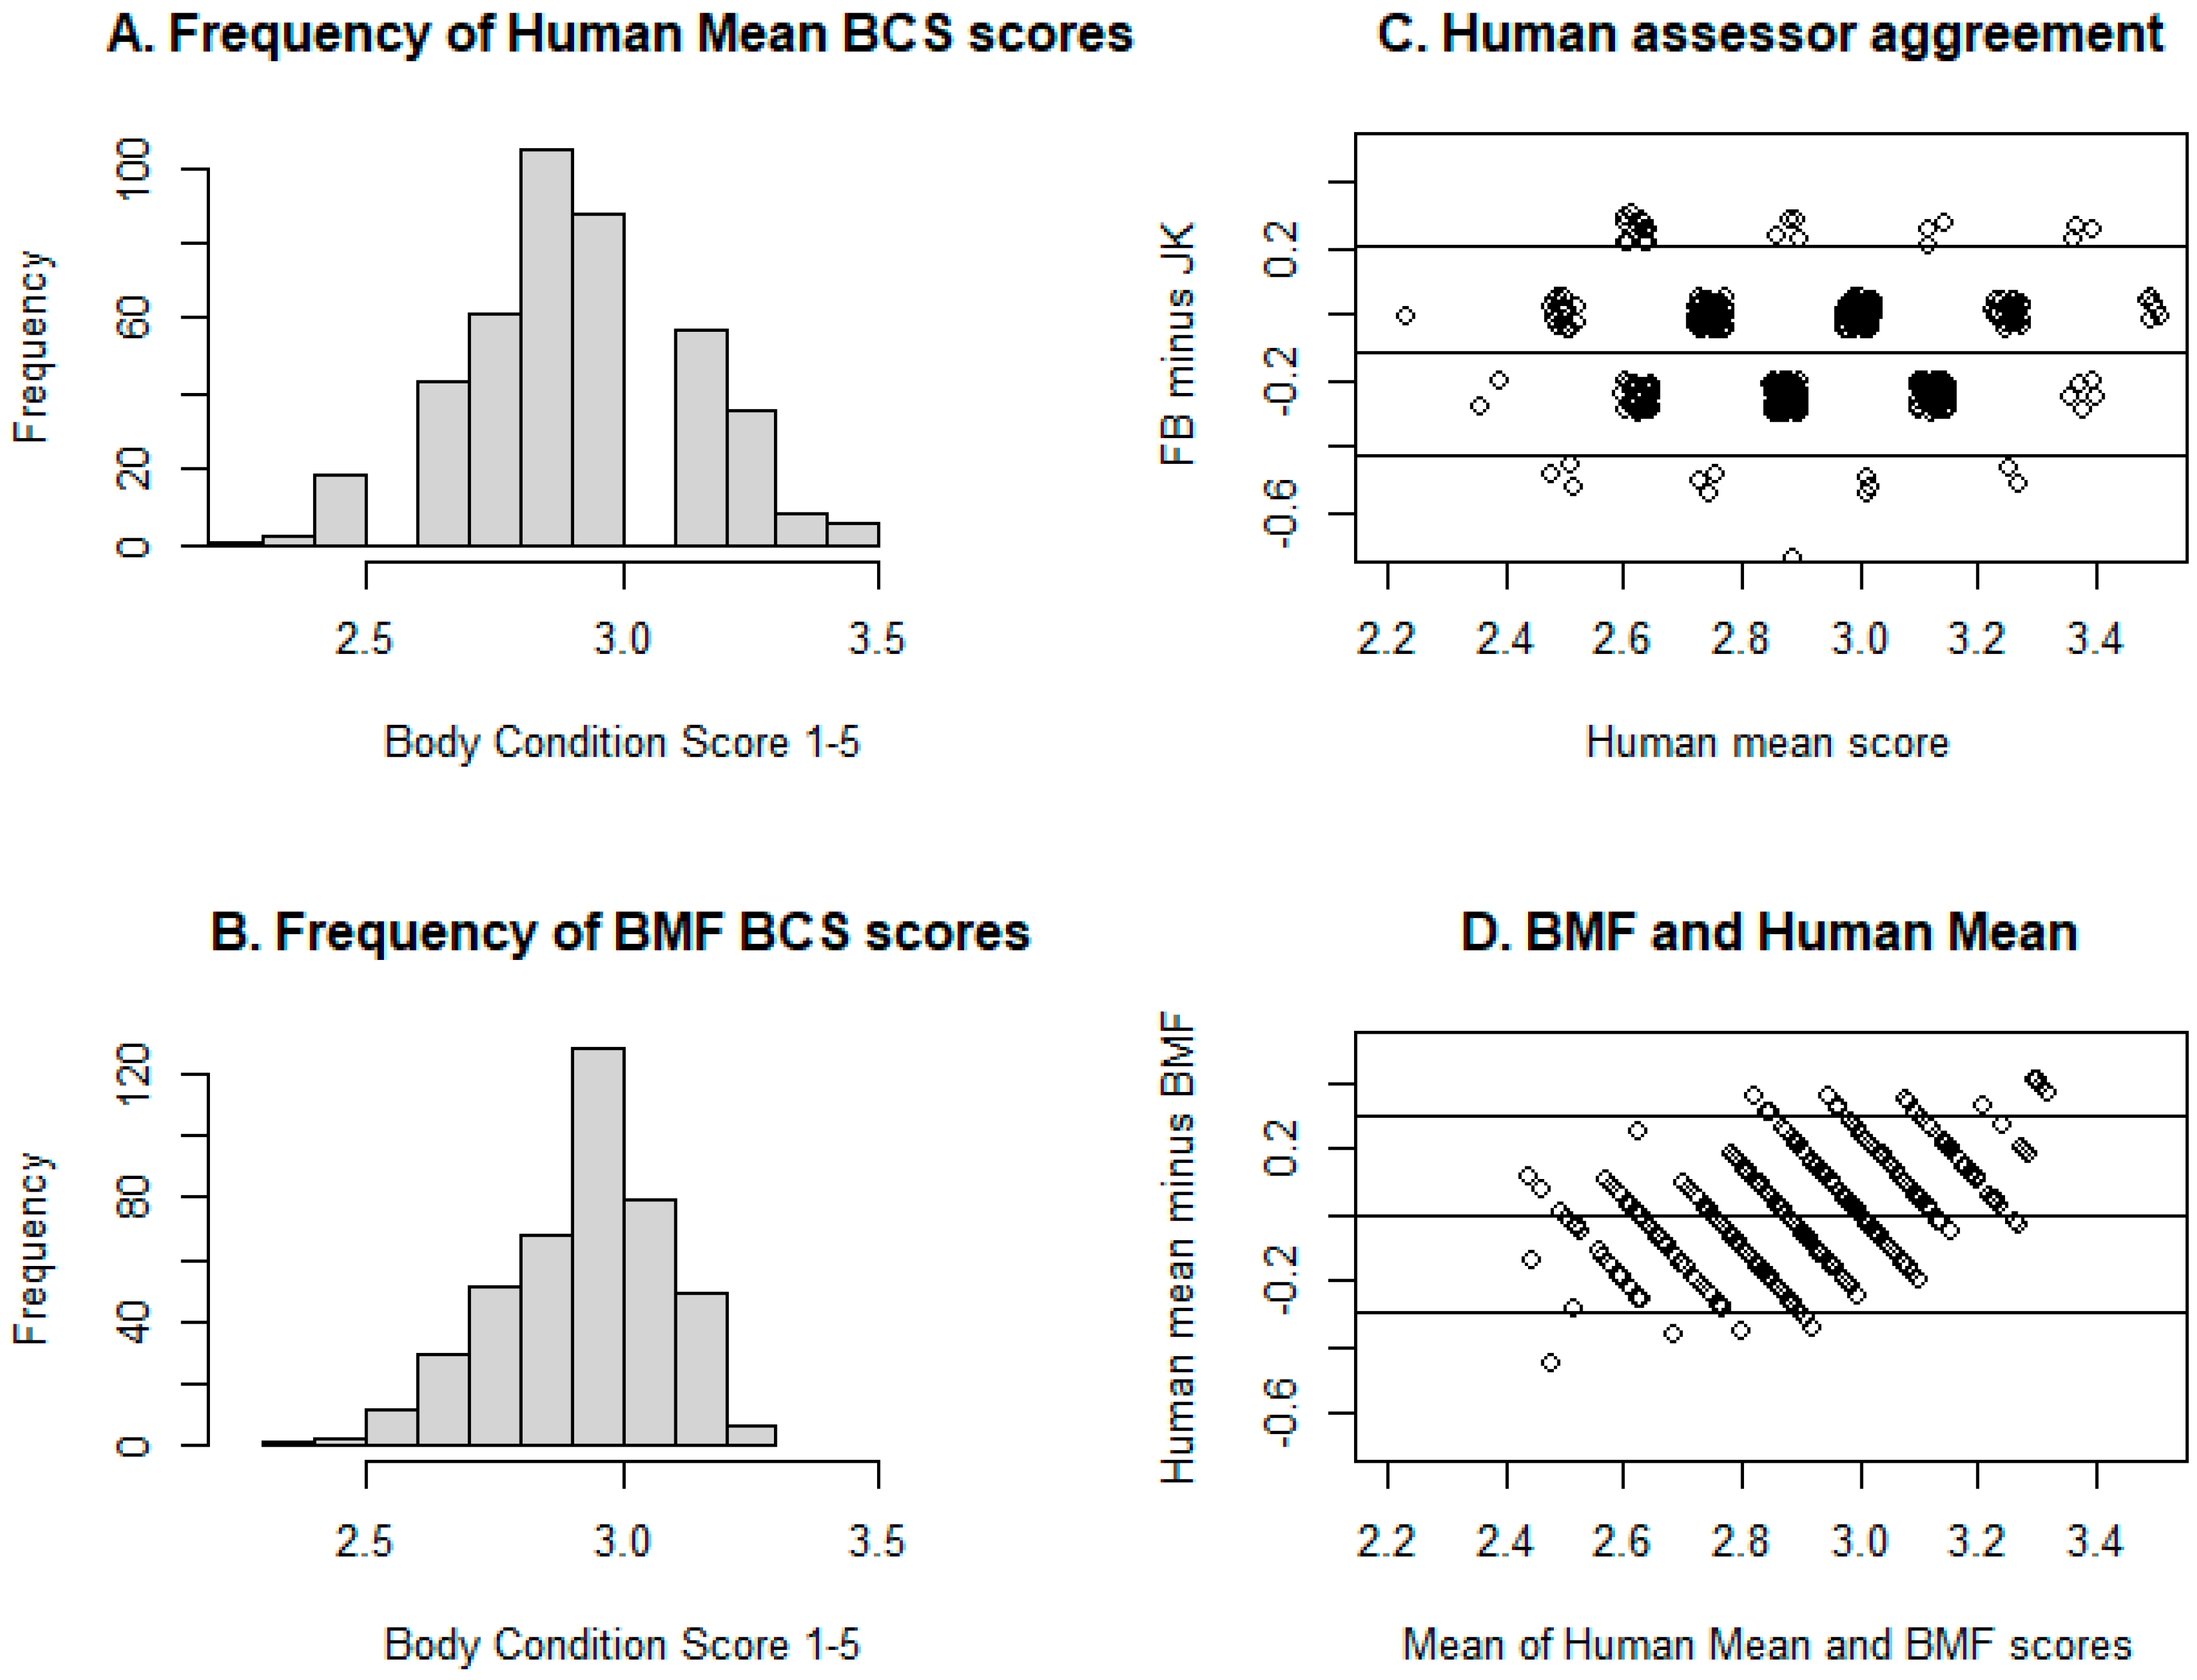
3. Results
4. Discussion
5. Conclusions
Author Contributions
Funding
Acknowledgments
Conflicts of Interest
References
- Somers, J.R.; Huxley, J.; Lorenz, I.; Doherty, M.L.; O’Grady, L. The effect of lameness before and during the breeding season on fertility in 10 pasture-based Irish dairy herds. Ir. Vet. J. 2015, 68, 14. [Google Scholar] [CrossRef] [PubMed] [Green Version]
- Bewley, J.M.; Schutz, M.M. An Interdisciplinary Review of Body Condition Scoring for Dairy Cattle. Prof. Anim. Sci. 2008, 24, 507–529. [Google Scholar] [CrossRef] [Green Version]
- Roche, J.R.; Dillon, P.G.; Stockdale, C.R.; Baumgard, L.H.; VanBaale, M.J. Relationships Among International Body Condition Scoring Systems. J. Dairy Sci. 2004, 87, 3076–3079. [Google Scholar] [CrossRef] [Green Version]
- Vasseur, E.; Gibbons, J.; Rushen, J.; de Passillé, A.M. Development and implementation of a training program to ensure high repeatability of body condition scoring of dairy cows. J. Dairy Sci. 2013, 96, 4725–4737. [Google Scholar] [CrossRef] [PubMed] [Green Version]
- Roche, J.R.; Friggens, N.C.; Kay, J.K.; Fisher, M.W.; Stafford, K.J.; Berry, D.P. Invited review: Body condition score and its association with dairy cow productivity, health, and welfare. J. Dairy Sci. 2009, 92, 5769–5801. [Google Scholar] [CrossRef] [PubMed] [Green Version]
- Shalloo, L.; O’Donovan, M.; Leso, L.; Werner, J.; Ruelle, E.; Geoghegan, A.; Delaby, L.; O’Leary, N. Review: Grass-based dairy systems, data and precision technologies. Animal 2018, 12, S262–S271. [Google Scholar] [CrossRef] [PubMed] [Green Version]
- Halachmi, I.; Klopčič, M.; Polak, P.; Roberts, D.J.; Bewley, J.M. Automatic assessment of dairy cattle body condition score using thermal imaging. Comput. Electron. Agric. 2013, 99, 35–40. [Google Scholar] [CrossRef]
- Anglart, D. Automatic estimation of body weight and body condition score in dairy cows using 3D imaging technique. Master’s Thesis, Sveriges Lantbruksuniversitet, Uppsala, 2010. [Google Scholar]
- Spoliansky, R.; Edan, Y.; Parmet, Y.; Halachmi, I. Development of automatic body condition scoring using a low-cost 3-dimensional Kinect camera. J. Dairy Sci. 2016, 99, 7714–7725. [Google Scholar] [CrossRef] [PubMed]
- Alvarez, J.R.; Arroqui, M.; Mangudo, P.; Toloza, J.; Jatip, D.; Rodriguez, J.M.; Teyseyre, A.; Sanz, C.; Zunino, A.; Machado, C.; et al. Estimating body condition score in dairy cows from depth images using convolutional neural networks, transfer learning and model ensembling techniques. Agronomy 2019, 9, 90. [Google Scholar] [CrossRef] [Green Version]
- Mullins, I.L.; Truman, C.M.; Campler, M.R.; Bewley, J.M.; Costa, J.H.C. Validation of a commercial automated body condition scoring system on a commercial dairy farm. Animals 2019, 9, 287. [Google Scholar] [CrossRef] [PubMed] [Green Version]
- Bazin, S.; Augeard, P.; Carteua, M.; Champion, H.; Chilliard, Y.; Cuylle, G.; Disenhaus, C.; Durand, G.; Espinasse, A.; Gascoin, A.; et al. Grille de Notation de l’état d’engraissement des Vaches Pie-noires; RNED bovin: Paris, France, 1984. [Google Scholar]
- Lowman, B.G.; Scott, N.A.; Somerville, S.H. Condition Scoring of Cattle; Edinburgh School of Agriculture: Edinburgh, UK, 1976; ISBN 0902164236 9780902164239. [Google Scholar]
- R Core Team. R: A Language and Environment for Statistical Computing; R Core Team: Vienna, Austria, 2017. [Google Scholar]
- O’Leary, N. BMF Data and Analysis. Available online: https://github.com/nialloleary/BMFValidation (accessed on 1 May 2020).
- Halachmi, I.; Polak, P.; Roberts, D.J.; Klopcic, M. Cow Body Shape and Automation of Condition Scoring. J. Dairy Sci. 2008, 91, 4444–4451. [Google Scholar] [CrossRef] [PubMed] [Green Version]
- Myles, P.S.; Cui, J.I. Using the Bland-Altman method to measure agreement with repeated measures. Br. J. Anaesth. 2007, 99, 309–311. [Google Scholar] [CrossRef] [Green Version]
- Nutter, B. Bland-Altman Method to Measure Agreement with Repeated Measures; R Core Team: Vienna, Austria, 2008. [Google Scholar]
- Carrasco, J.L.; Puig-Martinez, J. cccrm: Concordance Correlation Coefficient for Repeated (and Non-Repeated) Measures; R Core Team: Vienna, Austria, 2015. [Google Scholar]
- McAlinden, C.; Khadka, J.; Pesudovs, K. Precision (repeatability and reproducibility) studies and sample-size calculation. J. Cataract. Refract. Surg. 2015, 41, 2598–2604. [Google Scholar] [CrossRef]
- McBride, G. A Proposal for Strength-Of-Agreement Criteria for Lin’s Concordance Correlation Coefficient; National Institute of Water & Atmospheric Research Ltd.: Hamilton, New Zealand, 2005. [Google Scholar]
- Buckley, F.; O’Sullivan, K.; Mee, J.F.; Evans, R.D.; Dillon, P. Relationships Among Milk Yield, Body Condition, Cow Weight, and Reproduction in Spring-Calved Holstein-Friesians. J. Dairy Sci. 2003, 86, 2308–2319. [Google Scholar] [CrossRef]
- Miller, G.A.; Hyslop, J.J.; Barclay, D.; Edwards, A.; Thomson, W.; Duthie, C.A. Using 3D Imaging and Machine Learning to Predict Liveweight and Carcass Characteristics of Live Finishing Beef Cattle. Front. Sustain. Food Syst. 2019, 3, 1–9. [Google Scholar] [CrossRef] [Green Version]
- Ferguson, J.D. Implementation of a Body Condition Scoring Program in Dairy Herds James. In Proceedings of the Penn Annual Conference, Philadelphia, PA, USA, 24–25 January 1996; University of Pennsylvania, Center for Animal Health and Productivity: Kennett Square, PA, USA, 1996. [Google Scholar]


| Apr 12th | Apr 26th | May 10th | Jun 7th | Jul 19th | Aug 16th | Oct 11th | Nov 1st | Nov 8th | Dec 6th | Total | |
|---|---|---|---|---|---|---|---|---|---|---|---|
| FB | 97 | 5 | 93 | 92 | 66 | 80 | 62 | 62 | 0 | 3 | 560 |
| JK | 97 | 0 | 92 | 91 | 70 | 80 | 0 | 0 | 46 | 0 | 476 |
| BMF | 102 | 5 | 99 | 94 | 72 | 82 | 65 | 62 | 47 | 3 | 1945 * |
| Mean | Median | Min | Max | 1st Qu. | 3rd Qu. | |
|---|---|---|---|---|---|---|
| Days in milk | 62.39 | 62 | 36 | 90 | 55 | 71 |
| Cow lactation | 2.6 | 3 | 1 | 5 | 1 | 4 |
| FB assessor BCS scores | 2.9 | 3 | 2.5 | 3.5 | 2.75 | 3 |
| JK assessor BCS scores | 2.94 | 3 | 2.5 | 3.5 | 2.75 | 3 |
| Mean assessor BCS scores | 2.89 | 2.91 | 2.44 | 3.24 | 2.8 | 2.98 |
| BMF BCS scores (converted) | 2.92 | 3 | 2.5 | 3.5 | 2.75 | 3 |
| Week of 12 April to Week of 10 May | Week of 10 May to Week of 7 June | |
|---|---|---|
| BMF | 0.006 (0.016) | 0.004 (0.012) |
| Mean of FB and JK | 0.009 (0.026) | 0.007 (0.022) |
| FB | 0.012 (0.033) | 0.012 (0.033) |
| JK | 0.013 (0.037) | 0.010 (0.026) |
| FB | JK | JK FB mean | FB | JK | JK FB Mean | |
|---|---|---|---|---|---|---|
| CCC | CCC | CCC | r | r | r | |
| JK | 0.67 (0.59–0.73) | 0.76 | ||||
| BMF | 0.57 (0.47–0.66) | 0.57 (0.47–0.66) | 0.67 (0.58–0.75) | 0.67 | 0.69 | 0.72 |
© 2020 by the authors. Licensee MDPI, Basel, Switzerland. This article is an open access article distributed under the terms and conditions of the Creative Commons Attribution (CC BY) license (http://creativecommons.org/licenses/by/4.0/).
Share and Cite
O’ Leary, N.; Leso, L.; Buckley, F.; Kenneally, J.; McSweeney, D.; Shalloo, L. Validation of an Automated Body Condition Scoring System Using 3D Imaging. Agriculture 2020, 10, 246. https://0-doi-org.brum.beds.ac.uk/10.3390/agriculture10060246
O’ Leary N, Leso L, Buckley F, Kenneally J, McSweeney D, Shalloo L. Validation of an Automated Body Condition Scoring System Using 3D Imaging. Agriculture. 2020; 10(6):246. https://0-doi-org.brum.beds.ac.uk/10.3390/agriculture10060246
Chicago/Turabian StyleO’ Leary, Niall, Lorenzo Leso, Frank Buckley, Jonathon Kenneally, Diarmuid McSweeney, and Laurence Shalloo. 2020. "Validation of an Automated Body Condition Scoring System Using 3D Imaging" Agriculture 10, no. 6: 246. https://0-doi-org.brum.beds.ac.uk/10.3390/agriculture10060246