Article

Inline Milk Lactose Concentration as Biomarker of the Health Status and Reproductive Success in Dairy Cows

by
Mindaugas Televičius
1,*,
Vida Juozaitiene
2,
Dovilė Malašauskienė
1,
Ramunas Antanaitis
1,
Arūnas Rutkauskas
1,
Mingaudas Urbutis
1 and
Walter Baumgartner
3
1
Large Animal Clinic, Veterinary Academy, Lithuanian University of Health Sciences, Tilžės 18, LT-47181 Kaunas, Lithuania
2
Department of Animal Breeding, Veterinary Academy, Lithuanian University of Health Sciences, Tilžės 18, LT-47181 Kaunas, Lithuania
3
University Clinic for Ruminants, University of Veterinary Medicine, Veterinaerplatz 1, A-1210 Vienna, Austria
*
Author to whom correspondence should be addressed.
Submission received: 6 December 2020 / Revised: 29 December 2020 / Accepted: 5 January 2021 / Published: 8 January 2021

Abstract

:
In this study, cow reticulorumen content pH and temperature together with the activity were registered using smaXtec boluses, specially designed for animal care. Body weight, rumination time, milk fat/protein ratio, milk yield, milk lactose, milk electrical conductivity, milk somatic cell count and consumption of concentrated feed were registered by Lely Astronaut® A3 milking robots. The cows in this study were assigned into two groups according to the milk lactose concentration: group 1—milk lactose < 4.70% (n = 20), group 2—milk lactose ≥ 4.70% (n = 15). The following cows were further classified according to milk fat and protein ratio: F/P < 1.2 (class 1), F/P = 1.2 (class 2) and F/P > 1.2 (class 3). According to our results, we can conclude that inline registered milk lactose concentration can be used to indicate the health status and reproductive success of fresh dairy cows. Cows with an increased lactose concentration (≥4.70%) showed more activity (54.47%) and had less risk of mastitis (determined by lower milk electrical conductivity (EC) and somatic cell counts (SCC)) and metabolic disorders, determined by milk F/P. A higher glucose concentration was also apparent in the cows with higher lactose concentration. Registered lower levels of milk lactose can be used for early identification of metabolic disorders and mastitis (set at milk SCC ≥ 100 thousand/mL). Lactose levels in cows’ milk were positively associated with their reproductive success.

1. Introduction

Precision livestock farming (PLF) is defined as the use of real-time monitoring technologies to manage the smallest production unit—in other words, approaching an individual animal with the help of sensors. PLF technology has tremendous potential in creating added value for many stakeholders, mostly as a management tool fit for farmers, providing a better possibility to improve animal welfare, efficiency and health and to diminish the environmental impact [1]. One part of PLF is an automatic milking system (AMS). AMSs and automatic milking rotary (AMR) parlors are the most recent technological innovations, providing more frequent milking events with a decreased need for human labor. To date, scientific research has looked into various aspects of AMS technology and its effect on herd health, milk quality, welfare, management and behavior [2]. Previous management and milking systems were not able to gather and provide detailed information about each individual cow, unlike nowadays’ used automatic sensors, which amass data about udder health, reproductive status, milk production, feed intake and body weight [3]. As a result, this allows for a more detailed monitoring of an individual animal’s health and production status. The milking robot is a classic PLF application and one of the types of AMSs: in this situation, one single quarter of an udder is considered the smallest manageable production unit [4]. At the beginning of this century, a simulation optimization based on animal behavior was developed for robotic milking farms [5]. In robotic milking, the following parameters are usually recorded: milk lactose, milk content, milk protein, milk fat, electrical conductivity and somatic cell count. Milk lactose is one of the major bovine milk solids, and its concentration in milk and synthesis are affected greatly by udder health and the cow’s metabolism and energy balance. Since milk lactose is related to several biological and physiological factors, information on milk lactose in the literature is provided considering its chemical properties, heritability and genetic associations with health traits that play a role in breeding [6]. Several studies have delved into the relationship of lactose content with fertility [7]. Some studies state that lactose percentage seemed a good predictor of days to first and second postpartum ovulation [8]. Higher percentage of lactose was associated with increased pregnancy rate [9] and an increased lactose concentration in the first 8 weeks postpartum correlated with early luteal response in second-parity cows [10]. Not only that, but the fat to lactose ratio has been described as an indicator of subclinical and clinical ketosis [11] and provided the best estimation of energy balance [12]. It has been reported that milk lactose concentrations decrease and somatic cell counts (SCC) increase during clinical and subclinical mastitis [13]. Thus, the monitoring of lactose concentrations in milk could be used as an indicator of mastitis, as a clear decrease is noted during inflammation [13]. Monitoring the lactose levels may help in the quality control and management of farms, helping in the identification of low-quality milk [14] and energy inefficiencies [15,16]. In the literature, we found very little information about the relation between inline milk lactose concentration and health as well as reproduction statuses in dairy cows. According to this, the aim of this current study was to evaluate the relationship of an inline registered milk lactose concentration with biomarkers from an AMS and to determine the ability to use milk lactose concentration as an indicator of health status and reproduction success of fresh dairy cows.

2. Materials and Methods

2.1. Location, Animals and Experimental Design

The research was carried out in accordance with the provisions of the Law on Animal Welfare and Protection of the Republic of Lithuania (Official Gazette Valstybes žinios, 1997, No. 108–2728; 2012, No. 122–6126). The 22 September Directive 2010/63/EU of the European Parliament and of the Council on the protection of animals used for scientific purposes (OJ 2010 L 276, p. 33) was adhered to, as well as adhering to the European Convention for the protection of vertebrate animals used for experimental and other scientific purposes (Official Journal 2007, No 49)–1883, No. 49–1884). The study approval number is PK016965.
The study was carried out during the summer period from 2019.09.01–2019.10.01. The experiment took place on a dairy farm in the Kaunas region, Lithuania 54.9753923, 23.7662303. A total of 35 Lithuanian Black and White dairy cows (1–30 days postpartum) having had two or more lactations (on average 2.9 ± 0.13 lactations) and being clinically healthy were included in the study. Selected cows were tested in two stages: A (1–30 d.p.p.) and B (30 d.p.p.—until insemination). The average BW of all cows was 649.14 ± 18.92 kg, and the level of milk SCC was less than 200 thousand/mL. The cows were housed in a loose system and fed total mixed ration (TMR) twice daily, at 06:00 h and 18:00 h. A basic total mixed ration was fed to high-producing, multiparous cows that consisted primarily of 50% grain concentrate mash, alfalfa hay (13% protein), 10% grass silage, sugar beet pulp silage, 30% corn silage, 4% grass hay wheat straw and compound feed. The feed ration was balanced to fit the energy and nutrient requirements of a 550–650 kg Holstein cow producing, on average, 35 kg/day of milk throughout the experimental period. Chemical composition of the ration was as follows: 47.8% dry matter (DM); 29.02 (% of DM) neutral detergent fiber; 37.8 (% of DM) crude protein; acid detergent fiber non-fiber carbohydrates 17.5 (% of DM); 1.8 (Mcal/kg) net energy for lactation. Two kg/d of concentrates were fed to cows by the milking robot. The average cow milk production was 35 kg/d.

2.2. Measurements

The temperature, pH of the contents of cow reticulorumen and cow activity were registered using specific smaXtec boluses, specially manufactured for animal care. SmaXtec animal care technology® enables the continuous real-time monitoring of various data such as ruminal pH and temperature. According to the instructions provided by the manufacturer, the boluses were inserted into the reticulorumen of the studied cows using a specific tool. Specific antennas (smaXtec animal care technology®) were used to receive the data from the indwelling boluses (smaXtec animal care GmbH, Graz, Austria). The system was controlled by a microprocessor. The data for pH and temperature changes were collected using an analogue-to-digital converter (A/D converter) and stored in an external memory chip. Due to its small dimensions (a length of 12 cm, width: 3.5 cm, weight: 210 g), this indwelling system can be easily orally administered to an adult cow and its special build makes it shock-proof and resistant to rumen fluid. At the beginning of the experiment, the pH probes had to be calibrated using pH 4 and pH 7 buffer solutions. The data were registered every 10 min daily. All data were collected and displayed by smaXtec messenger® computer software.
The cows were milked with free-traffic Lely Astronaut® A3 milking robots. Parameters such as rumination time (RT), milk yield (MY), body weight (BW), milk lactose (L), milk somatic cell count (SCC), milk electrical conductivity (EC) of all quarters of the udders (front left (FL), front right (FR), rear left (RL), rear right (RR)), milk fat/protein ratio (F/P) and consumption of concentrates were registered with the help of Lely Astronaut® A3 milking robots each time the cow was being milked.
Cows were inseminated upon detection of one or more behavioral and physical signs of estrus such as: increased activity, jumping on other cows, transparent mucus on the root of the tail, congestion of vulval mucous membrane and uterine tone, and according to the information of the automatic milking system. Cow pregnancy was examined using an ultrasound “Easy scan” (IMV imaging, Scotland) 30–35 days after insemination.
From 1500 cows, according to the level of lactose in milk, cows were assigned into two groups: group 1—milk lactose < 4.70% (n = 20), group 2—milk lactose ≥ 4.70% (n = 15).
Data of cows were also grouped by milk fat and protein ratio: F/P < 1.2 (class 1), F/P = 1.2 (class 2) and F/P > 1.2 (class 3).

2.3. Data Analysis and Statistics

The statistical analysis of data was performed using the SPSS 25.0 (SPSS Inc., Chicago, IL, USA) program package. Mean values recorded by milking robots (RT; BW; MY; F/P; L; SCC; EC), averaged from 30 days after calving until insemination, were used in the study. Normal distributions were assessed using the Kolmogorov–Smirnov test, using descriptive statistics. The results were provided as the mean ± standard error of the mean (M±SE). Student’s t-test was used to analyze the differences in mean values of normal distributed variables. A probability of less than 0.05 was considered reliable (P < 0.05).
The Pearson correlation (r) was determined to define the linear relationship of milk lactose with reticulorumen parameters such as pH and temperature (T) as well as biomarkers from the AMS: milk yield (MY), milk fat, milk protein and milk fat and protein ratio (F/P), electrical conductivity of milk (EC) at udder quarters level (right front, left front, right rear, left rear), activity of cows, consumption of concentrates (CC) and rumination time (RT). The relationship between the SCC class of milk (SCC < 100 thousand/mL or SCC ≥ 100 thousand/mL) and a group of cows by milk lactose level was evaluated using Pearson’s χ2 test.
A binary logistic regression method was executed using milk lactose level as a dependent variable to project the relationship between SCC and F/P levels in cows’ milk. Estimates were used to calculate odds ratios (ORs).

3. Results

The average productivity of cows was 40.94 ± 1.07 kg, milk fat concentration—4.46 ± 0.106%, milk protein—3.66 ± 0.034%, milk lactose—4.65 ± 0.009%, and milk fat and protein ratio—1.22 ± 0.029.

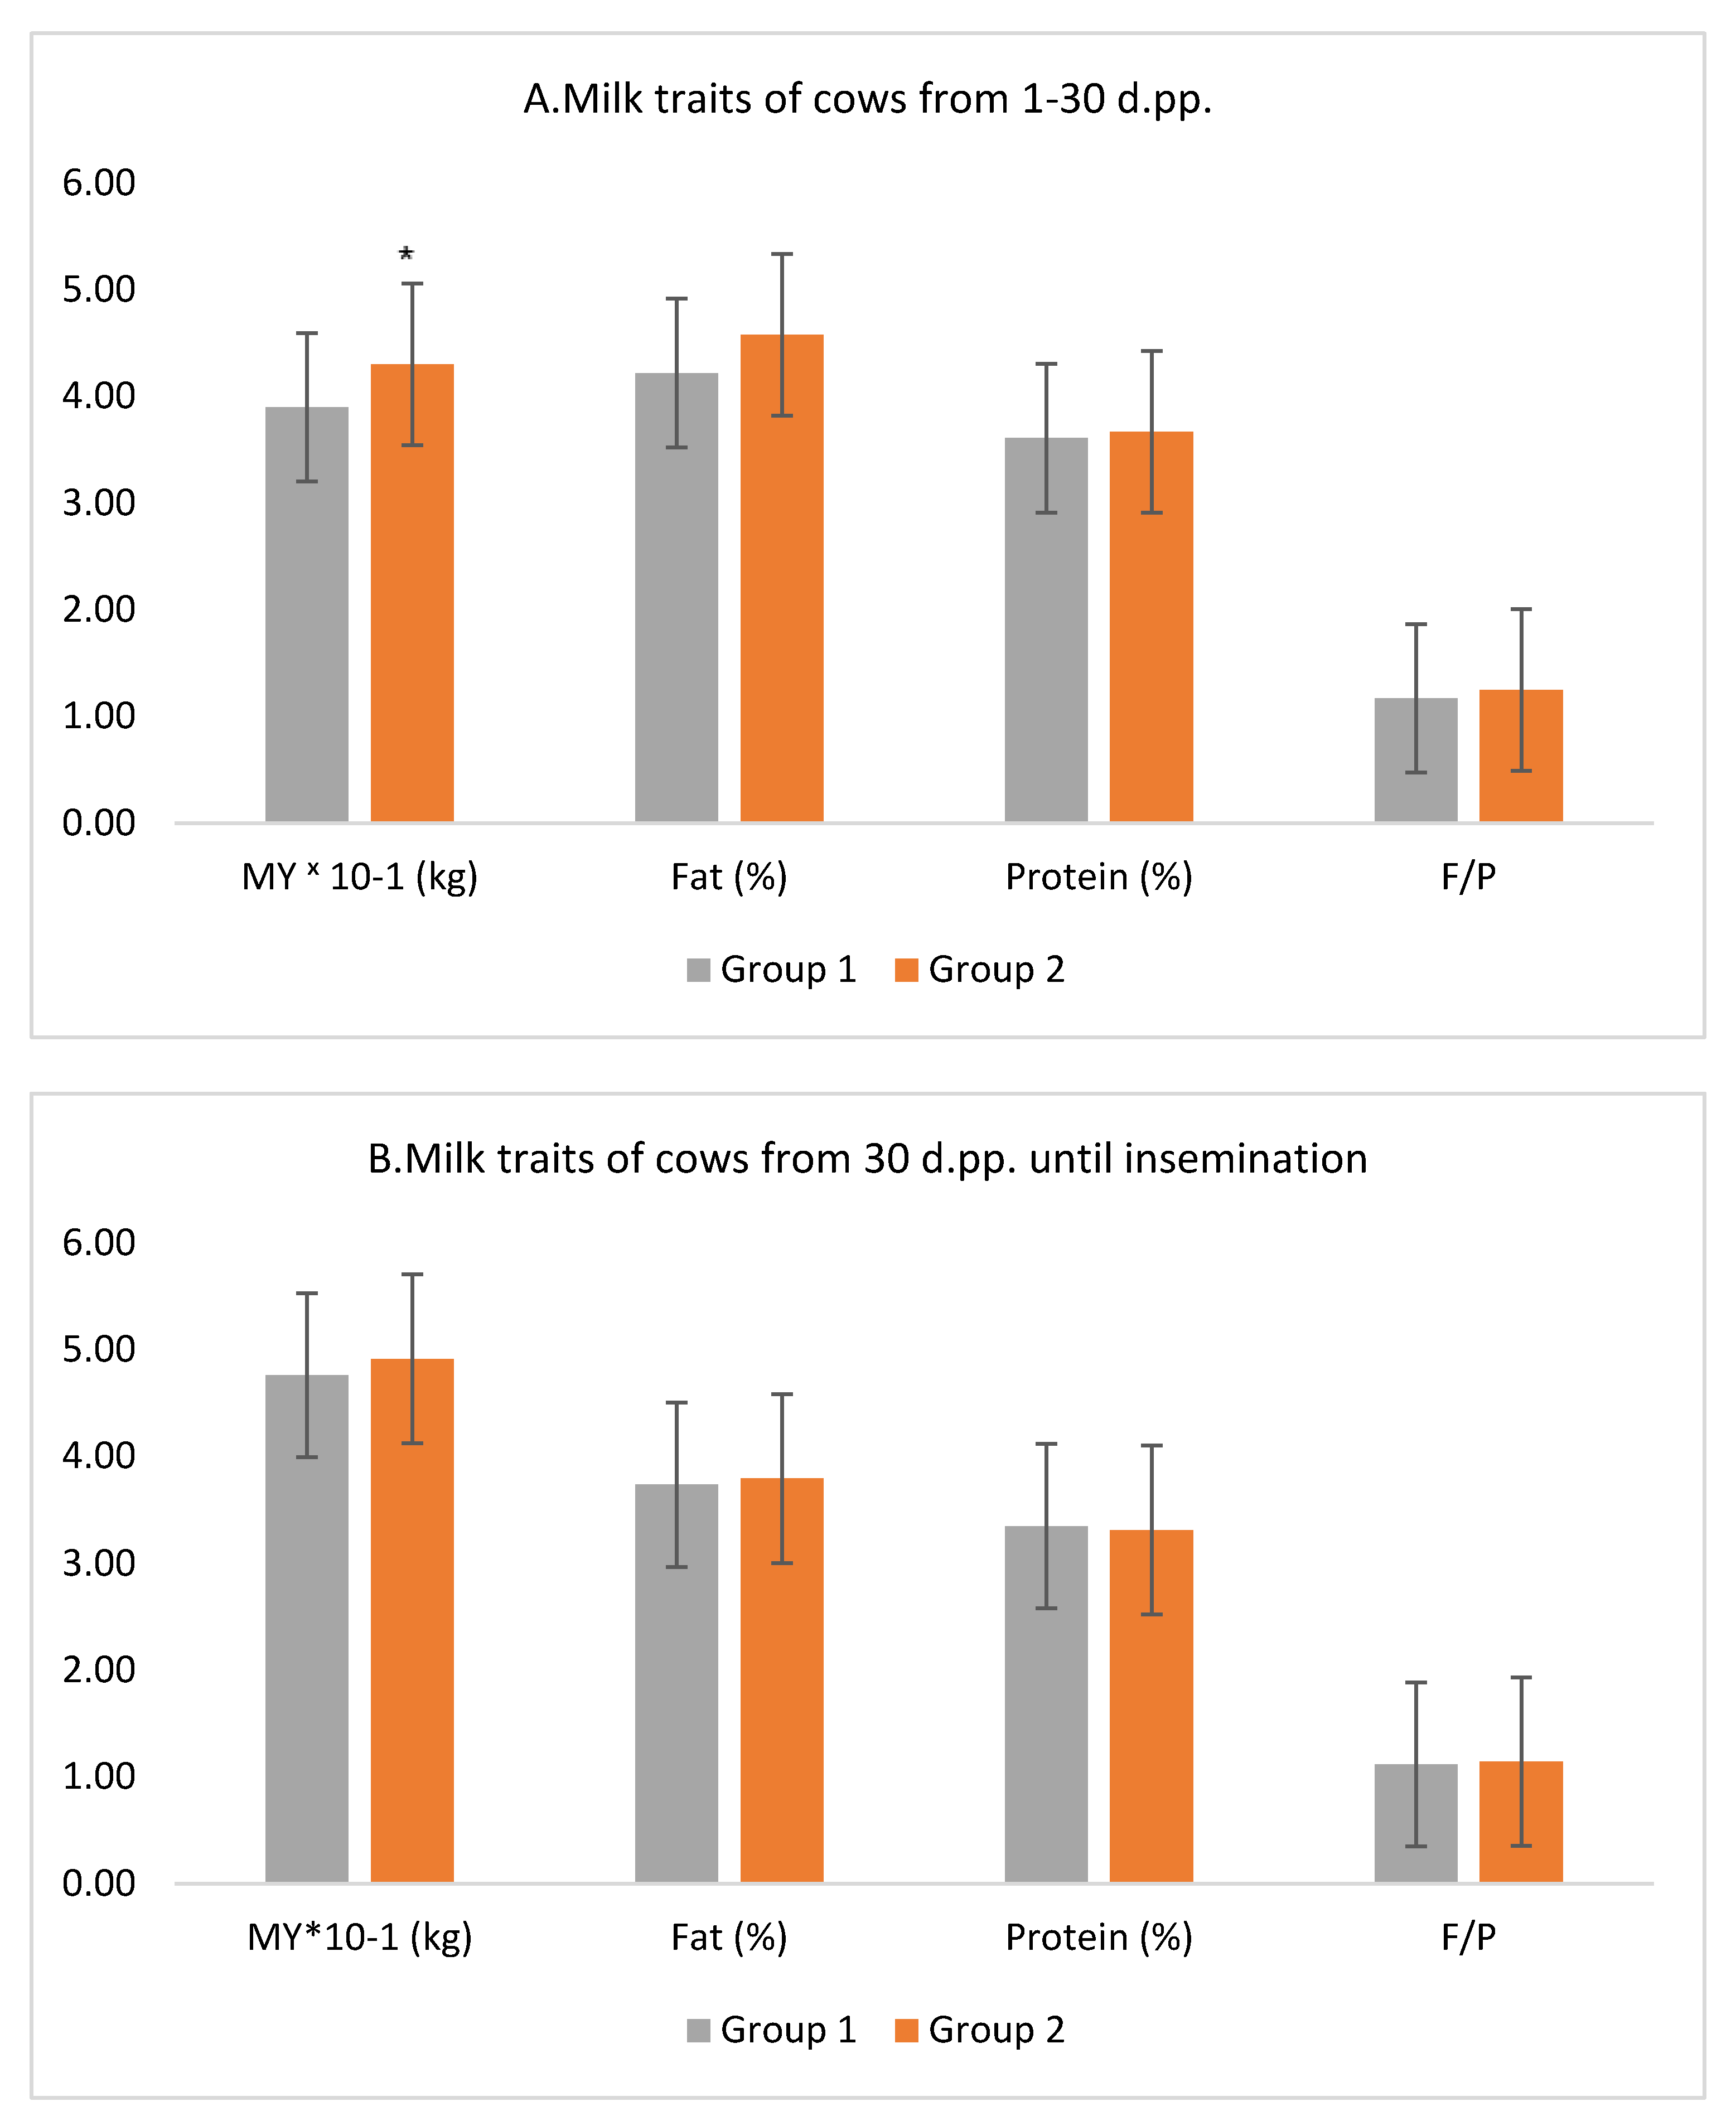
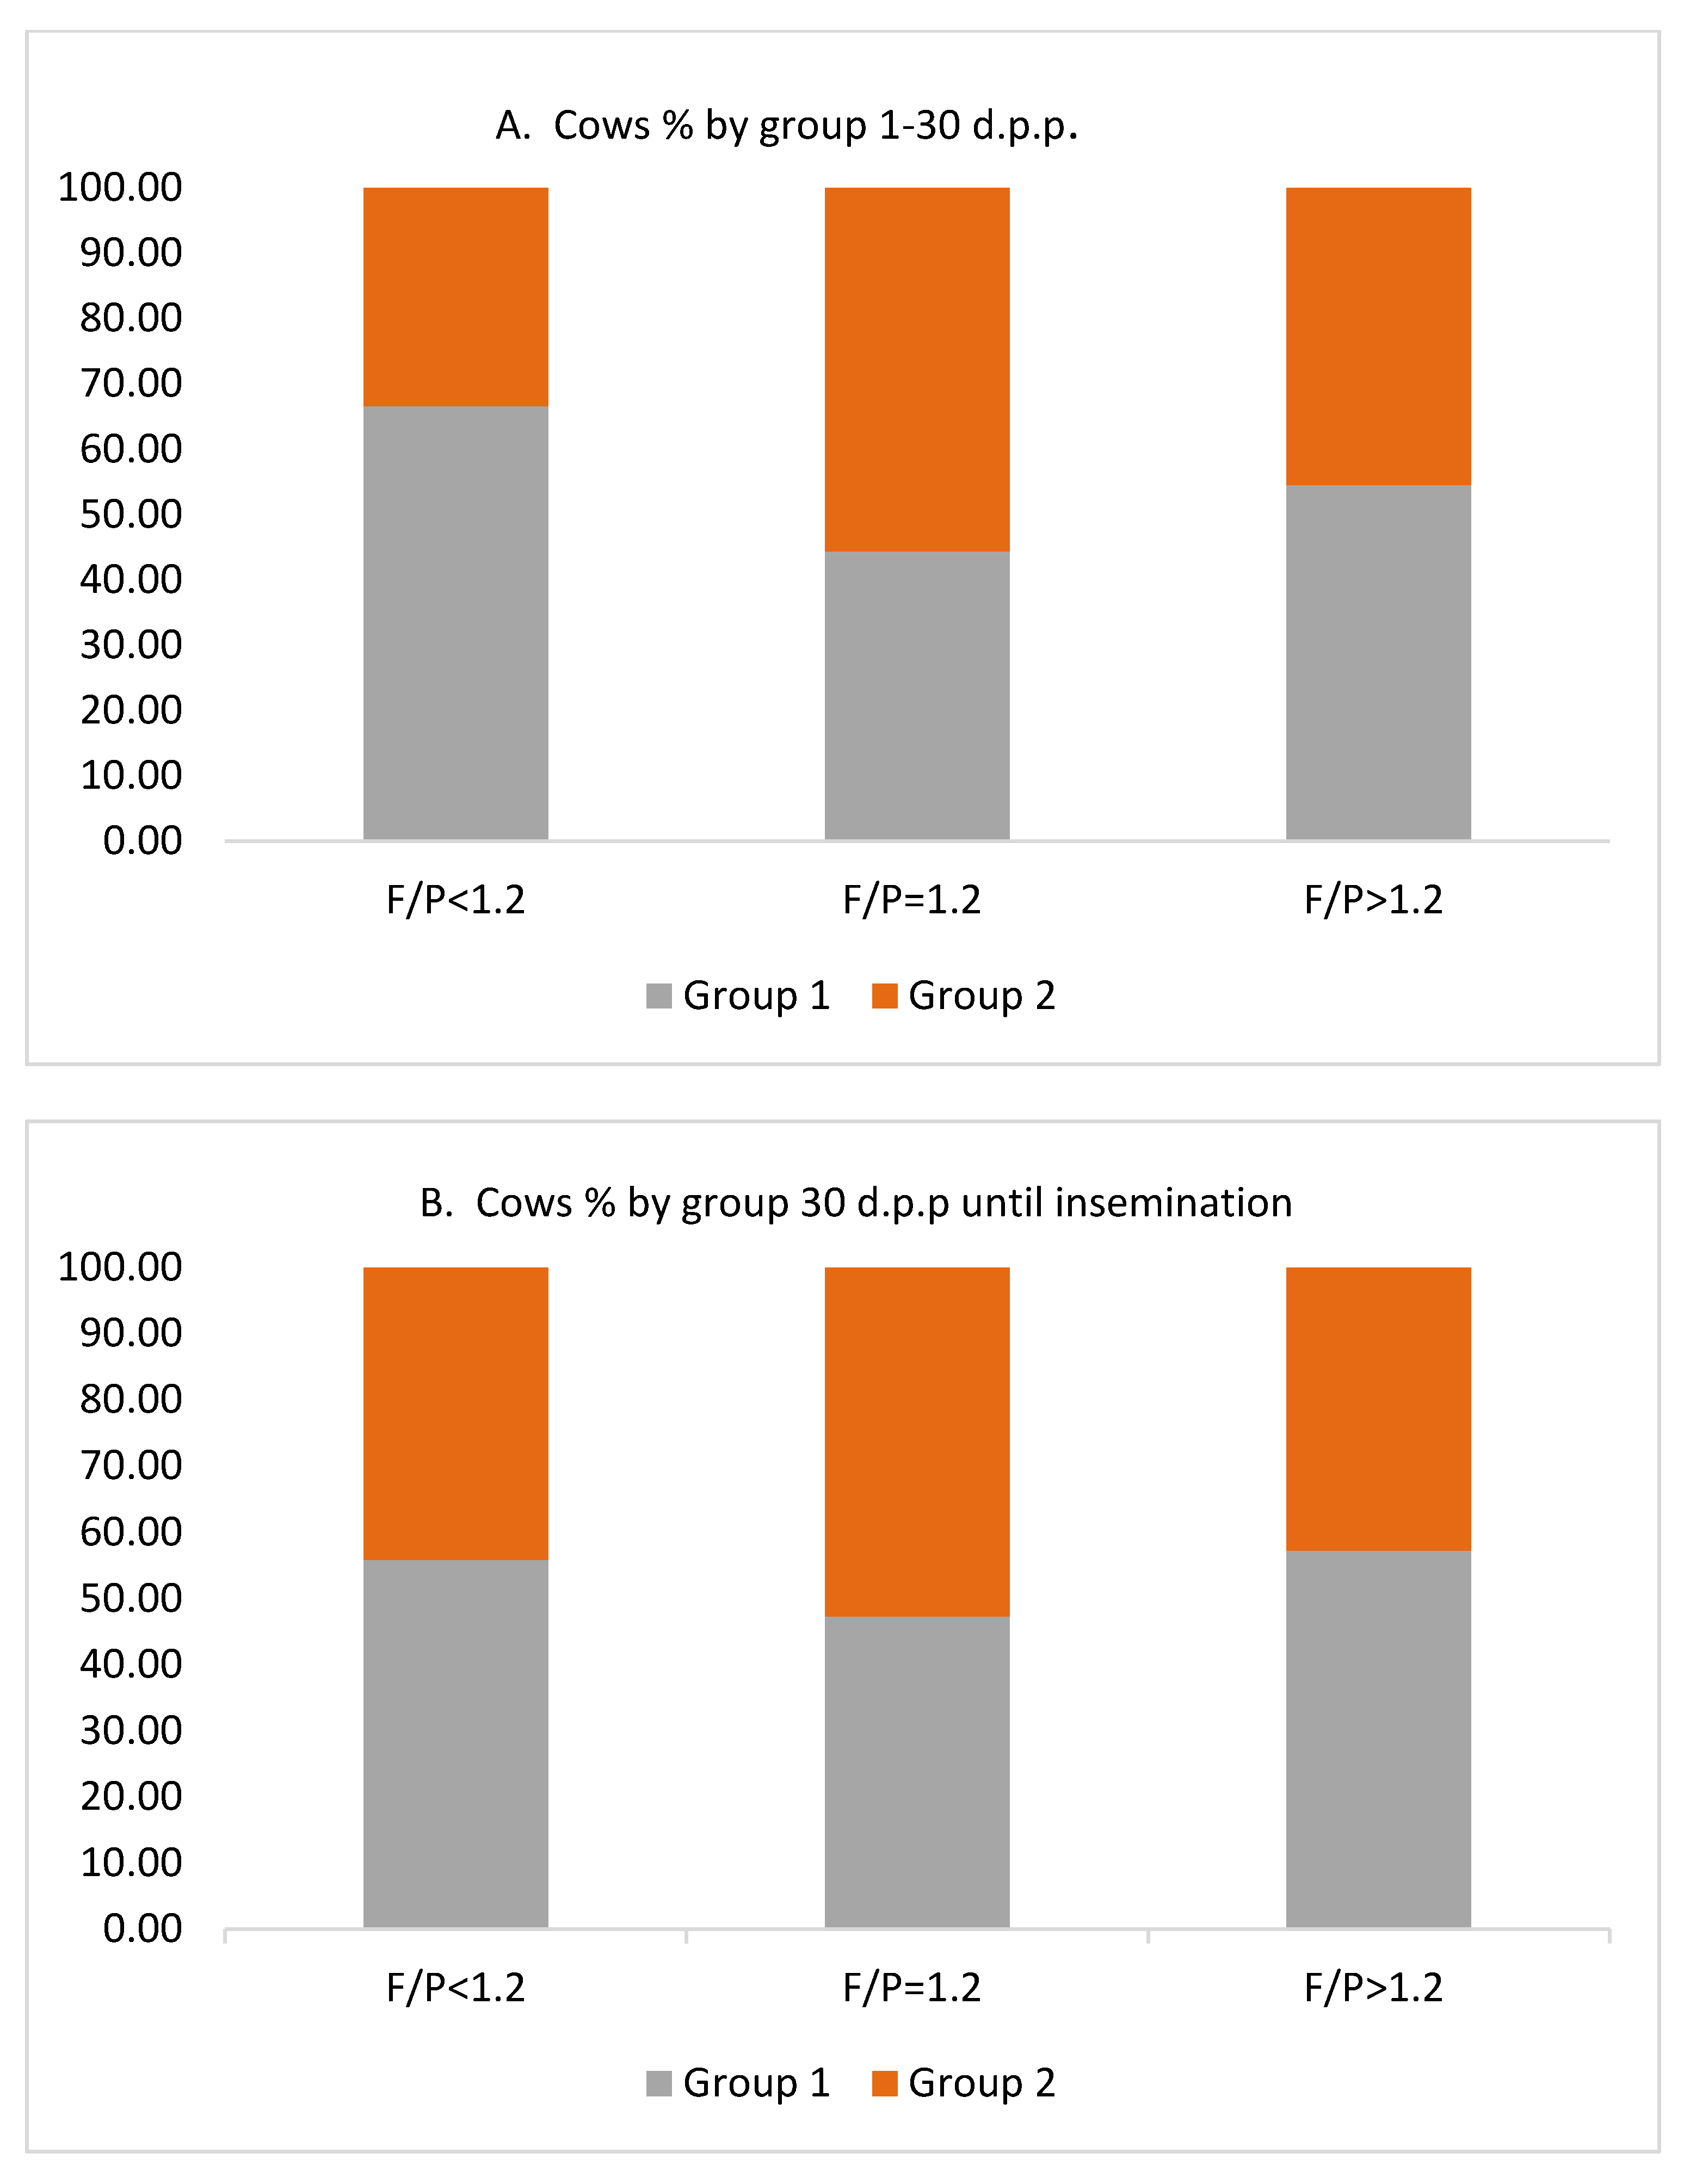
3.1. The Relationship between the Level of Milk Lactose and Milk Characteristics of Cows

The lactose content in the milk of cows was significantly positively related to the content of milk protein (r = 0.436; P < 0.05) and negatively correlated with the EC of milk (r=−0.695–0.993; P < 0.001). The correlations of milk lactose with MY, milk fat and F/P were slightly positive (0.091–0.170) and significantly unreliable (P > 0.05) (Figure 1).
Productivity in the cows of the first group was 10.26% lower, and the milk fat and protein ratio was 9.59% lower. The milk contents of the second group had less milk fat and protein (1.09 and 1.02 times), but the differences between the average for these indicators of milk were not significant.
The electrical conductivity level of milk in group 1 was higher in all quarters of the udders compared to cows in group 2 (Figure 2), from 5.66% (rear right quarter) to 9.72% (front right quarter), and differences between groups in EC means of milk in all udder quarters were significant (P < 0.001).
A significant relationship between group of cows and level of SCC in milk has been estimated (P < 0.001). In group 1, we found 59.52% more cows with milk SCC ≥ 100 thousand/mL (Figure 3). Odds of subclinical mastitis among cows with concentration of lactose < 4.70% are 15-fold higher than in cows with lactose concentration above this level (OR = 15.583, P = 0.001).
Cows with lactose < 4.70% in milk were also found to be more prone to the risk of subclinical acidosis or ketosis (OR = 2.00, P = 0.376). The cows of the first group with SARA signs accounted for 33.33% more animals than the cows of the second group. We also found that in THE F/P > 1.2 class, there were 9.09% more cows of the first group, and in this class with signs of subclinical ketosis, the total number of cows of the second group was 54.55% (Figure 4).
From our investigation, 50% of cows in the first group had a risk of mastitis (milk SCC ≥ 100 thousand/mL) and, at the same time,—a risk of metabolic disorders according to F/P. None of the cows in the second group had this risk of both diseases.

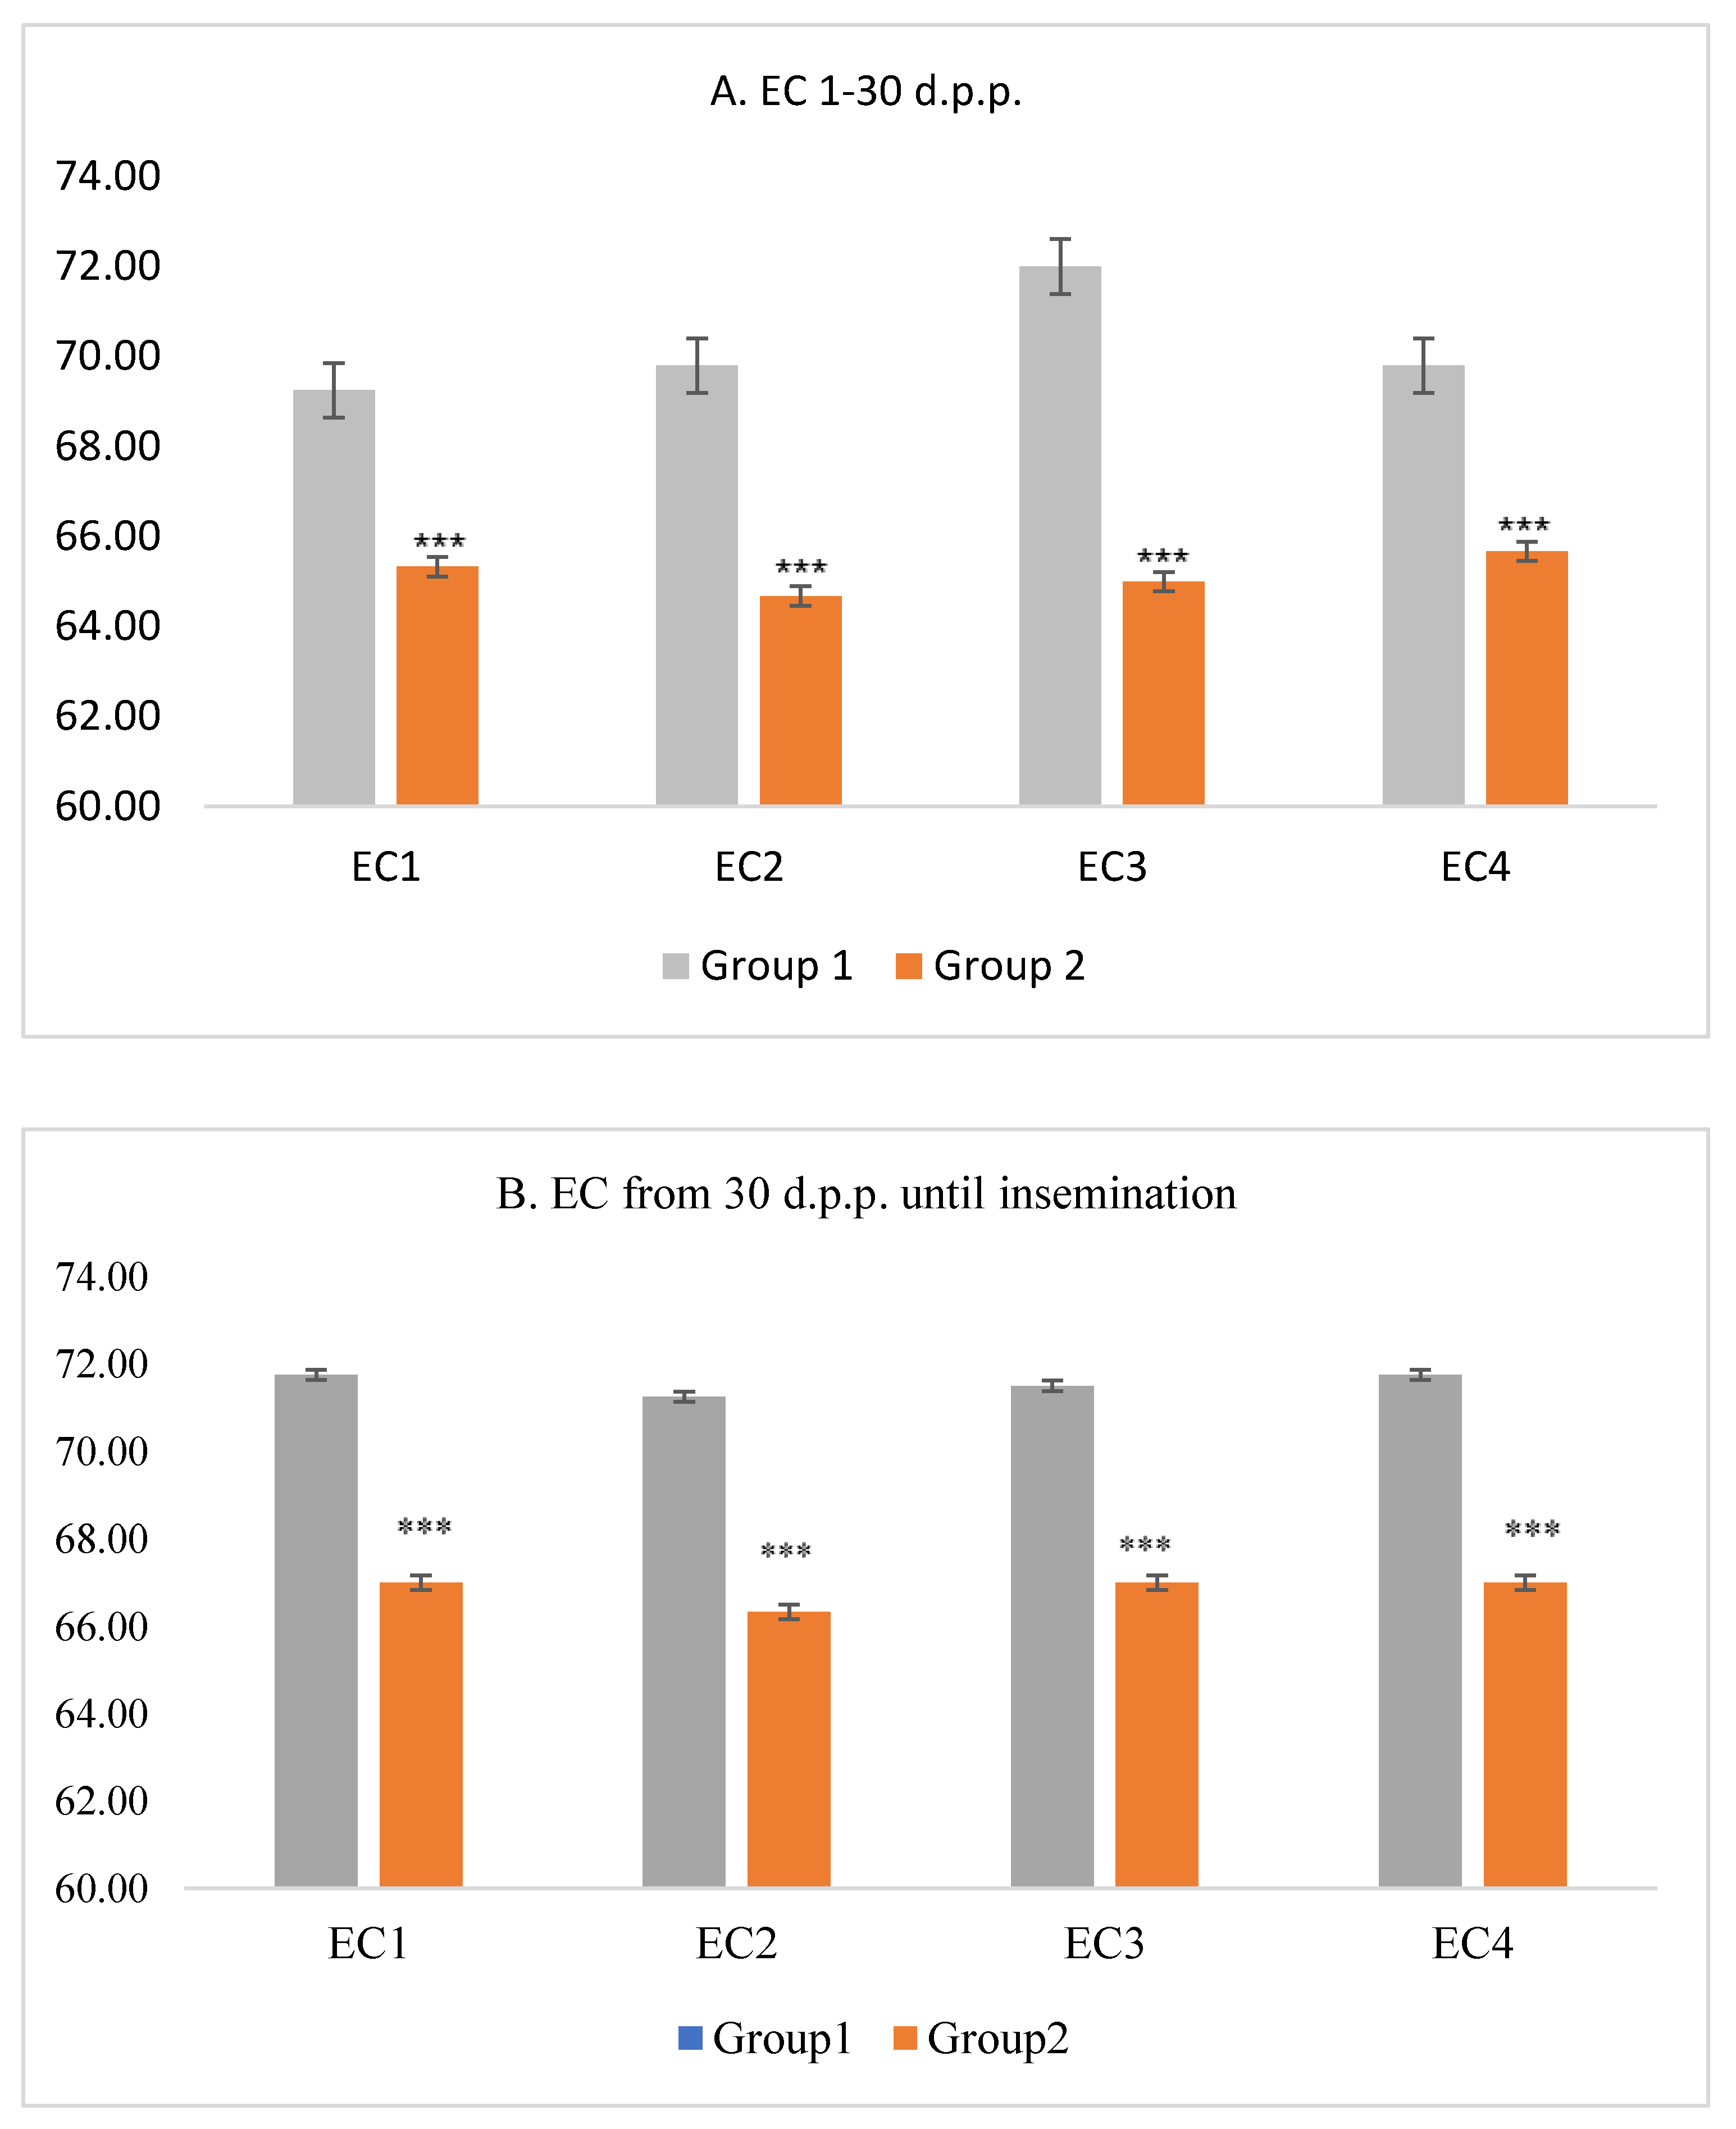
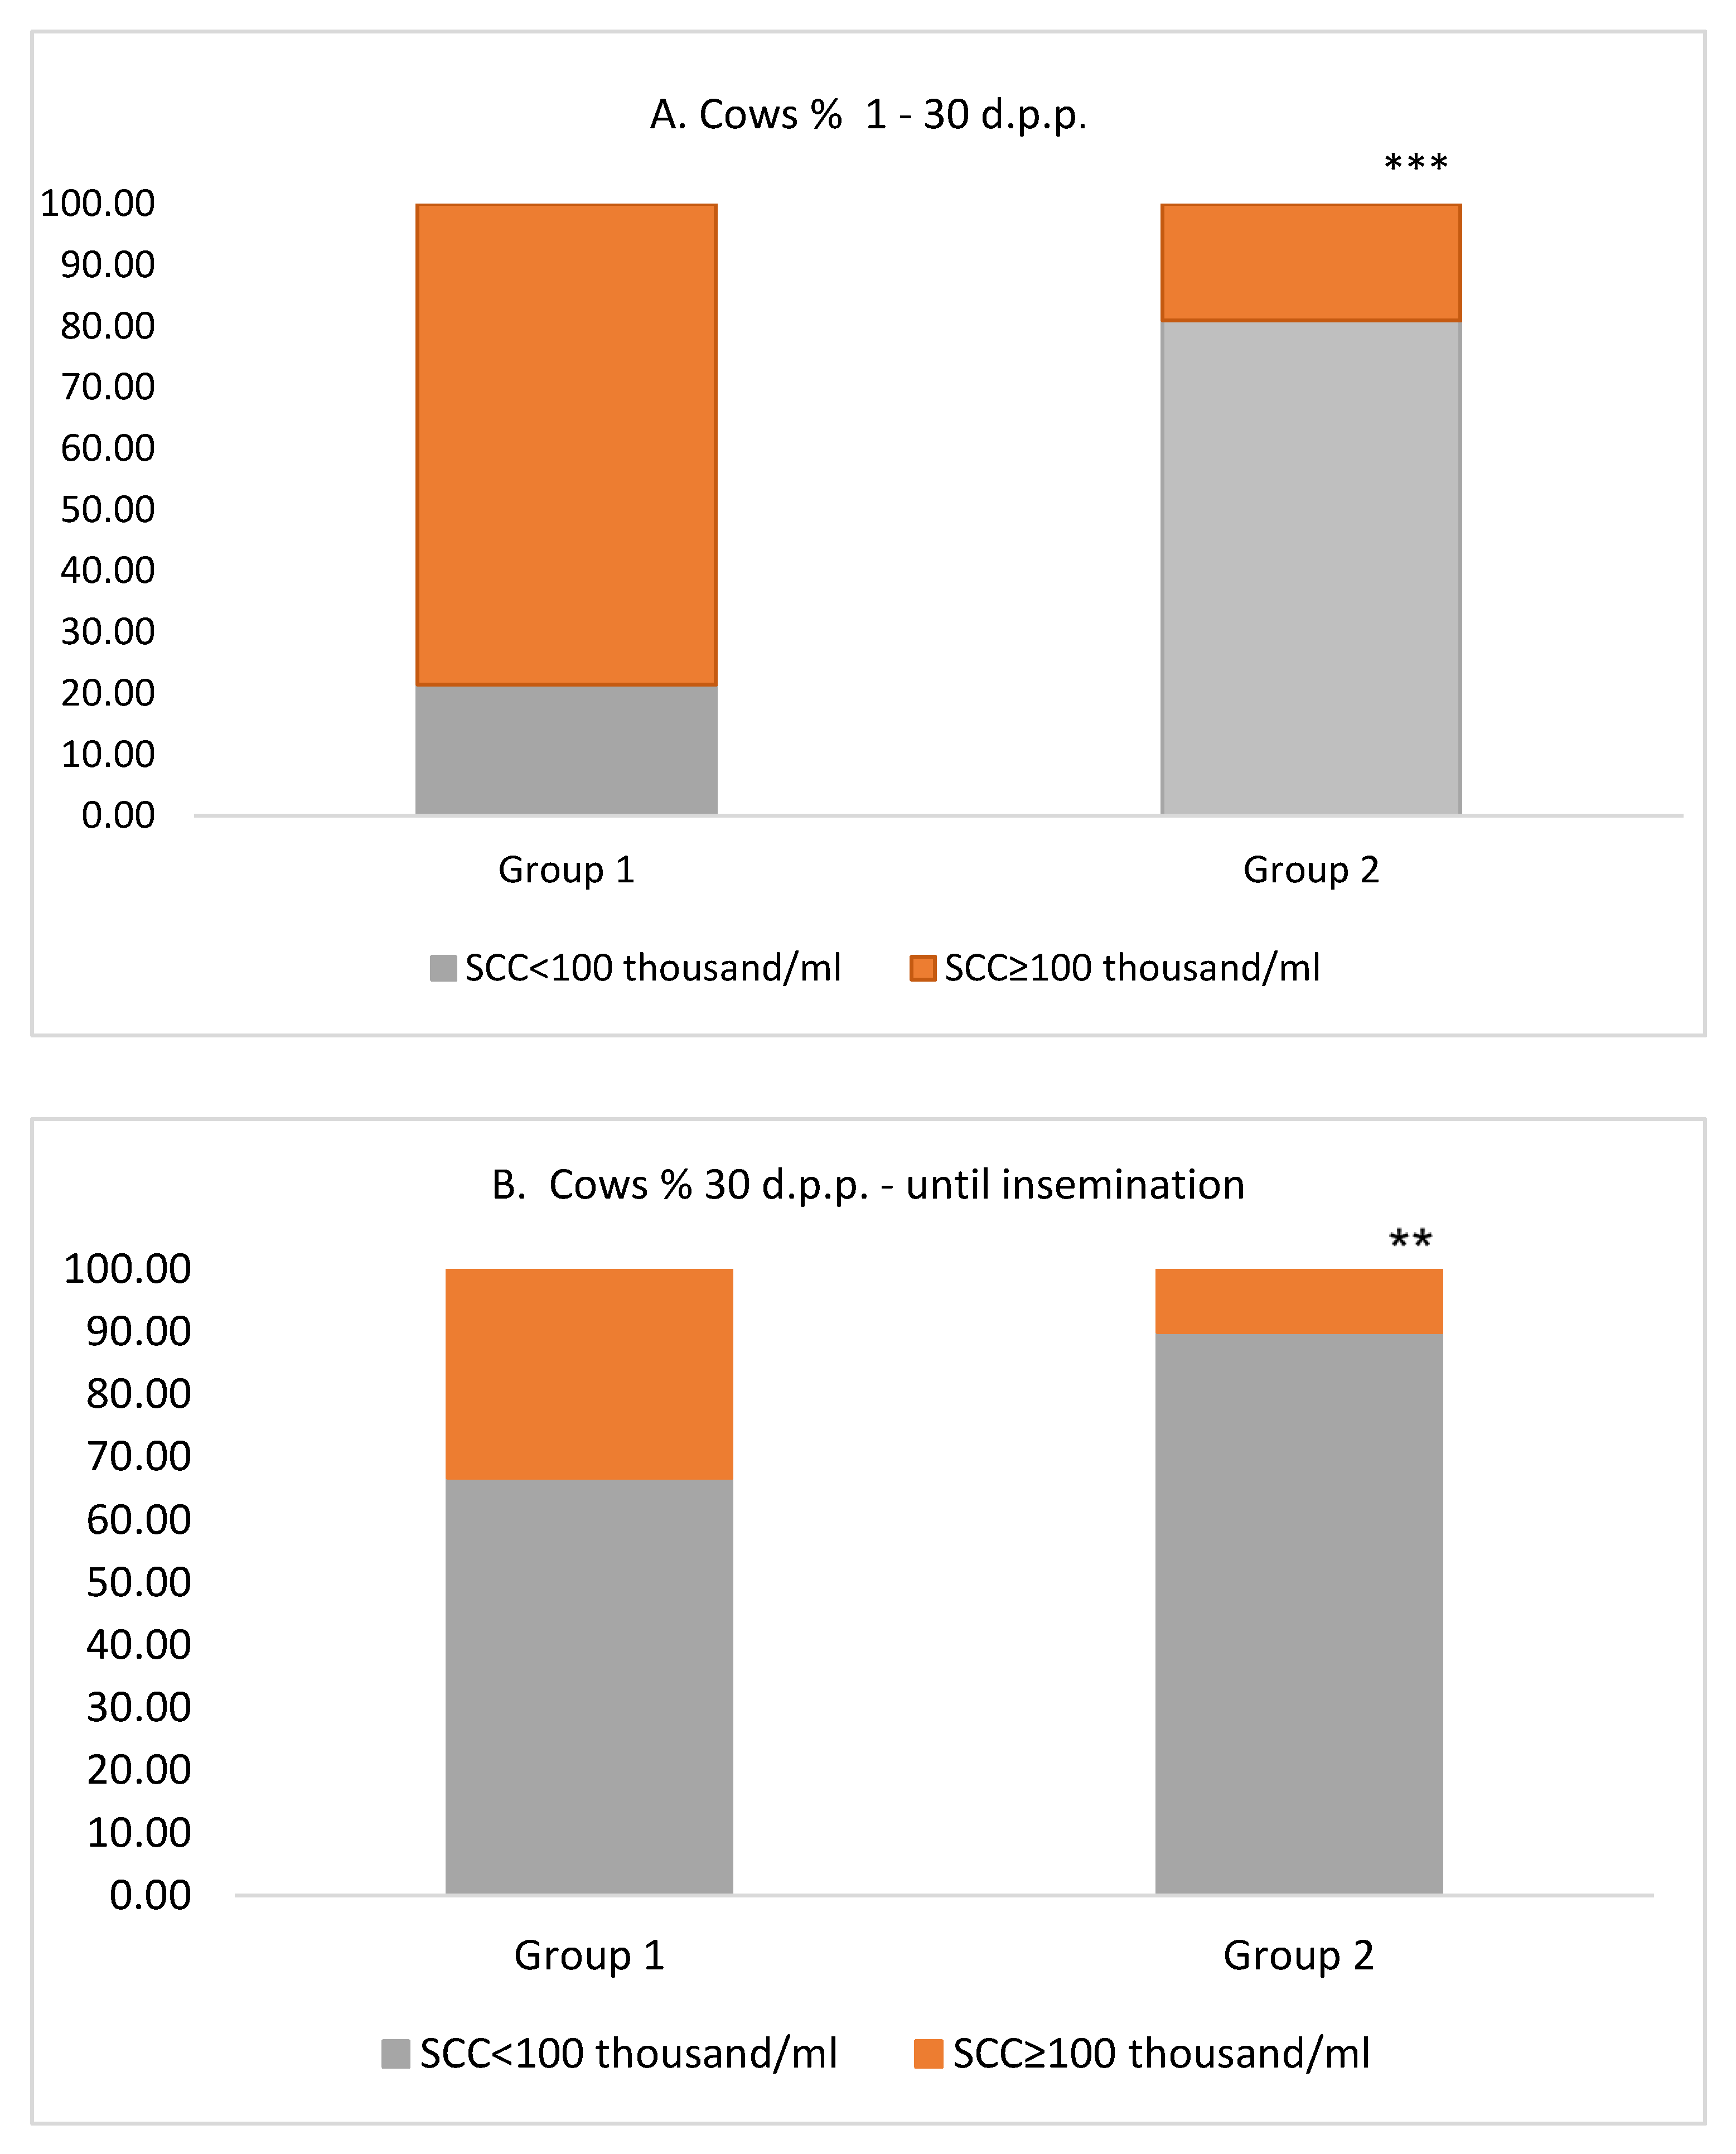
3.2. The Relationship between the Level of Milk Lactose and Biomarkers from AMS

The average reticulorumen pH of all cows was 6.42 ± 0.002, reticulorumen temperature—38.83 ± 0.041 °C, activity—9.913 ± 0.656 steps/hour, and RT—441.14 ± 12.58 min/d.
Reticulorumen pH in group 2 was 02.1652% higher (P < 0.001), level of activity—54.547 steps/hour% higher (P < 0.001), and rumination time—469.0786% min/d. longer, compared to cows of group 1 (Table 1).
Milk lactose highly positively correlated with reticulorumen pH and activity of cows (P < 0.01).

3.3. Relationship between Milk Lactose and Cow Reproduction Success

In the first group, 65.00% of cows did not become pregnant, and in the second group, only 6.67% did not become pregnant (P < 0.001)
Lactose levels in cows’ milk were positively associated with their reproductive success. We estimated that cows with the milk lactose level of ≥ 4.70% were 26 times more likely to have reproductive success than cows with milk lactose of < 4.70% (OR = 26.000, P = 0.004). Data from binary logistic regression analysis are presented in Table 2.

4. Discussion

In the current study, we hypothesized that inline registered milk lactose can act as an indicator of health status and reproduction success in fresh dairy cows.
Lactose, EC and their combination together were the most accurate parameters for detection of mastitis in dairy farms equipped with in-line sensors. Clinical (CM) and subclinical (SCM) mastitis negatively influence the quality and quantity of milk and therefore they are of considerable economic concern for the dairy industry. Early detection of mastitis (especially SCM) can have an improvement on animal welfare and the quality of milk production and has the potential to increase economic gains [17]. According to the current study, we found that with increased concentration of lactose, the probability of mastitis decreases, confirmed with decreases in milk EC and SCC. The concentration of lactose has been reported to be influenced by high milk somatic cell counts (SCC). Berglund et al. [17] observed that an increase from 31,000–450,000 somatic cells mL-1 decreased the lactose concentration from 4.86–4.69%. This was due to a reduction in lactose secretion [18] and loss of lactose to the blood vessels when the d permeability of the tight junction increased [19]. Substantial reductions in the lactose levels were correlated with the increase in SCC, as observed in the factor analysis, in which the lactose content had a contrary relationship with SCC [20]. Phenotypic and genetic correlations of −0.774–−0.227 between the lactose content and SCS were estimated by Lindmark-Månsson et al. [21] and Miglior et al. [22], respectively. The increase in SCC, which indicates clinical and subclinical mastitis, decreases the lactose levels in milk, due to changes in the homeostasis of mammary glands [23], increasing the blood concentration of lactose [24]. Capuco et al. [25], as well as Schneeberger and Lynch [26], reported it to increase the blood concentration of lactose, which is an indicator of the integrity of the mammary epithelium [24,27]. According to Leitner et al. [28], blood lactose is increased in cases of subclinical mastitis and, in a more pronounced way, in clinical mastitis. However, in subclinical mastitis, the integrity of tight junctions is partly maintained. Leitner et al. [18] argued that the lower concentration of lactose in cows with intramammary infection was also related to the reduction in the secretion of lactose by further conversion of plasminogen to plasmin. Ebrahimie et al. [29] found that milk lactose concentrations decrease and SCC increases during clinical and subclinical mastitis. Few studies by other scientists show that lactose, SCC and milk electrical conductivity have been widely reported to be some of the most informative traits for mastitis diagnosis [30,31]. According to a study carried out by Costa et al. [32], mastitis genetically correlated with milk lactose yield.
The results in this study indicate that cows with a low lactose (<4.70%) and milk F/P ratio in the interval (<1; >2) reliably increased the risk of metabolic disorders (subclinical ketosis and acidosis). Toni et al. [33] also found that the F/P interval (<1; >2) in milk is a valuable indicator of negative energy balance and lipo-mobilization in postpartum cows. Ganter et al. [34] stated that due to a negative energy balance at the beginning of lactation, the milk fat content increases, followed by a decrease in milk protein contents, which makes the F/P ratio a good indicator in metabolic disorder detection.
We found that cows with a higher milk lactose concentration were more active (by 54.47%) and were at less risk of subclinical acidosis (SARA) (indicated by 2.52% higher reticuloruminal pH and 9.86% longer rumination time). Antanaitis et al. [35] reported that cows with acidosis showed lower activity than healthy cows. According to Church [36], increased rumination time activates saliva production. Saliva consists of inorganic buffers that neutralize the organic acids produced during fermentation in the rumen [36,37]. According to other studies, the rumen content pH, which is used to define SARA, is still a controversial issue [38]; however, in previous studies [39,40,41], a drop in rumen pH below 6 indicated the occurrence of SARA. Agreeing with Antanaitis et al. [42], cows affected by SARA have been shown to have reduced rumination time.
Data from this study also confirmed that higher levels of lactose in cows’ milk are associated with a lower risk of mastitis. In other studies, the heritability coefficient for milk lactose (h2 = 0.279) and a negative genetic correlation (rg = −0.43; p < 0.01) with milk somatic cells [43] were determined.
Lactose is a vital osmotic component of milk and is a major driver of water secretion into milk from the bloodstream. Thus, a lower lactose content results in a smaller volume of milk produced [31].
According to our results, evaluating the relationship between milk lactose concentration and cow reproduction success, we found that cows with higher milk lactose concentration (≥4.70%) had a better probability for pregnancy (65.00%) than cows with lower milk lactose concentrations (<4.70%). Reksen et al. [10] found that second-parity lactation cows with higher milk lactose concentration in the first 8 weeks after calving had an earlier luteal response. Comparing the relationship between milk lactose concentration and cow energy balance and its use to assess cow reproduction success, the results of our study are consistent with those of Buckley et al. [9]. Their results state that the amount of lactose in milk, which correlates with the amount of glucose in the blood, can be used not only to assess the energy balance of cows but also their reproductive success.

5. Conclusions

Based on our results, a conclusion can be made that inline registered milk lactose concentration can be an indicator for the health status of dairy cows. Cows with a higher lactose concentration (≥4.70%) were registered as more active (54.47%) and were at less risk of mastitis (as indicated by lower milk EC and SCC) and metabolic disorders, determined by milk F/P. Low levels of lactose can indicate mastitis (milk SCC ≥100 thousand/mL) and metabolic disorders (subclinical ketosis, subclinical acidosis), described by milk F/P. Cows with higher milk lactose concentration have a higher possibility of successful conception.

Author Contributions

M.T.: management of the whole study; V.J.: algorithm and software development, design and setup of field experiments, data collection and analysis; D.M.: setup of the field experiment and data collection, management and selection of the experimental group of animals; R.A.: research consultancy; A.R.: building of field experiment, data collection and analysis; M.U.: design of field experiment and data analysis and collection; and W.B.: major support in processing of data in the study. The manuscript was written by M.T. and revised by all co-authors. All authors have read and agreed to the published version of the manuscript.

Funding

This research was not externally funded.

Institutional Review Board Statement

The study was conducted according to the guidelines of the Declaration of Helsinki, and approved by Ethics Committee (The study approval number is PK016965, 2017.06.06).

Informed Consent Statement

Informed consent was obtained from all subjects involved in the study.

Data Availability Statement

The data presented in this study are available within the article.

Conflicts of Interest

The authors declare no conflict of interest.

References

  1. Berckmans, D. Precision livestock farming technologies for welfare management in intensive livestock systems. Rev. Sci. Tech. Off. Int. Epiz. 2014, 33, 189–196. [Google Scholar] [CrossRef] [PubMed]
  2. Jacobs, J.A.; Siegford, J.M. Invited review: The impact of automatic milking systems on dairy cow management, behavior, health, and welfare. J. Dairy Sci. 2012, 95, 2227–2247. [Google Scholar] [CrossRef] [PubMed]
  3. Spahr, S.L.; Maltz, E. Herd management for robot milk-ing. Comp. Electron. Agric. 1997, 17, 53–62. [Google Scholar] [CrossRef]
  4. Halachmi, I.; Guarino, M. Editorial: Precision livestock farming: A “per animal” approach using advanced monitoring technologies. Anim. Consortc. 2016, 10, 1482–1483. [Google Scholar] [CrossRef] [PubMed] [Green Version]
  5. Halachmi, I. Designing the automatic milking farm in a hot climate. J. Dairy Sci. 2004, 87, 764–775. [Google Scholar] [CrossRef] [Green Version]
  6. Costa, A.; Egger-Danner, C.; Mészáros, G.; Fuerst, C.; Penasa, M.; Sölkner, J.; Fuerst-Waltl, B. Genetic associations of lactose and its ratios to other milk solids with health traits in Austrian Fleckvieh cows. J. Dairy Sci. 2019, 102, 4238–4248. [Google Scholar] [CrossRef] [PubMed]
  7. Miglior, F.; Sewalem, A.; Jamrozik, J.; Lefebvre, D.M.; Moore, R.K. Analysis of Milk Urea Nitrogen and Lactose and Their Effect on Longevity in Canadian Dairy Cattle. J. Dairy Sci. 2006, 89, 4886–4894. [Google Scholar] [CrossRef]
  8. Francisco, C.C.; Spicer, L.J.; Payton, M.E. Predicting cholesterol, progesterone, and days to ovulation using postpartum metabolic and endocrine measures. J. Dairy Sci. 2003, 86, 2852–2863. [Google Scholar] [CrossRef] [Green Version]
  9. Buckley, F.; O’Sullivan, K.; Mee, J.F.; Evans, R.D.; Dillon, P. Relationships among milk yield, body condition, cow weight, and reproduction in spring-calved Holstein-Friesians. J. Dairy Sci. 2003, 86, 2308–2319. [Google Scholar] [CrossRef]
  10. Reksen, O.; Havrevoll, Ø.; Gröhn, Y.T.; Bolstad, T.; Waldmann, A.; Ropstad, E. Relationships among body condition score, milk constituents, and postpartum luteal function in Norwegian dairy cows. J. Dairy Sci. 2002, 85, 1406–1415. [Google Scholar] [CrossRef]
  11. Steen, A.; Østerås, O.; Grønstøl, H. Evaluation of additional acetone and urea analyses, and of the fat-lactose-quotient in cow milk samples in the herd recording system in Norway. J. Vet. Med. A 1996, 43, 181–191. [Google Scholar] [CrossRef] [PubMed]
  12. Reist, M.; Erdin, D.; von Euw, D.; Tschuemperlin, K.; Leuenberger, H.; Chilliard, Y.; Hammon, H.M.; Morel, C.; Philipona, C.; Zbinden, Y.; et al. Estimation of energy balance at the individual and herd level using blood and milk traits in high-yielding dairy cows. J. Dairy Sci. 2002, 85, 3314–3327. [Google Scholar] [CrossRef]
  13. Pyöräla, S. Indicators of inflammation in the diagnosis of mastitis. Vet. Res. 2003, 34, 565–578. [Google Scholar] [CrossRef] [Green Version]
  14. Leitner, G.; Lavi, Y.; Merin, U.; Lemberskiy-Kuzin, L.; Katz, G. Online evaluation of milk quality according to coagulation properties for its optimal distribution for industrial applications. J. Dairy Sci. 2011, 94, 2923–2932. [Google Scholar] [CrossRef] [PubMed]
  15. Rigout, S.; Lemosquet, S.; van Eys, J.E.; Blum, J.W.; Rulquin, H. Duodenal glucose increases glucose fluxes and lactose synthesis in grass silage-fed dairy cows. J. Dairy Sci. 2002, 85, 595–606. [Google Scholar] [CrossRef]
  16. Qiao, F.; Trout, D.R.; Xiao, C.; Cant, J.P. Kinetics of glucose transport and sequestration in lactating bovine mammary glands measured in vivo with a paired indicator/nutrient dilution technique. J. Applied Phys. 2005, 99, 799–806. [Google Scholar] [CrossRef]
  17. Berglund, I.; Pettersson, G.; Ostensson, K.; Svennersten-Sjaunja, K. Quarter milking for improved detection of increased SCC. Rep. Dom. Anim. Malden. 2007, 42, 427–432. [Google Scholar] [CrossRef]
  18. Leitner, G.; Merin, U.; Lavi, Y.; Egber, A.; Silanikove, N. Aetiology of intramammary infection and its effect on milk composition in goat flocks. J. Dairy Res. 2007, 74, 186–193. [Google Scholar] [CrossRef] [Green Version]
  19. Moussaoui, F.; Vangroenweghe, F.; Haddadi, K.; Le Roux, Y.; Laurent, F.; Duchateau, L.; Burvenich, C. Proteolysis in milk during experimental Escherichia coli mastitis. J. Dairy Sci. 2004, 87, 2923–2931. [Google Scholar] [CrossRef] [Green Version]
  20. Alessio, M.; Regina, D.; André, T.N.; Pedro, V.J.; Ildemar, B.P.; José, M.D.; Aline, K.D.; Claudineli, G.S. Multivariate analysis of lactose content in milk of Holstein and Jersey cows. Ciênci. Agrár. 2016, 37, 2641–2652. [Google Scholar] [CrossRef] [Green Version]
  21. Lindmark-Mansson, H.; Branning, C.; Alden, G.; Paulsson, M. Relationship between somatic cell count individual leukocyte populations and milk components in bovine udder quarter milk. Inter. Dairy J. 2006, 16, 717–727. [Google Scholar] [CrossRef]
  22. Miglior, F.; Sewalem, A.; Jamprozik, J.; Bohmanova, J.; Lefebvre, D.M.; Moore, R.K. Genetic analysis of milk urea nitrogen and lactose and their relationships with other production traits in Canadian Holstein cattle. J. Dairy Sci. 2007, 90, 2468–2479. [Google Scholar] [CrossRef] [PubMed]
  23. Pessora, R.B.; Blagitz, M.G.; Batista, C.F.; Santos, B.P.; Parra, A.C.; Souza, F.N.; Della Libera, A.M.M.P. Polymorphonuclear leukocytes CH138+ apoptosis evaluation in milk with high and low somatic cell count—preliminary data. Arq. Bras. Med. Vet. Zootec. 2012, 64, 533–539. [Google Scholar]
  24. Ben Chedly, H.; Lacasse, P.; Marnet, P.; Wiart-Letort, S.; Finot, L.; Boutinaud, M. Cell junction disruption after 36 h milk accumulation was associated with changes in mammary secretory tissue activity and dynamics in lactating dairy goats. J. Phys. Pharm. Off. J. Pol. Physiol. Soc. 2009, 60, 105–111. [Google Scholar]
  25. Schneeberger, E.E.; Lynch, R.D. Structure, function and regulation of cellular tight junctions. Americ. J. Phys. 1992, 262, 647–661. [Google Scholar] [CrossRef]
  26. Capuco, A.V.; Ellis, S.E.; Hale, S.A.; Long, E.; Erdman, R.A.; Zhao, X.; Paape, M.J. Lactation persistency: Insights from mammary cell proliferation studies. J. Anim. Sci. 2003, 81, 18–31. [Google Scholar] [CrossRef] [Green Version]
  27. Stelwagen, K.; Davis, S.R.; Farr, V.C.; Eichler, S.J.; Politis, I. Effect of once daily milking and concurrent somatotropin on mammary tight junction permeability and yield of cows. J. Dairy Sci. 1994, 77, 2994–3001. [Google Scholar] [CrossRef]
  28. Leitner, G.; Chaffer, M.; Shamay, A.; Shapiro, F.; Merin, U.; Ezra, E.; Saran, A.; Silanikove, N. Changes in milk composition as affected by subclinical mastitis in sheep. J. Dairy Sci. 2004, 87, 46–52. [Google Scholar] [CrossRef]
  29. Ebrahimie, E.; Ebrahimi, F.; Ebrahimi, M.; Tomlinson, T.; Petrovski, K.R. A large-scale study of indicators of sub-clinical mastitis in dairy cattle by attribute weighting analysis of milk composition features: Highlighting the predictive power of lactose and electrical conductivity. J. Dairy Res. 2018, 85, 193–200. [Google Scholar] [CrossRef]
  30. Geary, U.; Lopez-Villalobos, N.; O’Brien, B.; Garrick, D.J.; Shalloo, L. Estimating the impact of somatic cell count on the value of milk utilising parameters obtained from the published literature. J. Dairy Res. 2014, 81, 223–232. [Google Scholar] [CrossRef] [Green Version]
  31. Vilas Boas, D.F.; Vercesi Filho, A.E.; Pereira, M.A.; Roma Junior, L.C.; El Faro, L. Association between electrical conductivity and milk production traits in Dairy Gyr cows. J. Appl. Anim. Res. 2017, 45, 227–233. [Google Scholar] [CrossRef] [Green Version]
  32. Costa, A.; Lopez-Villalobos, N.; Sneddon, N.W.; Shalloo, L.; Franzoi, M.; De Marchi, M.; Penasa, M. Invited review: Milk lactose—Current status and future challenges in dairy cattle. J. Dairy Sci. 2019, 102, 5883–5898. [Google Scholar] [CrossRef] [PubMed]
  33. Toni, F.; Vincenti, L.; Grigoletto, L.; Ricci, A.; Schukken, Y.H. Early lactation ratio of fat and protein percentage in milk is associated with health, milk production, and survival. J. Dairy Sci. 2011, 94, 1772–1783. [Google Scholar] [CrossRef] [PubMed]
  34. Gantner, V.; Bobic, T.; Potocnik, K. Prevalence of metabolic disorders and effect on subsequent daily milk quantity and quality in Holstein cows. Arch. Anim. Breed. 2016, 59, 381–386. [Google Scholar] [CrossRef]
  35. Antanaitis, R.; Žilaitis, V.; Kučinskas, K.; Juozaitienė, V.; Leonauskaitė, K. Changes in cow activity, milk yield, and milk conductivity before clinical diagnosis of ketosis, and acidosis. Vet. Med. Zoot. 2015, 70, 1392–2130. [Google Scholar]
  36. Church, D.C. Salivary function and production. In The Ruminant Animal, Digestive Physiology and Nutrition; Prentice Hall: Englewood Cliffs, NJ, USA, 1988; pp. 117–124. [Google Scholar]
  37. Plaiziera, J.C.; Krausea, D.O.; Gozhob, G.N.; McBridec, B.W. Subacute ruminal acidosis in dairy cows: The physiological causes, incidence and consequences. Vet. J. 2008, 176, 21–31. [Google Scholar] [CrossRef]
  38. Gozho, G.N.; Plaizier, J.C.; Krause, D.O.; Kennedy, A.D.; Wittenberg, K.M. Subacute Ruminal Acidosis Induces Ruminal Lipopolysaccharide Endotoxin Release and Triggers an Inflammatory Response. J. Dairy Sci. 2005, 88, 1399–1403. [Google Scholar] [CrossRef] [Green Version]
  39. Hibbard, B.; Peters, J.P.; Chester, S.T.; Robinson, J.A.; Kotarski, S.; Croom, W.J.; Hagler, W.M. The effect of slaframine on salivary output and subacute and acute acidosis in growing beef steers. J. Anim. Sci. 1995, 73, 516–525. [Google Scholar] [CrossRef] [Green Version]
  40. Kriehbiel, C.R.; Britton, R.A.; Harmon, D.L.; Wester, T.J.; Stock, R.A. The effects of ruminal acidosis on volatile fatty acid absorption and plasma activities of pancreatic enzymes in lambs. J. Anim. Sci. 1995, 73, 3111–3121. [Google Scholar] [CrossRef]
  41. Beauchemin, K.A.; Yang, W.Z.; Rode, L.M. Effects of barley grain processing on the site and extent of digestion in beef. J. Anim. Sci. 2001, 79, 1925–1936. [Google Scholar] [CrossRef] [Green Version]
  42. Antanaitis, R.; Juozaitienė, V.; Malašauskienė, D.; Televičius, M. Can rumination time and some blood biochemical parameters be used as biomarkers for the diagnosis of subclinical acidosis and subclinical ketosis. Vet. Anim. Sci. 2019, 8, 100077. [Google Scholar] [CrossRef] [PubMed]
  43. Shimkiene, A.; Juozaitiene, V.; Juozaitis, A.; Shimkus, A.; Zilaitis, V.; Urbonavicius, A. Relationship between lactose content in cow’s milk with selection attributes and heritability. Veterinarija ir zootechnika. Vet. Med. Zoot. 2009, 45, 81–86. [Google Scholar]
Figure 1. Milk characteristics of cows by milk lactose level. (A). 1–30.p.p., (B). From 30 d.p.p. until insemination. Group 1—milk lactose < 4.70%, Group 2—milk lactose ≥ 4.70%. MY—milk yield. F/P—milk fat/protein ratio. d.p.p—days post partum. The difference between the groups is statistically significant—* P < 0.005.
Agriculture 11 00038 g001
Figure 2. Electrical conductivity of cows’ milk at the level of udder quarters (μS/cm). (A). 1–30.p.p., (B). From 30 d.p.p. until insemination. Group 1—milk lactose < 4.70%, Group 2—milk lactose ≥ 4.70%. EC1—rear right, EC2—rear left, EC3—front right, EC4—front left. The difference between the groups is statistically significant—*** P < 0.001.
Agriculture 11 00038 g002
Figure 3. Relationship of milk somatic cell counts (SCC) with milk lactose level. (A). 1–30.p.p., (B). From 30 d.p.p. until insemination. Group 1—milk lactose < 4.70%, Group 2—milk lactose ≥ 4.70%. SCC—milk somatic cell count. The association between group and SCC of milk is statistically significant—** P < 0.01, *** P < 0.001.
Agriculture 11 00038 g003
Figure 4. Relationship of milk fat to protein ratio with milk lactose level. (A). 1–30.p.p., (B). From 30 d.p.p. until insemination. Group 1—milk lactose < 4.70%, Group 2—milk lactose ≥ 4.70%. F/P—milk fat/protein ratio.
Agriculture 11 00038 g004
Table 1. Indicators of reticulorumen, rumination time (RT) and activity of cows and their relationship with milk lactose.
Group of CowsStatisticReticulorumen pHReticulorumen T°CRumination Time, min/d.Activity of Cows, Steps/Hour
1–30 d.p.p.
1M6.3438.84467.408.39
SE0.2910.11334.2301.006
2M6.50 **38.82421.3312.96 **
SE0.3020.26349.6004.186
Correlation0.762 *0.130−0.2960.751 *
30 d.p.p.—until insemination
1M6.4838.85465.678.22
SE0.0390.08813.9510.515
2M6.6238.66 **443.009.67
SE0.0010.00210.1570.001
Correlation0.567 *0.176−0.2230.753 *
M—mean; SE—standard of error of the mean; d.p.p.—days post partum; the difference between the groups is statistically significant, * P < 0.01, ** P < 0.005.
Table 2. Relationship of milk lactose with pregnancy.
SourceBS.E. BWald χ2dfPOR
Group3.2581.1368.22110.00426.000
Constant−3.8771.3977.70710.0060.021
B—the unstandardized regression weight, S.E.—standard error for B, Wald χ2—the Wald chi-square statistic, df—degrees of freedom, OR—odds ratio. Group 1—milk lactose < 4.70%, Group 2—milk lactose ≥ 4.70%.
Publisher’s Note: MDPI stays neutral with regard to jurisdictional claims in published maps and institutional affiliations.

