Article

Pastoral Farming in the Ili Delta, Kazakhstan, under Decreasing Water Inflow: An Economic Assessment

1
Faculty of Law and Economics & Institute of Botany and Landscape Ecology, University of Greifswald, 17487 Greifswald, Germany
2
World Agroforestry Centre, Central Asia Office, Bishkek 720001, Kyrgyzstan
3
Department of Biodiversity and Bio-resources, Faculty of Biology and Biotechnology, Kazakh National Al-Farabi University, Almaty 050040, Kazakhstan
4
Department of Biodiversity and Bio-resources, Faculty of Biology and Biotechnology, Kazakh National Al-Farabi University, Leading expert of Remote Sensing Center of the Earth at Al-Farabi Kazakh National University, Almaty 050040, Kazakhstan
*
Author to whom correspondence should be addressed.
Submission received: 2 June 2020 / Revised: 19 June 2020 / Accepted: 20 June 2020 / Published: 9 July 2020
(This article belongs to the Section Agricultural Economics, Policies and Rural Management)

Abstract

:
River deltas provide the most productive pastures in Central Asia. Simultaneously they are highly vulnerable to water inflow changes. The aim of this study was to conduct an economic assessment of the short- and medium-term effect of reduced water inflow on farmers’ performance within the Ili Delta. Primary data were collected through 35 interviews with farmers and additional experts in 2015. Production parameters for three types of individual farms were estimated and entered into a full cost accounting. Contribution margins were calculated for three scenarios: (I) sufficient water inflow (normal situation), (II) decreasing water inflow, and (III) significantly reduced water inflow (worst case). Farmers purchase hay to adapt to pasture production loss due to decreasing water inflow. This more than doubled the variable costs of worst case in comparison to normal situation for small-, medium-, and large-scale type of individual farm. Monte Carlo simulation indicates a risk of 74% (small-scale farm) and 3% (medium-scale farm) that already variable costs will exceed revenues. Despite their high fixed costs, only large-scale individual farms generate positive net farm income from operations in the worst case due to government payments from participation in elite bull program that account for one-third of total revenue.

1. Introduction

Central Asia, including Kazakhstan, Kyrgyzstan, Tajikistan, Turkmenistan, and Uzbekistan, has the largest continuous grazing land in the world [1,2,3]. By far, most of this land consists of steppes, semi-deserts, and deserts [1]. River deltas like the Ili, Amu Darya, and Syr Darya likewise shape the landscape [4] and provide the most productive pastures in the vast drylands. The productivity of delta pastures depends on river water inflow and is therefore highly vulnerable to inflow changes [5].
Kazakhstan covers 2724.9 thousand square kilometers and is the world’s ninth largest country. It borders Russia to the north, Uzbekistan and Kyrgyzstan to the south, the Caspian Sea and Volga River to the west, and China as well as Tian Shan Mountains to the east [6]. Kazakhstan has a population of 18,431.5 thousand people [7] and a low population density of 6.68 inhabitants per square kilometer [8]. The republic is administratively divided in 14 regions and the cities Astana and Almaty. In 2016, 42% of the total Kazakh population lived in rural areas [9]. Approximately 80% of the total land area in Kazakhstan is used for agricultural production [10], including crops and livestock production. GDP accounted for USD 137.2 billion (KZT 46,971.2 billion) and the share of agriculture, forestry, and fishing sector was 4.6% [9]. Gross output of agricultural production was USD 10,761.9 million (KZT 3684.4 billion), with USD 4736.4 million contributed by animal husbandry [6,9]. In 2019, contribution of animal husbandry to gross agricultural product output was USD 5304.75 million and showed the same ratio of 44% as in 2016 [11].
Today, the Kazakh Ministry for Agriculture distinguishes three farm types within livestock sector by their legal status or juridical form, i.e., (1) legal entities, (2) individual farms, and (3) households. Legal or juridical entities have been designated as large-scale agriculture enterprises. The number of livestock on these farms ranges between a thousand and tens of thousands [12,13]. Agricultural enterprises could be state-owned or non-state-owned as joint stock companies, producer cooperatives, credit partnerships, and large agroholdings [13,14,15]. These legal entities were introduced in 1995 during the first stage of the privatization process of former collective farms—kolkhoz and sovkhoz—in Kazakhstan after collapse of the Soviet Union. Since 1990, the number of state-owned agricultural enterprises is declining, whereas non-state-owned farms are increasing [14,15]. Peasant or private farms, which have no legal entity status, are classified as individual farms [12,13]. Subsequent to the 1998 law of the Republic of Kazakhstan ‘On the Peasant Farm’, most farms of this group were founded at the beginning of the 2000s. The term ‘peasant farm’ does not refer to its classical meaning in rural sociology here. Toleubayev et al. [14] translated its broader Kazakh definition based on the 1998 law as “… a joint family labor union in which individual entrepreneurial activities are directly linked with the use of land for agricultural purposes to produce, process and market farm outputs” [14] (p. 360). This group is highly diverse with regard to farm scale and grazing strategies; their livestock numbers range between tens and thousands [12,13]. Due to their size of leased land with more than 500 ha and high livestock number, many are classified as large-scale farms. Peasant farms face reduced tax liabilities compared to agricultural enterprises that promote official registration for this farm type. Further, peasant farms are more flexible in kind of employee’s payment due to the application of simplified tax accounting schemes [14]. Hereafter, this type is termed individual farm in order to avoid misunderstandings regarding the farm terminology. The last group is households. They operate at small scale and keep small numbers of livestock [12,13]. Nevertheless, households had the highest share on gross output of agricultural production contributed by animal husbandry of rounded 66%, followed by individual farms and agricultural enterprises with almost the same portion of 18% and 16%. Kazakhstan totally counted 7438 thousand cattle, 2826 thousand horses, and 19,092 thousand small ruminants in 2019. Fifty-five percent of the cattle, 56% of the horses, and 47% of the sheep and goats were kept in households [11]. In total, 12,655 agricultural enterprises, including 66 state-owned farms, 190,120 individual farms, and 1,620,386 households, were registered in Kazakhstan in 2015 [13].
The Ili Delta—one of the largest natural river deltas in Central Asia [5,16,17]—is located in the Almaty region in the southeast part of Kazakhstan. Together with East Kazakhstan and Kostanai Region, it hosts half of the Kazakh meat producers and thus belongs to the three main important production areas [15]. The Almaty region showed the highest cattle stock of 1004 thousand heads in 2018 [18] and largest share on gross output of agricultural production by animal husbandry since 1990 except for 2007. In 2018 its share was 17% [19]. The Ili Delta offers highly productive pastures during most time of the year compared to semi-arid rangelands of that district. However, the pastures and other ecosystems depend on the Ili River’s runoff and therefore are highly vulnerable to water inflow changes. Melt water from the Tian Shan Mountains in China mainly feed the Ili, making it a transboundary river [5,20,21]. According to Nurtazin et al. [21], Ili is the most threatened river in Kazakhstan. Intergovernmental agreements on water consumption by China and Kazakhstan along the Ili River are insufficient. Irrigated agriculture in the past [22,23] as well as an expansion of agricultural areas along the river basin in China have led to a reduction of water levels in the river and delta [20]. Decreasing water levels threaten the continued existence of the ecosystems in the Ili Delta and Lake Balkhash [5,20,23,24] and could reduce the number of livestock that can be sustained by the delta region.
Pastoral farming in delta regions of Central Asia, in general, and their vulnerability against water inflow changes, in particular, are lacking of scientific analysis. Studies on livestock farmer and their adaption strategies in response to increased water levels are available for the Niger Delta and Lake Chad in Africa. In both cases, farmers apply a mobile pastoral system. They migrate to the delta and lake area in dry seasons when fodder and water is easily accessible there and move to surrounding pastures in rainy seasons [25,26]. Farmers of Lake Chad increase move distances to adapt to rising lake water levels. Within the lake area, fodder and water is accessible by low movements. If lake water rises, farmers leave the lake area and have to increase move distances to find fodder for their livestock [26]. The Niger Delta is an important fodder source for pastoralists during dry season. The availability of fodder depends on the flooding intensity. A weak flood could decrease fodder production by 40% compared to a high flood year [27] and reduces the number of cattle that can be sustained through delta pastures by the same portion [26]. Investigations of pastoral farming in Kazakhstan focus on semi-arid [28,29,30,31,32] and forest-steppe regions [33,34] where mobile livestock systems are applied. In contrast to nomadic pastoralism, which is typical for steppe regions [31], or transhumance, which is applied in mountain regions of Kazakhstan [33,34], in the Ili Delta a stationary system is possible because pastures are highly productive during most of the year [35].
A reduction of river runoff will first affect the direct water supply for people and livestock, and will then result in lower productivity of pastures as well as smaller areas of available pasture ground in the Ili Delta. The delta offers extensive pastures to livestock owners; however, the productivity varies according to (ground) water levels and is heterogeneous. How decreasing water inflow affect the extensive but highly variable system should be part of the present study. Lower productivity and less available pasture grounds could lead to a scarcity of suitable pastures and conflicts between farmers in the Ili Delta. Kept livestock could exceed the pasture capacity if farmer do not offer additional feed. In response to that, pastoralists could use alternative pastures as described by Usman et al. [26], irrigate usable areas, purchase animal feed (hay or compound feed), or reduce the stock number [35]. All named strategies cause additional costs to livestock owners.
When considering costs the time horizon of analysis is important. Economists distinguish short run and long run. Within the short run there is at least one input of production fixed, whereas in the long run all production inputs can vary. One year is a frequent used short run period in agriculture [36]. One pastoral farming year in this study is counted from birth of offspring, and beginning of the vegetation period in spring until the end of hay feeding and start of new vegetation period next spring. Fixed inputs are land and machinery. The long run is broadly defined as repetition of pastoral farming years whilst all production inputs can vary.
In contrast to the national trend, the majority of cattle and horses in the delta region are kept by agricultural enterprises and individual farms and not by households [37]. Economic effects of reduced water inflow are more severe to individual farmers, which mainly rely on natural fodder provision through delta pasture [35] than to agricultural enterprises that usually use high-quality feed like alfalfa from irrigated agriculture [12].
This study aimed to assess economic effects in the short run of decreasing water inflow on individual farms—as an important and the most affected farm type—in the highly productive and vulnerable Ili Delta. This implies the following research questions.
  • What revenues and costs are related to types of individual farms in the Ili Delta?
  • How do individual farmers in the Ili Delta adapt to decreasing water inflow?
  • In the short run, what are economic effects of short- and medium-term decreasing water inflow on individual farms in the Ili Delta?
In answering these questions, our study contributes to the understanding of stationary pasture farming in natural delta regions and their vulnerability against decreasing water inflow, which has been rarely addressed in the scientific literature until now. Short and medium adaption strategies of individual farmers are identified, and their effect on farmer’s contribution margin and net farm income from operations are estimated using a short run time horizon of one pastoral farming year. In the literature, adaptation strategies are studied primarily in the context of climate change and a long-term time horizon. Specific to delta regions is the high variability of water inflows and thus the productivity of pastures. Farmer must constantly adapt to compensate for short-term and interannual variability of pasture resources. In terms of short-term adaptation strategies and importance of hay markets, our results can be of relevance also for other pastoral farming systems.
The article has the following structure: Section 2 provides a detailed overview of the Ili Delta and explains the relationship between water inflow to the region and water level in the region and the availability of pasture for livestock farming. Subsequently, the section describes farm and primary production data collection and characterizes types of individual farm for economic assessment. Afterwards, results of the contribution margin and uncertainty analysis and estimates of net farm incomes from operations are presented and discussed. The paper concludes with main findings and further research needs.

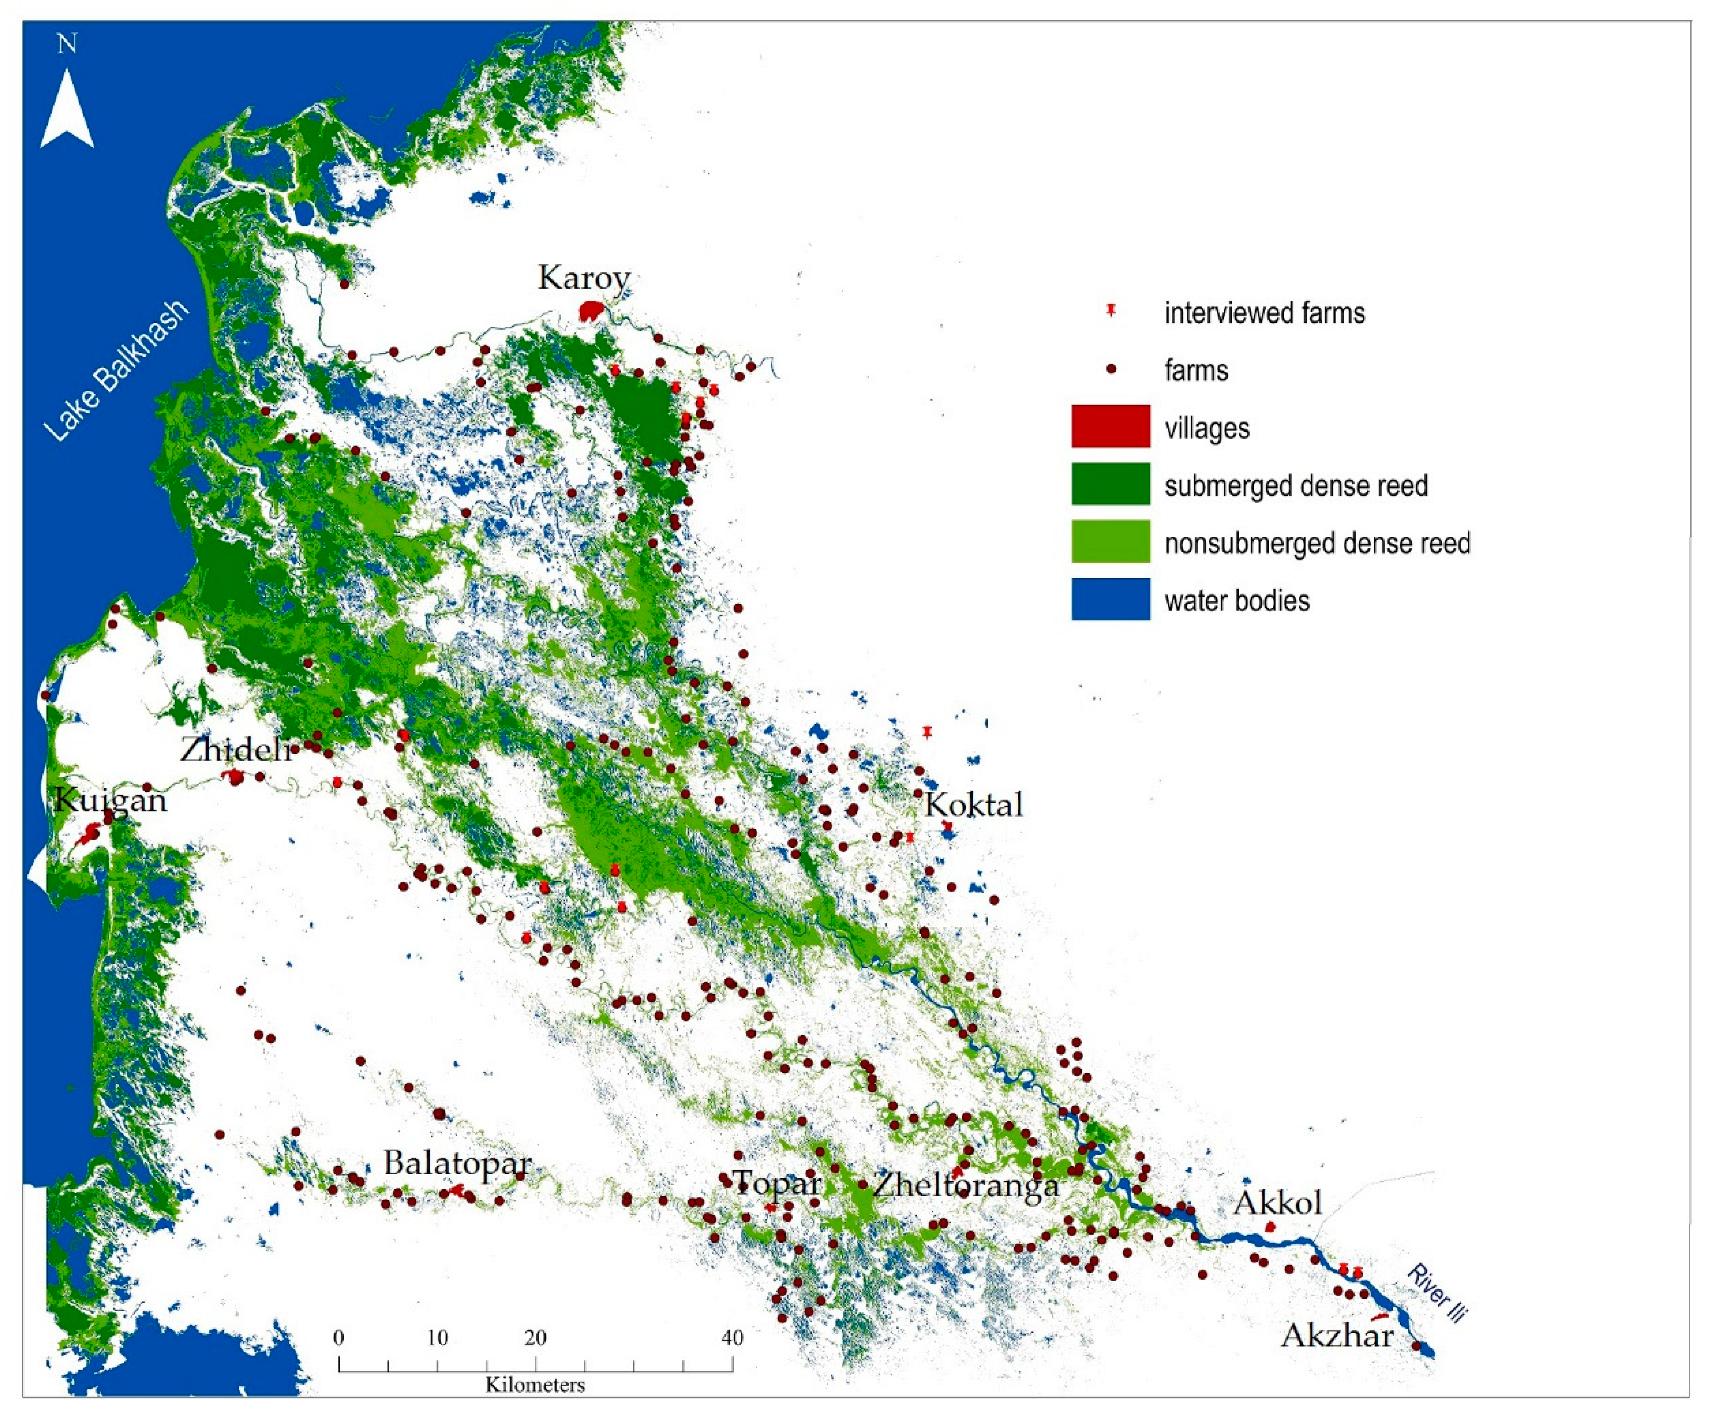
2. Description of the Study Area and Research Methods

The Ili Delta is located at the eastern shore of Lake Balkhash in the southeast part of Kazakhstan. Administratively it belongs to the Almaty region and Balkhash County [23]. Bakanas is the administrative center of rural Balkhash County. However, the metropolitan Almaty City, with around 1.8 million inhabitants in 2019 [38], is quite close (325 km) and offers large markets for livestock as well as livestock product trading [35]. The total Ili River Delta has an extension of 8000 km2 and is one of the largest natural river deltas in Central Asia [5,16,17]. The productive wetland part covers around 4000 km2 [39].
Our study area included nine of the 15 village districts of Balkhash County, which are part of the river delta. The nine districts cover an area of 262,000 ha [35] and had a total population of 13,767 inhabitants in 2016. The population density of the study area was 6.1 inhabitants per square kilometer [40], which is as low as the average for the whole country [8]. Only 8400 ha of the total land is covered by settlements. The remaining area can be used as grazing land [40].

2.1. Pastoral Farming in the Ili Delta

Pastoral farming is one of the most important land uses and income sources in the rural study area [35]. Generally, keeping livestock is part of Kazakh culture and the self-sufficiency of rural people, providing meat. Additionally, livestock serves as living capital on pastures [28,30,31,35]. Reed (Phragmites australis) is the main fodder plant [5,35,41]. Pastoral farming in the study area is stationary farming with year-round use of the same or neighboring reed beds as pasture and haymaking areas [35]. Agriculture enterprises and individual farmers acquire their use rights for pasture ground mostly through 49-year lease agreements [13,31,35,41]. In total, 441 farm entities—including individual farms and agricultural enterprises—operated in 2015 [37]. Sheep and goats dominate the keeping of livestock by households and use common village pastures around settlements [35]. Households against the national trend kept only 26% of the total 39,067 head of cattle in the study area in 2015. Farm entities are dominated by cattle husbandry. In 2015, individual farmers and agricultural enterprises of the study area kept overall 29,019 cattle, 10,618 horses, 12,162 goats, and 12,181 sheep [37].
Beef is the main farm product, and is sold locally in settlements or at regional markets, e.g., in Almaty City. Mainly one- and two-year-old bulls are traded. Cows are used to increase stock. Because of limited refrigeration in the rural areas of the Ili Delta, the local beef demand is low in summer and high in wintertime. Sheep and goats are in demand all year round. They can be consumed quickly due to their relatively low weight. However, two-thirds of households kept livestock in 2015 and thus could cover a major portion of their own needs. Large-scale individual farms and agricultural enterprises with higher sales volume trade beef mainly at regional markets in cities, where demand is relatively high all year [35].
In 2013, a new strategy for agricultural development, Agribusiness 2020, was introduced by Kazakh President Nazarbayev within the long-term Kazakhstan–2050 strategy, which was announced in 2012 [42,43]. The strategy involves various programs to improve different agricultural sectors, such as meat and milk production [13]. Only the so-called elite bull program, which is meant to improve beef quality and increase beef production, was used by farmers of the Ili Delta in 2015 [35]. The core of that program is to improve beef performance and beef quality through breeding with so-called elite bulls. Elite bulls for this purpose were farmed and traded by huge feedlots across the whole country [13]. Farmers in the Ili Delta have been joining the elite bull program since 2014, after the Otes Bio Asia LLP feedlot near Bakanas opened. Sixty-three farmer entities—including individual farms and agricultural enterprises—participated in the program [40] and received payments for cows (USD 95 year−1 per head) and traded elite beef (USD 1.6 kg−1) in 2017 [13]. However, this was only a small share of the 469 farm entities operating in the same year [37]. The reasons are high purchase costs for elite bulls and low numbers of cows on most of the farms in the delta. The ratio is one elite bull per 30 cows according to the rules of that program. Furthermore, elite bulls have to be replaced every second year, in order to avoid inbreeding. Many farmers have fewer than 30 cows, which curbs their motivation to invest in an elite bull. Farmers in the Ili Delta mainly keep cattle of the Kazakh white-headed breed [35], an old local beef cattle breed that is well adapted to the strong continental climatic and changing feeding conditions [44]. All in all, the elite bull program discriminates against households and small- as well as medium-scale individual farms, and provides more advantages for large-scale individual farms and agricultural enterprises [13,35].

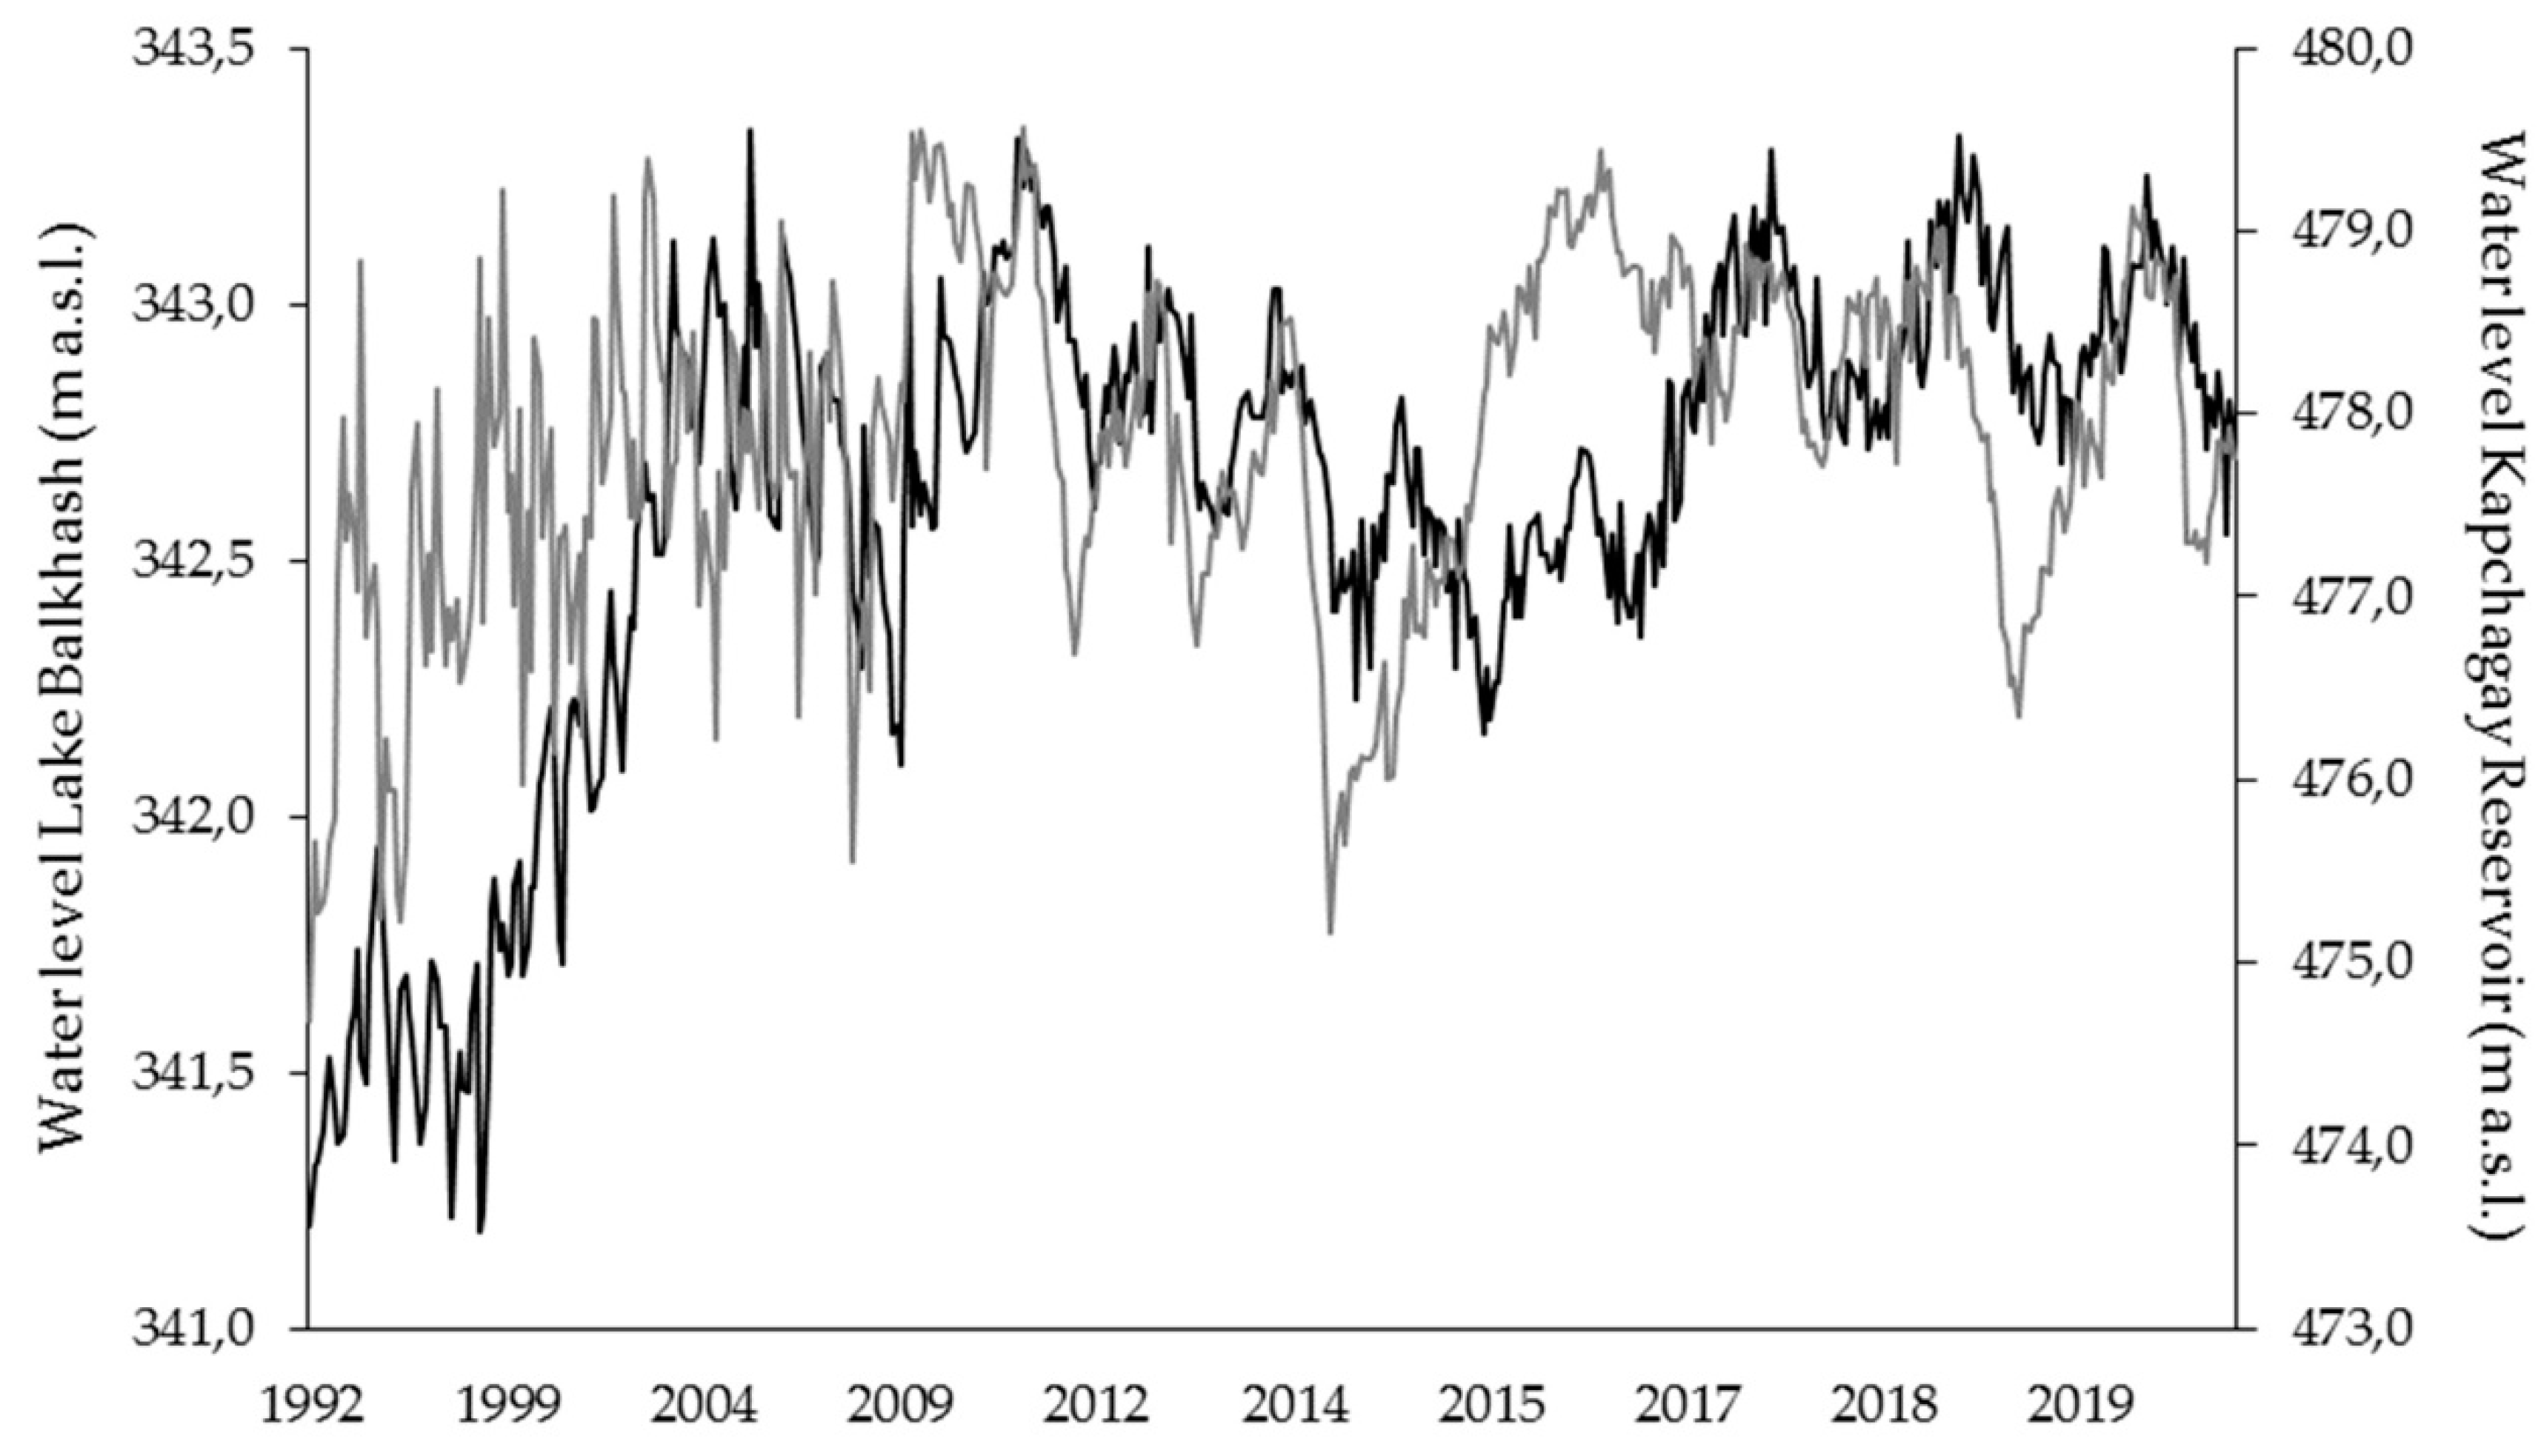
2.2. Water Inflow to Ili Delta and Lake Balkhash

For pastoral farming in the Ili Delta, water inflow is the limiting factor, which is driven by external factors. Directly, farmers need surface water to water their livestock in pastures. Indirectly, groundwater levels determine the composition of vegetation in the delta and therefore the quantity and productivity of pastures [35]. In the course of constructing Kapchagay Dam in 1969 and filling the Kapchagay Reservoir, the average annual runoff of the Ili River decreased by 22%, from 468 to 366 m3 s−1 in 1987 [20,21]. In 1988, the average flow rate rose to a slightly higher level of 489 m3 s−1 compared to the 40-year initial period and improved environmental conditions in the downstream Ili Delta [21]. After 1987, the inflow of the Ili River into the delta and Lake Balkhash increased, as illustrated in Figure 1.
The Ili Delta is subjected to seasonal and annual water inflow changes. Seasonal changes include annual water runoff fluctuations of the Ili River, which are highest in spring and winter and lowest in summertime [21]. Long-term inflow changes were caused by the construction and filling phases of Kapchagay Dam over several years. Thus, water inflow changes to the Ili Delta and Lake Balkhash are not new. In recent decades, expansion of irrigated agriculture along river branches [5,20,22,23] and variations of snow masses in the Tian Shan Mountains that feed the Ili River [46] have affected water inflow and threatened the use and productivity of delta pastures [5,35].

2.3. Linkage of Water Inflow and Reeds

The spread of vegetation depends on water inflow of the Ili River because of the arid climate, with lowest average temperatures of −7.1 °C in January and highest of 25.2 °C in July and low average precipitation of 241.3 mm year−1 [47]. Along the main river and channels, where groundwater levels are highest, vegetation is dominated by reed (Phragmites australis) as the main fodder plant for livestock keepers in the region [5,23,35,41]. Referring to Haeberlein & Kaiser [48], reed beds and grasses cover 11% (around 2900 km2) of the total delta area. At river branches and Lake Balkhash, reed beds are dense and submerged; with increasing distance from water sources, reed beds become non-submerged and less dense [5]. Groundwater levels in such areas are between 1.5 and 2.5 m [49]. If the groundwater level is lower than 2.5 m, reeds and grasses are replaced by herbs and shrub vegetation [5,23].
Figure 2 shows an overview of the Ili Delta and the most important land cover classes for pastoral farming in 2014. Farms are distributed along the shore of Lake Balkhash, rivers, and small water channels, where reed beds occur. According to satellite-based analysis of Thevs et al. [5], in 2014, water bodies (excluding Lake Balkhash) covered 1002.08 km2. Submerged dense reeds were spread over an area of 854 km2 (dark green area, Figure 2) and were not accessible for grazing or haymaking. The extent of non-submerged dense reed was 1263.78 km2 (light green area, Figure 2) and was the main important class for pastoral farming. These areas are highly productive and usable for grazing and haymaking. The largest area, with 1384 km2, was covered by open reed and shrub vegetation. At these sites, the water level is below 2.5 m [5] and reed productivity is low. Therefore, they are suitable for grazing but not for haymaking [5,35].
From the perspective of individual farmers that mainly used natural fodder provided by the delta, water levels for optimal operation are those that generate the maximum extent of non-submerged dense reed. Non-submerged reed beds can become submerged by seasonal floods. Because of short-term water inflow reductions, submerged reed beds can become non-submerged. If water levels decrease over a long-term period, groundwater levels will fall and highly productive reed vegetation will replaced by shrubs and desert herb species, which are not suitable for hay production [5,20]. Farm business as usual would become impossible in the region. Adaptation strategies would have to be implemented, which would affect the economic performance of individual farms [35].

2.4. Data Collection

We collected general information on pastoral farming through informative conversations with regional administrators in Bakanas and local administrators in five village districts: Karoy, Koktal, Akkol, Zhideli, and Balatopar (see Figure 2). Farm management and primary production data for contribution margin analysis and estimates of net farm incomes from operations were collected through 35 interviews with individual farms (8% of total farm entities as of 2015). Farm interviews were conducted in four of the nine village districts of the study area: Karoy, Koktal, Akkol, and Zhideli. Those four districts cover ~46% of the total pasture area [37]. Additionally, we received information on livestock and winter fodder management in the region through expert interviews with local veterinarians and hay traders. We conducted all interviews during the summer period from 24 July to 22 August 2015. An overview of interviews is given in Table S1 as Supplementary Material.
The survey included only individual farmers as an important farm type of and the most affected type by decreased water inflow to the Ili Delta. Farm interviewees were selected using snowball sampling. Snowball sampling is a method introduced by social scientists (see, e.g., in [50,51]). Recent studies have applied this approach to investigate hard-to-reach populations. According to Goodman [52], snowball sampling, or respondent-driven sampling, starts with an initial sample of people from the target population. Through this initial sample, the researcher obtains further contacts with people among the targeted hard-to-reach population. Each interviewee is asked for further contacts and therefore becomes a kind of research assistant [50]. The sampling design is based on the connections or social networks of people in hard-to-reach target populations [53].
We started our research directly in the administrative centers of the village districts. Local administrators, veterinarians, or villagers gave the first information about individual farmers and farm positions. Each interviewed farmer was asked to show the location of the next (neighboring) farm. The investigations in each village district were finished when no more farmers could be identified or reached for an interview. We conducted eight farm interviews in the village district of Karoy, nine in Koktal, seven in Akkol, and 11 in Zhideli. Semi-structured questionnaires were used to gather farm management and primary production data. The questionnaires included the following aspects [35].
  • Interviewee’s information
  • Livestock composition and detailed numbers
  • Pasture management, including pasture size and ownership structure
  • Sales and subsistence use of livestock per year, including market price information
  • Government program payments
  • Cost positions, such as veterinary and concentrated feed (kombi corn) costs
  • On-farm production or purchase of winter fodder
  • Water inflow changes, effects on pasture productivity and extent, adaptation strategies
To generate a database for qualitative and quantitative (mixed) data and for further data processing, farm interviews were digitized and structured in spreadsheets using Microsoft Excel 2016 [54].

2.5. Qualitative Characterization of Types of Individual Farms in the Ili Delta

To assess the impact of reduced water inflow on individual farmers’ performance, we established three farm types within the group of individual farms regarding their farm scale—small-, medium-, and large-scale. These three established types of individual farms are based on the collected interviews in the Ili Delta and do not refer to official classifications. Respondent farms belong only to the group of individual farms [12,13]. Referring to Ploeg [55] the farming style of examined farmers could be termed “low-external-input agriculture” [55] (p. 499). They follow the strategy of economical farming by minimizing external inputs—purchase of animal feed, commissioned work, and livestock purchase—and maximize utilization of internal resources. Especially categorized small-scale individual farms meet these criteria.
In contrast to single case studies for farms in each village district, we combined farm management and production data within the classified farm type without considering village affiliation to establish a more generalized impact assessment for the study area [56]. Table S2 of the Supplementary Material shows the number of categorized farms for the four investigated village districts. We applied distinguishing criteria for qualitative characterization of types of individual farms, which have implications regarding farm revenues and costs. Table 1 shows the characteristics of each type.
The herd composition, especially the number of cattle, was identified as the main criterion for differentiation. Different numbers of cattle require specific farm management practices and determine the possibility to participate in the government subsidy program (elite bull program). Local Kazakh administrations define individual farmers as livestock owners with a stock number of 10 head of cattle [57]. Based on the interview information, farmers need a minimum of 30 cows to be eligible to participate in the elite bull program [35]. Therefore, we set the thresholds for the group of small-scale individual farms as a minimum of 10 and a maximum of 30 head of cattle. Out of 35 farms in the study, 16 (46%) were classified as small-scale farms regardless their affiliation with a certain village district. A mixed stock composition is specific for this type of individual farm. Next to cattle as profitable livestock for production, farmers keep goats and sheep for their own consumption and trading. In rural villages of the study area, the demand for beef and livestock is low compared to urban areas. Almost no villagers have a cooling device, and they buy small amounts of beef (10–12 kg) during the warm period from May to September. Local demand is at its highest in the wintertime, when cooling devices are not necessary. Small-scale individual farms trade at the village level, because they do not attain large sales volumes. These farms only attain higher beef prices compared with sales prices in cities. On the other hand, such small numbers of cattle require a low mechanization level. Winter fodder is harvested by hand sickle. A car is necessary only for weekly stock control in pastures. Family members do all the work on the farm. Thus, this group also qualifies as family farms [35].
According to our research, the minimum stock number for individual farms that participate in the elite bull program was 82 cows, while the official limit for participation is 30. Only individual farms with high stock numbers can cover the cost of elite bulls every second year. In 2015, the purchase price for one elite bull of the Kazakh white-headed breed was USD 1848 (KZT 350,000) [57]. Consequently, we set the minimum threshold for large-scale individual farms at 80 head of cattle. We categorized five farms (14%) as large-scale. These big agricultural operations are specialized in cattle farming and in market-oriented commercial production. High sales volumes require trading at city markets in Almaty or Kapchagay and lower selling prices. Participation in the elite bull program means a high level of mechanization for this type, with modern tractors and harvesting technology as well as new stables. Based on our research, at least two employees are salaried, with fixed tasks. The employees are qualified specialists in cattle farming or machinery and often come from abroad [35].
For medium-scale type of individual farms, the minimum threshold was set at 31 head of cattle and the maximum at fewer than 80. We classified 14 farms (40%) as medium-scale. This group has a mixed stock composition of cattle, horses, goats, and sheep, like the small-scale farm type. However, the number of cattle is higher than 30 cows. Thus, they have the possibility to participate in the elite bull program, but do not take part due to the high purchase cost for elite bulls. Farmers use city markets for trading like large-scale farms because of low local demand and higher sales volumes. They use overaged tractor technology for winter fodder production. Based on the conducted interviews, farms have one salaried employee (mainly a shepherd) [35].

2.6. Contribution Margin Analysis and Estimates of Net Farm Income from Operations

In the first step, the economic performance of the three types of individual farms was assessed by contribution margin analysis, which is based on variable costs [36,58]. Further, net farm income from operations [36] was estimated by taking into account fixed costs for employed labor, leased land, buildings, and machinery. Our analysis focused on the short-run time horizon, that is, one year—from birth of offspring—and the beginning of the vegetation period in spring until the end of hay feeding and start of new vegetation period next spring. Monetary values were converted from the national currency, Kazakh tenge (KZT), to United States dollars (USD) using an exchange rate of 0.00528 from August 2015 [59]. We used the exchange rate from the month of data collection and before the drastic devaluation of KZT since September 2015 [60]. Contribution margins were estimated using averages of each farm type and are given in USD per stock for the base year 2015. Net farm incomes from operations also refer to farm-specific averages and are presented in USD for the base year 2015. The complete calculation procedure is shown in Table 2.
Farm revenues contain cash revenues and inventory changes for all farm types. Specific to small- and medium-scale individual farms is the value of own consumption, such as the farm’s internal consumption of beef and livestock, and specific to large-scale individual farms are government program payments as premiums for traded elite beef and cows. Calculations consider livestock that generates regular (annual) costs and revenues such as cattle, goats, and sheep. Horses, which attained the highest market prices—USD 5.28 kg−1 at local markets and USD 5.07 kg−1 at regional markets in 2015 [35]—were excluded due to irregular trading. Horses are kept on small- and medium-scale farms without additional hay feeding and are sold only in certain situations, such as weddings, enrollments, memorial services, or to raise money to purchase a car or build a house. In general, horses are considered as living capital in pastures [35]. Workhorses for completion of daily tasks are exceptions. They were accounted for in the contribution margins of medium- and large-scale farms. Occasionally, small- and medium-scale farms use cow’s milk internally, while large-scale farms specialize in beef production. As milk consumption differs substantially between interviewed farms and the local farm gate price was not available, the value of own consumption focuses only on beef and livestock consumption. Following the argument in [61], purchase prices provide more accurate estimates than farm gate sales prices. The latter could underestimate the value of internal consumption. The gathered data revealed that sales and purchase prices for beef and livestock are equivalent at local markets in the village districts. Therefore, the same prices were used for accounting of cash revenue and value of own consumption.
Variable costs are distinguished as independent of water inflow (veterinary, transport, kombi corn, and annual elite bull purchase) and dependent on water inflow (hay feeding for winter period). Labor costs were not considered. Employees at medium- and large-scale individual farms are salaried over a three-year period regardless of production level [35], consequently this is a fixed cost in short run [58].
Veterinary costs cover ear tags for livestock. Additional veterinary services are free of charge for all types of individual farm. Calves need two ear tags per head, lambs only one. In 2015, the price was USD 0.8 per ear tag across all farm types [35]. For transport costs, we accounted diesel consumption for weekly cattle stock control of small-scale farms and diesel consumption for beef trading at regional markets in Almaty City of medium- and large-scale farms. Based on the gathered data, stock control in a pasture using a car is solely done by small-scale farms. We considered two trips per week and 52 weeks a year. In summer and autumn, farmers control for cattle health, while in winter and springtime, ice covers of lakes and channels must be opened in order to maintain access to drinking water for cattle in pastures. Shepherds of medium-scale farms conduct stock control using workhorses and combine once a week control and daily pasturing of goats and sheep. A farm employee accompanies the cattle on large-scale farms during daily grazing by workhorse. An average distance of 325 km one way (total 650 km) was taken for transport of cattle to trade in Almaty City. For medium-scale farms, we set diesel consumption at 15 L per 100 km and two trips per year, with a maximum of four head of cattle transported. Trucks of large farm operations consume 300 L of diesel per trip. A capacity limit of 10 head of cattle per trip requires three trips a year for total annual sales. The average local diesel price was USD 0.5 l−1 in 2015 [35]. Costs for supplementary feed and elite bulls are incurred only at large-scale farms. Kombi corn is fed to workhorses year-round (365 days), with a daily amount of 1 kg per head. Cows get the same amount but only during the winter period (135 days). Farmers purchased kombi corn in Almaty at an average price of USD 0.2 kg−1 in 2015 [35].
Feeding costs consist of farm-specific annual hay demand and production or purchase expenditures. Costs for on-farm reed hay production at small-scale farms are based on diesel consumption and rental fees, whereas only diesel consumption for harvesting and transportation is accounted for on medium- and large-scale farms. According to our research, feeding expenditures vary depending on water inflow. We established three calculation scenarios to address different expenditure and water inflow levels. Detailed descriptions of all scenarios are given in the following section.
Table 3 shows the main calculation parameters for contribution margin—difference between total revenue and total variable costs—as averages of each type of individual farm in the Ili Delta. We chose farm-specific values to represent the characteristics of each type. Divergent management of farm types determine, for example, different breeding and rearing performance. Large-scale farms carry out breeding purposefully with elite bulls and therefore reach the highest calving rate of 90%. Medium- and small-scale farms use bulls of local breeds. Poor management leads to incest problems and low calving rates of 66% (medium-scale) and 75% (small-scale). The rearing rate of calves is almost 60%, mainly due to losses caused by wolves. Medium-scale farm shows a different rearing rate of 46% because shepherds employed for goats, sheep, and cattle are unaccompanied in pastures most of the year. In comparison, on family-run farms, cattle in pastures are controlled more carefully. Primary data for breeding and rearing performances of each type of individual farm is presented as Supplementary Material in Table S3. Price data were averaged regardless of established farm type, with the exception of on-farm production costs for reed hay.
In addition, the contribution margin ratio as an indicator of the importance of variable costs for small-, medium-, and large-scale farm was calculated using the following equation [62].
Contribution   margin   ration   ( percent ) = contribution   margin revenue
In general, the ratio indicates the share of each dollar value of total revenue toward fixed costs and farmers’ profit [62]. The higher the contribution margin ratio, the less important the variable costs [63].
To estimate net farm income from operations, we considered fixed costs for employed labor, leased land, buildings, vehicle for stock control or beef trading, and machinery for reed hay harvesting. An overview of calculation parameters as farm-specific averages is shown in Table 4.
Costs for employed labor were considered for medium- and large-scale farm. Based on Chayanov [64], we did not choose a labor–cost approach for unpaid family workers at small-scale farm due to a lack of opportunity costs. We included 1 shepherd for medium-scale and two cowboys for large-scale farm that are employed permanently for the fulfillment of everyday tasks—grazing accompaniment, water and feed livestock, cleaning stable, repairs and maintenance of buildings and machinery—at a fixed monthly salary. Next to cash paid salaries, employees get additional goods (daily food and drink, cigarettes, and clothes) and services (free of charge accommodation) that are not included as labor costs. Skilled workers at large-scale farm receive a higher average salary compared with unskilled shepherd. Costs for leased land consist of total land as average of each farm type multiplied by an average leasing price of the study area of USD 0.29 ha−1 and year. Straight-line method was applied to calculate annual depreciation for farm buildings, vehicles and machinery using the following equation [36].
Annual   depreciation   = cos t salvage   value useful   life
Gathered data contains only information on material costs inclusive material transport for stables with feed storages and houses for employees, as well as purchase prices for machinery that are used as costs. Assumptions are therefore necessary to specify salvage value and useful life of buildings and machinery. We assumed a useful life of 49 years for farm buildings as long as duration of leaseholds and a salvage value of USD 0. Construction and installation costs were not taken into account. Pasture fence is specific for large-scale farm type. Annual depreciation was calculated by material costs, a useful life of 5 years due to material-claiming weather conditions, and assuming no residual value. Ten percent of the purchase price was added for delivery fees and transport costs of new machinery that mainly comes from abroad—Russia or Kyrgyzstan. Useful life of 12 years for new hay harvesting technique and 15 years for new tractors was determined following the rule of thumb cited by [65]. Used tractors, trailers, and mowers belonged to the former state farms—sovkhoz—and were privatized after dissolution of the sovkhozes in the 1990s [29]. Based on our investigations, despite the age of the machines, small- and medium-scale type of individual farms are still handle and use it. Reasons are low supply and high costs of new technology. Further, farmers prefer known technique because it can be repaired and maintained autonomously [35]. For used vehicles, tractors and harvesting technique we assumed 6 years, and no residual value due to high repair costs for used technology after 6 years of utilization. Salvage values of new machinery at large-scale farm was estimated as percentage of purchase price in accordance to machine age using values provided by the American Society of Agriculture and Biological Engineers [65]. Therefore, we set 25% for tractor with 400 annual hours, 27% for mower, 23% for swather, and 25% for hay baler. Finally, we included annual taxes for vehicles and tractors based on farm type independent averages.

2.7. Calculation Scenarios

We established three calculation scenarios—normal situation, decreasing water inflow, and worst case—to address different feeding expenditures caused by adaptation strategies for reduced productivity and quantity of available reed beds in pastures due to decreased water inflow to the Ili Delta. Based on gathered data, variable winter fodder costs are directly associated with the availability of reed. Reed beds are year-round grazing grounds for livestock and necessary for on-farm, low-cost production of hay for the winter period of individual farms. Consequently, expenditures for hay as winter fodder are used as an economic indicator for water inflow changes. Only variable costs for winter fodder changed between calculation scenarios, while revenues, remaining variable costs, and total fixed costs were held constant. An overview of assumptions and calculation parameters is given in Table 5. Purchase prices for reed and alfalfa hay are averages of the study area and independent of farm type.
Calculation scenarios were derived from interview data. Under business as usual (normal situation) operation, hay is produced on-farm. Non-submerged dense reed beds are used for this purpose. The occurrence of such reed beds is linked to sufficient water inflow and a good connection to groundwater. Dense reed beds become sparse if water inflows to the region decrease and thus groundwater levels fall [5]. As an adaptation strategy, interviewed individual farmers buy hay from regional traders at high prices compared to on-farm production costs (see Table 6). We assumed for the decreasing water inflow scenario that individual farmers produce half of their annual hay demand on-farm and have to purchase the rest. To compensate for the reduced productivity and quantity of reed beds that are also year-round grazing grounds, farmers buy value-added alfalfa hay. Sparse reed beds will be replaced by open reed and shrub vegetation if (ground) water levels are low for several years. At such sites, groundwater levels are deeper than 2.5 m [5]. Interviewees reported such vegetation changes as a response to 3 years of decreasing water inflow (2013–2015). Open reed vegetation is unusable for on-farm reed hay production. The worst case scenario assumes perennially insufficient water inflow. On-farm winter fodder production becomes impossible. Individual farmers have to purchase all of their winter fodder. They purchase alfalfa and reed hay in equal shares due to the high cost of alfalfa. Production of alfalfa hay is limited to irrigation areas in Bakanas and Bakbakty, both at the margin of the delta. Only a small amount is traded annually, and prices fluctuate substantially when demand is high. Interviewed farmer faced such a situation in 2014 when the price of alfalfa hay increased from USD 0.1 to 0.14 kg−1 [35]. Purchase prices for reed hay seemed to be quite constant until 2015. We took into account an average purchase price of USD 0.1 kg−1 for alfalfa hay in the scenario of decreasing water inflow, USD 0.08 kg−1 for reed hay, and an upper bound value of USD 0.14 kg−1 for alfalfa hay in the worst case scenario.

2.8. Stochastic Simulation of Hay Prices

We assessed contribution margins by farm-specific averages and mean prices. To address uncertainties of collected data, Monte Carlo simulations were run to conduct a stochastic scenario analysis [66,67] for hay prices as the main important parameter of calculation scenarios. @RISK 7.5 Monte Carlo simulation software (Palisade Corp., Ithaca, NY, USA) was applied as an add-in for Microsoft Excel (2016). We defined a triangular distribution for purchase prices of alfalfa and reed hay in the decreasing water inflow and worst case calculation scenarios. The number of iterations was set at 10,000 [67]. Minimum, maximum, and mean were calculated based on gathered interview data (see Table 6).
Depending on farm locations in the Ili Delta and distances to local hay traders, individual farmers face different (local) prices. For alfalfa hay, two price ranges were used. Prices for the decreasing water inflow scenario indicate 2015 values. We used the price range of 2014, a high-demand year, to simulate the worst case scenario. Local prices rose due to a limited supply of and high demand for alfalfa hay. Primary 2014 prices were adjusted to 2015 due to inflation using a price change calculator [68]. For inflation changes, we fixed a period of August 2014–August 2015 as the main month of hay trading [35]. Probability distributions of contribution margins for worst case are graphically presented through relative frequency and cumulative distribution functions. Statistical parameters including range, mode, median, mean, standard deviation, and risk to generate a negative contribution margin for each farm type are shown. The graphic presents additionally the level of fixed costs. Based on simulation results, we indicated the risk of generating negative net farm incomes from operations. Finally, we recalculated net farm income from operations for each farm type in the worst case scenario by subtracting total fixed costs from mean and range of contribution margin. Figures S1–S3 of the Supplementary Material give graphical results of Monte Carlo simulation for the three types of individual farm in the decreasing water inflow scenario.

3. Results

3.1. Individual Farms and Adaptation Strategies for Decreasing Water Inflow

Farm interviews revealed three years of reduced water inflow to the Ili from 2013 to 2015. The impact on reed productivity and quantity differed between the four studied village districts, depending on the distance of districts and farms to river branches and water channels. Large distances lead to greater impact. Pastoral farming within the villages of Akkol and Koktal was already influenced by water shortage, which compromised the quantity and productivity of pastures. Both are located at the delta margin. Individual farmers who experienced water shortage impacts in pastures adopted the following adaptation strategies in 2015. Adaptation strategies can be distinguished in short-, medium-, and long-term regarding to time span and effect of decreasing water inflow on farmer’s pasture. As the effects of decrease water inflow on pasture are strongly dependent on the farm position within the delta, the differentiation should be understood as a guide but not as an absolute term. One to two years of decrease water inflow reduces productivity and extent of reed harvesting areas and results in short- and medium-term adaption strategies that mainly affect variable feed costs. A continued decline in water inflow into the Ili Delta over three or more years leads to a replacement of reed beds by shrub and desert species and requires long-term adaptions as reduction of livestock number.
The first short-term strategy was to use alternative haymaking areas. In general, farmers use haymaking areas close to their stables in order to keep transport costs low. Haymaking areas differ from grazed parts. Reed vegetation must be dense and tall for hay harvesting. Due to decreasing water inflows and sinking groundwater levels, these productive areas lose extent. They are concentrated closely along channels, where groundwater levels are higher. Farmers must accept longer transport routes and select harvesting sites at an early stage (May). In Akkol and Koktal, the decline of harvest areas led to competition among farms in 2015. If alternative sites were not sufficient to cover annual winter fodder demand, farmers started purchasing hay (mainly alfalfa) from regional traders in addition to reducing on-farm production. A complete purchase became necessary when no alternative haymaking sites were available due to the long distance from farms to river branches and water channels. Additionally, installing groundwater wells for watering livestock in pastures became necessary. The natural water sources that livestock usually use in pastures for watering became desiccated because of decreased water inflow. Long-term strategies are reducing livestock numbers, changing the farm location, and shutting down (commercial) farming.
In 2015, reduced water inflows affected 74% of interviewed individual farmers regardless of farm scale. Twelve farmers used alternative haymaking areas as the first short-term adaption strategy. A partly purchase of alfalfa hay was applied by six farmers. Eight farmers bought their entire annual hay demand [35] (Table 7).
No interviewed medium-scale individual farmer installed groundwater wells in response to reduced water inflow in 2015. This conspicuousness is due to the low number of interviews and the applied snowball sampling method to reach interview partners. Medium-scale farmers also stated during interview process that the installation of a groundwater well would be an adaption strategy if water inflow remains low. A further 13 individual farmers stated that they had to purchase part or all of their winter fodder in 2016 if water levels did not increase. Local governments recorded closure of 40% of farms in Balatopar district for the study year due to water shortage and pasture decline. A small portion of farmers migrated to a district near Lake Balkhash (Zhideli and Kuigan) to continue pastoral farming under better conditions. Pastures near the lake remained productive despite the decreasing water inflow. The migration to central parts of the Ili Delta or locations near Lake Balkhash was one of the final steps. People are deeply rooted to their home villages and do not want to leave. A large portion gave up pastoral farming and moved with only a small number of livestock to Balatopar village. Selling their stock means that farmers lose their living capital and further income opportunities. Besides the impact on their income, they are emotionally bound to their animals.
Only seven individual farmers, mainly in the Zhideli district, were not negatively affected and were able to continue their farm business as usual, including on-farm reed hay production. In this case, we found a short-term positive effect of decreased water inflow to individual farmers because previously submerged dense reed beds dried up and became accessible for grazing and haymaking. One farmer from Zhideli district started selling reed hay in 2014 due to increased demand. Compared to regional traders, he sold bundles (5–10 kg per bundle) instead of bales (around 200 kg per bale). The selling price of USD 0.14 kg−1 was higher than the average regional traders’ price of USD 0.08 kg−1 in 2015 [35].

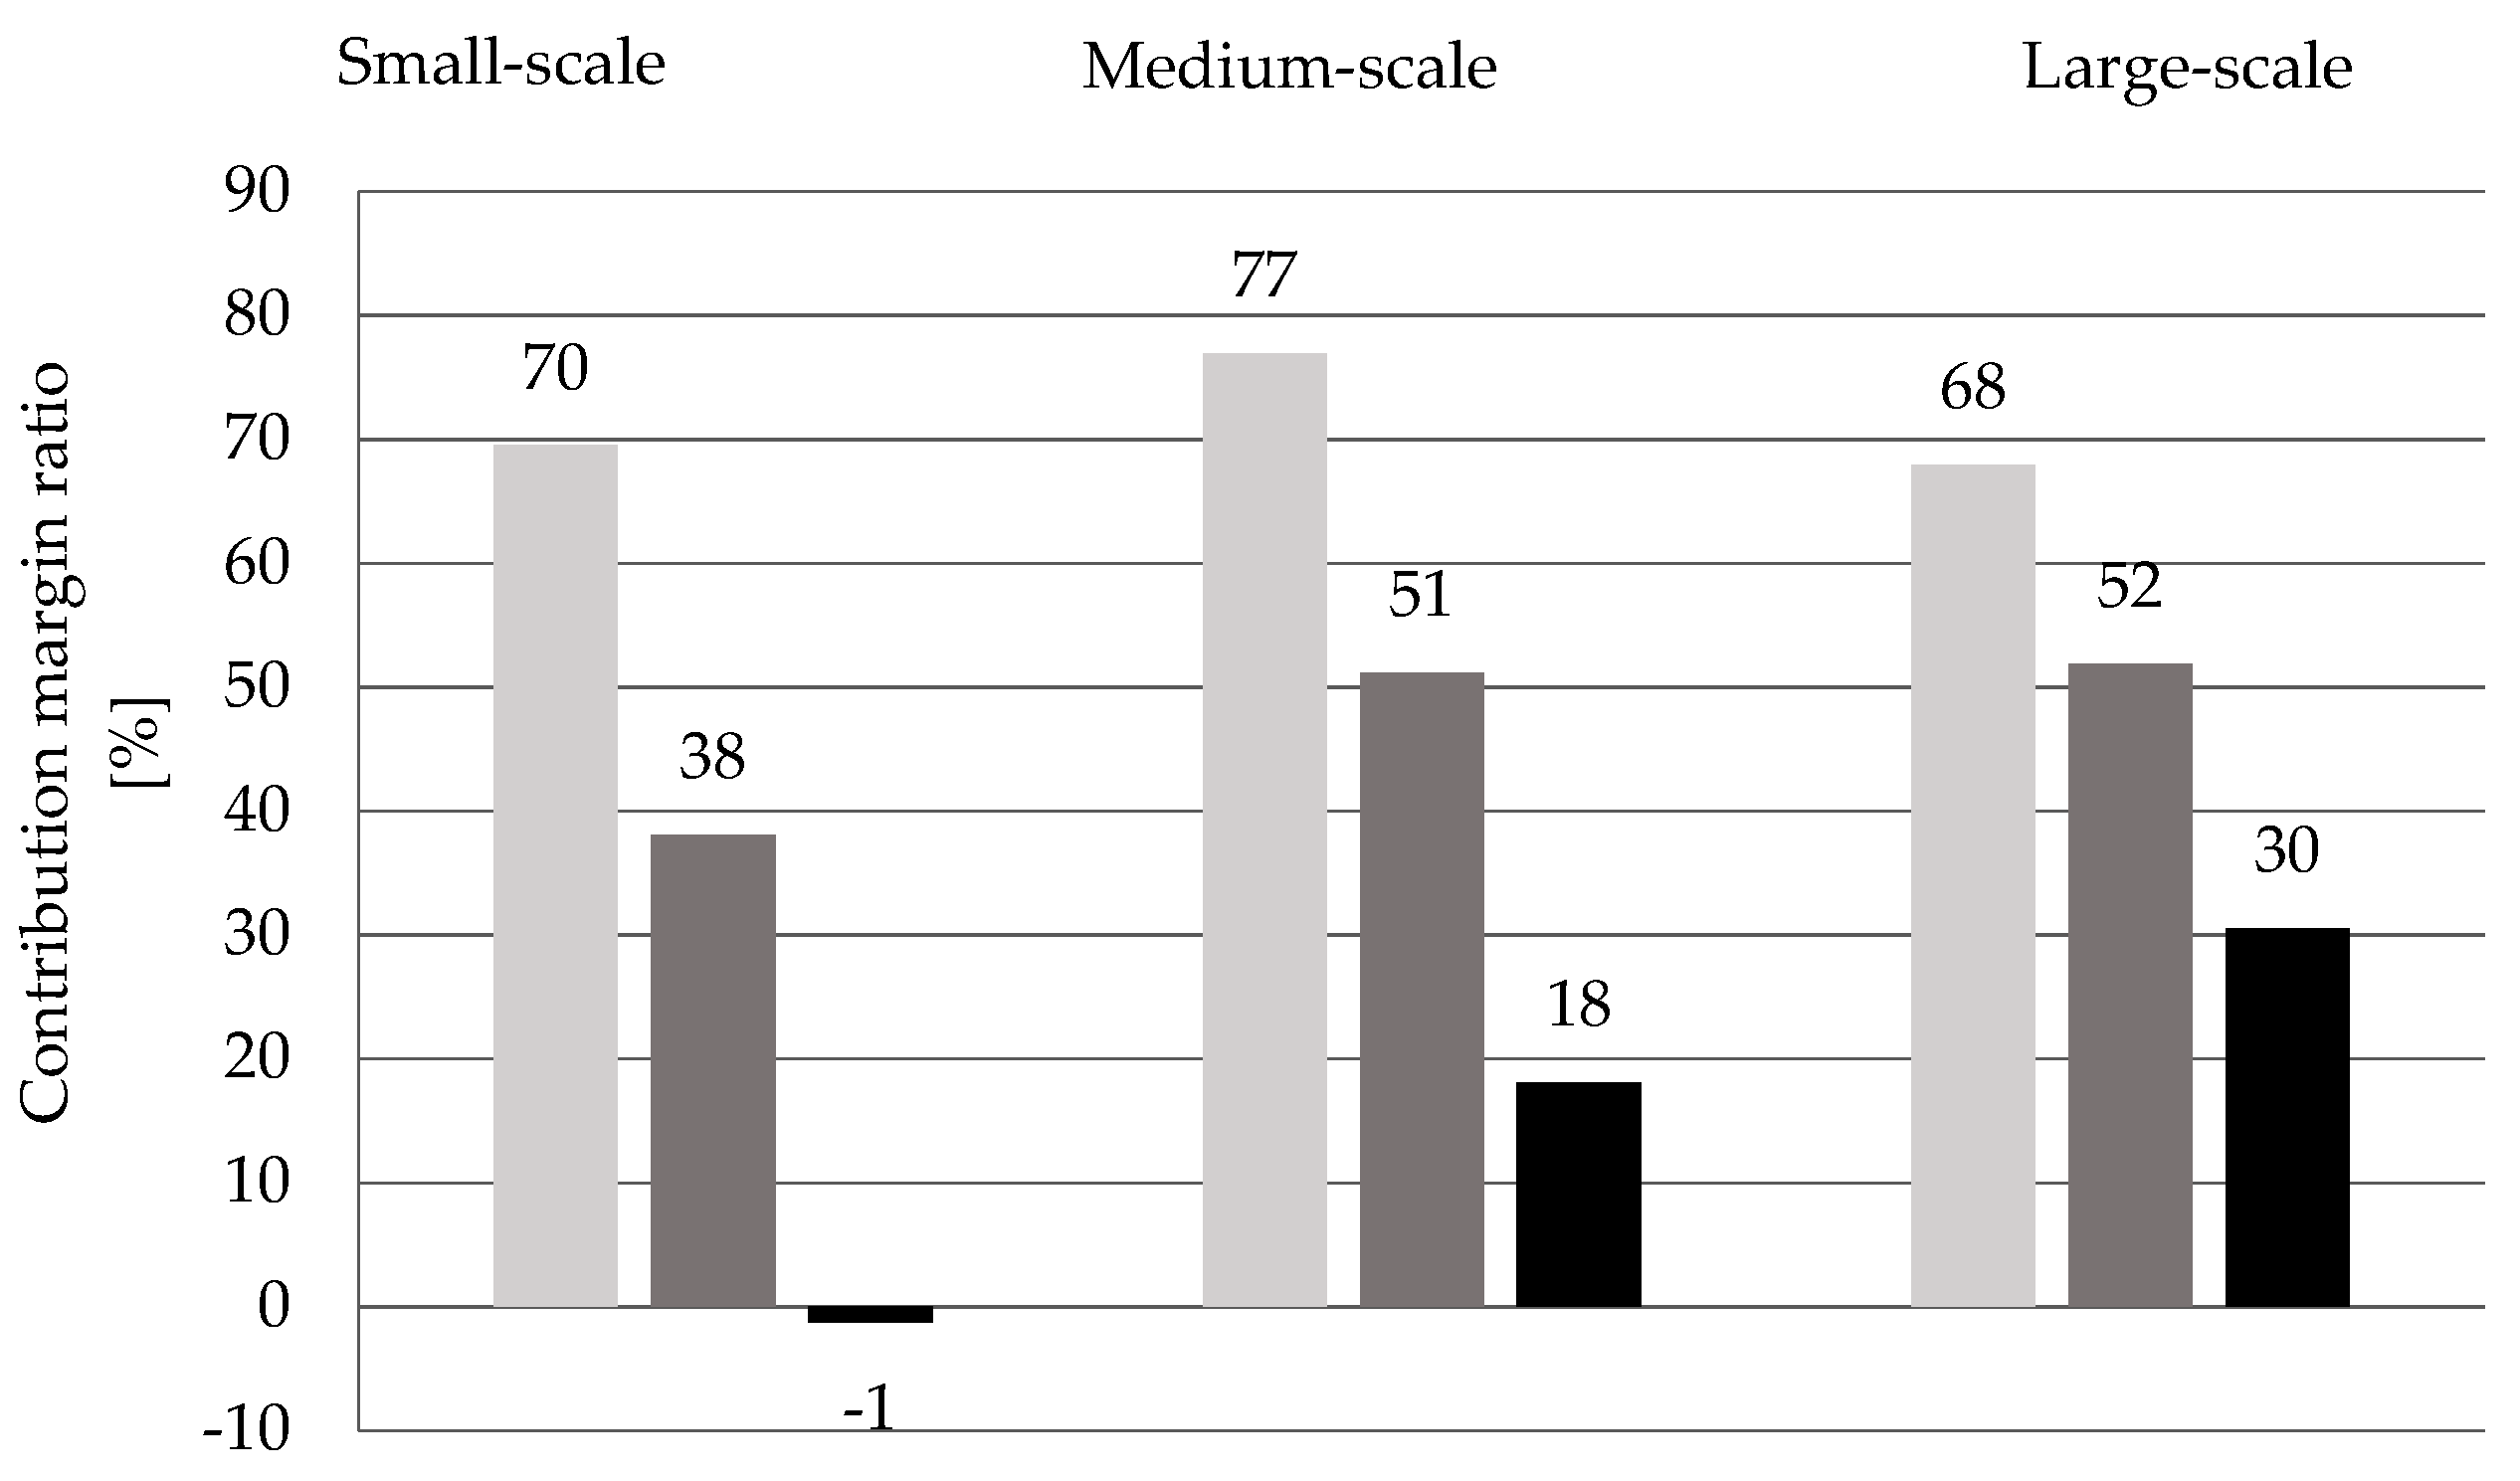
3.2. Contribution Margin Analysis and Estimates of Net Farm Income from Operations

Contribution margins and net farm incomes from operations were estimated for the three scenarios of water inflow using averages for small-, medium-, and large-scale type of individual farms. Farm revenues, variable costs that are independent of water inflow and fixed costs remained constant over the scenarios. For small- and medium-scale farms, ~50% of total revenue refers to cash sales. Share of production for subsistence use of meat to total revenue is 30% for both farm types. The smallest portion of total revenue refers to increased inventory. Large-scale farm shows an almost equal distribution of cash revenue, elite bull program payments, and increased inventory to total revenue of ~30%.
The normal situation indicates contribution margins of USD 3795 year−1 per stock for small-scale, USD 12,941 year−1 per stock for medium-scale, and USD 48,625 year−1 per stock for large-scale type of individual farms. Moreover, for business as usual, the production cost for reed hay is the highest. The cost of on-farm reed hay production contributes to total variable costs by around 50% for small-scale, 96% for medium-scale, and 67% for large-scale farm. Next to hay production, transport for stock control in pastures, which is a characteristic of small-scale type, generates the highest cost for this farm type (~47% of total variable costs).
If farmers purchase part of their hay as an adaptation to pasture changes because of decreasing water inflow, contribution margins for decreasing water inflow are reduced by 45% for small-scale, 34% for medium-scale, and 24% for large-scale individual farm compared to the normal situation. The loss of contribution margin is highest for small-scale individual farm, which generate the lowest on-farm production cost of USD 0.02 kg−1 in normal situation.
According to our research, purchase of all annual winter fodder (50% reed and 50% alfalfa hay) increases total variable costs in the worst case scenario by around 230% for small-scale, 255% for medium-scale, and 117% for large-scale individual farm compared to the normal situation. Variable costs exceed revenues of small-scale farm and generate a negative net farm income of USD −71 year−1 per stock. Despite the high cost of hay fodder, medium- and large-scale farm show positive contribution margins but at a significantly lower level (Table 8).
Contribution margin ratios for the three calculation scenarios and three types of individual farms are shown in Figure 3. The ratio is an indicator of the importance of variable costs. All types show a similar ratio of around 70% in the normal situation where on-farm reed hay production is possible. In the worst case, the ratio for small-scale type is negative. The ratio points out that only 18% (medium-scale) and 30% (large-scale) of each unit sale (or consumed) contributes to fixed costs and farmers’ profit; 82% (medium-scale) and 70% (large-scale) of total revenue are needed to cover variable costs.
Fixed costs remained constant over the calculation scenarios. However, variable feed costs increase over the scenarios and determine how much of total revenue remain to cover fixed costs as indicated by the contribution margin ratio. The share of fixed costs substantially rises with increasing farm scale. Total fixed costs are USD 550 year−1 for small-scale, USD 3923 year−1 for medium-scale, and USD 13,856 year−1 for large-scale type of individual farm. Employed labor for medium- and large-scale farm contributes highest portion to total fixed costs, followed by annual depreciation of vehicles and machines. For small-scale farm, around 80% of total fixed costs refer to annual depreciation of car for stock control. Family member managed and operated their farm completely by themselves, with no employed labor and low fixed costs for leased land and stable (see Table 9).
Net farm income from operations in normal situation is USD 3245 year−1 for small-scale, USD 9018 year−1 for medium-scale, and USD 34,769 year−1 for large-scale farm. In decreasing water inflow scenario, all three types of individual farms are able to cover fixed costs. Only large-scale farm generates a positive net farm income from operations in the worst case scenario. If all winter fodder is purchased the remaining smaller farm types cannot cover total fixed costs.
The complete calculation spreadsheets of contribution margin, contribution margin ratio and net farm income from operations for the three types of individual farm can be found as Supplementary Material Tables S4–S6.

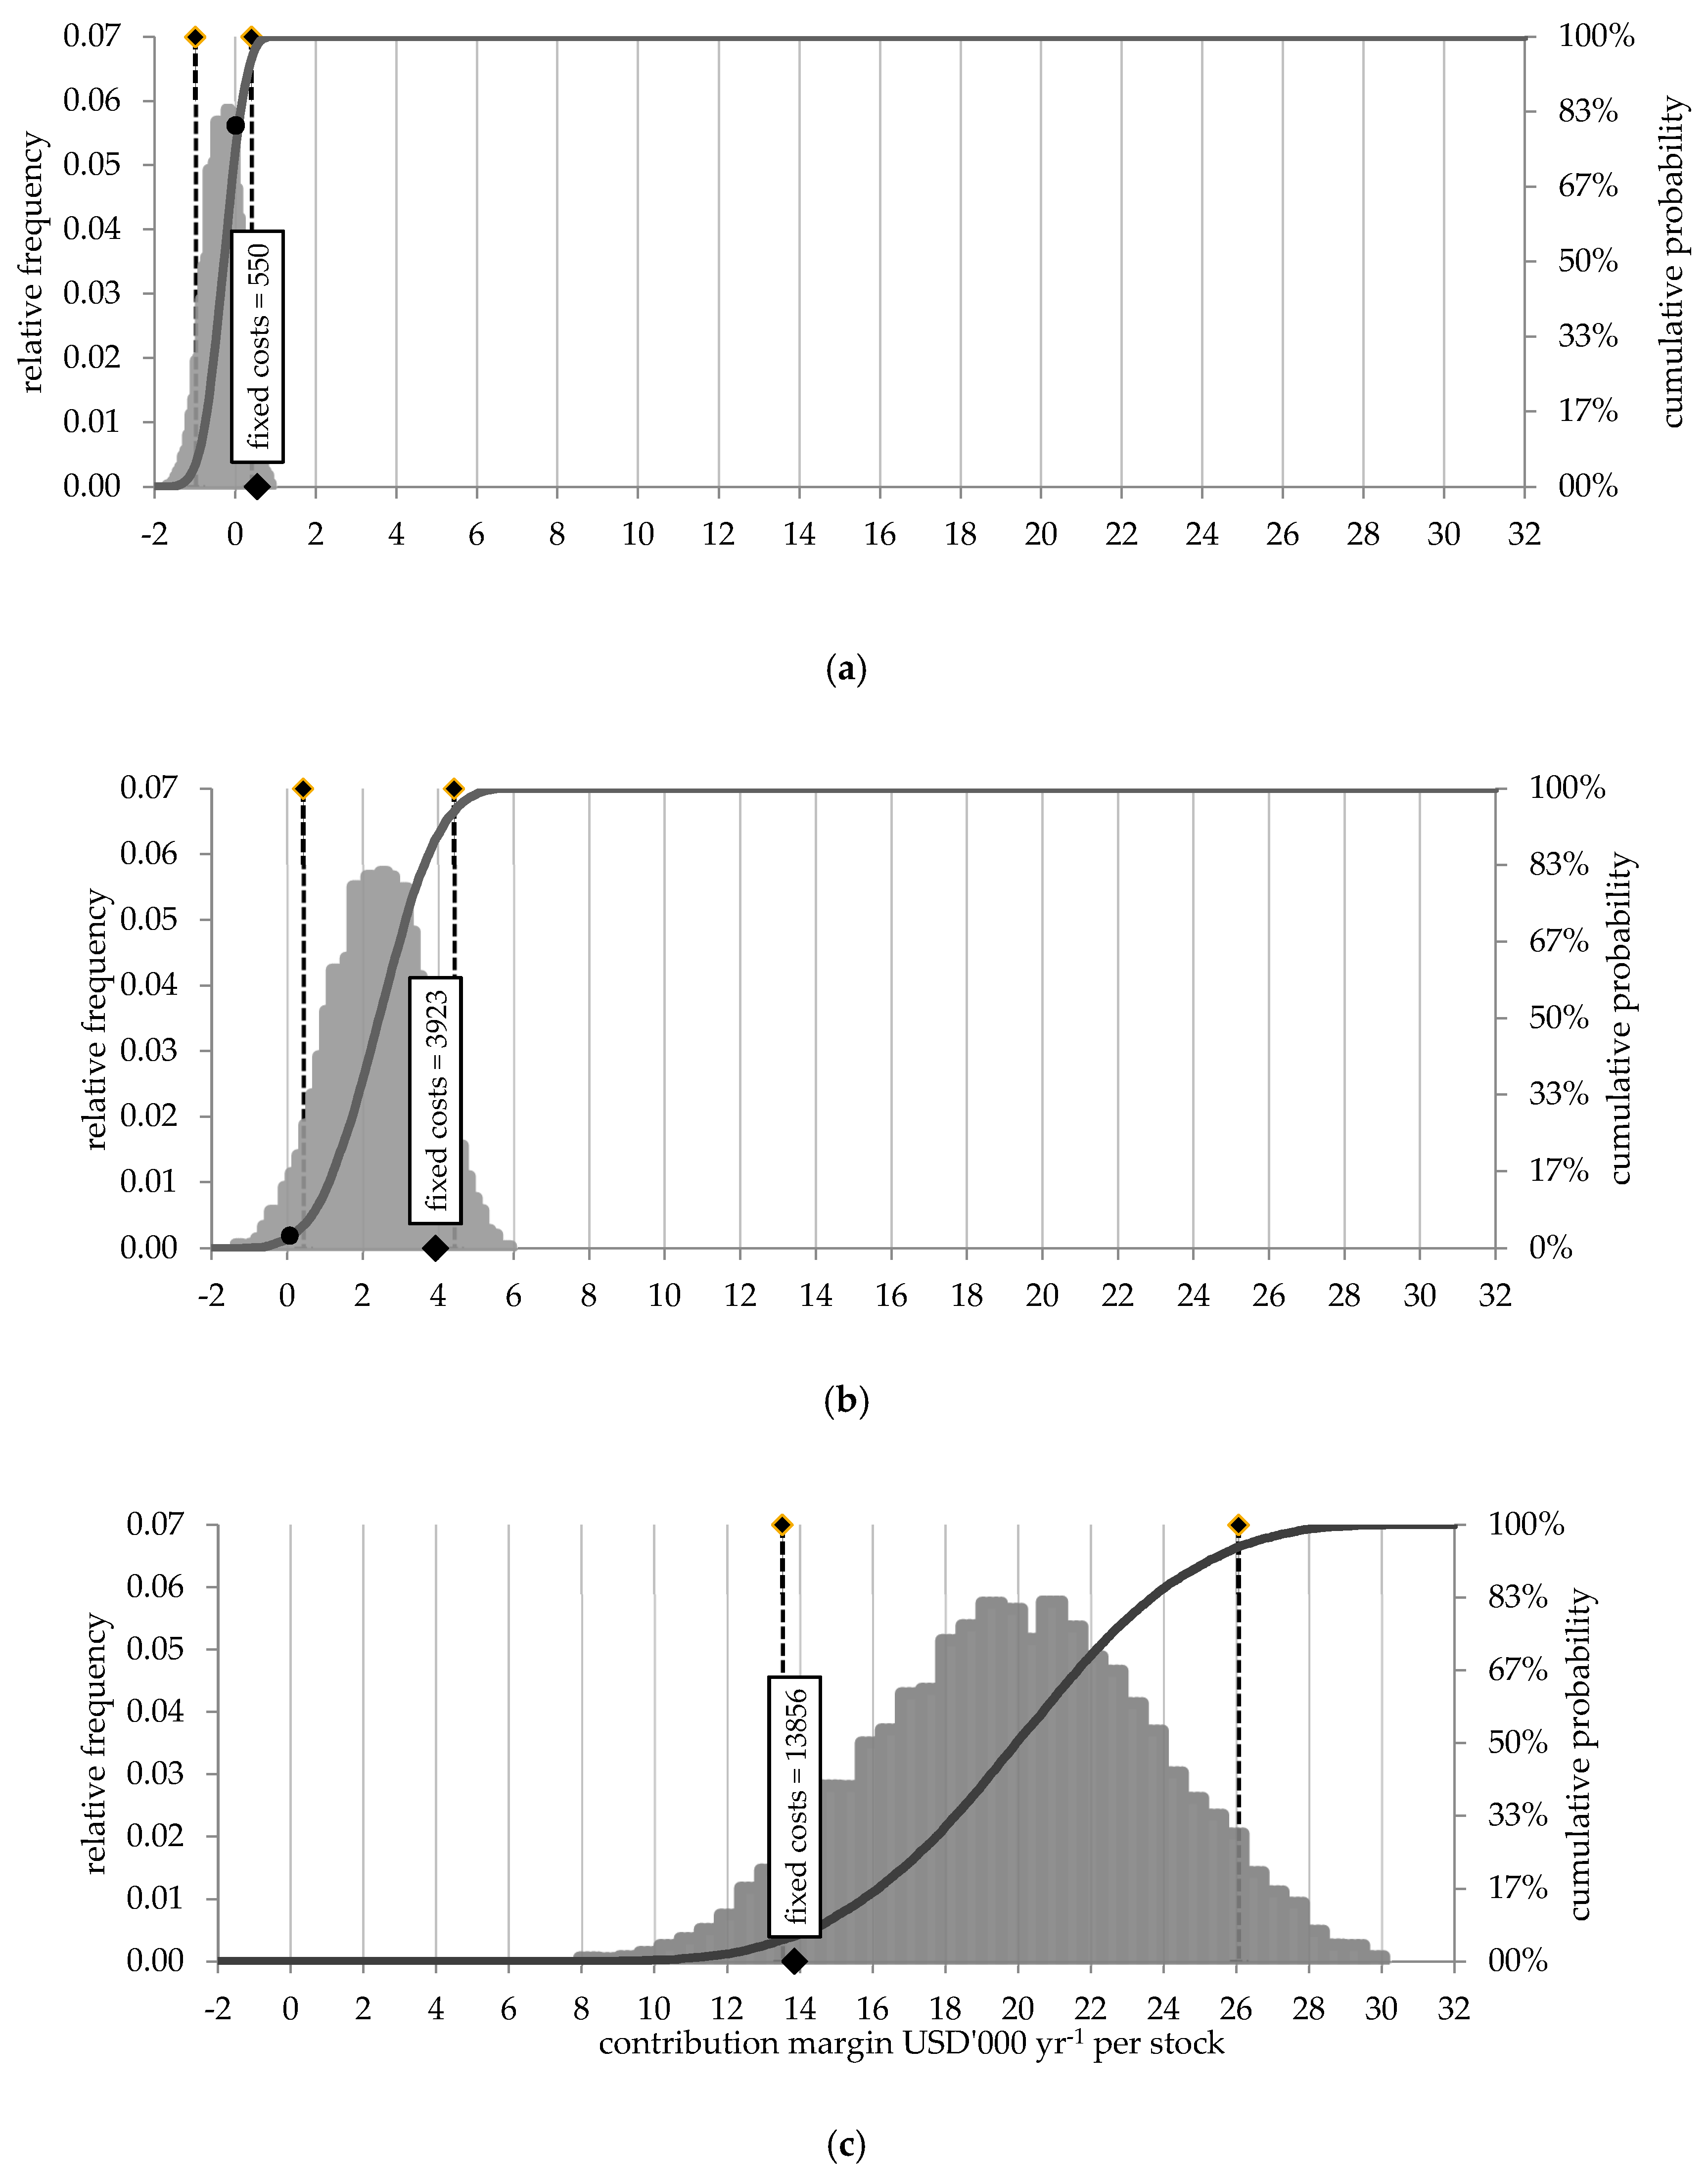
3.3. Stochastic Simulation of Hay Prices

Monte Carlo simulation was applied to address price ranges of alfalfa and reed hay in the decreasing water inflow and worst case scenarios. The rice company in Bakanas is the only alfalfa hay trader within the delta region. Alfalfa hay is a byproduct. Peripheral areas of irrigated land for rice production are used for cultivation. Local prices include transport cost, which rises as the distance to the production site increases. Thus, individual farmers in village districts of Akkol or Koktal faced lower prices (2015 mean, USD 0.09 kg−1) than farmers in districts farther away such as Karoy and Zhideli (2015 mean, USD 0.1 kg−1) [18]. Due to the limited alfalfa area and the monopoly position of the rice company, prices rise drastically when alfalfa demand increases. We took such a drastic price increase in the worst case scenario (range USD 0.1–0.18 kg−1) into account. Monte Carlo simulation gives a broader view of possible outcomes than contribution margin analysis and net farm income estimations based on averages.
Figure 4 and Table 10 give graphical and numerical results of Monte Carlo simulation of each type of individual farms in the worst case scenario where contribution margins and net farm incomes from operations are lowest and the probability of generating negative values is highest. If price ranges are included, mean and mode contribution margins are lower for all farm types in worst case (Table 10) compared to average calculation (Table 8). The same applies to net farm incomes from operations. The risk of generating a negative contribution margin is 74.4% for small-scale farms and, as expected, the highest risk compared with other farm types. For medium-scale farms, Monte Carlo simulation indicates a marginal risk of 2.6% that revenues cannot cover total variable costs in the worst case scenario. For large-scale farms, the probability is zero. Taking fixed costs into account the risk of generating negative net farm income sharply declines with increasing farm scale. The risk is 98.3% for small-scale, 88.8% for medium-scale, and 5.8 for large-scale farms. Excluding elite bull program payments, large-scale individual farm generates a low average contribution margin of USD 2425 year−1 and stock in the worst case. The contribution margin ratio would be reduced to 5%. That means that without government payments, large-scale farm needs on average 95% of revenue to cover variable costs. If we additionally address hay price ranges by Monte Carlo simulation, there is a 44% risk that variable costs exceed revenues in the worst case scenario. If also fixed costs are taken into account, the risk of generating a negative net farm income of operations rises to 100% (see Supplementary Material Figure S4).

4. Discussion

The aim of the study was to assess the economic effects of decreasing water inflow on individual farms in the Ili River Delta using an analytical short run time horizon that refers to one pastoral farming year. According to our knowledge, no comparative study has been conducted in delta regions of Central Asia. A comparison of economic results is therefore impossible.
However, Morand et al. [25] reported fodder production losses of livestock farmers and herders in the Niger Delta. Like the study area, the Niger Delta—located in the African state of Nigeria—is a fragile hydrological system, which faces high variations in the seasonal and annual water runoff. It is the leading area for Mali’s livestock farmers due to high productive pastures up to eight month a year. In contrast, farmers apply a mobile system by leaving delta region during flood season in July and migration to the delta pastures in November or December. Fodder availability depends on the flooding intensity. A weak flood could reduce fodder production by 40% compared to a high flood year [25,27]. Usman et al. [26] studied the implications on lake water changes on pastoralists in the Nigerian portion of Lake Chad. Pastoral farmer adapt to changes of Lake Chad by varying move distances. Within the lake area fodder and water is easily accessible and farmer reduce movements. If lake water rises, farmer leave the lake area and have to increase move distances to find fodder [26]. The major difference to farmers in the Ili Delta is the mobile pastoralism. Studied individual farmer apply a stationary system with leasing contracts for pastures of 49 years. A variation of move large distances is therefore not a suitable adaption strategy. Nevertheless, the interviewer reported changing distances to find alternative haymaking areas in respond to decreased pasture productivity by reduced water inflow.
Kerven et al. and Robinson et al. [31,32] address the Chu River floodplain in the Dzhambul region of Kazakhstan, located at the western border of the Almaty region and southeast of Lake Balkhash, as grazing ground of local pastoralists. Reed (Phragmites spp.) of the Chu River floodplain is used for year-round grazing for cattle and hay for the winter. We found further similarities of pasture characteristics at Chu River, reported by Kerven et al. [31], and the Ili River Delta. In floodplain pastures, there is free access to water for watering livestock. Farmers and livestock owners do not fully rely on wells as they do in semi-arid or arid pastures. Major problems include the presence of insects in spring and summer and the risk of wolf attacks, notably in autumn and winter. Reed beds offer good privacy screens for wolves, so they can stay close to livestock [31]. The rearing performance according to interviewed individual farmers in the Ili Delta was reduced by 37–54% for calves, 26–50% for kids, and 30–68% for lambs, mainly due to livestock losses from wolf attacks [35].

4.1. Adaptation Strategies and Economic Effects of Decreasing Water Inflow on Individual Farms

Farm interviews revealed a decrease in water inflow to the Ili Delta between 2013 and 2015. Water level data of Lake Balkhash also show a general downward trend for the mentioned period (compare Figure 1). Using alternative haymaking areas and purchasing hay were the most common short- and medium-term adaptation strategies for loss of pasture productivity and extent due to reduced water inflow in 2015. These strategies were used across all types of individual farmers. Depending on the distance of districts and farms to river branches and water channels, the impact of reduced water inflows on pastures differed between the four studied village districts. Reed beds within districts at the delta’s margin (Akkol and Koktal) showed reduced productivity and quantity as effects of decreased water inflow. Farmers in Karoy and Zhideli, close to Lake Balkhash, did not suffer any pasture losses. Formerly submerged dense reed beds dried up and became accessible for haymaking and grazing [35]. The highest occurrences of extended reed beds are in the delta’s core zone and near Lake Balkhash, where groundwater and water levels are higher [5]. Thus, pastures of margin districts are more vulnerable to decreasing water inflow than reed beds of the core zone. In a dry year or period, the location for optimal pastoral farming is close to the delta’s core zone. In contrast, this production location would be most vulnerable in a wet year or period, when reed beds become submerged and unusable for haymaking or grazing. The optimal location for farm businesses would be at the margin of the delta. Adaptation strategies such as using alternative haymaking areas and purchasing winter fodder could also count for flood years when submerged reed beds are not accessible for grazing and haymaking.
We measured the economic effect of decreasing water inflow in the short-term—referring to one pastoral farming year—by an increase in feed costs. Our calculations indicate that farm scale of the examined individual farmers is important to determine whether farmers could cover higher costs for winter fodder compared to on-farm reed hay production. Feed costs are the highest overall in the calculation scenarios. Even on-farm production generates the highest variable costs in the normal situation. In the short run, small-scale farm is most sensitive and large-scale farm is the most resilient to covering costs for partial (decreasing water inflow) or complete (worst case) purchase of hay. Even a deduction of variable costs in the worst case scenario results in a negative contribution margin for small-scale farm. Monte Carlo simulation that gives a wider spectrum of possible outcomes by addressing varying hay prices indicates the highest risk to generate negative contribution margin of ~74% and negative net farm income from operations of 98% for small-scale farm. This corresponds to statements by interviewed family farmers. They reported that hay is expensive and exceeds received revenue [35]. However, we expected, when accounting for fixed costs, the performance of large-scale type would be more sensitive to increasing hay cost. Due to the reason that large-scale individual farm faces the highest fixed costs as employed labor and depreciation for new stable and machinery, these farms might be more seriously affected by reduced water inflow than small-scale individual farms. Against our expectations and despite highest fixed costs of USD 13,856 year−1, large-scale type of individual farm generates positive net farm income from operations and shows the lowest risk of 5.8% for generating negative values in worst case scenario. Based on our calculations, large-scale farm can only compensate for the additional costs of buying hay by receiving governmental program payments that account for one third of annual total revenue. If government program payments—USD 95 per cow and year, and USD 1.6 per traded kg elite beef—and related annual costs for elite bulls—USD 924 per elite bull [57]—were excluded, the average contribution margin of large-scale individual farm drops to USD 2425 year−1 per stock in the worst case, which represents a loss of 89%. Monte Carlo simulation shows a 44% risk that variable costs exceed revenues (Supplementary Material Figure S4). After deduction of fixed costs, average net farm income from operations is USD −11,431 year−1. Risk of generating negative net farm income rises to 100%. That means that subsidy payments strongly support the large-scale contribution margin and net farm income from operations. Changes of subsidy amounts from the elite bull program affect the calculated robustness against rising hay costs. In 2019, annual premium payments for cows were downgraded to USD 26 [69]. This reduces the revenue from government program payments and additionally the robustness against raising hay prices.
In 2015, the elite bull program discriminates against small- and medium-scale individual farms because of the ratio of one elite bull per 30 cows and high costs for elite bulls every second year. That curbs motivation of these farmers to invest in an elite bull. Two thousand nineteen, the ratio was revised and its now one elite bull per 25 cows. Further, high purchase costs of an elite bull could be subsidized [69]. Consequently, also smaller farms will have the possibility to participate in the program and bear the costs for the elite bull.
Following the strategy of “low-external-input agriculture” [55] (p. 499) studied individual farmers firstly try to find alternative haymaking areas when pastures are affected by decreasing water inflow, and try to avoid the use of external input (partly or complete purchase of hay). Small-scale individual farms have an advantage to use remote haymaking areas due to their relatively low annual hay demand and low mechanization level. They cut reeds by hand sickle and thus can reach impassable areas. Medium-scale and large-scale type of individual farms have a higher annual hay need. Mechanized haymaking makes them less flexible in the field than small-scale type. However, based on our economic assessment only large-scale individual farm is robust against rising feed costs through governmental payments of the elite bull program.
Increasing feed costs due to pasture productivity and quantity losses as a result of decreasing water inflow threatened small- and medium- scale type of individual farm and induced an advantage for large-scale businesses that participate in the elite bull program in the Ili Delta in 2015. We feared a reduction in livestock and farm closures at small- and medium scale, as mentioned for the margin district Balatopar. These type of individual farmers face a lack of employment alternatives in the rural study area, which additionally threatens their existence in the future. The closing of small- and medium-scale type of individual farms as meat suppliers for local and regional markets may endanger food security, also across the borders of the Ili Delta [35]. Next to the uncertainties of future water inflow as a result of expanded water use along the upstream branches of the Ili River in Kazakhstan and China [20,22,23], pastoral farming in the delta region faces new challenges such as the reintroduction of the tiger [70].

4.2. Method Limitations

Method limitations arose in addition to the limited database and devaluation of the local currency since 2015. The contribution margin analysis does not account for horses of small- and medium-scale farms because horse husbandry does not generate regular costs and revenues; the exception is workhorses. Nevertheless, horses are living capital that could be spent in urgent cases, such as to purchase hay for the winter. Estimations of consumed units at small- and medium-scale farm are lower-bound values because they refer only to livestock and beef consumption. We did not account for milk consumption due to lack of farm gate prices and substantial differences in use. According to Chibnik [71], consumed units at farms could be measured by selling or buying prices. Regarding our data, selling and buying prices for livestock and beef at local village markets are equivalent. Therefore, we estimated cash revenues and value of own consumption of small- and medium scale farm based on the same local average prices. Accounting for consumed units at farms does not require that livestock and beef would be equally demanded at local markets when on-farm production declines [71]. The interviews showed that demand falls if on-farm production drops.
The short- to medium-term effects of reduced pasture productivity and quantity because of decreased water inflow were economically measured by rising hay costs using a short run horizon. Revenues, remaining variable costs, fixed costs, and annual hay demand for farm types were held constant over calculation scenarios. We presumed that loss of productivity and quantity of pastures, which are year-round grazing grounds, would have stronger economic implications in terms of farm performance in the short run than the results show. If the annual amount of hay remains constant and pasture productivity and quantity are reduced, a decrease in livestock weight is expected. This would diminish the cash revenue received for livestock and beef sales. In particular, beef sales would be affected because cattle are sold according to their meat weight. To maintain livestock weight in the decreasing water inflow scenario, but especially in the worst case, farmers have to compensate weight losses by increasing the feed amount of hay, expanding the hay feeding period, or a combination of both. Further, farmers could invest in supplementary feed such as kombi corn (small- and medium-scale individual farms) or increase the feed amount (large-scale individual farms). These compensation strategies would increase variable costs for feed. Thus, reduce contribution margins and net farm incomes from operations. The obtained data do not provide sufficient information to account for compensation strategies of livestock weight, particularly in the worst case. Moreover, local veterinarians recorded an increase in livestock diseases such as eye inflammation and respiratory tract infections in cattle during the dry period from 2013–2015. Veterinary services for Kazakh farmers have been free of charge since 2013 [35]. However, farmers have to pay for any required medicine. Our calculations consider only ear tags as a veterinary cost. Based on veterinarians’ statements, a higher disease rate and thus medicine cost should be assumed in the worst case. These would increase variable costs as well and further reduce the contribution margins and net farm incomes from operations of individual farms.
Due to lack of data for fixed cost accounting, author’s assumptions had to be made for salvage values and useful life of farm buildings, vehicles and machinery to calculate annual depreciation. We applied straight-line method that used an equal annual depreciation over the asset’s useful life. Especially the market value of new machinery will fall more in the first than in later years. Application of depreciation method of declining balance would be more applicable and a long run time horizon of economic assessment [36].
We collected primary production data as well as one-time prices and prices before the devaluation of the national currency, Kazakh tenge, in 2015 [60]. The investigation year was part of a three-year dry period. Since the flood in 2016, water levels have risen to pre-decline levels (compare Figure 1). A broader database is required to improve the economic assessment and understand the application of adaptation strategies of individual farmers in flood years or periods. Research into medium to long-term adaptation strategies of individual farms in the Ili Delta including a long run economic assessment, such as a net farm income or return to labor analysis, would be a promising extension of our research. Referring a long run time horizon, a variation of fixed costs would be possible. In particular, employed labor and depreciation of reed harvesting machinery contribute highest share to total fixed costs in short run. The duration of employment contracts for salaried shepherd at medium-scale and cowboys at large-scale type of individual farm is three years [35]. Toleubayev et al. [14] reported also a permanent employment of workers at Kazakh individual or peasant farms to motivate employees and to maintain farm buildings as well as machinery. Considering the contract duration, the long run should count for more than three years to vary costs for employed labor. Medium- and large-scale farm could reduce costs by terminating employees. Additionally, machinery for reed harvesting could be sold if water inflow remains low and on-farm hay production becomes impossible. The sale of machines could further strengthen the advantage of large-scale farm in the long run.
The present study focuses only one farm type of the Ili Delta. Further investigations should also address the role of agricultural enterprises and households in local pastoral farming, their impact on water and pasture use, and their vulnerability to changes in water inflow. Agricultural enterprises as large-scale individual farms could have same advantages to be robust against increasing feed costs due to the receipt of government payments. In general, uncontrolled effects that change production environment—as decreasing water inflow—could limiting the specialization benefits of large farm operations [72]. Due to governmental program payments, large-scale individual farms can compensate high feed costs. In contrast to agricultural enterprises of the Ili Delta, that use high-quality feed from irrigated agriculture [12], examined large-scale individual farmers mainly based on natural fodder provision by the delta and are therefore more vulnerable to water inflow changes. The calculated net farm income from operations only accounts for taxes of vehicles as well as tractors and generally represent net farm income from operations before taxation [36]. Advantages of reduced tax liabilities of individual farms compared to agricultural enterprises [14] should be included by estimating net farm income from operations after taxation.

5. Conclusions and Further Research

The study shows that decreasing water inflow leads to a reduction of pasture productivity and quantity. Individual farmers of the Ili Delta adapt to pasture reduction in the short- and medium-term by purchasing winter fodder (hay). Increased feed cost significantly reduces contribution margins and net farm income from operations in short-run economic assessment. In contrast to small- and medium-scale farms, large-scale type of individual farm are robust against rising feed costs because of participation in the elite bull program and receipt of government payments.
Data of the study are based on one interview campaign in 2015 at the end of a three-year dry period and before the devaluation of the national currency. Investigations were done for individual farm type as an important and most affected farm type of changing water inflow. Applying a short time horizon of one pastoral farming year for contribution margin analysis and estimations of net farm income from operations only allows measuring economic effects of short- and medium-term adaption strategies to decreasing water inflow. The following considerations can be made to expand our economic assessment and research on pasture farming under changing water inflow to the Ili Delta.
In the past, years of reduced water inflow were followed by years of increased water inflow, creating multiannual fluctuations. In 2016 after a three-year dry period, a large part of the Ili Delta was flooded. The following three years show a noticeable increase in water inflow. This eases the financial situation for smaller farmers, but also brings new uncertainties. Under sufficient water inflow, pastures of the Ili Delta are highly productive in contrast to semiarid rangelands in the Almaty Region and therefore interesting production grounds for new farmer. Since 2015, the number of operating farms in the Ili Delta and Balkhash district is slightly increasing. However, in the long run, a reduced water inflow into the Ili Delta is expected. In such a scenario of continuously decreased water inflow, small- and medium-scale individual farmers at the margin of the Ili Delta in particular will have to reduce livestock significantly or shutting down (commercial) farming. The lack of education and employment alternatives for these farmers threatens their existence in the longer future. Large-scale individual farm could force out small- and medium-scale farm type because of its higher economic robustness against increasing feed costs. This robustness based on governmental payments that account for one third of total revenue. Nevertheless, under the Agribusiness 2020 there are always changes in the programs that could reduce or enhance calculated robustness of large-scale individual farms. The changes in the political context and in subsidy payments should be focused by further studies. Continuing investigations are necessary to evaluate the role and advantage of large-scale individual farmer under changing water inflow, and their possible crowding out effect to smaller scale individual farms. Already in 2015, individual farms and agricultural enterprises despite the national trend of prevailing households dominate pastoral farming in the Ili Delta. The closing of small and medium individual farms as important meat suppliers at local markets may endanger food security, also across the borders of the Ili Delta. Further research is needed to capture the threat to livestock farming and thus to local and regional food security. Economic assessment should be extended to seasonal flood events as well as flooding periods. Hay purchase could also be used as an adaptation strategy in flood years when reed beds are flooded and not accessible for grazing and haymaking. For a total impact assessment of water inflow changes to pastoral farming, investigations should also focus agricultural enterprises and households as remaining farm types of the Ili Delta.

Supplementary Materials

The following are available online at https://0-www-mdpi-com.brum.beds.ac.uk/2077-0472/10/7/281/s1, Figure S1: Monte Carlo simulation for small-scale individual farm in decreasing water inflow scenario, Figure S2: Monte Carlo simulation for medium-scale individual farm in decreasing water inflow scenario, Figure S3: Monte Carlo simulation for large-scale individual farm in decreasing water inflow scenario, Figure S4: Monte Carlo simulation for large-scale individual farm in worst case scenario excluding government program payments, Table S1: Overview of interviews, Table S2: Allocation of interviewed farms to the three types of individual farms by village districts, Table S3: Breeding and rearing performance (averages) of the three types of individual farms, Table S4: Contribution margin analysis and net farm incomes from operations small-scale individual farm, Table S5: Contribution margin analysis and net farm incomes from operations medium-scale individual farm, Table S6: Contribution margin analysis and net farm incomes from operations large-scale individual farm.

Author Contributions

Conceptualization, E.B., N.T., and V.B.; Data curation, E.B.; Formal analysis, E.B.; Investigation, E.B., A.K., A.B., and M.I.; Methodology, E.B., N.T., and V.B.; Project administration, E.B. and A.K.; Software, E.B.; Supervision, N.T. and V.B.; Validation, N.T., S.N., and V.B.; Visualization, E.B., N.T. and R.S.; Writing—original draft, E.B.; Writing—review & editing, N.T. and V.B. All authors have read and agreed to the published version of the manuscript.

Funding

Research was conducted as part of the Eco-Ili (01DK14023) and IliLive project (01DK17056), funded by the German Ministry of Education and Research (Bundesministerium für Bildung und Forschung).

Acknowledgments

The authors express their appreciation to the local administration in Bakanas for providing statistical data and to local farmers, experts, and stakeholders for their willingness to participate in interviews.

Conflicts of Interest

The authors declare no conflicts of interest.

References

  1. Mirzabaev, A.; Ahmed, M.; Werner, J.; Pender, J.; Louhaichi, M. Rangelands of Central Asia: Challenges and opportunities. J. Arid Land 2016, 8, 93–108. [Google Scholar] [CrossRef] [Green Version]
  2. Han, Q.; Luo, G.; Li, C.; Shakir, A.; Wu, M.; Saidov, A. Simulated grazing effects on carbon emission in Central Asia. Agric. For. Meteorol. 2016, 216, 203–214. [Google Scholar] [CrossRef]
  3. Gintzburger, G.; Toderich, K.N.; Mardonov, B.K.; Mahmudov, M.M. Rangelands of the Arid and Semi-arid Zones in Uzbekistan; CIRAD, ICARDA: Montpellier, France; Aleppo, Syria, 2003. [Google Scholar]
  4. Karthe, D. Environmental Changes in Central and East Asian Drylands and their Effects on Major River-Lake Systems. Quat. Int. 2018, 475, 91–100. [Google Scholar] [CrossRef]
  5. Thevs, N.; Beckmann, V.; Akimalieva, A.; Köbbing, J.F.; Nurtazin, S.; Hirschelmann, S.; Piechottka, T.; Salmurzauli, R.; Baibagysov, A. Assessment of ecosystem services of the wetlands in the Ili River Delta, Kazakhstan. Environ. Earth Sci. 2017, 76, 313. [Google Scholar] [CrossRef]
  6. Ministry of National Economy of the Republic of Kazakhstan Committee on Statistics. Kazakhstan in Figures; Brochure; Ministry of National Economy of the Republic of Kazakhstan Committee on Statistics: Astana, Kazakhstan, 2017; p. 140.
  7. Ministry of National Economy of the Republic of Kazakhstan Committee on Statistics. Statistical Indicators 4/2019; Statistical Bulletin; Ministry of National Economy of the Republic of Kazakhstan Committee on Statistics: Nur-Sultan, Kazakhstan, 2019; p. 83.
  8. The World Bank. Population Density (People per sq. km of Land Area)—Kazakhstan. Available online: https://data.worldbank.org/indicator/EN.POP.DNST?locations=KZ (accessed on 4 May 2019).
  9. Ministry of National Economy of the Republic of Kazakhstan Committee on Statistics. Kazakhstan Today; Statistical Handbook; Ministry of National Economy of the Republic of Kazakhstan Committee on Statistics: Astana, Kazakhstan, 2017; p. 46.
  10. Food and Agriculture Organization of the United Nations (FAO). Kazakhstan. Available online: http://www.fao.org/countryprofiles/index/en/?iso3=kaz (accessed on 6 April 2019).
  11. Ministry of National Economy of the Republic of Kazakhstan Committee on Statistics. Statistical Indicators 1/2020; Statistical Bulletin; Ministry of National Economy of the Republic of Kazakhstan Committee on Statistics: Nur-Sultan, Kazakhstan, 2020; p. 54.
  12. Hankerson, B.R.; Schierhorn, F.; Prishchepov, A.V.; Dong, C.; Eisfelder, C.; Müller, D. Modeling the spatial distribution of grazing intensity in Kazakhstan. PLoS ONE 2019, 14, e0210051. [Google Scholar] [CrossRef] [PubMed]
  13. Mussayeva, M.; Rudert, D. Kazakhstan Country Profile. In Agricultural Sector 2015–2016; Report; German-Kazakh Agricultural Policy Dialogue: Bonn, Germany, 2016; p. 78. [Google Scholar]
  14. Toleubayev, K.; Jansen, K.; Van Huis, A. Knowledge and agrarian de-collectivisation in Kazakhstan. J. Peasant Stud. 2010, 37, 353–377. [Google Scholar] [CrossRef]
  15. Mussayeva, M. Landwirtschaft Kasachstans in Zahlen; Report; German-Kazakh Agricultural Policy Dialogue: Nur-Sultan, Kazakhstan, 2019; p. 48. [Google Scholar]
  16. Dostaj, Ž.D. Wasserressourcen und deren Nutzung im Ili-Balchaš Becken; Discussion Paper No. 34; Justus Liebig University Giessen: Giessen, Germany, 2006; p. 90. [Google Scholar]
  17. Kreuzberg, E. Ecosystem Approach in Basin Management in Central Asia: From Theory to Practice. (on the Example of Ili-Balkhash Basin); Regional Environmental Centre for Central Asia (CAREC): Almaty, Kazakhstan, 2005; p. 7. Available online: http://www.cawater-info.net/bk/water_law/pdf/kreuzberg_ili-balkhash_en.pdf (accessed on 16 December 2019).
  18. Ministry of National Economy of the Republic of Kazakhstan Committee on Statistics. Large Horned Livestock. Available online: https://stat.gov.kz/official/industry/14/statistic/7 (accessed on 7 April 2020).
  19. Ministry of National Economy of the Republic of Kazakhstan Committee on Statistics. Agricultural Gross Output (Service) Production 1990–2018 for Region. Available online: https://stat.gov.kz/official/industry/14/statistic/7 (accessed on 7 April 2020).
  20. Thevs, N.; Nurtazin, S.; Beckmann, V.; Salmyrzauli, R.; Khalil, A. Water Consumption of Agriculture and Natural Ecosystems along the Ili River in China and Kazakhstan. Water 2017, 9, 207. [Google Scholar] [CrossRef] [Green Version]
  21. Nurtazin, S.; Thevs, N.; Iklasov, M.; Graham, N.; Salmurzauli, R.; Pueppke, S.; Wang, Y. Challenges to the sustainable use of water resources in the Ili River basin of Central Asia. E3s Web Conf. 2019, 81, 1009. [Google Scholar] [CrossRef]
  22. Starodubtsev, V.M.; Truskavetskiy, S.R. Desertification Processes in the Ili River Delta under Anthropogenic Pressure. Water Resour. 2011, 38, 253–256. [Google Scholar] [CrossRef]
  23. Imentai, A.; Thevs, N.; Schmidt, S.; Nurtazin, S.; Salmurzauli, R. Vegetation, fauna, and biodiversity of the Ile Delta and southern Lake Balkhash—A review. J. Great Lakes Res. 2015, 41, 688–696. [Google Scholar] [CrossRef]
  24. Pueppke, S.; Nurtazin, S.; Graham, N.; Qi, J. Central Asia’s Ili River Ecosystem as a Wicked Problem: Unraveling Complex Interrelationships at the Interface of Water, Energy, and Food. Water 2018, 10, 541. [Google Scholar] [CrossRef] [Green Version]
  25. Morand, P.; Sinaba, F.; Niang-Fall, A. Fishermen, Herders and Rice-Farmers of the Inner Niger Delta Facing the Huge Challenge of Adapting to Weakened Floods: A Social- Ecological System at Risk. In A History of Water; Series III; Vol. 3 Water and Food; Tvedt, T., Oestigaardpp, T., Eds.; Bloomsbury: London, UK, 2016; pp. 418–436. [Google Scholar]
  26. Usman, H.M.; Ikusemoran, M.; Elizabeth, E.; Joel, M.B. Implications of Landuse and Landcover Changes on the Socio-Economic Activities in the Nigerian Portion of the Lake Chad. Eur. J. Econ. Financ. Res. 2016, 1, 84–95. [Google Scholar]
  27. Marie, J.; Morand, P.; N’Djim, H. Avenir du Fleuve Niger The Niger River’s Future; IRD Éditions: Marseille, France, 2007. [Google Scholar]
  28. Robinson, S. Pastoralism and Land Degradation in Kazakhstan. Ph.D. Thesis, University of Warwick, Warwich, UK, May 2000. [Google Scholar]
  29. Kerven, C.; Shanbaev, K.; Alimaev, I.; Smailov, A.; Smailov, K. Livestock Mobility and Degradation in Kazakhstan’s Semi-arid Rangelands: Scale of Livestock Mobility in Kazakhstan. In The Socio-Economic Causes and Consequences of Desertification in Central Asia; Behnke, R., Ed.; Springer Science + Business Media B.V.: Berlin/Heidelberg, Germany, 2008; pp. 113–140. [Google Scholar]
  30. Robinson, S.; Kerven, C.; Behnke, R.; Kushenov, K.; Milner-Gulland, E.J. The changing role of bio-physical and socio-economic drivers in determining livestock distributions: A historical perspective from Kazakhstan. Agric. Syst. 2016, 143, 169–182. [Google Scholar] [CrossRef]
  31. Kerven, C.; Robinson, S.; Behnke, R.; Kushenov, K.; Milner-Gulland, E.J. Horseflies, wolves and wells: Biophysical and socio-economic factors influencing livestock distribution in Kazakhstan’s rangelands. Land Use Policy 2016, 52, 392–409. [Google Scholar] [CrossRef]
  32. Robinson, S.; Kerven, C.; Behnke, R.; Kushenov, K.; Milner-Gulland, E.J. Pastoralists as Optimal Foragers? Reoccupation and Site Selection in the Deserts of Post-Soviet Kazakhstan. Hum. Ecol. Interdiscip. J. 2017, 45, 5–21. [Google Scholar] [CrossRef] [Green Version]
  33. Kerven, C.; Steimann, B.; Ashley, L.; Dear, C.; Rahim, I. Pastoralism and Farming in Central Asia’s Mountains: A Research Review; MSRC Background Paper No. 1; University of Central Asia: Bishkek, Kyrgyzstan, 2011. [Google Scholar]
  34. Hauck, M.; Artykbaeva, G.T.; Zozulya, T.N.; Dulamsuren, C. Pastoral livestock husbandry and rural livelihoods in the forest-steppe of east Kazakhstan. J. Arid Environ. 2016, 133, 102–111. [Google Scholar] [CrossRef]
  35. Baranowski, E. Ökonomische Evaluierung der Weidewirtschaft im Ili-Delta, Kasachstan, unter veränderten Wasserzuflüssen. Master’s Thesis, University of Greifswald, Greifswald, Germany, April 2016. [Google Scholar]
  36. Kay, R.D.; Edwards, W.M.; Duffy, P.A. Farm Management, 7th ed.; McGraw-Hill: New York, NY, USA, 2012. [Google Scholar]
  37. County Government Bakanas (Almaty region, Kazakhstan); Statistical Data on Animal Husbandry of Households and Farms in the Balkhash Region for 2012–2015. Personal communication, 24 July 2015.
  38. United Nations, Department of Economic and Social Affairs, Population Division. The World’s Cities in 2018—Data Booklet. 2018. Available online: https://www.un.org/en/events/citiesday/assets/pdf/the_worlds_cities_in_2018_data_booklet.pdf (accessed on 7 May 2019).
  39. Luo, G.; Amuti, T.; Zhu, L.; Mambetov, B.T.; Maisupova, B.; Zhang, C. Dynamics of landscape patterns in an inland river delta of Central Asia based on a cellular automata-Markov model. Reg. Env. Chang. 2015, 15, 277–289. [Google Scholar] [CrossRef]
  40. County Government Bakanas (Almaty region, Kazakhstan); Development of the Population and the Livestock Sector 2017–2019 in the Balkhash Region. Personal communication, 30 July 2019.
  41. Hirschelmann, S. The Use of Reed in the Ili-Delta, Kazakhstan—A Socio-Ecological Investigation in the Village Region of Kuigan. Diploma Thesis, University of Greifswald, Greifswald, Germany, 2014. [Google Scholar]
  42. Strategy Kazakhstan-2050. Available online: https://strategy2050.kz/en/page/multilanguage/ (accessed on 19 February 2020).
  43. Petrick, M.; Pomfret, R. Agricultural policies in Kazakhstan. Discussion Paper No. 155, Leibniz Institute of Agricultural Development in Transition Economies, Halle (Saale). 2016. Available online: http://hdl.handle.net/10419/130714 (accessed on 17 January 2020).
  44. Nurgazy, K. Current State of Beef Cattle Breeding in Southern Pribalkhash Region; LLP Print Plus: Almaty, Kazakhstan, 2018. [Google Scholar]
  45. Cretaux, J.-F.; Jelinski, W.; Clamant, S. SOLS: A lake database to monitor in the Near Real Time water level and storage variations from remote sensing data. Adv. Space Res. 2011, 47, 1497–1507. [Google Scholar] [CrossRef]
  46. Yang, T.; Li, Q.; Ahmad, S.; Zhou, H.; Li, L. Changes in Snow Phenology from 1979 to 2016 over the Tianshan Mountains, Central Asia. Remote Sens. 2019, 11, 499. [Google Scholar] [CrossRef] [Green Version]
  47. Weatherbase. Bakanas, Kazakhstan, State 2019. Available online: www.weatherbase.com (accessed on 19 November 2019).
  48. Haeberlein, L.; Kaiser, V. Vegetation Types of the Ili-Delta, Kazakhstan. Bachelor Thesis, University of Greifswald, Greifswald, Germany, 2014. [Google Scholar]
  49. Ogar, N.P. Vegetation Dynamics on the Syrdarya Delta and Modern Land Use. In Sustainable Land Use in Deserts; Breckle, S.-W., Veste, M., Wucherer, W., Eds.; Springer-Verlag: Heidelberg/Berlin, Germany, 2001; pp. 74–83. [Google Scholar]
  50. Biernacki, P.; Waldorf, D. Snowball Sampling: Problems and Techniques of Chain Referral Sampling. Sociol. Methods Res. 1981, 10, 141–163. [Google Scholar] [CrossRef]
  51. Heckathorn, D.D. Respondent-Driven Sampling: A New Approach to the Study of Hidden Populations. Soc. Probl. 1997, 44, 174–199. [Google Scholar] [CrossRef]
  52. Goodman, L.A. Comment: On Respondent-Driven Sampling and Snowball Sampling in Hard-To-Reach Populations and Snowball Sampling not in Hard-To-Reach Populations. Sociol. Methodol. 2011, 41, 347–353. [Google Scholar] [CrossRef]
  53. Atkinson, R.; Flint, J. Accessing Hidden and Hard-to-Reach Populations: Snowball Research Strategies; Social Research Update, University of Surrey: Guildford, UK, 2001. [Google Scholar]
  54. Meyer, D.Z.; Avery, L.M. Excel as a Qualitative Data Analysis Tool. Field Methods 2008, 21, 91–112. [Google Scholar] [CrossRef] [Green Version]
  55. Van Der Ploeg, J.D. Revitalizing Agriculture: Farming Economically as Starting Ground for Rural Development. Sociol. Rural. 2000, 40, 497–511. [Google Scholar] [CrossRef]
  56. Kristensen, I.T.; Kristensen, I.S. Farm types as an alternative to detailed models in evaluation of agricultural practise in a certain area. In Management Information Systems; Brebbia, C.A., Ed.; WIT Press: Wessex, UK, 2004; pp. 241–250. [Google Scholar]
  57. Cattlle feedlot Otes Bio Asia (Akdala, Almaty region, Kazakhstan). Personal communication, 2 August 2015.
  58. Bhimani, A.; Horngren, C.T.; Datar, S.M.; Rajan, M.V. Management and Cost Accounting, 6th ed.; Prentice-Hall Inc.: Upper Saddle River, NJ, USA, 2015. [Google Scholar]
  59. European Commission. Exchange Rate. Available online: http://ec.europa.eu/budget/graphs/inforeuro.html (accessed on 1 November 2018).
  60. National Bank of Kazakhstan. Financial Stability Report of Kazakhstan 2015–2017. Available online: https://nationalbank.kz/cont/Financial%20Stability%20Report%20of%20Kazakhstan%202015-2017.pdf (accessed on 11 January 2020).
  61. Behnke, R.H. Measuring the Benefits of Subsistence Versus Commercial Livestock Production in Africa. Agric. Syst. 1985, 16, 109–135. [Google Scholar] [CrossRef]
  62. Horngren, C.; Harrison, W. Accounting: BSB110, 3rd ed.; Pearson Australia: Frenchs Forest, Sydney, Australia, 2015. [Google Scholar]
  63. Peng, H.; Thevs, N.; Beckmann, V.; Abdusalih, N. Economic Performance of Cotton and Fruit Plantations in arid Regions: Observation from the Tarim River Basin, NW China. AJAEES 2016, 8, 1–15. [Google Scholar] [CrossRef]
  64. Chayanov, A.V. On the theory of non-capitalist economic systems. In The Theory of Peasant Economy; Thorner, D., Kerblay, B., Smith, R.E.F., Eds.; Richard D. Irwin: Homewood, IL, USA, 1966; pp. 1–28. [Google Scholar]
  65. Edwards, W. Estimating Farm Machinery Costs. Available online: https://www.extension.iastate.edu/agdm/crops/pdf/a3-29.pdf (accessed on 26 May 2020).
  66. Wichmann, S. Commercial viability of paludiculture: A comparison of harvesting reeds for biogas production, direct combustion, and thatching. Ecol. Eng. 2017, 103, 497–505. [Google Scholar] [CrossRef]
  67. Hardaker, J.B.; Huirne, R.; Anderson, J.R.; Lien, G. Stochastic simulations. In Coping with Risk in Agriculture, 2nd ed.; Hardaker, J.B., Huirne, R.B.M., Anderson, J.R., Lien, G., Eds.; CABI Pub.: Wallingford, Oxfordshire, UK, 2004; pp. 157–181. [Google Scholar]
  68. StatBureau. Kazakhstan Inflation Calculators. Available online: https://www.statbureau.org/en/kazakhstan/inflation-calculators?dateBack=2014-8-1&dateTo=2015-8-1&amount=25 (accessed on 1 March 2019).
  69. Orolbaeva, A. The Effects of National Programs and Strategies on Cattle Husbandry in Ili Delta. An Institutional Analysis. Master’s Thesis, University of Greifswald, Greifswald, Germany, 2020. [Google Scholar]
  70. Chestin, I.E.; Paltsyn, M.Y.; Pereladova, O.B.; Iegorova, L.V.; Gibbs, J.P. Tiger re-establishment potential to former Caspian tiger (Panthera tigris virgata) range in Central Asia. Biol. Conserv. 2017, 205, 42–51. [Google Scholar] [CrossRef]
  71. Chibnik, M. The Value of Subsistence Production. J. Anthropol. Res. 1978, 34, 561–576. [Google Scholar] [CrossRef]
  72. Allen, D.W.; Lueck, D. The Nature of the Farm. J. Law Econ. 1998, XLI, 343–386. [Google Scholar] [CrossRef]
Figure 1. Water levels expressed in m above sea level (m a.s.l.) of Lake Balkhash (black) and Kapchagay Reservoir (gray), 1992–2019 (own presentation based on data by the authors of [45]).
Agriculture 10 00281 g001
Figure 2. Overview of Ili Delta. Locations of 16 individual farms based on 2015 interview campaign (red pins, N = 16), other individual farms and agricultural enterprises (dark red dots, N = 310), and villages (red areas, N = 9). Land cover classes for 2014 based on the work in [5].
Agriculture 10 00281 g002
Figure 3. Contribution margin ratios for three types of individual farms in the Ili Delta under the three calculation scenarios: normal situation (light gray), decreasing water inflow (gray), and worst case (black).
Agriculture 10 00281 g003
Figure 4. Relative frequencies (histograms) and cumulative probabilities (curves) of contribution margin for worst case scenario based on Monte Carlo simulation with 10,000 iterations: (a) small-scale, (b) medium-scale, and (c) large-scale type of individual farms. Vertical dashed lines indicate 90% of relative frequencies. Points (●) on cumulative probability curves indicate contribution margin of zero and a 74% (a) and 3% (b) risk that revenues cannot cover variable costs. Rhombuses (⧫) mark total fixed costs.
Agriculture 10 00281 g004
Table 1. Characteristics of three types of individual farms in the Ili Delta [35].
AttributeSmall-Scale
(n = 16)
Medium-Scale
(n = 14)
Large-Scale
(n = 5)
Livestock
Number of cattle
Mixed herd
10–30
Mixed herd
>30 and <80
Cattle specialization
≥80
Government program
(elite bull program)
Excluded from participationNo participationParticipation
Sales marketLocal (village)Mainly national (cities)Only national (cities)
Level of mechanizationLowMedium (overage)High (modern)
EmployeesNone (family-managed)One (shepherd)At least two (cowboys)
Table 2. Calculation procedure for contribution margin and net farm income from operations in short run (adapted from the work in [36,58]).
ItemCalculation
Revenues
1Cash revenueTraded units (beef/livestock) × sales price
2Value of own consumptionFarm-consumed units (beef/livestock) × sales price
3Inventory changesIncrease/loss of livestock × sales price
4Government program payments
(elite bull program)
Large-scale farm, premium payment for traded elite beef + annual support for cow + annual elite bull sale
Total revenue (TR)Sum of 1–4
Variable costs independent of water inflow
5Veterinary costsEar tags × purchase price
6Transport costsDiesel consumption for stock control/trading × diesel price
7Kombi corn 1Supplementary feed large-scale farm, annual amount × purchase price
8Cost for elite bullsLarge-scale farm, number of elite bulls × annual purchase price
Variable costs depending on water inflow
9Feed costs (hay for winter period)Annual hay demand per stock × on-farm production costs 2 or purchase price
Total variable costs (TVC)Sum of 5–9
Contribution margin (CM)TR-TVC
Fixed costs
10Employed laborNumber of employees × average monthly salary × 12 months
11Leased landTotal land × average leasing price
12Buildings 3Annual depreciation using straight-line method
13Vehicles and machinery 3Annual depreciation using straight-line method + annual taxes for vehicle and tractor
Total fixed costs (TFC)Sum of 10–13
Net farm income from operations (NFIO)CM-TFC
1 Corn mix of maize, wheat, barley, and other components [35,41]. 2 Including diesel consumption for harvesting and transportation, excluding labor and machinery costs. 3 Without consideration of repairs and maintenance costs.
Table 3. Main calculation parameters (averages) for contribution margin analysis for three types of individual farms in the Ili Delta for base year 2015.
ItemUnitSmall-ScaleMedium-ScaleLarge-Scale
Livestock
Cattle (cow)Head21 (15)57 (47)140 (120)
Goat (nanny goat)38 (24)67 (57)
Sheep (ewe)36 (17)57 (47)
Workhorse22
Breed1
CalvesHead71468
1332
Kids528
Lambs
Sales
Meat weight cowkg per head159165240 2
Meat weight bull (quantity)kg per head81 (4) 3159 (7) 4170 (16) 4
BeefUSD kg−15.1 54.4 64.4 6
Goat (quantity)USD per head92.4 5 (8)92.4 5 (17)
Sheep (quantity)USD per head158.4 5 (2)158.4 5 (20)
Subsistence
Beefkg year−1159 (cow)495 (3 cows)
GoatHead year−1515
SheepHead year−138
Inventory change
CowHead (USD per head)+2 (502)+4 (502)+34 (502)
Bull (meat weight 130 kg)Head (USD kg−1)+16 (4.4)
Elite bull program
Premium cowUSD year−1 per cow95
Premium elite beefUSD kg−11.6
Annual price for elite bullUSD year−1 per bull924 7
Winter fodder hay
Feeding periodday120148135
Cattlekg day−1 per head101020
Goatkg day−1 per head23
Sheepkg day−1 per head23
Workhorse
On-farm production 8
kg day−1 per head
USD kg−1

0.02
9
0.03
18
0.04
1 Based on farm-specific calving and rearing rates, balanced gender ratio. 2 Average meat weight of Kazakh white-headed cow [44]. 3 One-year-old bull. 4 Two-year-old bull. 5 Average sales price as mean of all farms at local Ili Delta market. 6 Average sales price as mean of all farms at regional Almaty City market. 7 Based on purchase price of USD 1848 for Kazakh white-headed elite bull in 2015 for two years [57]. 8 Diesel consumption for harvesting and transportation, excluding labor and machinery cost.
Table 4. Calculation parameters (averages) for fixed costs of three types of individual farms in the Ili Delta for base year 2015.
ItemUnitSmall-ScaleMedium-ScaleLarge-Scale
Employed Labor
Employee(s) -1 (shepherd)2 (cowboys)
SalaryUSD per person and month 174317
Leased land
Total areaHa334443917
Stable including feed storage
Material costsUSD71317162244
House for employee(s)
Material costsUSD-21122112
Pasture fence
Material costsUSD--1056
Used vehicle for stock control or beef trading
Purchase priceUSD2425242510,000 2
Purchase price machinery
Tractor (amount, status)USD-4900 (1, used)4900 (1, used)
26,766 (1, new) 1
Used trailer (amount)USD-1000 (1)1000 (2)
Mower (amount, status)USD-1000 (1, used)3300 (1, new) 1
New swather (amount)USD--3300 (1) 1
New hay baler (amount)USD--14,850 (1) 1
Taxes for vehicle and tractor 3
VehicleUSD year−13434106 2
TractorUSD year−1404040
1 Purchase price plus 10% of purchase price for delivery fees and transport costs for new machinery. 2 Kamaz truck. 3 Overall average independent of farm scale.
Table 5. Assumptions and calculation parameters for three calculation scenarios (adapted from work in [35]).
Normal Situation
Agriculture 10 00281 i001
Decreasing Water Inflow
Agriculture 10 00281 i002
Worst Case
Agriculture 10 00281 i003
Vegetation in pasturesNon-submerged dense reed bedsSparse reed bedsOpen reed and shrub vegetation
Groundwater level>1.5 m 11.5–2.5 m 2<2.5 m 1
Annual hay demandOn-farm reed hay50% on-farm reed hay
50% purchase alfalfa hay
50% purchase reed hay
50% purchase alfalfa hay
Price (USD kg−1) 30.02 for small-scale farm
0.03 for medium-scale farm
0.04 for large-scale farm
On-farm reed hay equal to normal situation
0.1 purchase alfalfa hay
0.08 reed hay
0.14 alfalfa hay
1 [5,23] 2 [49] 3 Local prices converted using the exchange rate of August 2015: 1 KZT = 0.00528 USD [59].
Table 6. Purchase prices for Monte Carlo simulation, ranges, and mean (in brackets) for triangular probability distribution. Conservative estimations based on conducted farm interviews for base year 2015 [35].
HayUnitDecreasing Water InflowWorst Case
Alfalfa 1USD kg−10.09–0.13 (0.1)0.1–0.18 (0.14)
Reed 1USD kg−1On-farm production0.07–0.12 (0.08)
1 Local prices converted using the exchange rate of August 2015: 1 KZT = 0.00528 USD [59].
Table 7. Short-and medium-term adaption strategies implementation in 2015 by three types of individual farms in response to reduced water inflow to the Ili Delta.
Adaption Strategy
Small-Scale
(n = 16)
Medium-Scale
(n = 14)
Large-Scale
(n = 5)
Alternative haymaking areas552
Partly purchasing alfalfa hay231
Entire hay purchase422
Installation groundwater well2-1
Table 8. Contribution margins of three types of individual farms in the Ili Delta for the three calculation scenarios (base year 2015).
ItemSmall-Scale
(USD year−1 Per Stock)
Medium-Scale
(USD year−1 Per Stock)
Large-Scale
(USD year−1 Per Stock)
Revenues
Cash revenue2708963622,264
Value of own consumption17485178
Inventory changes1004200826,220
Government program payments23,096
Total revenue (TR)546016,82271,580
Variable Costs Independent of Water Inflow
Veterinary2670109
Transport for control/trading78098450
Kombi corn3386
Annual purchase of elite bulls3696
Variable Costs Depending on Water Inflow
Feed costs (hay for winter period)
Normal situation890371215,314
Decreasing water inflow2578804226,800
Worst case472613,61042,115
Total variable costs (TVC)
Normal situation1665388022,955
Decreasing water inflow3383821134,441
Worst case553113,77849,755
Contribution margin (CM)
Normal situation379512,94148,625
Decreasing water inflow2077861137,139
Worst case−71304321,825
Table 9. Net farm income estimates of the three types of individual farms in the Ili Delta for the three calculation scenarios (base year 2015).
ItemSmall-Scale
(USD year−1)
Medium-Scale
(USD year−1)
Large-Scale
(USD year−1)
Fixed costs
Employed labor-20887608
Leased land97129266
Stable and employees’ house1578300
Vehicles and machines43816285682
Total fixed costs (TFC)550392313,856
Net farm income from operations (NFIO)
Normal situation3245901834,769
Decreasing water inflow1527468823,283
Worst case−621−8807969
Table 10. Results of Monte Carlo simulation for contribution margin and net farm incomes from operations of three types of individual farms in the Ili Delta in worst case scenario.
ItemUnitSmall-ScaleMedium-ScaleLarge-Scale
Total revenues 1USD year−1 per stock546016,82271,580
Range of TVC
Mode
USD year−1 per stock4584 to 7141
5649
11,069 to 18,282
14,264
41,512 to 63,650
51,677
Contribution margin
Range (100%)USD year−1 per stock−1681 to 876−1460 to 57537930 to 30,068
Range (90%) 2USD year−1 per stock−987 to 403410 to 439313,519 to 26,067
ModeUSD year−1 per stock−412262319,903
MedianUSD year−1 per stock−279243819,942
MeanUSD year−1 per stock−286242519,910
Standard deviationUSD year−1 per stock42012123771
Risk of negative CM%74.42.60
Total fixed costs 1USD year−1550392313,856
NFIO
RangeUSD year−1−2231 to 326−5383 to 1830−5926 to 16,212
MeanUSD year−1−836−14986054
Risk of negative NFIO%98.388.85.8
1 Constant parameter for Monte Carlo simulation. 2 Excluding extreme percentiles, 5% (lower bound) and 95% (upper bound).

