Assessment of Olive Tree Canopy Characteristics and Yield Forecast Model Using High Resolution UAV Imagery


Laboratory of Soil Science and Agricultural Chemistry, Agricultural University of Athens, 75 Iera Odos, 11855 Athens, Greece
*
Author to whom correspondence should be addressed.
Agriculture 2020, 10(9), 385; https://0-doi-org.brum.beds.ac.uk/10.3390/agriculture10090385
Submission received: 16 July 2020
/
Revised: 27 August 2020
/
Accepted: 28 August 2020
/
Published: 2 September 2020
(This article belongs to the Section Digital Agriculture)
Abstract
:Greek agriculture is mainly based on olive tree cultivation. Farmers have always been concerned about annual olive orchard production. The necessity for the improvement of farming practices initiated the development of new technological tools that are useful in agriculture. The main goal of this study is the utilization of new technologies in order to define the geometry of olive tree configuration, while the development of a forecasting model of annual production in a non-linear olive grove, planted on a hilly uneven terrain is the secondary goal. The field’s orthomosaic, its Digital Terrain Model (DTM) and Digital Surface Model (DSM) were created by employing high resolution multispectral imagery. The Normalized Difference Vegetation Index (NDVI) thematic map has also been developed. The trees’ crowns were isolated employing the field’s orthomosaic, rendering individual polygons for each tree through Object Based Image Analysis (OBIA). The measurements were conducted in a Geographic Information System (GIS) environment and were also verified by ground ones. Tree crown height, surface, and volume were calculated, and thematic maps for each variable were created, allowing for the observation of the spatial distribution for each parameter. The compiled data were statistically analyzed revealing important correlations among different variables. These were employed to produce a model, which would enable production forecasting in kilograms per tree. The spatial distribution of the variables gave noteworthy results due to the similar pattern they followed. Future crop yield optimization, even at a tree level, can be based on the results of the present study. Its conclusions may lead to the development and implementation of precision olive tree cultivation practices.
1. Introduction
The olive tree (Olea europaea L.) is an evergreen tree belonging to the Oleaceae family. It is native to the Mediterranean region, Asia, and Africa and has been cultivated since the ancient times [1]. Greece is the third largest producer of olive oil after Spain and Italy and olive groves cover 15% of the domestic cultivated area. Olive cultivation is well adapted to the Greek climate and environment, since the particular species grows mostly on inclined, shallow, low fertility soils and on hand-made stone terraces with limited watering requirements [2]. This is the reason why its cultivation in the country has dated back to 3500 years ago [3]. Additionally, traditional olive orchards on sloping land are common (up to 70 trees/ha) in Greece due to its mountainous landscape morphology, instead of intensive (250–700 trees/ha) and super-high-density orchards (over 1500 trees/ha). The importance of olive crops and their contribution to Greek economy is understandable.
The use of geospatial technologies like Geographic Information System (GIS) and remote sensing can help olive cultivation on many levels. These technologies can provide fundamental support to important cultivation needs, such as plant health and protection, water requirements, and production forecasting.
Aerial and satellite remote sensing have been used in previous works for monitoring orchard trees’ crown detection and extracting tree canopy characteristics [4,5,6]. Many attempts have been made in applying geospatial means for the management of the olive orchards, such as early detection of Verticilium wilt [7,8], control of fruit fly sprays [9], and water stress of olive trees [10,11]. LiDARs were also used for olive tree mapping and canopy characteristics extraction [12,13]. The determination of olive tree height and crown diameter by unmanned aerial vehicle (UAV) platforms is also a major research field. Panagiotidis et al. [14] have tried to assess these tree characteristics from UAV imagery in two study areas. Data validation was performed against ground measurements and the results showed that the developed model can be satisfactorily applied to trees with homogeneous geometric features and that measurements are influenced by the study site. Thus, it has been confirmed that this particular approach is an efficient, quick, and effective alternative. Zarco-Tejada et al., Díaz-Varela et al., and Miranda-Fuentes et al. [15,16,17] have also conducted research studies to identify olive tree geometric characteristics using low-cost sensors and airborne platforms. In all cases, the data was verified by ground measurements with reliable results comparable to those derived through more expensive and cumbersome means.
UAV movement planning for optimum flight parameters assessment is also mentioned in previous works. UAVs’ flight parameters are a major factor for generating accurate multispectral orthomosaics [18]. UAV flights utilizing the best flight parameters will significantly support site-specific crop management. UAV flight trials at olive orchards were also conducted by Torres-Sanchez et al. [19] in order to achieve high accuracy at digital surface models.
Yield forecasting of olive trees is another area addressed by researchers. The use of remote sensing has contributed significantly to this area. Remote sensing technologies based on Normalized Difference Vegetation Index (NDVI) combining soil and plant factors were employed on two olive orchards in order to investigate the fruit set [20]. Masilli et al. [21] developed a methodology incorporating meteorological data and remote sensing data for the assessment of Tuscany olive groves’ production. The NDVI was calculated for all olive groves, which combined with the meteorological data allowed for the creation of a yield forecast model. The developed methodology was capable of local implementation, but it could also reproduce the variation of production at national level. A tool with the same goal was developed by Sola-Guirado et al. [22]. Ground measurements of olive trees’ canopy were taken in order to calculate the volume and the surface of the crown. They also used aerial images from UAV to develop the yield forecast model, which included the above parameters. The thematic map of yield by the application of the model proved to be a reliable tool for farmers, who can adapt their cultivation techniques to the expected yield and be guided accordingly by agriculturists.
The previously mentioned studies deal only with linear and contemporary cultivation modes, while this study aims to fill in the knowledge gap related to other olive tree cultivation processes. The objective of this study is the estimation of the geometrical characteristics, such as height, area, and canopy volume of olive trees in hilly non-linear olive tree orchards, which is a common way of cultivation in Greece and other Mediterranean countries, by using terrestrial and mainly aerial means. Moreover, the studied field’s characteristics—irregular slopes, variable tree age, and hilly terrain—contribute to the originality of this study. In our objective, the development of a yield forecast model for the olive trees based on the canopy features, the morphological characteristics of the field, and the vegetation index was also included. Such a model will be valuable in the scope of precision agriculture for agronomic services towards prescribing accurate guidelines, and thus be beneficial for both the producers and the environment. Furthermore, the tough process of ground measurements can be significantly minimized because of the reliable and accurate performance of the aerial means.
2. Materials and Methods
2.1. Study Site Description
The studied area is in the province of Lygourio, in Argolis prefecture, Eastern Greece, which has all the characteristics of the typical Mediterranean climate, with hot dry summers and mild wet winters. The average annual temperature of the region is 18.6 °C and the mean annual rainfall is 460.9 mm. The altitude of the area is about 300 m above sea level, due to the mountainous landscape morphology of the province. Soils of the region belong to Calcisols (Soil Map of the World, FAO). They are well-drained, medium-sized to moderately fine granular composition, with a slope of 6–12%, and contain high levels of calcium carbonate. The selected field (1.5 ha) for this study includes 210 productive olive trees and 50 newly planted ones, in non-linear plantation, of the olive variety called ‘Kothreiki’ (Olea europaea var. minor rotunda). The productive trees are over 35 years old. High inclination percentage (about 14%) is observed, because this field extends into a hilly area. Thus, olive trees are arranged on grades, in order to facilitate the cultivation techniques and reduce the risk of erosion and desertification.
2.2. Field Measurements
On-site measurements were made in the field on October 5, 2017. Ninety-three (93) olive trees were randomly selected out of a total of 210 productive trees. The exclusion of the trees on the edge of the olive grove served the representation of all the different soil conditions and their specific topological features in the selected sample. Also, the trees selected are all fully productive with an age of 30–35 years. It should also be noted that some of the 93 trees selected were in an ’on year’ period, while some of them in an ’off year’ period. More specifically, measurements of the geometric characteristics of the olive trees and measurements of the production of each olive tree were made. Regarding the geometric characteristics, the diameter of the crown, the height of each tree, and the distance of the lower point of the crown from the ground were measured. In particular, the diameter of the tree canopy was measured in two directions using a measuring tape. The first measurement was North–South, while the second was vertical to the first, i.e., East–West. In this way the calculation of the diameter of the crown was more accurate since the shape of the crown of the trees was irregular and not oval or circular. At the same time, a measurement of the distance of the lower point of the crown from the ground was made at the same point where the diameter of the crown was measured. Using the measuring tape, the vertical distance of the lowest point of the tree canopy to the ground was measured. Once the two values were obtained, the average was calculated. This measurement was used to calculate the representative olive tree’s crown volume (Ground volume). The height of each tree (Ground height) was measured with the aid of a Topographic Laser (Trimble S3 Total Station). The production of each tree was also measured during the harvest period. The fruit harvested from each olive tree was weighed on November 25, 2017, and the result of production was recorded in kilograms.
2.3. Airborne Campaigns
Images covering the entire olive grove were taken using the quadcopter Matrice 100 UAV (DJI, Shenzhen, Guangdong, China), which is a stable, flexible, fully customizable, adjustable, and powerful platform, with vertical take-off and landing, a payload of 2.4 kg, and with the ability to take autonomous flight for about 40 min. The multi-spectral camera that was mounted separately in the UAV was the lightweight and adaptable Sequoia (Parrot Drone SAS, Paris, France) with a sunshine sensor, one RGB (16 MP resolution), and four monochromatic (1.2 MP resolution) sensors: Green (550 nm), Red (660 nm), Red Edge (735 nm), and Near Infra-Red (790 nm). Sequoia provides absolute reflectance measurements without the need for a radiometric calibration target. It is also the only crop sensor that has its autonomous GPS for precise georeferenced results. The process of shooting was performed in a specified way according to defined parameters depended on terrestrial characteristics. The flight parameters were set in order to succeed high spatial resolution, as mentioned in previous works [19]. We also tested the mentioned parameters to ensure the best results. The UAV flight was done in a flight-based automated manner, designed and executed by the Pix4D Capture software. The field was divided into five different flight zones based on the topography. The flight plans had the following common parameters: designed as polygon grid, with flight altitude at 40 m., side overlap at 85% and forward overlap at 95%, velocity at 1.5–2 m/s, and time-lapse interval at 1.5 s. The total flight time of all five plans was 17 min and a total of 670 images were collected from each of the following spectra: RGB, G, R, R-edge, and NIR. The obtained ground spatial resolution was 1.1 cm/px for the RGB sensor and 3.8 cm/px for the monochromatic sensors.
2.4. Data Analysis
The steps of the data analysis are presented diagrammatically at Figure 1. The obtained images were processed using the Pix4D desktop software. Note that the images contain spatial information as their coordinates are captured by the GPS of the Sequoia sensor. The geographic system in which the images were geo-referenced is the World Geodetic System 1984 (WGS84). The followed processing in this software was: initial processing and the building of point cloud and mesh. In the last step we exported the necessary rasters for our study, such as the RGB orthomosaic, the Digital Terrain Model (DTM), the Digital Surface Model (DSM), and the thematic map of Normalized Difference Vegetation Index (NDVI) as shown in Equation (1).
The accuracy of the exported products was enhanced by appropriately setting the software parameters: a high level of densification of the point cloud and a DSM filter sharp enough to preserve the orientation of the surface and clarify the 3D features. The quality of the DSM and DTM was evaluated, using the variables of ground and aerial measured height, using Equation (2) [19]. Aerial height was not a direct measurement, and was computed by subtracting DTM from DSM and calculating the maximum value in each tree canopy-polygon, because DSM does not directly correspond to tree height value, which is necessary for the area volume calculation.
The geographic system in which these products are geo-referenced is the Hellenic Geodetic Reference System 1987 (GGRS’87). They were also exported as GeoTIFF files for further use in the remote sensing and GIS software.
Olive tree mapping in the studied area was carried out using the Object Based Image Analysis (OBIA), via the eCognition Developer software© (ver. 9.1; Trimble, Sunnyvale, CA, USA). The segmentation of the orthomosaic was done using the multiresolution segmentation algorithm, which was chosen because it is an extensively used method for land cover classification from UAV images and showed sophisticated performance in previous works [23,24,25]. This algorithm was targeted at individual olive tree crown delineation. The orthomosaic from Red and Near Infra-Red bands were implemented in the software and analyzed by the GEOBIA algorithm. These orthomosaics were chosen because of the objects that we aimed to classify. The multiresolution segmentation algorithm was applied twice. Initially, in the first run, the scale parameter was set at 250 and for the homogeneity criterion, the shape was fixed at 0.1, and the compactness was set at 0.5. The setting of the above parameters was determined by the trials and errors procedure and the visual evaluation of its results. The scale parameter was firstly set at 1000, as mentioned in previous works [26], but it was not so effective. The large and homogeneous objects of soil, shadows, and tree crowns were delineated by this initial segmentation. The hierarchical structure of the classification classes was then created. The objects were organized into four classes: “shadows”, “olive tree crown”, “rocks”, and “soil”. Since some soil segments and shadows were wrongly classified in the “Olive tree crown” class, a finer segmentation was necessary. The second run was conducted in order to create smaller and more homogeneous segments, thus shape and compactness were kept the same, while the scale parameter was set at 100. An improved delineation of olive tree crowns was achieved by classifying these finer objects in two classes: “Olive tree crown” and “Other Features”. The determination of the utilized parameters was empirical. The segmentation scale parameters and homogeneity criteria were obtained by testing various segmentation settings and by analyzing the segmentation calculations over different parts of the study area, for a more accurate definition of the olive tree crown boundaries. Also, this process allows for the creation of topological structures, which enable simultaneous classifications at different scales [27]. The product of the above process was a polygonal shapefile, which was further processed. The following Equation (3) was used to estimate the volume of the olive tree canopy, using the field measurements [22]:
where D1 and D2 are the diameters of the tree crown measured in two different directions, Ht is the height of the tree, and Hs is the average distance of the lowest point of the tree crown from the ground, measured in the same positions as the diameter. This process is rather difficult and inaccurate since the shape of the crown is not round or oval and measurements for the calculation of the canopy area are not sufficient. Other volume calculation approaches [28] include more ground measurements (e.g., in six directions of the tree), which amplifies the amount of work.
In order to validate our data, the calculation of the tree canopy volume from aerial measurements was chosen. In addition, this procedure minimizes the amount of measurements and makes them much easier. Equation (3) was transformed in order to achieve the best estimation of the crown volume via the aerial data, as shown in Equation (4):
Aerial Volume = (3.14/6) × [Area] × ([Aerial Height] − 0.5)
Note that the above equation was based on Equation (3) with the following changes. The crown area was used instead of two diameters D1 and D2, and Hs was considered stable at 0.5 m, based on the average value of the terrestrial measurements of that variable, which varied at that level.
The shapefile was inserted into the ArcMap software (version 10.6; ESRI, Redlands, CA, USA) to continue the necessary edits to olive trees’ crown polygons and calculate certain variables from the aerial products, such as the area of each tree canopy, the mean, minimum, and maximum Aerial Height, NDVI, and the slope of the trees. Aerial volume was also computed in GIS environment using Equation (4). The variables for each tree-polygon were calculated with the use of the zonal statistics command. Slope and aspect of the field were also extracted using the DTM of the field. The mean value of each polygon was selected for the NDVI value of each tree canopy.
Descriptive statistics (mean, min, max, range, standard deviation, and CV), correlation (using Pearson correlation coefficient), and multiple linear regression analysis were performed on the data resulting from the above processes, using the SPSS statistical software (version 26; IBM, Armonk, NY, USA).
Regarding the yield forecast model, all variables were tested for the best fit and results. Trees with a production greater than or equal to 21 kg (≥21 kg) were considered for the creation of the model. This restriction was because only the trees that were in a productive year and not those that were in a non-productive year or in a year of parentage had to be included in the model. Since an olive tree is in productive year when its average production is over 20 kg, the above figure was chosen in order to define productive and non-productive trees.
3. Results and Discussion
3.1. Field and Airborne Results
The final product of the OBIA process was a polygonal shapefile, which contained the canopy of each olive tree identified by the algorithm. The set of polygons classified by the software as tree trunks was 210.
DSM and DTM provided important and high quality (about 15% error, as computed with Equation (2)) information concerning the fluctuation of the slope (Figure 2) and the stratification of the terrain in grades, with an apparently stronger slope on the west side. In DSM (Figure 3) the olive tree crowns are also distinct. In the thematic map of the NDVI vegetation index, vegetation is clearly visible, depicted in bright green color. NDVI index values ranged from 0.34 to 0.80. The efficiency of object-based image analysis of the orthomosaic (Figure 4) in delignating tree crowns was great, since 205 of 210 olive trees were automatically classified. Other applied methods based on NDVI cutoff values were less effective. The use of NDVI index for tree crown delineation was not so effective. Although olive trees could be classified, tree crown delineation was not possible because of the multiplex shape of the crown and the mix with other types of vegetation or even the trees’ shadows. Also, the subtraction of the DTM from DSM for extracting tree crown polygons had worse quality results (tree crown delineation was not satisfactory) and lower percentages of classification (83 out of 210 trees were classified). As a result, OBIA was believed to have the best application in our case study.
Using OBIA method, the outline of the crown of the trees was defined automatically and the corresponding polygons were created in a vector file. However, manual intervention was necessary to perfect the polygons, especially for trees that were close to one another with united crowns. As a result, the algorithm recognizes the canopy of two trees as one and creates one polygon instead of two. During image classification, the intense presence of shades dictated the creation of a separate class, in order to avoid their inclusion in the polygons of the trees’ canopy. Therefore, confusion for tree crown delimitation was bypassed and the result was reliable.
Regarding the statistical analysis, descriptive analysis was carried out and correlations were calculated for each variable (eight in total). When comparing ground and aerial measurements, the only significant correlation was noted between aerial and ground trees’ crown volume (r = 0.66, p = 0.01).
It is obvious that some differences occurred between ground and aerial data. Ground measurements provided reliable values of tree height. However, crown projective area values contained a level of error because the conducted measurements could not exactly define the multiplex shape of the olive trees’ crowns. On the other hand, the automated classification of tree crown area via aerial data was of high accuracy. Although we tried to minimize errors by dividing the study area into five different flight plans depending on the topography, the tree height estimation using aerial data provided less liable results, because of the hilly terrain of the olive orchard. Aerial means could have improved performance at flat study areas and by using high quality sensors, which might have higher spatial accuracy.
The yield of each tree varied from 1 to 72 kg (N = 93), meaning that measurements included ’on year’ and ’off year’ olive trees. This variable has also shown significant correlation with field and aerial crown volume (r = 0.665 & r = 0.589 respectively, p = 0.01) in ’on year’ trees (yield > 20 kg). The area of each tree canopy ranged from 2 to 40 m2, showing great correlation with field crown volume (r = 0.745, p = 0.01) and greater with the aerial (r = 0.92, p = 0.01), which is expected because this variable is included in the canopy volume equation. Similar observations were noted regarding the tree height (m) calculated by aerial measurements, because the correlation with aerial crown volume was significant (r = 0.64, p = 0.01) due to the above-mentioned reason. The values for this variable ranged from 2.5 to 5.89 m, while field measurements of tree height ranged from 3.05 to 4.83 m. The range of field crown volume was 11.53 m3 to 126.31 m3 and 5.54 to 155.24 m3 for the aerial. Slope values ranged from 7.91% to 41.7% (near to grades).
Spatial analysis results were also notable because most variables followed the same pattern. In detail, tree canopy area values showed higher values on the southeastern side of the field, as well as in the northwest. The aerial height of the trees showed the highest values mainly in the eastern part of the field. Similar, almost identical observations were made for the field calculated height of the olive trees, as the highest values were present in the southeast and less in the northwest. Values of the aerial crown volume of the trees were higher at the eastern side of the field, especially in the southeast, with some moderate to high values in the northeastern part. Field calculated crown volume values showed similar behavior to those mentioned above. Tree production in kilograms showed maximum values mainly at the eastern side of the field. Moderate yield values were observed in the central and northeastern segments, while minimum ones appeared on the western side. The average values of the NDVI vegetation index per olive tree peaked mainly in the southeastern part of the field. Regarding the slope values observed, the field showed relative uniformity in their distribution. The only exception was the central part of the northeastern side, which displayed slightly higher values. The dominant aspect of the trees was the southeast with 74 (36.1%) trees and the southwest with 93 (45.37%) trees. That is, half the trees have a western exposure and the other half have an eastern one.
To sum up, all the variables studied according to their spatial distribution showed a concentration of the highest values in the eastern part, particularly in the southeast. Also, high values in some cases were observed on the west and mostly in the northwest. In most cases, minimum values appeared in the northeastern and southwestern parts. In general, maximum values were concentrated in the southern part of the olive grove, unlike the northern part where minimum values occurred.
3.2. Yield Forecast Model
One of the main objectives of this study was the development of a model for yield forecasting of olive trees, using the variables calculated and analyzed. This model employed only trees that were in an ’on year’, forty in total. This choice was made, as stated above, based on the field measured yield of each tree, setting a minimum of 20 kg.
Yield was defined as a dependent variable. The mean NDVI value of each tree canopy polygon, the average slope of the tree location, and the aerial volume of the tree crown were set as independent variables. The equation of the multiple linear regression determined by the observations of 40 trees, with R2 = 0.6 (F = 15.76, p < 0.000), is:
Yield = 63.14 − 60.51 × NDVI − 0.58 × Slope + 0.29 × Aerial_Volume
The statistical significance of the coefficients of the independent variables is presented in Table 1. Additionally, the model’s Mean Error (ME) was 0.27 kg/tree and the Root Mean Square Error (RMSE) was 8.21 kg/tree, which show a satisfactory estimation of the olive yield. It should be noted that the development of the model involves the variable of mean value of the slope, which is a key factor in all fields due to the presence of the intense terrestrial formation. According to the currently available literature, this specific factor and the NDVI vegetation index have not been included in the creation and development of similar yield forecast models. The results of the regression analysis showed a negative correlation between slope and yield, because a higher percentage of inclination coincides with lower levels of nutrients due to soil erosion. Aerial volume shows a positive correlation with yield. Olive trees with larger crown volume, which grow under normal conditions, show greater production quantities. Equation (5) also shows that lower NDVI values lead to higher yield. It is obvious that an “on year” olive tree promotes fruit development than new vegetation growing, resulting darker green colors and lower NDVI values. The implementation of the yield forecast model with Equation (5) is presented in the thematic map for all olive trees in the field (Figure 5). It is obvious that forecasted production of olive trees follows the same spatial pattern as most studied variables. Higher values are observed on the northeastern and southwestern parts of the field.
Although the model was formed using the productive trees, it could be applied to the whole olive tree orchard, because the variables used are independent of the productive phase of the tree, only for research purposes (e.g., mapping and spatial analysis) and it does not reflect yield estimations for cultivation management. Obviously, yield value estimation in relation to the history of each tree and on-site observation of each annual fruiting period should be taken into account in order to finally indicate the proper cultivation techniques (e.g., fertilization and irrigation).
It is evident that our model compared to other already developed yield forecast models has a similar satisfactory performance. Sola-Guirado et al. [22] developed a yield forecast tool for rainfed olive trees, with a similar regression adjustment (R2 = 0.62, p ≤ 0.01). Zhang et al. [29] utilized machine learning approaches for almond orchard-level yield prediction, performing R2 with a range of 0.48 to 0.71, depending on the prediction time and the approach of the machine learning algorithm. Random forest models have been expanded for almond yield determination [30] with R2 varying from 0.78 to 0.82, based on the models’ variables (biological, meteorological, etc.). Considering the complex and hilly uneven terrain of the study area, the adjustment of our yield forecast model reflects a satisfactory performance.
4. Conclusions
Object based image analysis of the field was a highly effective way of creating polygons of the tree canopy and depicting each one of them in the best possible way. Considering the difficulties of the study site, mainly due to its topographical characteristics, we can claim that OBIA was the best choice for image classification. Although OBIA was highly effective, a manual correction of polygons was necessary. As mentioned before, the algorithm could not recognize canopies of trees that were very close to each other as two separate ones and categorized them as a single one. For this reason, manual correction was indispensable in united tree crowns. Moreover, image classification was seriously influenced by the presence of shadows in the field orthomosaic, which could not be avoided because of the hilly and irregular terrain of the traditional olive orchard and which led to the misclassification of soil as canopies. Different modes of image classification, which were tried before the use of OBIA, did not prove to be so effective. In future work, the application of OBIA could be conducted to different bands, such as the Red Edge channel, combining also Normalized Digital Surface Model (nDSM = DSM − DTM) alongside the vegetation indices, such as NDVI, for object-based delineation of tree crown.
The fact that the majority of the studied variables demonstrated higher values in the northeastern and southwestern part of the field was influenced by its topography. In these parts, slope and aspect create conditions which favor the development and production of the olive trees compared to the rest of the field. These sections also coincide with the lower altitudes of the study site. Hence, it is easy to deduce that in these segments erosion rate is less as the water velocity is lower, thus the soil in these zones is more fertile. Another factor contributing to this spatial observation is that these parts of the field coincide with the direction of daily sun movement. In detail, the northeastern and the southwestern parts receive sunlight for a longer period of time, while the central part receives sunlight for a shorter time period during the day. It is easy to conclude that olive trees in particular parts of the field have better development characteristics (e.g., greater surface area and height) and increased production.
In contrast to other developed yield forecast models [21,22], our model can be used in hilly olive orchards, which are common in Mediterranean regions (e.g., Greece), because the slope factor is used and related with crown volume and vegetation index (NDVI). Also, the usage of high spatial resolution NDVI vegetation index in such models is pioneering because we would be able to have more accurate yield forecast using indices during cultivation period and therefore to intervene with proper cultivation techniques. Other models have been developed with machine learning in order to predict the yield in citrus cultivars, utilizing data such as trees’ age, irrigation, and variety for yield estimation instead of remote sensing data [31].
The development of the yield forecast model could be a great help to farmers since the exploitation of these data would benefit the management of cultivation techniques. Knowing the productive potential of the field, each farmer will be able to focus cultivation practices such as irrigation and fertilization in particular zones or trees that have lower yield. The ability to collect and store crop-related data (e.g., yield per year, fertilization and irrigation, pruning, and soil analysis) over a number of years in geodatabases enables farmers to spatially and temporally monitor the cultivation in order to improve their techniques. The creation of thematic maps of yield forecast would be an additional tool in agriculture, which would contribute to an improved monitoring of the crops. Particularly in large scale crops, where careful monitoring is limited and difficult, the implementation of remote sensing technology, such as UAVs, would yield remarkable results. The everlasting implementation of yield forecast model will constitute a valuable tool for farmers. The development of Internet of Things (IOT) and big data analysis could facilitate access to agricultural data. Moreover, our model can be further developed in future. Data of NDVI vegetation index from different time periods could be used for more accurate fertilization and irrigation prescriptions. Time-related vegetation indices can contribute to making exact and targeted cultivation interventions. As a result, the precision cultivation of olive trees will spread, making its future application more common.
Author Contributions
Conceptualization, D.S. and D.K.; methodology, D.K. and D.S.; formal analysis, D.S.; investigation, D.S. and D.K.; resources, D.S. and D.K.; data curation, D.S.; writing—original draft preparation, D.S.; writing—review and editing, D.K.; visualization, D.S.; supervision, D.K.; project administration, D.K. All authors have read and agreed to the published version of the manuscript.
Funding
This research received no external funding.
Acknowledgments
The authors gratefully acknowledge Roxanne Suzette Lorilla’s and George Kefalas’ contribution to the use of multiresolution segmentation algorithm.
Conflicts of Interest
The authors declare no conflict of interest.
References
- Zohary, D.; Spiegel-Roy, P. Beginnings of fruit growing in the old world. Science 1975, 187, 319–327. [Google Scholar] [CrossRef] [PubMed]
- Therios, I. Olive Culture; Gartaganis Publications: Thessaloniki, Greece, 2005. (In Greek) [Google Scholar]
- Romero, L.R. Olive farming in the age of science and innovation. Olivae 1998, 72, 42–51. [Google Scholar]
- Vahidi, H.; Klinkenberg, B.; Johnson, B.A.; Moskal, L.M.; Yan, W. Mapping the individual trees in urban orchards by incorporating volunteered geographic information and very high resolution optical remotely sensed data: A template matching-based approach. Remote Sens. 2018, 10, 1134. [Google Scholar] [CrossRef] [Green Version]
- Ke, Y.; Quackenbush, L.J. A review of methods for automatic individual tree-crown detection and delineation from passive remote sensing. Int. J. Remote Sens. 2011, 32, 4725–4747. [Google Scholar] [CrossRef]
- Lindberg, E.; Holmgren, J. Individual tree crown methods for 3D data from remote sensing. Curr. For. Rep. 2017, 3, 19–31. [Google Scholar] [CrossRef] [Green Version]
- Calderón, R.; Navas-Cortés, J.A.; Lucena, C.; Zarco-Tejada, P.J. High-resolution airborne hyperspectral and thermal imagery for early detection of Verticillium wilt of olive using fluorescence, temperature and narrow-band spectral indices. Remote Sens. Environ. 2013, 139, 231–245. [Google Scholar] [CrossRef]
- Calderón, R.; Navas-Cortés, J.A.; Zarco-Tejada, P.J. Early detection and quantification of Verticillium wilt in olive using hyperspectral and thermal imagery over large areas. Remote Sens. 2015, 7, 5584–5610. [Google Scholar] [CrossRef] [Green Version]
- Pontikakos, C.M.; Tsiligiridis, T.A.; Drougka, M.E. Location-aware system for olive fruit fly spray control. Comput. Electron. Agric. 2010, 70, 355–368. [Google Scholar] [CrossRef]
- Gonzalez-Dugo, V.; Zarco-Tejada, P.J.; Nicolás, E.N.; Nortes-Tortosa, P.; Alarcón, J.J.; Intrigliolo, D.S.; Fereres, E. Using high resolution UAV thermal imagery to assess the variability in the water status of five fruit tree species within a commercial orchard. Precis. Agric. 2013, 14, 660–678. [Google Scholar] [CrossRef]
- Sepulcre-Cantó, G.; Zarco-Tejada, P.J.; Jiménez-Muñoz, J.C.; Sobrino, J.A.; De Miguel, E.; Villalobos, F.J. Detection of water stress in an olive orchard with thermal remote sensing imagery. Agric. For. Meteorol. 2006, 136, 31–44. [Google Scholar] [CrossRef]
- Berni, J.; Zarco-Tejada, P.J.; Sepulcre-Cantó, G.; Fereres, E.; Villalobos, F.J.; Jimenez-Berni, J.A. Mapping canopy conductance and CWSI in olive orchards using high resolution thermal remote sensing imagery. Remote Sens. Environ. 2009, 113, 2380–2388. [Google Scholar] [CrossRef]
- Dandois, J.P.; Ellis, E.C. High spatial resolution three-dimensional mapping of vegetation spectral dynamics using computer vision. Remote Sens. Environ. 2013, 136, 259–276. [Google Scholar] [CrossRef] [Green Version]
- Panagiotidis, D.; Abdollahnejad, A.; Surový, P.; Chiteculo, V. Determining tree height and crown diameter from high-resolution UAV imagery. Int. J. Remote Sens. 2016, 38, 2392–2410. [Google Scholar] [CrossRef]
- Zarco-Tejada, P.J.; Díaz-Varela, R.A.; Angileri, V.; Loudjani, P. Tree height quantification using very high resolution imagery acquired from an unmanned aerial vehicle (UAV) and automatic 3D photo-reconstruction methods. Eur. J. Agron. 2014, 55, 89–99. [Google Scholar] [CrossRef]
- Díaz-Varela, R.A.; De La Rosa, R.; Leòn, L.; Zarco-Tejada, P.J. High-resolution airborne UAV imagery to assess olive tree crown parameters using 3D photo reconstruction: application in breeding trials. Remote Sens. 2015, 7, 4213–4232. [Google Scholar] [CrossRef] [Green Version]
- Miranda-Fuentes, A.; Llorens, J.; Gamarra-Diezma, J.L.; Gil-Ribes, J.A.; Gil, E. Towards an optimized method of olive tree crown volume measurement. Sensors 2015, 15, 3671–3687. [Google Scholar] [CrossRef] [Green Version]
- Mesas-Carrascosa, F.-J.; Torres-Sánchez, J.; Rumbao, I.C.; García-Ferrer, A.; Peña-Barragan, J.M.; Borra-Serrano, I.; López-Granados, F. Assessing optimal flight parameters for generating accurate multispectral orthomosaicks by UAV to support site-specific crop management. Remote Sens. 2015, 7, 12793–12814. [Google Scholar] [CrossRef] [Green Version]
- Torres-Sánchez, J.; López-Granados, F.; Borra-Serrano, I.; Peña-Barragan, J.M. Assessing UAV-collected image overlap influence on computation time and digital surface model accuracy in olive orchards. Precis. Agric. 2017, 19, 115–133. [Google Scholar] [CrossRef]
- Noori, O.; Arzani, K.; Moameni, A.; Taheri, M. Vegetative growth and fruit set of olive (Olea europaea L. cv. ’Zard’) in response to some soil and plant factors. J. Central Eur. Agric. 2015, 16, 319–329. [Google Scholar] [CrossRef] [Green Version]
- Maselli, F.; Chiesi, M.; Brilli, L.; Moriondo, M. Simulation of olive fruit yield in Tuscany through the integration of remote sensing and ground data. Ecol. Model. 2012, 244, 1–12. [Google Scholar] [CrossRef]
- Sola-Guirado, R.; Castillo-Ruiz, F.J.; Jiménez-Jiménez, F.; Blanco-Roldan, G.L.; Castro-García, S.; Gil-Ribes, J.A. Olive actual “on Year” yield forecast tool based on the tree canopy geometry using UAS imagery. Sensors 2017, 17, 1743. [Google Scholar] [CrossRef] [Green Version]
- Blaschke, T. Object based image analysis for remote sensing. ISPRS J. Photogramm. Remote Sens. 2010, 65, 2–16. [Google Scholar] [CrossRef] [Green Version]
- Burnett, C.; Blaschke, T. A multi-scale segmentation/object relationship modelling methodology for landscape analysis. Ecol. Model. 2003, 168, 233–249. [Google Scholar] [CrossRef]
- Castilla, G.; Hay, G.J. Image Objects and Geographic Objects; Springer Science and Business Media LLC: Berlin, Germany, 2008; pp. 91–110. [Google Scholar]
- Sarron, J.; Malézieux, E.; Sané, C.A.B.; Faye, É. Mango yield mapping at the orchard scale based on tree structure and land cover assessed by UAV. Remote Sens. 2018, 10, 1900. [Google Scholar] [CrossRef] [Green Version]
- Baatz, M. Multiresolution segmentation: An optimization approach for high quality multi-scale image segmentation. J. Photogramm. Remote Sens. 2000, 58, 12–23. [Google Scholar]
- Gómez, J.A.; Zarco-Tejada, P.J.; García-Morillo, J.; Gama, J.; Soriano, M.A. Determining biophysical parameters for olive trees using CASI-airborne and quickbird-satellite imagery. Agron. J. 2011, 103, 644–654. [Google Scholar] [CrossRef] [Green Version]
- Zhang, Z.; Jin, Y.; Chen, B.; Brown, P. California almond yield prediction at the orchard level with a machine learning approach. Front. Plant Sci. 2019, 10, 809. [Google Scholar] [CrossRef] [PubMed] [Green Version]
- Jin, Y.; Chen, B.; Lampinen, B.D.; Brown, P.H. Advancing agricultural production with machine learning analytics: yield determinants for California’s almond orchards. Front. Plant Sci. 2020, 11, 290. [Google Scholar] [CrossRef] [PubMed] [Green Version]
- Díaz, I.; Mazza, S.M.; Combarro, E.F.; Giménez, L.I.; Gaiad, J.E. Machine learning applied to the prediction of citrus production. Span. J. Agric. Res. 2017, 15, e0205. [Google Scholar] [CrossRef]
Figure 1.
Flow chart displaying the procedure of creating the yield forecast model.

Figure 2.
Slope Thematic Map of the study area.

Figure 3.
Digital Surface Model (DSM) of the study area.

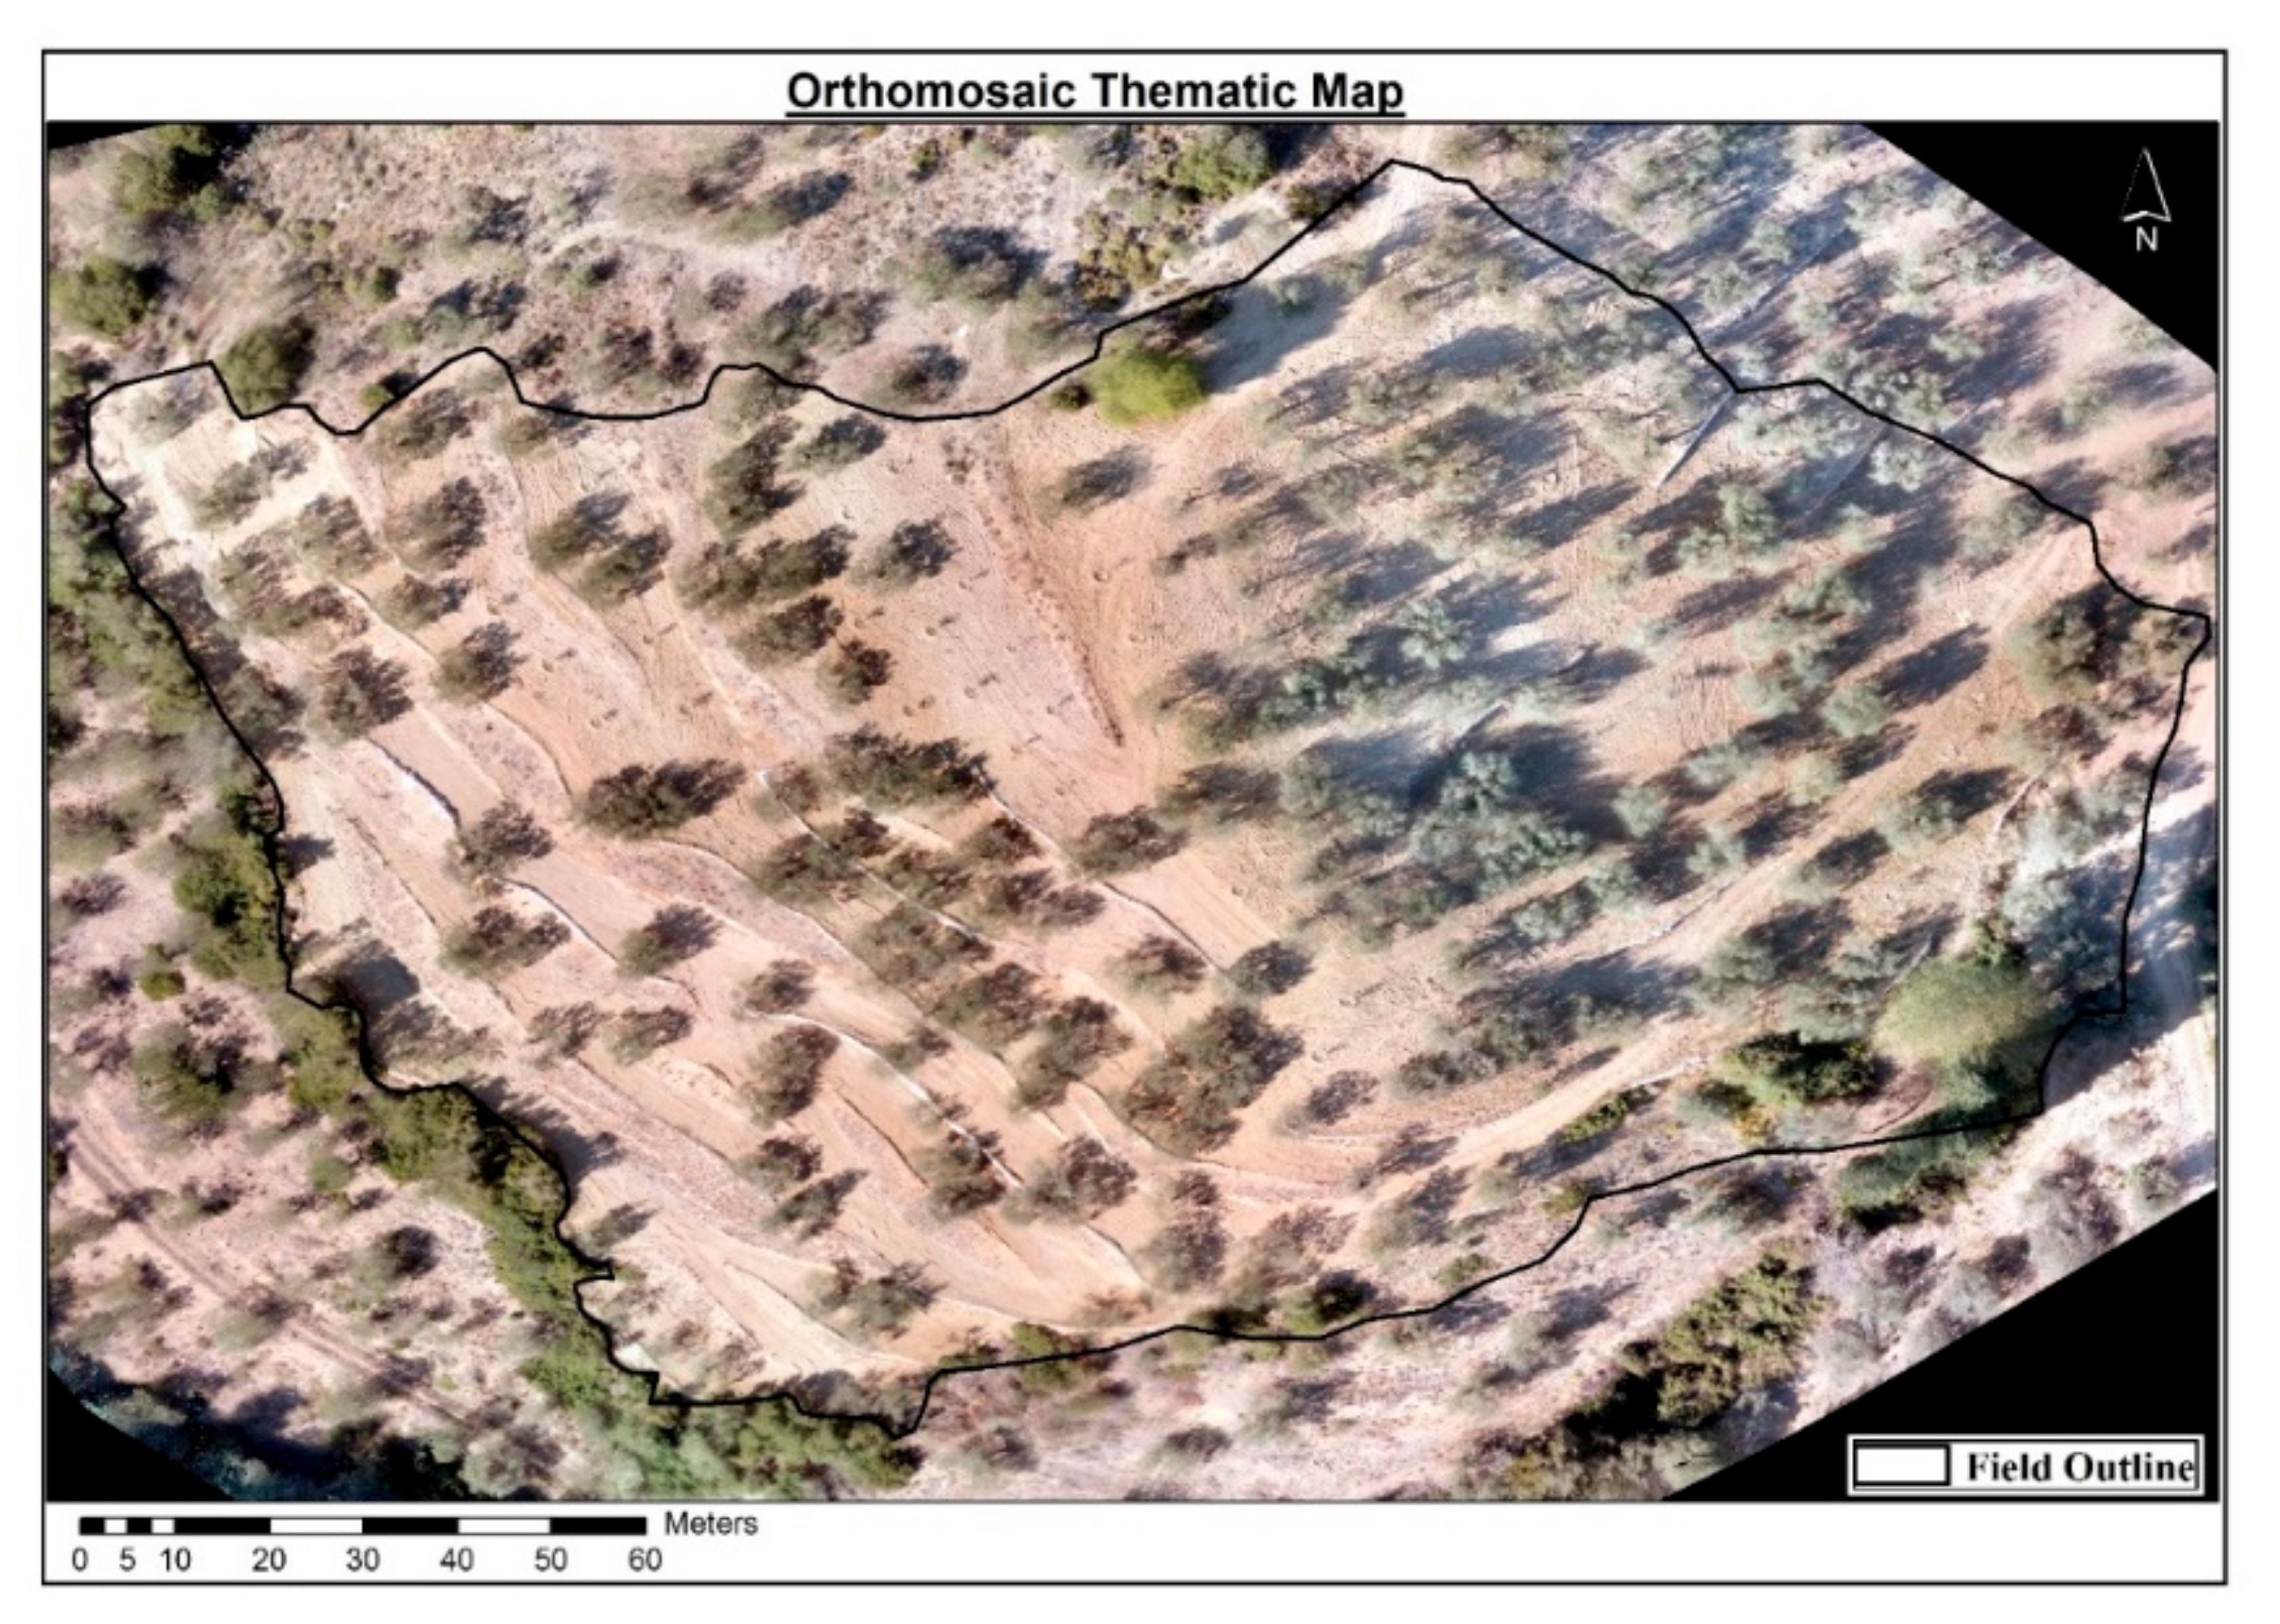
Figure 4.
Orthomosaic of the study area.

Figure 5.
Thematic Map of Yield Forecast Model results.


Table 1.
Multiple regression coefficients predicting olive tree yield.
| Unstandardized Coefficients | Standardized Coefficients | t | Significance | ||
|---|---|---|---|---|---|
| B | Standard Error | Beta | |||
| Constant | 63.14 | 11.251 | 5.612 | 0.000 | |
| NDVI | −60.51 | 19.010 | −0.403 | −3.183 | 0.003 |
| Slope | −0.58 | 0.196 | −0.325 | −2.938 | 0.006 |
| Aerial Volume | 0.29 | 0.045 | 0.831 | 6.519 | 0.000 |
© 2020 by the authors. Licensee MDPI, Basel, Switzerland. This article is an open access article distributed under the terms and conditions of the Creative Commons Attribution (CC BY) license (http://creativecommons.org/licenses/by/4.0/).
Share and Cite
MDPI and ACS Style
Stateras, D.; Kalivas, D. Assessment of Olive Tree Canopy Characteristics and Yield Forecast Model Using High Resolution UAV Imagery. Agriculture 2020, 10, 385. https://0-doi-org.brum.beds.ac.uk/10.3390/agriculture10090385
AMA Style
Stateras D, Kalivas D. Assessment of Olive Tree Canopy Characteristics and Yield Forecast Model Using High Resolution UAV Imagery. Agriculture. 2020; 10(9):385. https://0-doi-org.brum.beds.ac.uk/10.3390/agriculture10090385
Chicago/Turabian StyleStateras, Dimitrios, and Dionissios Kalivas. 2020. "Assessment of Olive Tree Canopy Characteristics and Yield Forecast Model Using High Resolution UAV Imagery" Agriculture 10, no. 9: 385. https://0-doi-org.brum.beds.ac.uk/10.3390/agriculture10090385
Note that from the first issue of 2016, this journal uses article numbers instead of page numbers. See further details here.