Article

Grain Quality of Maize Cultivars as a Function of Planting Dates, Irrigation and Nitrogen Stress: A Case Study from Semiarid Conditions of Iran

by
Maryam Rahimi Jahangirlou
1,2,
Gholam Abbas Akbari
1,*,
Iraj Alahdadi
1,
Saeid Soufizadeh
3 and
David Parsons
2
1
Department of Agronomy and Plant Breeding Sciences, College of Aburaihan, University of Tehran, Pakdasht 1417466191, Iran
2
Department of Agricultural Research for Northern Sweden, Swedish University of Agricultural Sciences, 90183 Umeå, Sweden
3
Department of Agroecology, Environmental Sciences Research Institute, Shahid Beheshti University, Tehran P.O. Box 19835-196, Iran
*
Author to whom correspondence should be addressed.
Submission received: 6 November 2020 / Revised: 19 December 2020 / Accepted: 21 December 2020 / Published: 27 December 2020
(This article belongs to the Special Issue New Traits of Agriculture/Food Quality Interface)

Abstract

:
Maize grain is an important source of human and animal feed, and its quality can be affected by management practices and climatic conditions. This study aimed to evaluate the concentration and composition of starch, protein and oil in grain of maize cultivars in response to different planting dates (20 June and 21 July), irrigation (12-day and 6-day intervals) and nitrogen rates (0 and 184 kg N ha−1). The first two principal components (PCs) accounted for 84.5% of the total variation. High N fertilization increased protein (by 6.0 and 10.9 g kg−1) and total nonessential amino acids (by 3.4 and 2.4 g kg−1) during 2018 and 2019, respectively. With the high irrigation rate, the high N rate increased oil, total unsaturated fatty acids, and starch and amylopectin, whereas with the low irrigation rate, there was no effect of the N rate. With earlier planting, total saturated fatty acids were higher. The findings highlight the complicated relationship between the different factors and how they affect quality characteristics of maize grain. There was a large impact of year, which to a great extent cannot be controlled, even in this environment where water supply was controlled and rainfall did not affect the results.

Graphical Abstract

1. Introduction

Dent maize (Zea mays L. var. indentata) is cultivated because of its various end uses including livestock nutrition, human consumption and ethanol production [1].
The mature grain of dent maize is composed of storage components including 60% to 72% starch [2], 8 to 11% protein [3] and 4 to 6% oil [1]. Amylose and amylopectin are glucose storage polymers that can alter physicochemical properties of starch [4]. The optimal amylose–amylopectin ratio differs depending on the purpose of use. While high-amylose maize grain is a good source to supply resistant starch for food industries [5], high-amylopectin grain can be appropriate for livestock feeding because it is easier to digest [6]. For poultry diets, amylose content is significantly correlated with lower digestibility or higher resistant starch content because of a very compact physical structure [7].
Protein of cereals is critically important with regards to nutritional quality. Protein is relevant in terms of its overall concentration, and the essential and nonessential amino acids and their ratios [8]. Diets with essential amino acids as the only N source are used less efficiently than diets with an optimal ratio of essential to nonessential amino acids [9], which affects the amount of N losses from poultry excrement [10]. Saturated and unsaturated fatty acids and their distribution in triacylglycerol molecules are also important compositional factors of crude fat or oil to estimate metabolizable energy values in animal diets and oil nutritional value for human consumption [11].
The abovementioned compositional factors, as substantial dimensions of cereal grain quality are strongly affected by the genetic potential, the growing environment and agricultural practices [12,13]. Among agronomic practices, key strategies include cultivar selection [14]; water regimes [15]; nutritional status, especially N utilization [8]; and edaphic and climatic conditions, in particular, temperature changes due to year, location and planting date [16]. The effect of these factors on grain quality is more complex than yield. As an example, apart from interspecies differences, reports have shown that higher N rates reduced rice cooking quality by decreasing amylose [17], and in wheat grain, higher N doses caused an increase in different fractions of proteins and amino acids [18]. Lower temperatures resulted in smaller starch granule formation and decreased amylose content of maize grain starch [19]. Concentrations of amino acids increased with canopy warming in winter wheat [20]. Soil water deficit decreased the contents of amylose and starch in wheat grain [21] and of oil and linolenic acid in maize grain [22]. Water stress caused an increase in amino acid concentrations of maize grain [23]. An increase in starch [11] and a decrease in protein concentration [24] were reported for sorghum grain grown under high water-deficit conditions. Interactions between factors can also affect grain quality. For example, variations in nitrogen-based compounds like protein and amino acids can be a consequence of the dilution effect—decreasing the concentration of elements in plant tissue due to changes in environmental conditions—in response to irrigation and N interactions [25]. As a result, cultivar, water regime, N rate and planting date impact the qualitative characteristics of cereal grains; however, more knowledge is needed on how these factors work in an interactive way.
Thus, in this study, we assessed the interactive effects of planting date, irrigation timing and N fertilization on various measures of maize grain quality. The aim of the research was to provide a basis of knowledge for defining future research and for developing guidelines for improving maize grain quality.

2. Materials and Methods

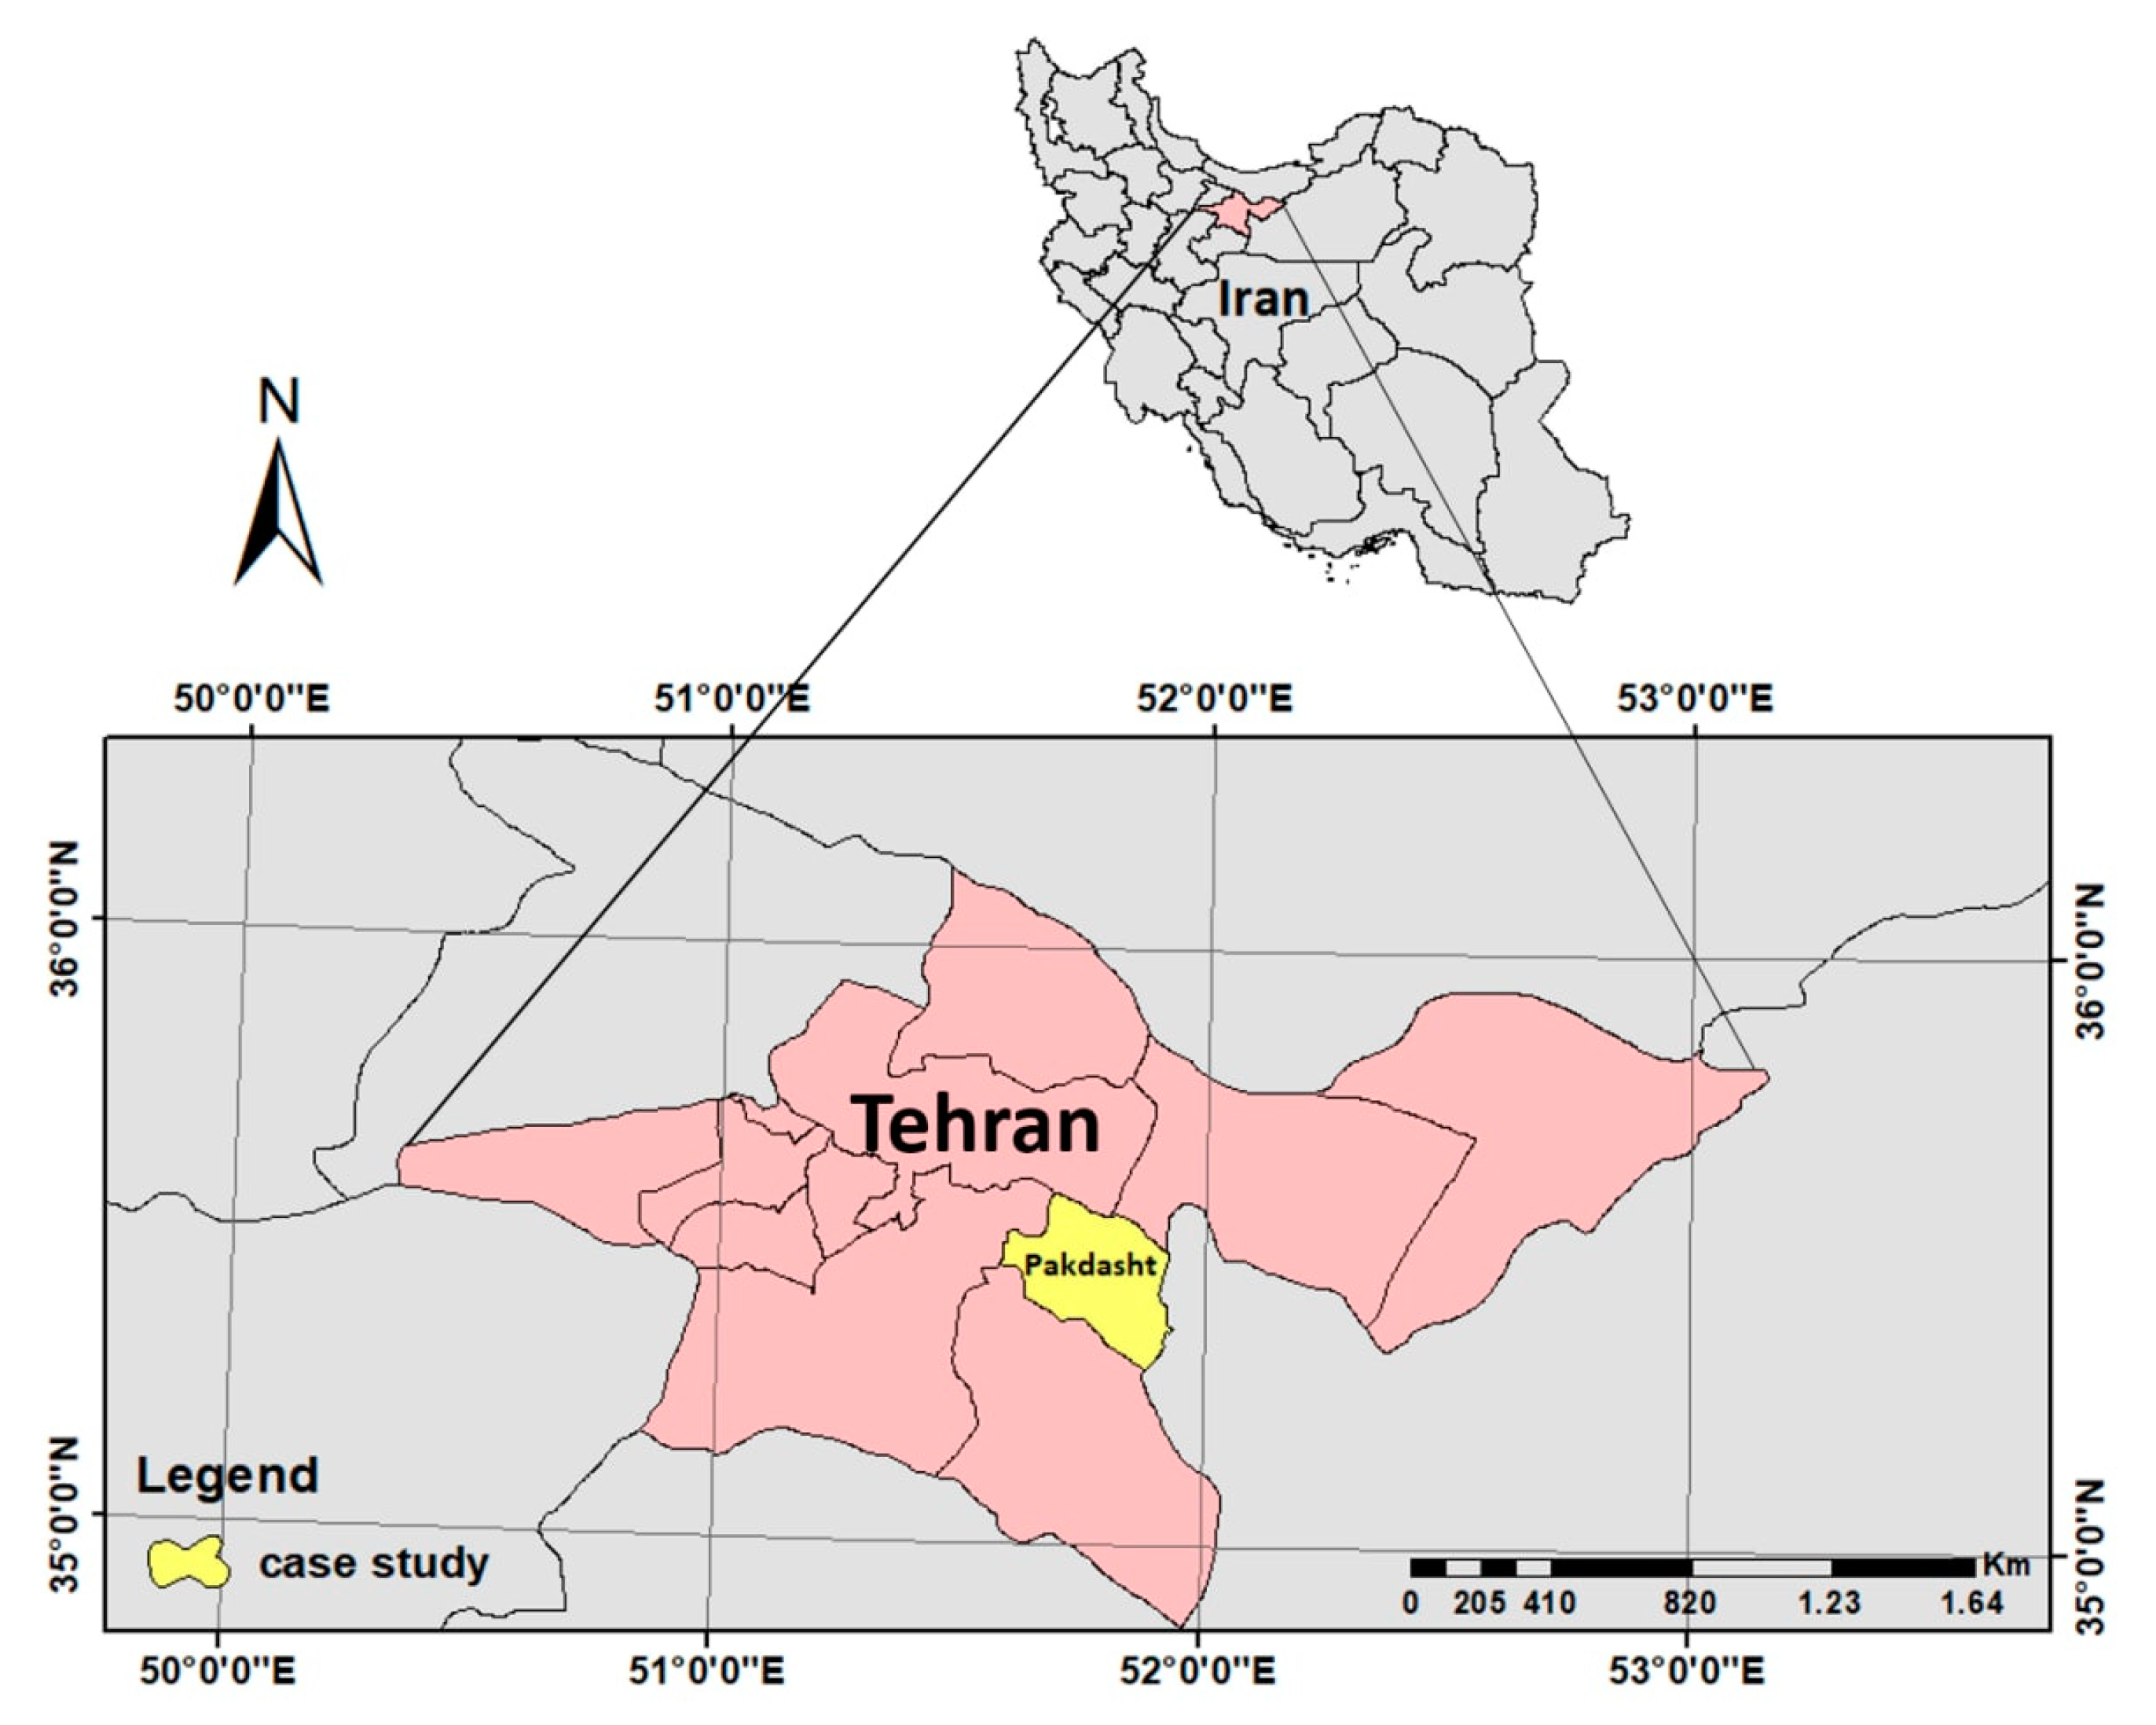
2.1. Experiment Site

Field experiments were performed in 2018 and 2019 in Pakdasht city (35.4669° N, 51.6861° E), Tehran province, Iran. The geographical location of Pakdasht city in Iran is shown in Figure 1. This region has a semiarid climate with relatively cold winters and hot summers. Annual precipitation in Pakdasht is approximately 160 mm and concentrated in late autumn and winter. Irrigated summer maize in this region is typically cultivated after winter cereals like wheat and barley. Summaries of the climatic parameters during the summer maize growing season for two years of the experiment are presented in Table 1. The overall means of daily temperatures were 25.3 and 24.9 °C for 2018 and 2019, respectively, and the total precipitation was less than 1.5 mm in each growing season. The highest temperatures occurred in July for both years. Soil sampling was conducted before the first cultivation year from two depths (0–30 and 30–60 cm). The samples were air dried; passed through a 2-mm sieve; and tested for organic carbon using the Walkley–Black method [26], total nitrogen (N) using the Kjeldahl method [27], for available phosphorus (P) by the Olsen procedure [28] and for available Potassium (K) by using a flame photometer [29]. The soil is characterized as clay-loam, and the initial physicochemical characteristics in 0−30 cm soil depth were as follows: organic carbon, 1.09%; total N, 0.12%; P, 90.17 mg kg−1; and K, 453 mg kg−1. Moisture release curve was used to determine soil water [30,31]. Water content at field capacity and permanent wilting point were 0.346 and 0.115 g·cm−3, respectively.

2.2. Experimental Design

In mid-June 2018, experimental strips and plots were designated at a farm where no crops had been cultivated for the previous three years. The field was divided into two strips (24-m length) to apply different irrigation timings (12-day and 6-day intervals). Two planting dates (20 June and 21 July) were randomized within the irrigation treatments. Two ditches crossed the strips, partitioning each of them into three plots. Thus, the experiment comprised twelve main plots. The four combinations of cultivars (KSC704 and KSC260) and N rates (0 and 184 kg ha−1) were randomized to subplots within each plot. Thus, a total of 12 main plots containing a total of 48 subplots were obtained from three replications in each cultivation year. Individual subplots were 6 m in length and consisted of 6 rows sown at a density of six and eight plants per square meter for KSC704 and KSC260, respectively. Treatments were applied to the same plots in each year.
KSC704 is a locally popular high-yield late maturity hybrid which has been cultivated in Iran since 1980 and accounts for 80% of the maize growing areas of Iran [32]. KSC260, an early maturity maize cultivar, was introduced in 2008 and has shown good performance in various experiments comparing new early-maturing cultivars [33]. Harvesting date, maturity period and the total growing degree days (GDDs) of cultivars in the present study are shown in Table 2. GDD was calculated using the GDD calculator program [34]. For this study, 10 °C was set as the base temperature, 34 °C was set as the optimum temperature and 40 °C was set as the maximum temperature threshold, adapted from Cutforth and Shaykewich [35]. The two planting dates were chosen to create different temperature conditions during grain filling. The variability of daily average temperature during the reproductive stage (VT-R6) for both planting dates is shown in Figure 2. There were clear differences between the recorded temperatures for the planting dates in each year and differences between the two years. The second year was a warmer year during the reproductive period.
An irrigation regime with 6-day intervals and N rate of 184 kg ha−1 were specified as typical non-stressed growing conditions. Furrow irrigation was used for irrigation. The closed-end furrows were constructed with a ditcher. The ridge and furrow widths were 40 cm and 20 cm, respectively, and the depth of the furrow was 15 cm. Based on the flow rate per furrow (approximately 1.3 L/s), water was delivered until the furrows were completely full and the duration of each irrigation event was recorded. The known flow rate of the irrigation pump was then used to estimate irrigation volumes.
In total, the KSC704 cultivar received about 9200 m3 ha−1 of water with 6-day irrigation timing and about 5800 m3 ha−1 with 12-day irrigation timing. KSC260 received less water due to a shorter growing period and less irrigation events: 7800 m3 ha−1 with 6-day irrigation timing and 4800 m3 ha−1 with 12-day irrigation timing. The Food and Agriculture Organization (FAO) estimates the water requirement of late-maturing maize cultivars in arid and semiarid regions to be around 7000 to 8000 m3 ha−1 [36]. Urea was used as the N source and top-dressed in equal proportions at two stages (pre-planting and V4–V6). Fresh irrigation water was used from the main ditch for each replication, and excess water was not reused.

2.3. Procedures of Sampling and Laboratory

2.3.1. Sample Preparation

At the R6 (physiological maturity) stage, based on the Hanway standard [37], 15 plants in an area of approximately 11 m2 (4-m row length × 0.7-m row spacing × 4 rows) were randomly cut from each subplot. Ears were threshed and dried at 60 °C to a constant weight. Seeds were separated from ears and were weighed and ground. The milled samples were maintained at 5 ± 1 °C until the start of laboratory procedures.

2.3.2. Analysis of Starch Content and Composition

Total starch and its composition (amylose and amylopectin) were determined using a Spectrophotometer (V-M5 model, BEL Engineering, Monza, Italy) set at 510 nm according to the amylose/amylopectin Megazyme procedure [38].

2.3.3. Analysis of Protein Content and Composition

Crude protein, essential amino acids (composed of methionine, threonine, valine, isoleucine, leucine, phenylalanine, histidine, arginine, lysine and tryptophan) and nonessential amino acids (composed of cysteine, asparagine, serine, glutamine, proline, glycine and alanine) were estimated using Near-Infrared Reflectance Spectroscopy (NIRS) (NIRS-XDS model, Foss, Hilleroed, Denmark) in the 1100–2500 nm wavelength range at five-nm intervals. A dent maize library of global origin samples that previously had been assayed by wet chemistry or non-NIR methods was used for model calibration.

2.3.4. Analysis of Oil Concentration and Fatty Acid Composition

Oil extraction was conducted using a Soxhlet extractor for approximately 4 h with hexane as the solvent, with a solid to solvent ratio of 1:7 m v−1. The fatty acid methyl esters (FAME) were extracted according to AOAC 996.06 protocol [39]. The synthesized FAME was injected into gas chromatography (GC) (CP-Sil 88 model, Varian, Walnut Creek, CA, USA) to detect fatty acid composition by curve and retention time. The GC was equipped with a flame ionization detector (FID) (Column: CP-Sil 88 (100 m ∗ 250 μm ∗ 0.2 μm) removable phase: Nitrogen, 28.8 min, heat injection chamber: 270 °C, heat detector: 260 °C).

2.4. Statistical Analysis

Principal component analysis (PCA) scores were derived using Minitab, v.19 [40] after standardizing the variables by using the correlation matrix. Results from the two cultivation years were analyzed separately, using mixed model procedures with PROC MIXED in SAS, v.9.4 software [41]. The mixed-effects model included fixed effects of irrigation, planting date, cultivar, N, their interactions, and the random effects of irrigation × planting date and irrigation × planting date × block interactions. Because of the experimental design, irrigation effects have to be interpreted with caution—possible meaningful effects of irrigation and its interactions can be either caused by differences between the planned irrigation treatments or by differences in the two sections of the field where the irrigation treatments were applied. Tukey’s statistic was used to test differences (p ≤ 0.05) among means.

3. Results

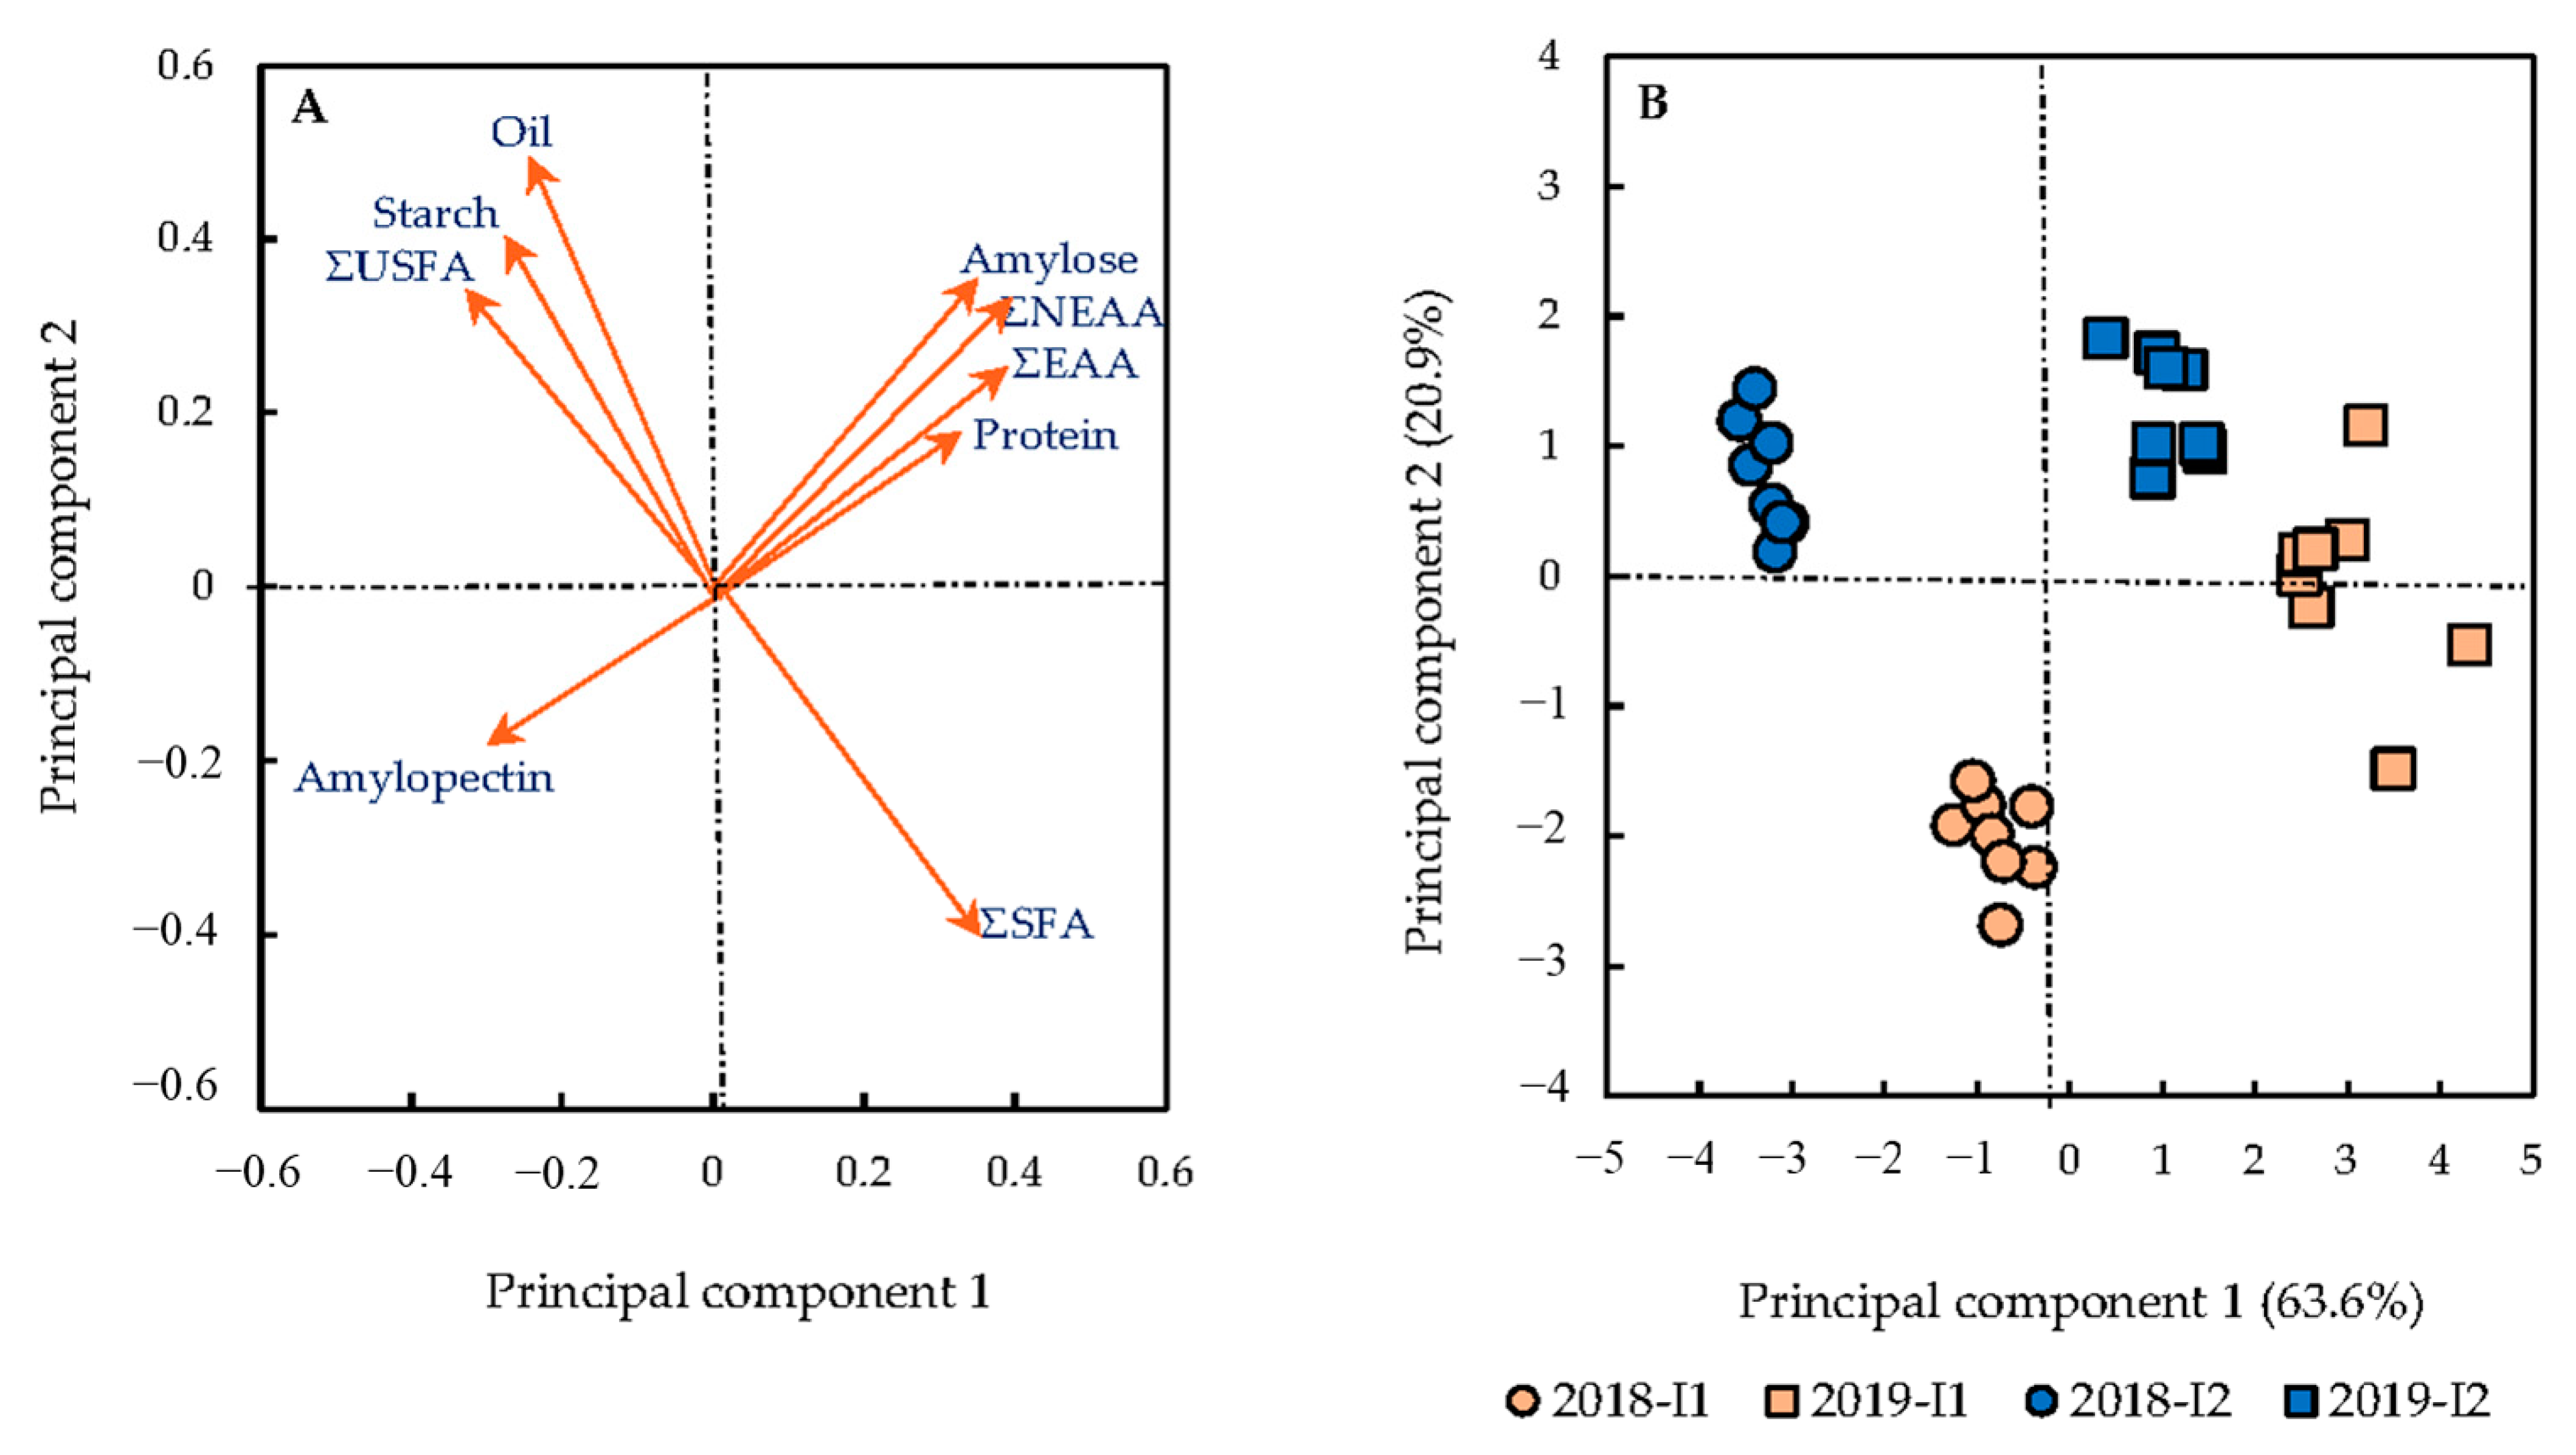
3.1. Correlations between Variables and Treatments

The PCA comprising the first two principal components accounted for 84.5% of the total variance. The loading plot (Figure 3A) shows the eigenvectors for nine variables: starch, amylose, amylopectin, protein, total essential amino acids (ΣEAA), total nonessential amino acids (ΣNEAA), oil, total saturated fatty acids (ΣSFA) and total unsaturated fatty acids (ΣUSFA).
The cosine of the angle between two vectors estimates the correlation between them; therefore, clustered points are highly correlated with each other. There are two clusters of variables that are strongly correlated with each. The first cluster includes protein concentration, protein composition (ΣEAA and ΣNEAA) and starch composition (amylose concentration) of the grain. The eigenvector for amylopectin points in the opposite direction; thus, the first cluster is highly negatively correlated with amylopectin (e.g., the correlation between ΣNEAA and amylopectin is −0.917). Running perpendicular to the first cluster, the second cluster of highly correlated variables includes oil, starch and ΣUSFA. This cluster is highly negatively correlated with ΣSFA (e.g., the correlation between starch and ΣSFA is −0.663).
The score plot means are shown in Figure 3B. To illustrate the most noticeable trends, points are labelled according to combinations of year and irrigation treatment. The first component separates the first year of the experiment from the second year—markers for the first year (2018) are located in the left of the score plot, whereas markers for the second year (2019) are in the right. The second component separates well-irrigated samples from those under potential water-stress. Markers for well-watered samples are distributed toward the top, while markers from water-limited plots are mostly located toward the bottom. However, the differences of irrigation timing are more clearly separated in the first year of the experiment than second.
The data points presented in score plots coincide with the directions of change in maize grain compositional variables in the loading plots. The two clusters of eigenvectors and their negative correlations define two axes, making an x shape. The first axis (from the southwest to northeast quadrants) separates 2018 from 2019. i.e., 2019 samples were higher in amylose, ΣEAA, ΣNEAA and protein. The second axis (from the northwest to southeast quadrants) separates the irrigation treatments. Irrigated plots were higher in starch, oil and ΣUSFA.

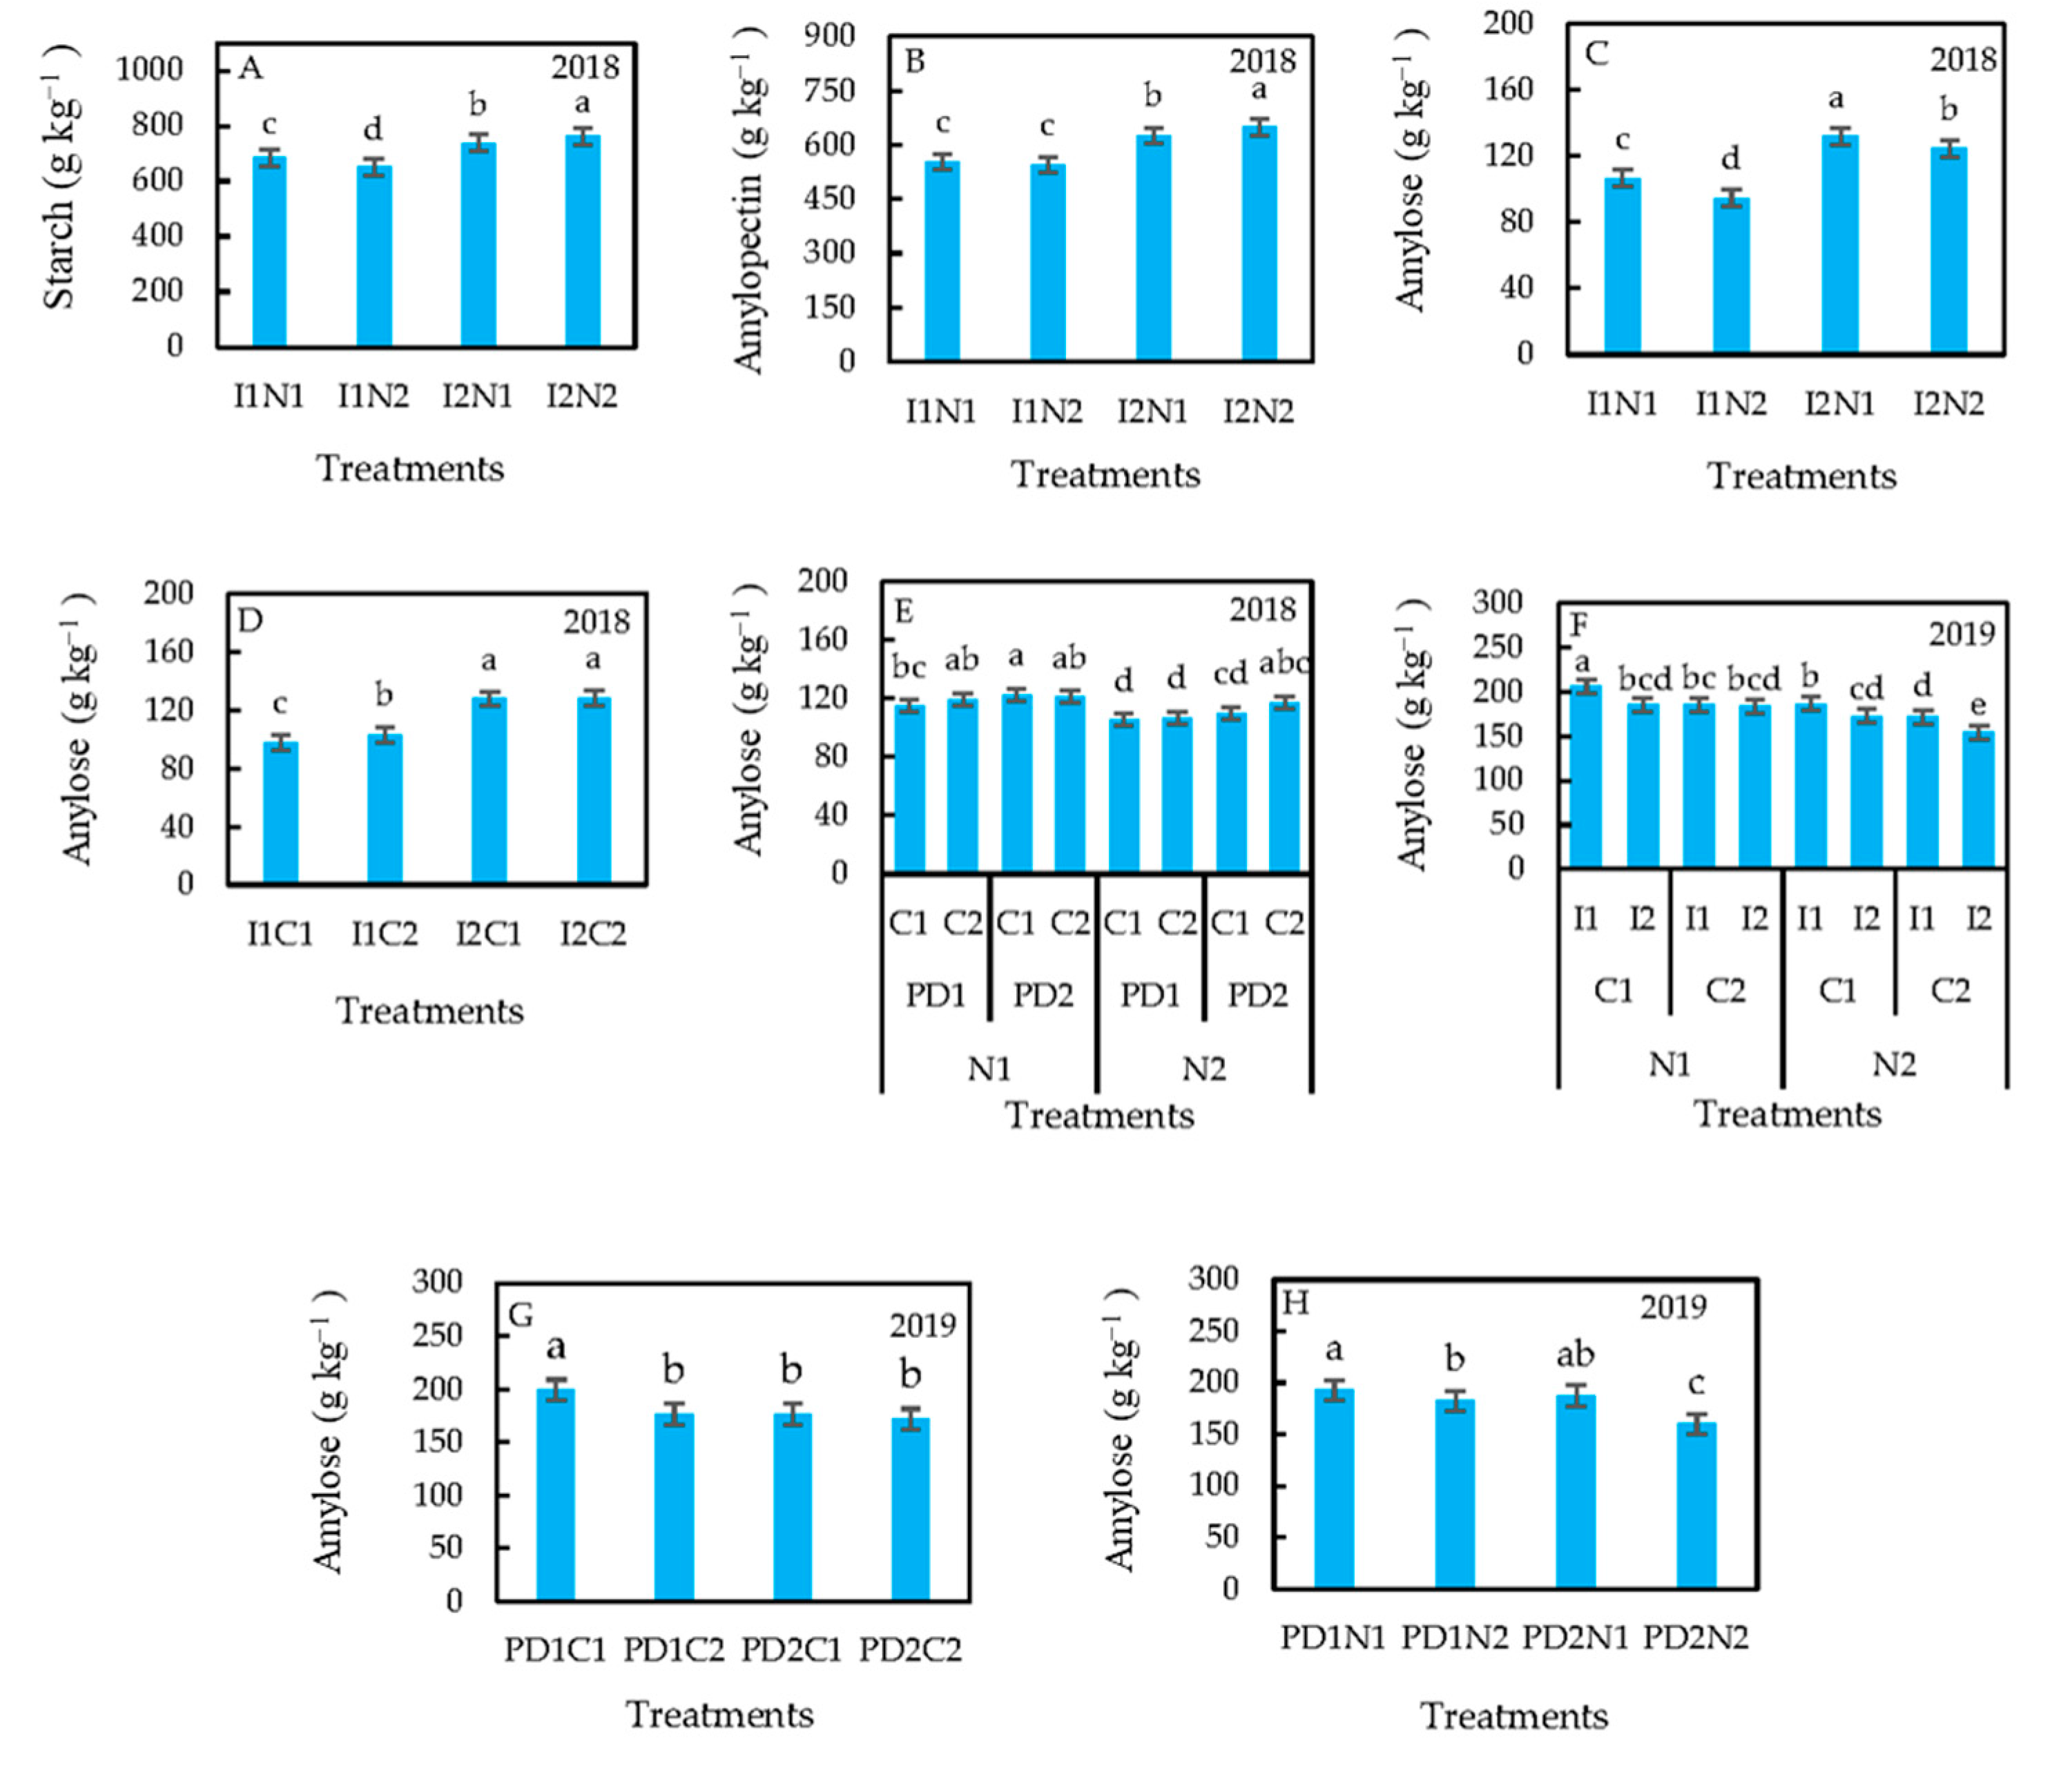
3.2. Treatment Effects on Starch Content and Composition

After calculating p-values of all main effects and interactions (Supplementary Materials S1), the treatment main effect means are presented in Table 3 and significant interactions were plotted (unless no pairs of means were significantly different or the effect could not be clearly interpreted).
In 2019, average starch concentration in KSC704 was higher than KSC260 by 11 g kg−1 (Table 3). In 2018, there was an interactive effect of irrigation and N rate on starch (Figure 4A). With the high irrigation rate, the high N rate increased starch, whereas with low irrigation, the high N rate decreased starch. Grain starch was higher with the high irrigation rate, regardless of the N rate. In 2019, high N increased amylopectin concentration by 17 g kg−1 (Table 3). In 2018, there was an interactive effect of irrigation and N rate on amylopectin (Figure 4B). With the high irrigation rate, the high N rate increased amylopectin (649 g kg−1), whereas with low irrigation, there was no N effect. Grain amylopectin was higher with the high irrigation rate, regardless of the N rate.
In 2018, there were interactive effects of irrigation and N rate (Figure 4C); irrigation rate and cultivar (Figure 4D); and N rate, planting date and cultivar (Figure 4E) on amylose concentration. For either irrigation rate, high N decreased amylose (Figure 4C). Amylose was higher with the high irrigation rate (with either N rate) than with the low irrigation rate (Figure 4C). With the high irrigation rate, there was no cultivar effect, whereas with low irrigation, KSC260 (103 g kg−1) had higher amylose than KSC704 (97 g kg−1) (Figure 4D). Grain amylose was higher with the high irrigation rate regardless of the cultivar (Figure 4D). With the zero N rate, KSC704 planted late had higher amylose than that planted earlier. With the high N rate, KSC260 planted late had higher amylose than that planted earlier. In general, amylose was higher with zero N fertilizer than with the high N rate (Figure 4E).
In 2019, there were interactive effects of N rate, cultivar and irrigation rate (Figure 4F); planting date and cultivar (Figure 4G); and planting date and N rate (Figure 4H) on amylose concentration. Low irrigation rate and zero N rate in KS704 had the greatest amylose concentration (205.15 g kg−1), whereas high irrigation and N rate in KSC260 decreased amylose to its lowest value (154.53 g kg−1) (Figure 4F). With an early planting date, KSC704 had higher amylose than KSC260 (198.98 g kg−1), whereas with a late planting date, there was no cultivar effect (Figure 4G). For both planting dates, N application decreased amylose concentration; however, the effect was greater with the late planting date (Figure 4H).

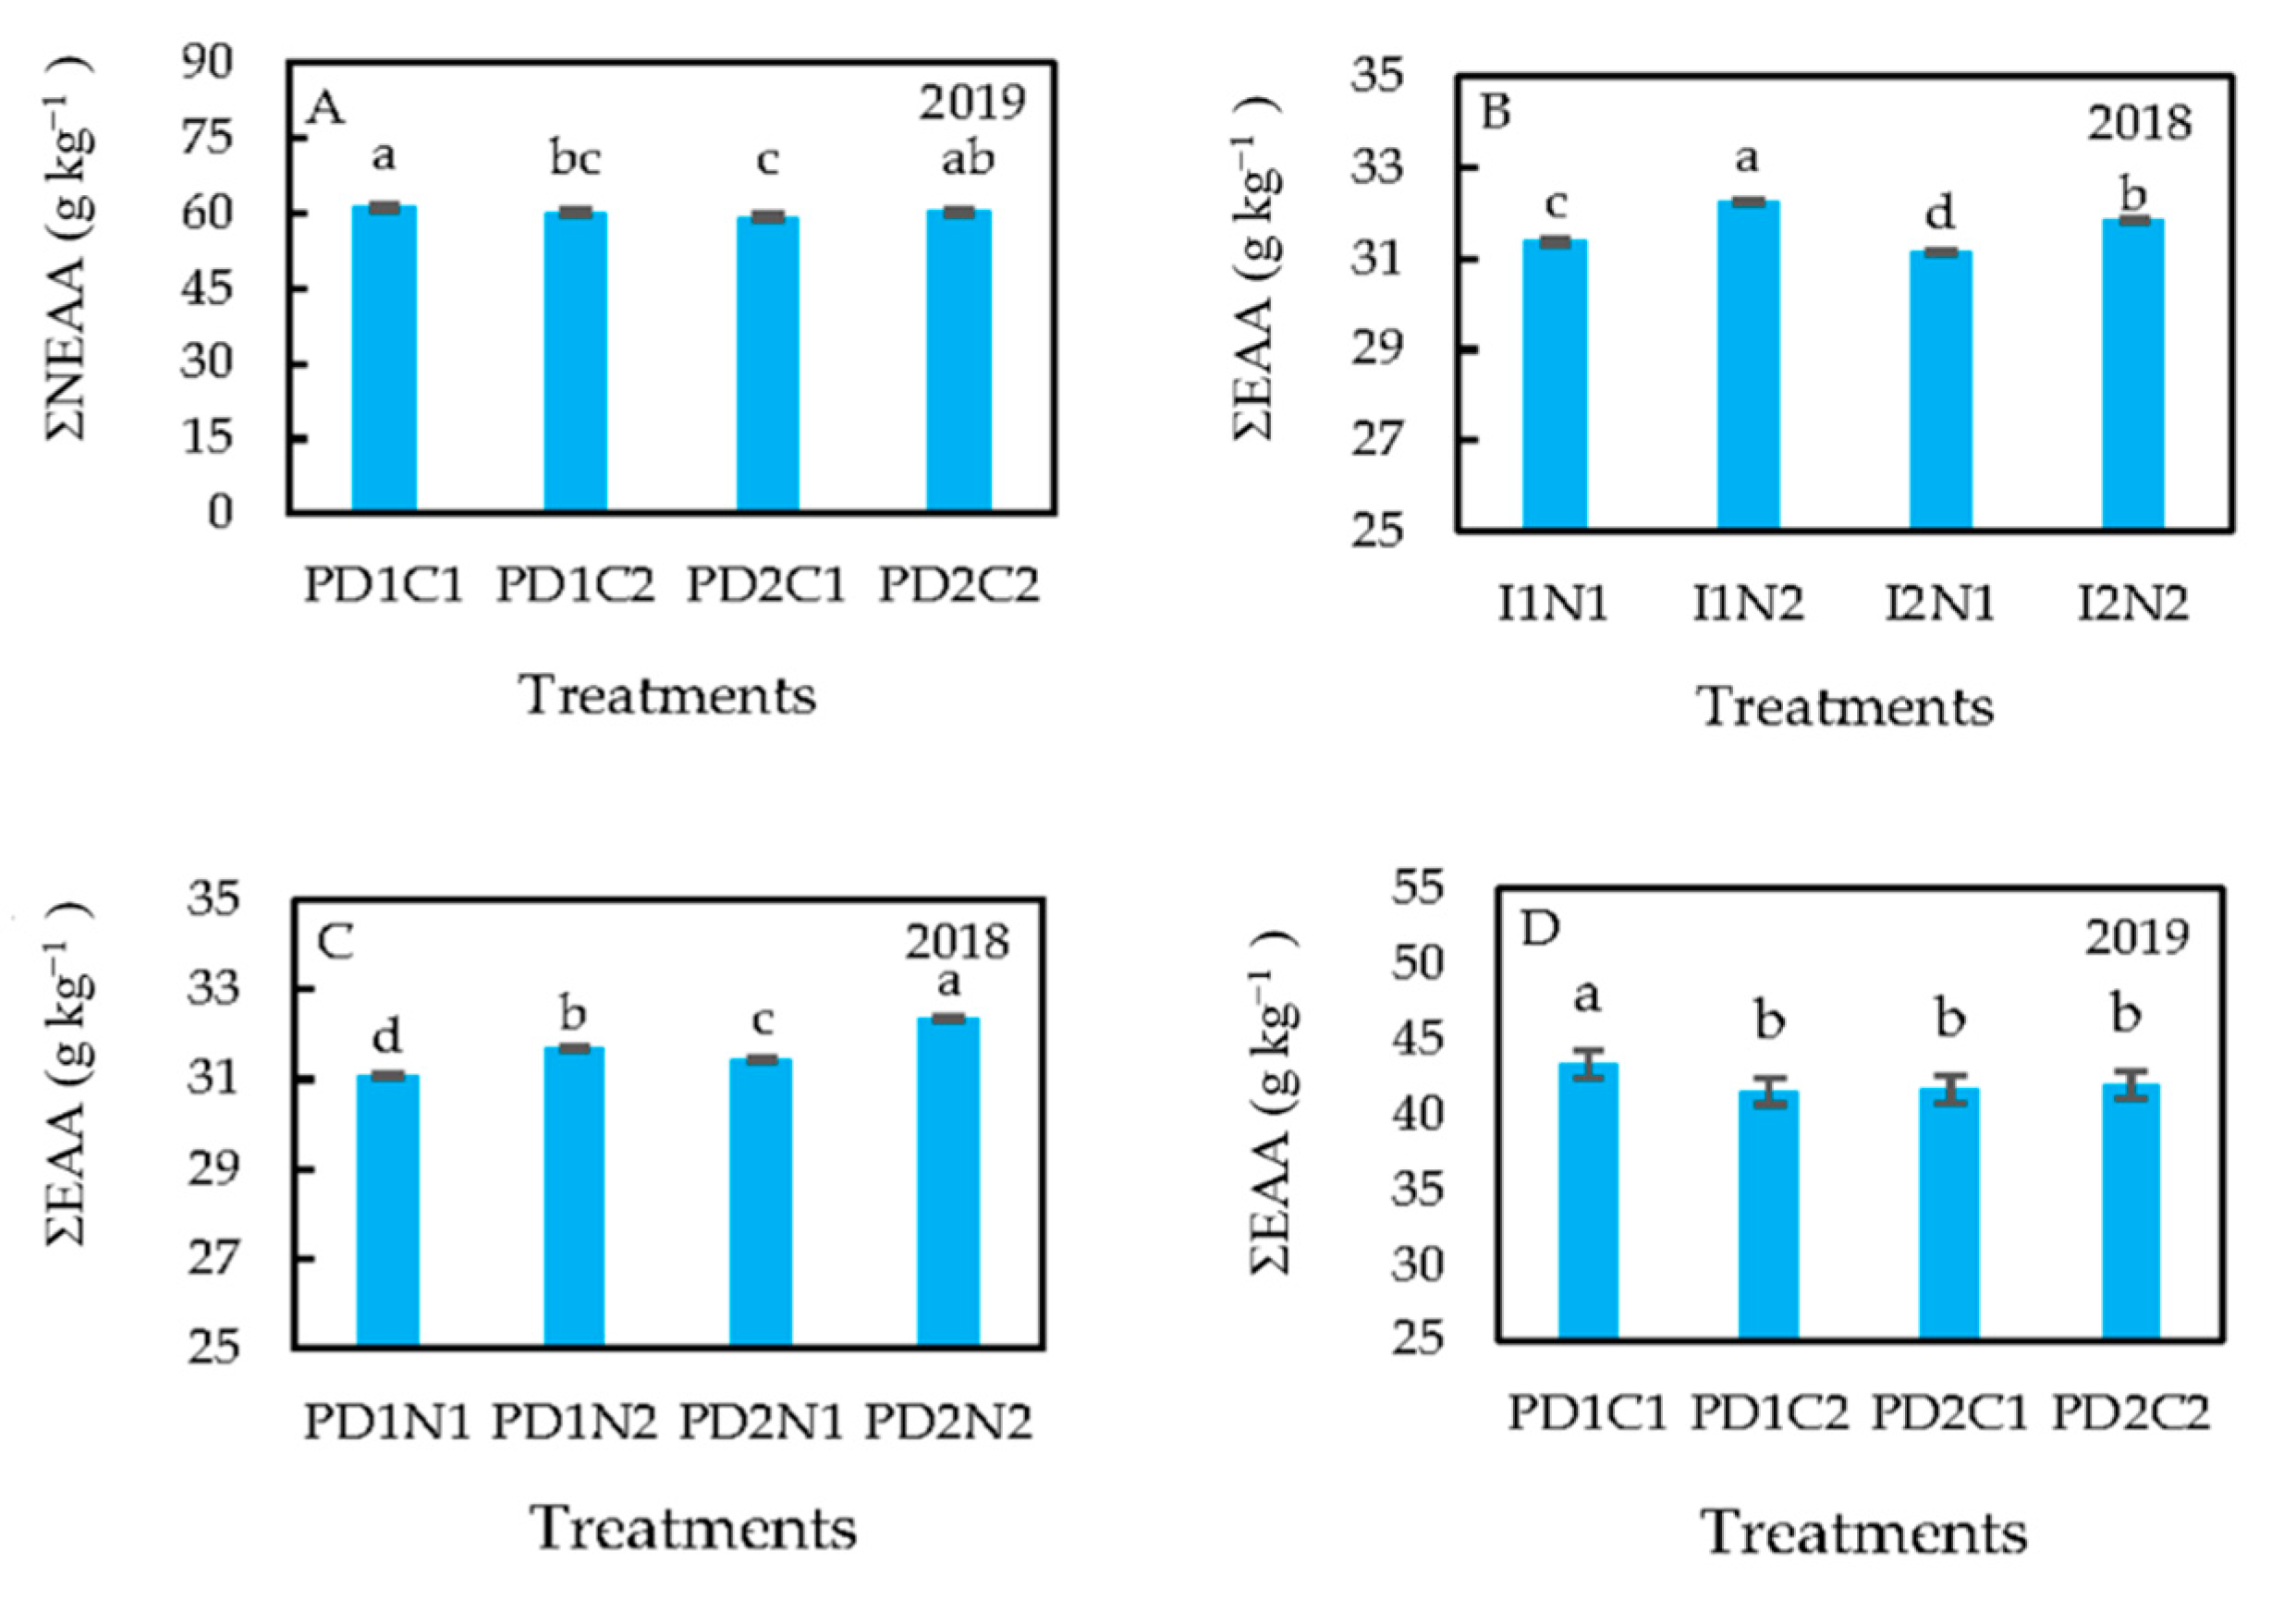
3.3. Treatment Effects on Protein Content and Composition

Irrigation, planting date and cultivar did not influence protein concentration in either year. However, high N increased proteins by 6.0 g kg−1 in 2018 and 10.9 g kg−1 in 2019. Moreover, high N increased ΣNEAA concentrations by 3.4 g kg−1 in 2018 and 2.4 g kg−1 in 2019 (Table 3). In 2018, low irrigation rate increased ΣNEAA by 3.2 g kg−1, and KSC260 had higher ΣNEAA than KSC704 by 1.2 g kg−1 (Table 3). In 2019, there was an interactive effect of planting date and cultivar on ΣNEAA (Figure 5A). With the early planting date, KSC704 had a higher ΣNEAA than KSC260, whereas with late planting, KSC260 had a higher ΣNEAA than KSC704.
In 2018, KSC260 had higher ΣEAA than KSC704 by 0.8 g kg−1 (Table 3). In 2019, high N increased the ΣEAA concentration by 1.4 g kg−1 (Table 3). In addition, in 2018, there was an interactive effect of irrigation and N (Figure 5B), and planting date and N (Figure 5C) on ΣEAA concentration. For either irrigation rate, a high N rate increased the ΣEAA concentration (Figure 5B); however, the effect was greater with a low irrigation rate. For either planting date, the high N rate increased the ΣEAA concentration (Figure 5C); however, high N had a greater effect on ΣEAA concentration (32.35 g kg−1) for the later planting date. In 2019, there was an interactive effect of planting date and cultivar on ΣEAA (Figure 5D). With the early planting date, KSC704 had higher ΣEAA than KSC260, whereas with the late planting date, there was no cultivar effect.

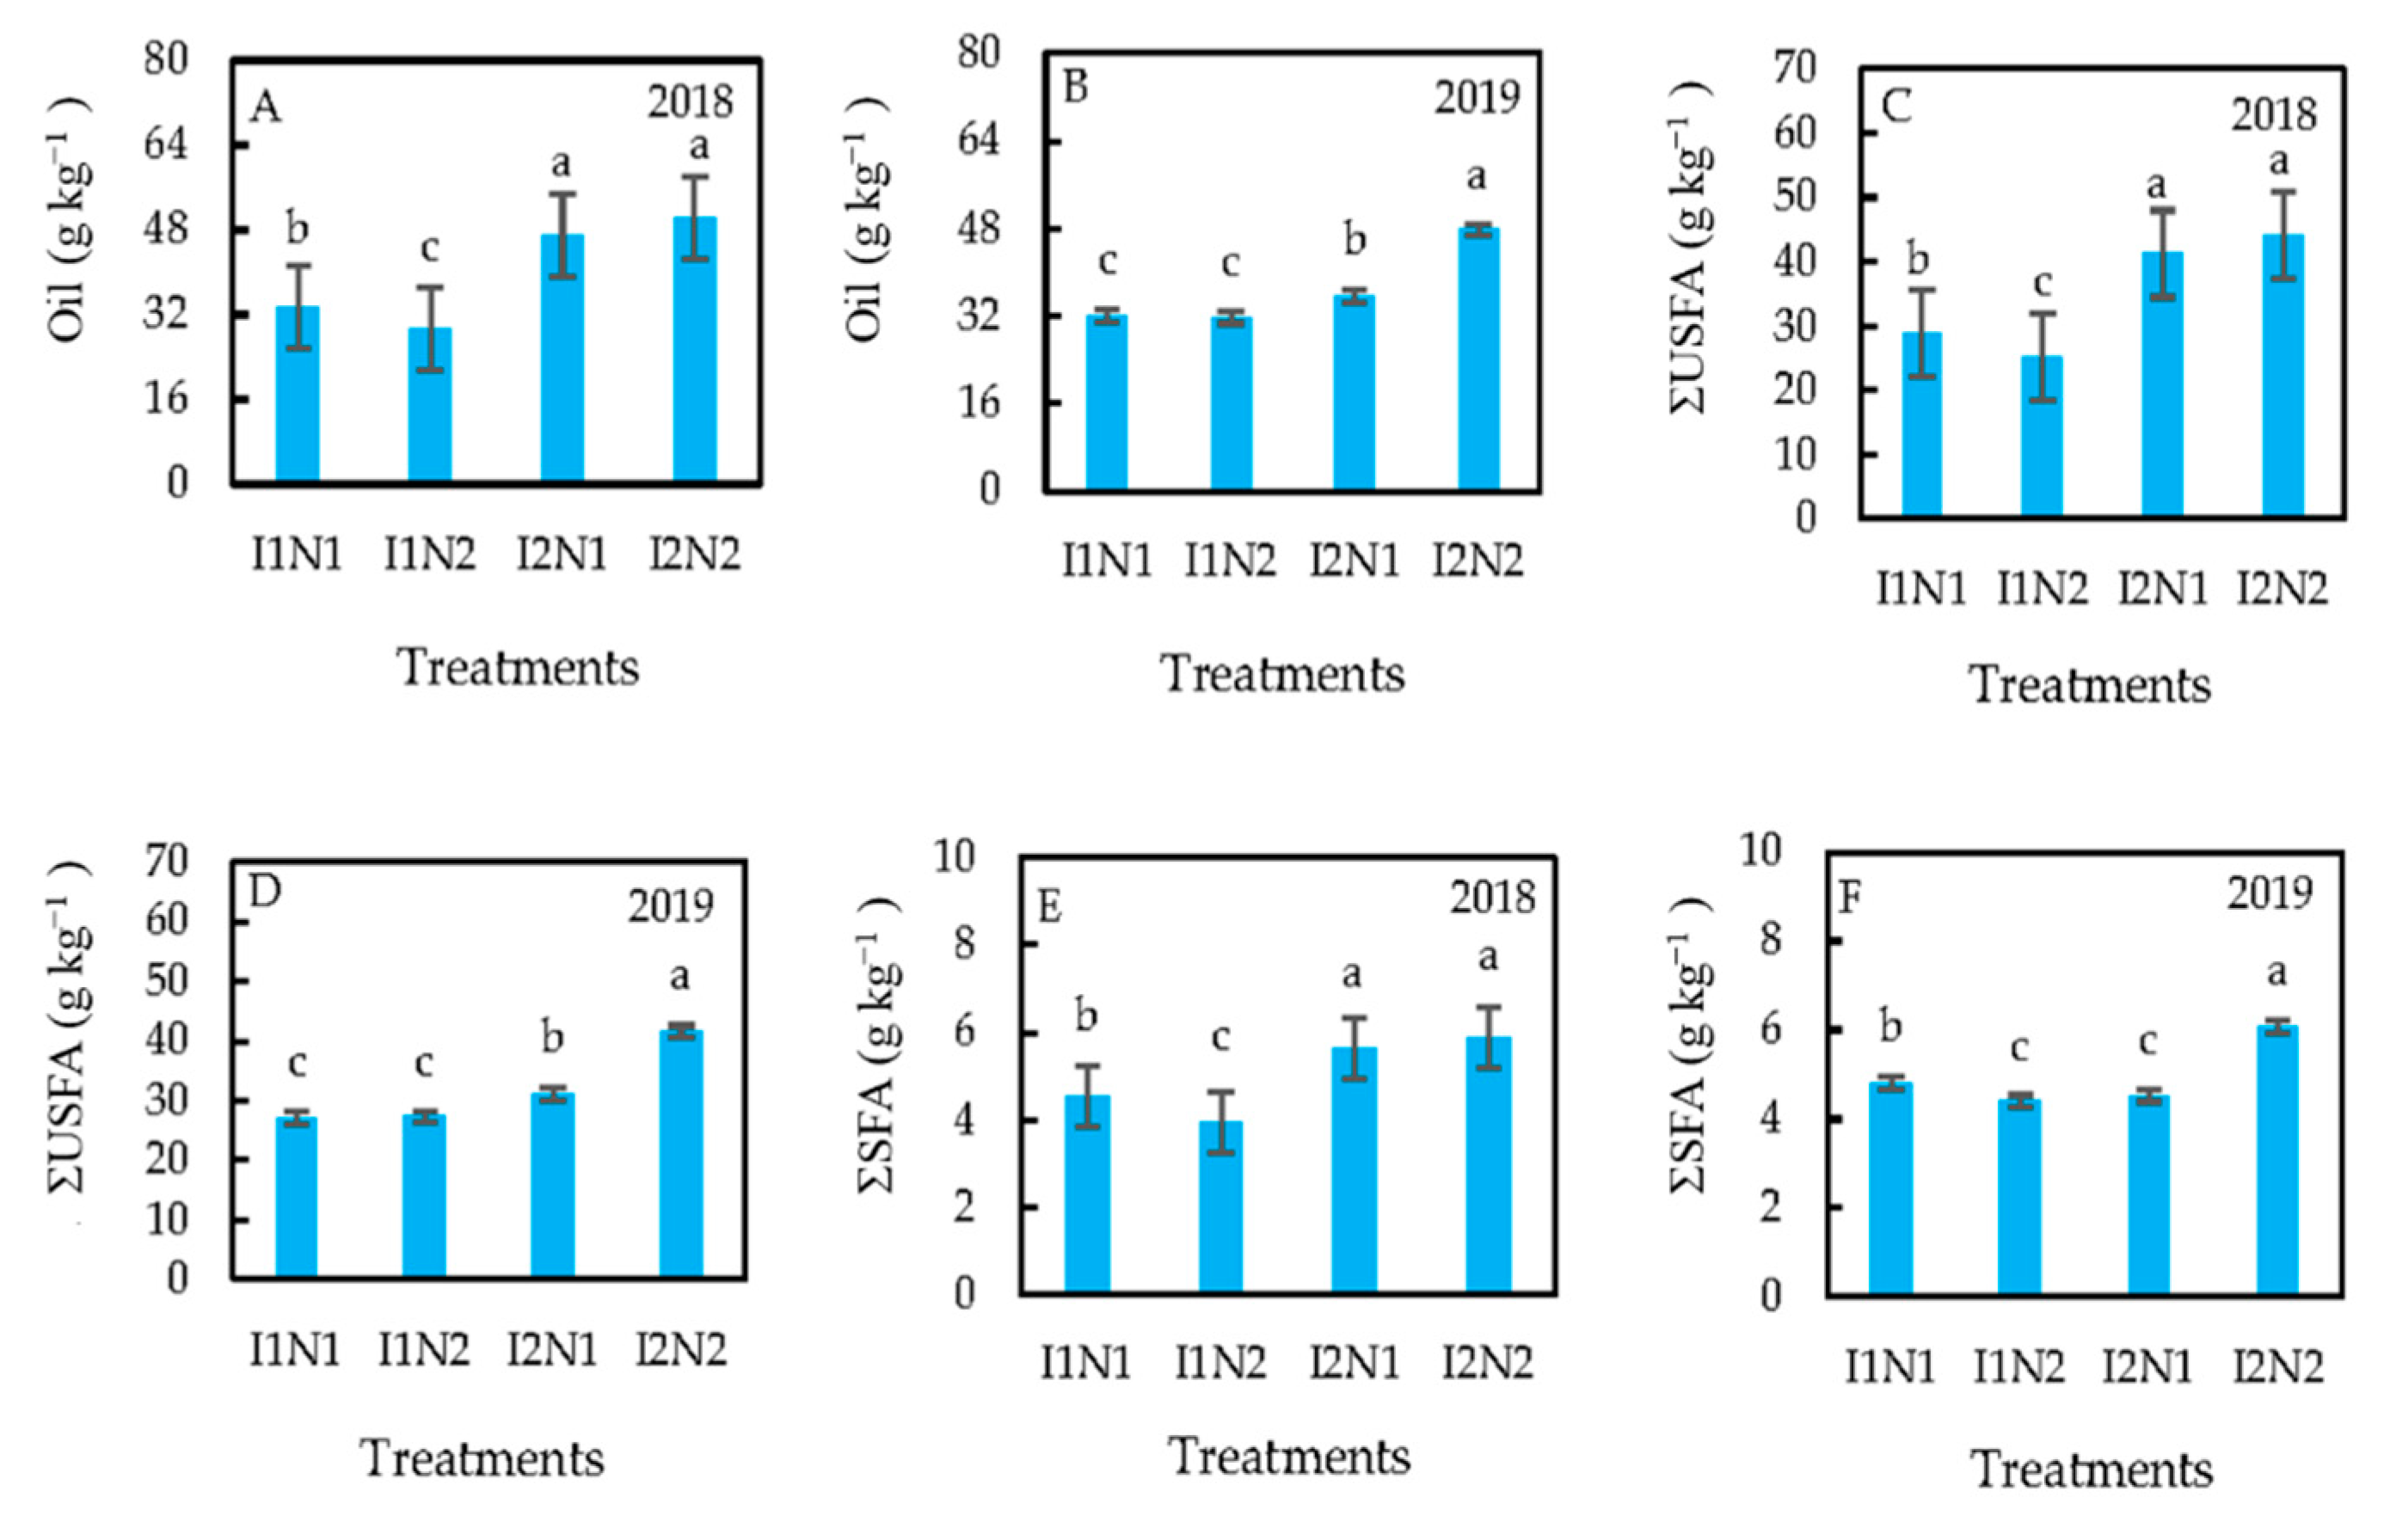
3.4. Treatment Effects on Oil Content and Composition

Planting date and cultivar did not affect oil and ΣUSFA concentration in either year. In both years, there was an interactive effect of irrigation and N rate on oil (Figure 6A,B) and ΣUSFA (Figure 6C,D). In 2018, with the high irrigation rate, there was no N effect on oil and ΣUSFA, whereas with low irrigation, the high N rate decreased oil and ΣUSFA (Figure 6A,C). In 2019, with the high irrigation rate, the high N rate increased oil and ΣUSFA, whereas with low irrigation, there was no N effect (Figure 6B,D). In both years, oil and ΣUSFA were higher in the high irrigated plots (with either N rate) than with the low irrigated ones. In 2019, ΣSFA concentration with the early planting date was higher (by 0.22 g kg−1) than with the late planting date (Table 3). In both years, there was an interactive effect of irrigation and N rate on ΣSFA (Figure 6E,F). In 2018, with the high irrigation rate, there was no N effect on ΣSFA, whereas with low irrigation, the high N rate decreased ΣSFA (Figure 6E). In 2019, with the high irrigation rate, the high N rate increased ΣSFA, whereas with low irrigation rate, the high N rate decreased ΣSFA (Figure 6F).

4. Discussion

4.1. Correlations between Variables and Treatments

The results suggest that year and irrigation were the most influential effects in this experiment. The findings are well supported by Hammac et al. [42], who reported that temperature and water changes are more effective than soil nutrient status for changing rapeseed composition. In this study, there are two main potential sources for the differences among the trend of the years: (a) daily temperature differences among years and (b) performing the experiment after three years of fallow. The grain filling period is an enzyme-dependent stage of accumulating storage materials, primarily starch and protein and is sensitive to factors affecting photosynthesis, especially temperature and soil moisture, and nutritional status [43].
Many studies point to the negative impact of elevated temperatures and water deficit on oil, starch and dry matter accumulation in cereal grain [44,45]. Examples from the literature report 76.8% of the changes in oat oil content [46] and 52% of the changes in canola oil content [47] explained by climatic variation, especially water and temperature variability among years. However, Riccardi et al. [48] found that water stress induces the expression of proteins not specifically related to this stress but rather to reactions against cell damage. This may be the reason why the protein and its composition did not show a clear response to further irrigation compared to starch and oil, according to the PCA results. Castro et al. [49] reported that slight heat stress increased protein of wheat grain by shortening the grain filling period and by increasing the rate of N remobilization to grain. This is a potential reason for the long eigenvector of protein concentration in the second year.
The great impact of irrigation amount on the starch, protein and oil content of maize grain was reported by Kresović et al. [15]. Moreover, other studies point to the large effect of water availability [50] and genotype–environment interactions [51] on compositional attributes of maize and wheat grain. On the potential effect of fallow, fallows improve soil fertility, organic matter and physical properties to supply essential nutrients needed for assimilation and changes in grain composition. In contrast, continuous cultivation may result in some elements being deficient in grain, if they are not provided through fertilization [52].

4.2. Treatment Effects on Starch Content and Composition

The results showed that the average starch concentration for KSC704 was higher than for KSC260. One potential reason for this result is genetic differences between the two cultivars [53]. There is a positive correlation between grain weight and starch content in cereals [54,55]. Considering that the 100-grain weight in KSC704, as a late maturity hybrid, is higher than KSC260 [53], a higher starch concentration is expected. The highest concentration of starch was achieved by interactive effects of higher N and irrigation rate. Starch accumulation in grains is a physiological process of transportation and conversion of photosynthetic assimilates into starch and is expected to increase under irrigation and adequate N supply [56]. Moreover, the results showed that high N application with low irrigation decreased starch concentration. One potential reason for this result is the inverse starch and protein relationship in grain with high N application [57].
In the first year, the highest value of amylopectin was achieved by the interactive effect of high irrigation and N rate. In the second year, a high N rate increased amylopectin concentration. These results are in agreement with Jiyun et al. [58] and Kaplan et al. [59], who reported that amylopectin contents of maize hybrids increased under high irrigation and N rate in a similar trend to starch. The effect of N on amylose in the present experiment was that high N application was associated with reduced grain amylose. This is in close agreement with Kaufman et al. [60], who reported that high N application reduces type A granules in sorghum grain compared to type B or C, [61], suggesting that high N application reduces amylose by decreasing type A granules.
In addition, the results of the first year suggest that amylose was higher with the high irrigation rate regardless of N rate. The results are not in agreement with Kaplan et al. [59], who reported that the amylose content of maize grain decreased with an increase in irrigation rate, and it increased with an increase in N rate. Potential reasons for the discrepancy between results are different N and irrigation rates, and climatic conditions. The second-year results suggest that planting KSC704 earlier significantly increased amylose concentration. Few studies have investigated the simultaneous effects of maturity group and planting date on amylose content of grain. However, the increase in amylose in response to earlier planting [19] and lengthening maize kernel maturation [62,63] has been suggested.

4.3. Treatment Effects on Protein Content and Composition

Higher protein content in plots with higher N rates was not surprising. These results are similar to the results obtained by Saint Pierre et al. [64], Yang et al. [65], and Cao et al. [17], who reported there is a positive correlation between N application and protein content of cereal grains. This is because N stimulates the activity of panel enzymes involved in protein biosynthesis [66]. Increasing the crude protein concentration in grain can be achieved via two scenarios: (a) increasing N utilization and (b) sustaining higher partitioning of N to grain (nitrogen harvest index-NHI) [67]. Due to the nonsignificant differences between cultivars in terms of protein, it can be concluded that NHI did not differ between cultivars.
Our findings on the significant effect of N, irrigation and their interaction on ΣNEAA and ΣEAA are in agreement with Zhang et al. [8], who reported that ΣEAA in wheat grain increased in response to high N rate and low frequency irrigation. They also reported an interactive effect of irrigation and N rate on wheat grain amino acids but did not have a consistent response during the three years of their experiment. Since N is one of the basic element of amino acids and protein compounds in grain [68], higher amino acids in N-contained treatments is expected. In the first year, ΣNEAA was lower in plots with more frequent irrigation. One potential reason for a decrease in amino acids in high irrigation conditions is due to yield dilution effects on N-containing compounds in the grain [8].
The first-year results showed that KSC260 had higher ΣNEAA and ΣEAA than KSC704. In the second year, amino acids differed between cultivars and changing planting dates. In general, the inconsistency of cultivars amino acids among years and planting dates could suggest a large impact of exogenous factors in addition to the maturity group and genetic potentials on grain quality [69], which can further be associated with the complexities of genotype–environment–management interactions. The results are in close agreement with Huang et al. [70] in rice, who found that, with earlier planting dates, early maturity cultivars enter the reproductive phase earlier than late maturity ones, potentially causing flowering to coincide with high summer temperatures and consequently reducing amino acids in early maturity cultivars. Accordingly, we infer that the absence of ΣEAA differences between maturity classes in the late planting date may be because of lower temperatures during grain filling.

4.4. Treatment Effects on Oil Content and Composition

The results demonstrated that, for any year of cultivation, oil concentrations were affected by interaction effects of irrigation and N rate. This observation gives weight to the results from Aguirrezábal et al. [71] and Kaplan et al. [22], who reported that the interaction effects of irrigation and N rate are very influential on grain oil. In any year of cultivation, grain oil was higher with the high irrigation rate, irrespective of N rate. This implies that water was more critical than N for increasing oil concentration and quality. This is because water deficiency reduces grain oil by decreasing N uptake [72] and germ growth and by reducing the enzyme activity responsible for lipid biosynthesis [73].
The results suggest that, for any year of cultivation, ΣUSFA was higher with high irrigation, regardless of N rate. Our findings for irrigation effects on fatty acids were somewhat different with Kaplan et al. [22]. These authors reported that high irrigation decreased linoleic acid, as the most abundant unsaturated fatty acids in maize grain. Higher irrigation regimes, lower air temperature and higher precipitation during grain filling are potential reasons for decreasing linoleic acid under higher irrigation rates in the study conducted by Kaplan et al. [22].
The results showed a negative impact of high N rate on ΣSFA under the low irrigation rate. This is in close agreement with the study of Ali and Ullah [74], who reported that a high N rate (225 kg ha−1) decreased palmitic acid and stearic acid in sunflower hybrids. In the second year, ΣSFA concentration was higher with earlier planting. Similar results were reported by Obeng et al. [75] in camelina cultivars. A possible reason for the difference between planting dates in the second year is a higher air temperature during the reproductive stage of maize growth. Some studies proposed that, as the average daily temperature rises during grain filling, the crop tends to produce more saturated fatty acids in sunflower [76] and oilseed crops [77]. This may be related to high-temperature impacts on lipid profiles by destabilizing enzymes effective in unsaturated fatty acid synthesis; as a result, saturated fatty acids increase in the grain [78].
There are some commonalities between trends from PCA and ANOVA results; however, one possible reason for some discrepancy between ANOVA and PCA trends is that the PCA plots only present the data in two dimensions (principle components 1 versus 2), whereas the correlation matrix values take into account all dimensions [79].

5. Conclusions

This study aimed to provide insights into understanding the relationship among quality characteristics of maize grain. Applying principal components analysis, the first two PCs accounted for 84.5% of the total variation. Year and irrigation had the greatest effect on yield and quality. Plots with high irrigation were associated with higher starch, oil and total unsaturated fatty acids (ΣUSFA), and data points from 2019, a warmer year, were associated with higher amylose, protein and amino acids. Analysis of variance results revealed more details on the effects of other factors and their interactions on maize grain components. In any year of cultivation, N application significantly increased protein and ΣNEAA values. A combination of high irrigation and N rate often increased oil and fatty acids values, whereas with the low irrigation rate, increased N had no effect. The cultivar KSC704 had a higher starch concentration, and KSC260 had a higher amino acids concentration. With earlier planting, ΣSFA was higher. The study was limited to two cultivars, and although there were clear differences between them, further studies that include additional cultivars would provide more confidence in the results. However, year-to-year variations in the effects of factors on amylose, amylopectin and amino acids suggest that the response of cultivars to the environment plays an important role in the final composition of starch and protein. The findings highlight the complicated relationship between the experimental factors and the large impacts of growing season conditions on quality attributes of maize grain.

Supplementary Materials

The following are available online at https://0-www-mdpi-com.brum.beds.ac.uk/2077-0472/11/1/11/s1, S1: P-values of maize grain starch, amylopectin, amylose, protein, total non-essential amino acids (ΣNEAA), total essential amino acids (ΣEAA), oil, total unsaturated fatty acids (ΣUFA) and total saturated fatty acids (ΣSFA) in response to treatment (irrigation, planting date, cultivar and nitrogen rate) effects in 2018 and 2019.

Author Contributions

Conceptualization, S.S., M.R.J. and D.P.; data curation, S.S., G.A.A. and I.A.; formal analysis, D.P. and M.R.J.; investigation, M.R.J.; methodology, S.S., D.P. and M.R.J.; software, D.P. and M.R.J.; writing—original draft, M.R.J.; writing—review and editing, D.P., S.S., G.A.A. and I.A. visualization, D.P. and M.R.J. All authors have read and agreed to the published version of the manuscript.

Funding

This research received no external funding.

Data Availability Statement

Data are available by contacting the authors.

Acknowledgments

The authors would like to thank the University of Tehran (UT); the Animal research institute of Iran (ASRI); the Agricultural Research, Education & Extension Organization of Iran (AREEO); the Strategic Technologies Laboratory Network of Iran; and the Department of Agricultural Research for Northern Sweden for their financial contributions. The authors also would like to thank Akbar Yaghoubfar for his valuable guidance with the chemical analyses.

Conflicts of Interest

The authors declare no conflict of interest.

References

  1. Darrah, L.L.; McMullen, M.; Zuber, M. Breeding, Genetics and Seed Corn Production. In Corn; Serna-Saldivar, S., Ed.; Elsevier: Amsterdam, The Netherlands, 2019; pp. 19–41. [Google Scholar]
  2. Rausch, K.D.; Hummel, D.; Johnson, L.A.; May, J.B. Wet Milling: The Basis for Corn Biorefineries. In Corn; Serna-Saldivar, S., Ed.; Elsevier: Amsterdam, The Netherlands, 2019; pp. 501–535. [Google Scholar]
  3. Ewu, Y.; Messing, J. Proteome balancing of the maize seed for higher nutritional value. Front. Plant Sci. 2014, 5, 240. [Google Scholar] [CrossRef] [Green Version]
  4. Moran, J.E.T. Starch: Granule, Amylose-Amylopectin, Feed Preparation, and Recovery by the Fowl’s Gastrointestinal Tract. J. Appl. Poult. Res. 2019, 28, 566–586. [Google Scholar] [CrossRef]
  5. Singh, N.; Singh, S.; Shevkani, K. Maize: Composition, Bioactive Constituents, and Unleavened Bread. In Flour and Breads and their Fortification in Health and Disease Prevention; Preedy, V., Watson, R., Patel, V., Eds.; Elsevier: Amsterdam, The Netherlands, 2019; pp. 111–121. [Google Scholar]
  6. Copeland, L.; Blazek, J.; Salman, H.; Tang, M.C. Form and functionality of starch. Food Hydrocoll. 2009, 23, 1527–1534. [Google Scholar] [CrossRef]
  7. Cai, C.; Zhao, L.; Huang, J.; Chen, Y.; Wei, C. Morphology, structure and gelatinization properties of heterogeneous starch granules from high-amylose maize. Carbohydr. Polym. 2014, 102, 606–614. [Google Scholar] [CrossRef]
  8. Zhang, P.; Ma, G.; Wang, C.; Lu, H.; Li, S.; Xie, Y.; Ma, D.; Zhu, Y.; Guo, T. Effect of irrigation and nitrogen application on grain amino acid composition and protein quality in winter wheat. PLoS ONE 2017, 12, e0178494. [Google Scholar] [CrossRef]
  9. Allen, N.K.; Baker, D.H. Quantitative Evaluation of Nonspecific Nitrogen Sources for the Growing Chick. Poult. Sci. 1974, 53, 258–264. [Google Scholar] [CrossRef]
  10. Lenis, N.P.; Van Diepen, H.T.M.; Bikker, P.; Jongbloed, A.W.; Van Der Meulen, J. Effect of the ratio between essential and nonessential amino acids in the diet on utilization of nitrogen and amino acids by growing pigs. J. Anim. Sci. 1999, 77, 1777–1787. [Google Scholar] [CrossRef] [PubMed]
  11. Peng, L.-P.; Men, S.-Q.; Liu, Z.; Tong, N.-N.; Imran, M.; Shu, Q.Y. Fatty Acid Composition, Phytochemistry, Antioxidant Activity on Seed Coat and Kernel of Paeonia ostii from Main Geographic Production Areas. Foods 2019, 9, 30. [Google Scholar] [CrossRef] [Green Version]
  12. Cook, J.P.; McMullen, M.D.; Holland, J.B.; Tian, F.; Bradbury, P.; Ross-Ibarra, J.; Buckler, E.S.; Flint-Garcia, S.A. Genetic Architecture of Maize Kernel Composition in the Nested Association Mapping and Inbred Association Panels. Plant Physiol. 2011, 158, 824–834. [Google Scholar] [CrossRef] [PubMed] [Green Version]
  13. Jensen, L. Animal Manure Fertiliser Value, Crop Utilisation and Soil Quality Impacts. Anim. Manure Recycl. 2013, 295–328. [Google Scholar] [CrossRef]
  14. Silva, R.R.; Zucareli, C.; Fonseca, I.C.D.B.; Riede, C.R.; Gazola, D. Nitrogen management, cultivars and growing environments on wheat grain quality. Rev. Bras. Eng. Agrícola Ambient. 2019, 23, 826–832. [Google Scholar] [CrossRef] [Green Version]
  15. Kresovic, B.; Gajic, B.; Tapanarova, A.; Dugalić, G. How Irrigation Water Affects the Yield and Nutritional Quality of Maize (Zea mays L.) in a Temperate Climate. Pol. J. Environ. Stud. 2018, 27, 1123–1131. [Google Scholar] [CrossRef]
  16. Struik, P.C. Effect of Temperature on Development, Dry-Matter Production, Dry-Matter Distribution and Quality of Forage Maize (Zea mays L.); Veenman & Zonen: Mariastraat, The Netherlands, 1983. [Google Scholar]
  17. Cao, X.; Sun, H.; Wang, C.; Ren, X.; Liu, H.; Zhang, Z. Effects of late-stage nitrogen fertilizer application on the starch structure and cooking quality of rice. J. Sci. Food Agric. 2018, 98, 2332–2340. [Google Scholar] [CrossRef]
  18. Asthir, B.; Jain, D.; Kaur, B.; Bains, N. Effect of nitrogen on starch and protein content in grain influence of nitrogen doses on grain starch and protein accumulation in diversified wheat genotypes. J. Environ. Biol. 2017, 38, 427–433. [Google Scholar] [CrossRef]
  19. Medic, J.; Abendroth, L.J.; Elmore, R.W.; Jane, J.-L.; Slukova, M. Effect of planting date on maize starch structure, properties, and ethanol production. Starch Stärke 2015, 68, 476–487. [Google Scholar] [CrossRef]
  20. Wang, J.; Hasegawa, T.; Li, L.; Lam, S.K.; Zhang, X.; Liu, X.; Pan, G. Changes in grain protein and amino acids composition of wheat and rice under short-term increased [CO2] and temperature of canopy air in a paddy from East China. New Phytol. 2019, 222, 726–734. [Google Scholar] [CrossRef]
  21. Dai, Z.-M.; Yin, Y.-P.; Zhang, M.; Li, W.-Y.; Yan, S.-H.; Cai, R.; Wang, Z. Distribution of Starch Granule Size in Grains of Wheat Grown Under Irrigated and Rainfed Conditions. Acta Agron. Sin. 2008, 34, 795–802. [Google Scholar] [CrossRef]
  22. Kaplan, M.; Kale, H.; Karaman, K.; Unlukara, A. Influence of different irrigation and nitrogen levels on crude oil and fatty acid composition of maize (Zea mays L.). Grasas Aceites 2017, 68, 207. [Google Scholar] [CrossRef] [Green Version]
  23. Anwar, S.; Iqbal, M.; Akram, H.M.; Niaz, M.; Rasheed, R. Influence of Drought Applied at Different Growth Stages on Kernel Yield and Quality in Maize (Zea mays L.). Commun. Soil Sci. Plant Anal. 2016, 47, 2225–2232. [Google Scholar] [CrossRef]
  24. Impa, S.; Perumal, R.; Bean, S.R.; Sunoj, V.J.; Jagadish, S.V.K. Water deficit and heat stress induced alterations in grain physico-chemical characteristics and micronutrient composition in field grown grain sorghum. J. Cereal Sci. 2019, 86, 124–131. [Google Scholar] [CrossRef]
  25. Bicego, B.; Sapkota, A.; Torrion, J.A. Differential Nitrogen and Water Impacts on Yield and Quality of Wheat Classes. Agron. J. 2019, 111, 2792–2803. [Google Scholar] [CrossRef] [Green Version]
  26. Walkley, A.; Black, I.A. An examination of the degtjareff method for determining soil organic matter, and a proposed modification of the chromic acid titration method. Soil Sci. 1934, 37, 29–38. [Google Scholar] [CrossRef]
  27. Bremner, J.M. Determination of nitrogen in soil by the Kjeldahl method. J. Agric. Sci. 1960, 55, 11–33. [Google Scholar] [CrossRef]
  28. Olsen, S.R. Estimation of Available Phosphorus in Soils by Extraction with Sodium Bicarbonate; US Department of Agriculture: Washington, DC, USA, 1954.
  29. Mehlich, A. Determination of P, Ca, Mg, K, Na, and NH4; North Carolina Soil Test Division: Raleigh, NC, USA, 1953; pp. 23–89. [Google Scholar]
  30. Saxton, K.E.; Rawls, W.J.; Romberger, J.S.; Papendick, R.I. Estimating Generalized Soil-water Characteristics from Texture. Soil Sci. Soc. Am. J. 1986, 50, 1031–1036. [Google Scholar] [CrossRef]
  31. Akbari, G.A.; Heshmati, S.; Soltani, E.; Dehaghi, M.A. Influence of Seed Priming on Seed Yield, Oil Content and Fatty Acid Composition of Safflower (Carthamus tinctorius L.) Grown Under Water Deficit. Int. J. Plant Prod. 2019, 245–258. [Google Scholar] [CrossRef]
  32. Estakhr, A.; Heidari, B.; Ahmadi, Z. Evaluation of kernel yield and agronomic traits of European maize hybrids in the temperate region of Iran. Arch. Agron. Soil Sci. 2015, 61, 475–491. [Google Scholar] [CrossRef]
  33. Jahahngirlou, R.M. Investigation of the Morphophysiological Aspects of Yield Formation in Maize (Zea Mays L.) Cultivars and the Agro-Ecological Assessment of Their Performance in Khouzestan and Fars Provinces. Master’s Thesis, Shahid Beheshti University, Tehran, Iran, 2015. [Google Scholar]
  34. Soufizadeh, S. GDD Calculator Program; Shahid Beheshti University: Tehran, Iran, 2012. [Google Scholar]
  35. Cutforth, H.; Shaykewich, C. A temperature response function for corn development. Agric. For. Meteorol. 1990, 50, 159–171. [Google Scholar] [CrossRef]
  36. FAOSTAT. Statistical Databases and Data-Sets of the Food and Agriculture Organization of the United Nations. Available online: http://www.fao.org (accessed on 5 November 2020).
  37. Hanway, J. How a corn plant develops. Iowa State Univ. Coop. Ext. Serv. Spec. Rep. 1966, 48, 1–17. [Google Scholar]
  38. Megazyme, Amylose/Amylopectin. Assay Procedure for Measurement of Amylose and Amylopectin of Starch. Available online: http://www.megazyme.com (accessed on 5 November 2020).
  39. AOAC. Official Methods of Analysis of AOAC International, 20th ed.; AOAC International: Rockville, MD, USA, 2016; Volume 2, pp. 20–25. [Google Scholar]
  40. Minitab, L.L.C. SAS, v.19; Minitab. Inc.: State College, PA, USA, 2006. [Google Scholar]
  41. SAS Institute. The SAS System. v.9.4; SAS Institute: Cary, NC, USA, 2003. [Google Scholar]
  42. Hammac, W.A.; Maaz, T.M.; Koenig, R.T.; Burke, I.C.; Pan, W.L. Water and Temperature Stresses Impact Canola (Brassica napus L.) Fatty Acid, Protein, and Yield over Nitrogen and Sulfur. J. Agric. Food Chem. 2017, 65, 10429–10438. [Google Scholar] [CrossRef]
  43. Singletary, G.; Banisadr, R.; Keeling, P. Heat Stress During Grain Filling in Maize: Effects on Carbohydrate Storage and Metabolism. Funct. Plant Biol. 1994, 21, 829–841. [Google Scholar] [CrossRef]
  44. Pirasteh-Anosheh, H.; Ranjbar, G.; Pakniyat, H.; Emam, Y.; Azooz, M.; Ahmad, P. Plant-Environment Interaction: Responses and Approaches to Mitigate Stress; Wiley Blackwell: Hoboken, NJ, USA, 2016. [Google Scholar]
  45. Sehgal, A.; Sita, K.; Siddique, K.H.M.; Kumar, R.; Bhogireddy, S.; Varshney, R.K.; Hanumantharao, B.; Nair, R.M.; Prasad, P.V.V.; Nayyar, H. Drought or/and Heat-Stress Effects on Seed Filling in Food Crops: Impacts on Functional Biochemistry, Seed Yields, and Nutritional Quality. Front. Plant Sci. 2018, 9, 1705. [Google Scholar] [CrossRef] [PubMed] [Green Version]
  46. Saastamoinen, M.; Kumpulainen, J.; Nummela, S.; Häkkinen, U. Effect of Temperature on Oil Content and Fatty Acid Composition of Oat Grains. Acta Agric. Scand. 1990, 40, 349–356. [Google Scholar] [CrossRef]
  47. Elferjani, R.; Soolanayakanahally, R.Y. Canola Responses to Drought, Heat, and Combined Stress: Shared and Specific Effects on Carbon Assimilation, Seed Yield, and Oil Composition. Front. Plant Sci. 2018, 9, 1224. [Google Scholar] [CrossRef] [PubMed] [Green Version]
  48. Riccardi, F. Protein Changes in Response to Progressive Water Deficit in Maize. Quantitative Variation and Polypeptide Identification. Plant Physiol. 1998, 117, 1253–1263. [Google Scholar] [CrossRef] [PubMed] [Green Version]
  49. Castro, M.; Peterson, C.J.; Rizza, M.D.; Dellavalle, P.D.; Vázquez, D.; Ibanez, V.; Ross, A. Influence of Heat Stress on Wheat Grain Characteristics and Protein Molecular Weight Distribution. In Molecular Breeding of Forage and Turf; Hopkins, A., Wang, Z.Y., Mian, R., Sledge, M., Barker, R.E., Eds.; Springer: Berlin/Heidelberg, Germany, 2007; Volume 12, pp. 365–371. [Google Scholar]
  50. Butts-Wilmsmeyer, C.J.; Seebauer, J.R.; Singleton, L.; Below, F.E. Weather during Key Growth Stages Explains Grain Quality and Yield of Maize. Agronomy 2019, 9, 16. [Google Scholar] [CrossRef] [Green Version]
  51. Kaya, Y.; Ii, I.; Akcura, M. Effects of genotype and environment on grain yield and quality traits in bread wheat (T. aestivum L.). Food Sci. Technol. 2014, 34, 386–393. [Google Scholar] [CrossRef] [Green Version]
  52. Nielsen, D.C.; Calderón, F.J.; Hatfield, J.L.; Sauer, T.J. Fallow Effects on Soil. In Soil Management: Building a Stable Base for Agriculture; Hatfield, J.L., Saue, T.J., Eds.; Soil Science Society of America: Madison, WI, USA, 2015; pp. 287–300. [Google Scholar]
  53. Rahimi, J.M.; Kambouzia, J.; Zand, E.; Rezayi, M. Investigation of grain yield and some related traits in different maize cultivars (Zea mays L.). J. Plant Physiol. 2019, 10, 150–166. [Google Scholar]
  54. Hurkman, W.J.; McCue, K.F.; Altenbach, S.B.; Korn, A.; Tanaka, C.K.; Kothari, K.M.; Johnson, E.L.; Bechtel, D.B.; Wilson, J.D.; Anderson, O.D.; et al. Effect of temperature on expression of genes encoding enzymes for starch biosynthesis in developing wheat endosperm. Plant Sci. 2003, 164, 873–881. [Google Scholar] [CrossRef]
  55. Chen, G.; Zhen, S.; Liu, Y.; Yan, X.; Zhang, M.; Yan, Y. In vivo phosphoproteome characterization reveals key starch granule-binding phosphoproteins involved in wheat water-deficit response. BMC Plant Biol. 2017, 17, 168. [Google Scholar] [CrossRef] [Green Version]
  56. Yao, S.; Wu, D.; Yang, W.; Yang, X.; Huang, L. Sprinkler irrigation enhancing accumulation and quality properties of starch in wheat grain. Trans. Chin. Soc. Agric. Eng. 2015, 31, 97–102. [Google Scholar]
  57. Uribelarrea, M.; Below, F.E.; Moose, S.P. Grain Composition and Productivity of Maize Hybrids Derived from the Illinois Protein Strains in Response to Variable Nitrogen Supply. Crop. Sci. 2004, 44, 1593–1600. [Google Scholar] [CrossRef]
  58. Jiyun, J.; Ping, H.; Hailong, L.; Wenjuan, L.; Shaowen, H.; Xiufang, W.; Lichun, W.; Jiagui, X.; Guogang, Z. Comparison of nitrogen absorption, yield and quality between high-starch and common corn as affected by nitrogen application. J. Plant Nutr. Soil Sci. 2004, 10, 568–573. [Google Scholar]
  59. Kaplan, M.; Karaman, K.; Kardes, Y.M.; Kale, H. Phytic acid content and starch properties of maize (Zea mays L.): Effects of irrigation process and nitrogen fertilizer. Food Chem. 2019, 283, 375–380. [Google Scholar] [CrossRef]
  60. Kaufman, R.C.; Wilson, J.; Bean, S.R.; Presley, D.R.; Blanco-Canqui, H.; Mikha, M. Effect of Nitrogen Fertilization and Cover Cropping Systems on Sorghum Grain Characteristics. J. Agric. Food Chem. 2013, 61, 5715–5719. [Google Scholar] [CrossRef]
  61. Zhu, J.; Zhang, S.; Zhang, B.; Qiao, D.; Pu, H.; Liu, S.; Li, L. Structural features and thermal property of propionylated starches with different amylose/amylopectin ratio. Int. J. Biol. Macromol. 2017, 97, 123–130. [Google Scholar] [CrossRef]
  62. Jane, J.-L. Current Understanding on Starch Granule Structures. J. Appl. Glycosci. 2006, 53, 205–213. [Google Scholar] [CrossRef] [Green Version]
  63. Li, L.; Blanco, M.; Jane, J.-L. Physicochemical properties of endosperm and pericarp starches during maize development. Carbohydr. Polym. 2007, 67, 630–639. [Google Scholar] [CrossRef]
  64. Pierre, C.S.; Peterson, C.J.; Ross, A.; Ohm, J.-B.; Verhoeven, M.C.; Larson, M.; Hoefer, B. White Wheat Grain Quality Changes with Genotype, Nitrogen Fertilization, and Water Stress. Agron. J. 2008, 100, 414–420. [Google Scholar] [CrossRef]
  65. Yang, Y.; Zhang, M.; Zheng, L.; Cheng, D.-D.; Liu, M.; Geng, Y.-Q. Controlled Release Urea Improved Nitrogen Use Efficiency, Yield, and Quality of Wheat. Agron. J. 2011, 103, 479–485. [Google Scholar] [CrossRef]
  66. Gous, P.W.; Warren, F.J.; Mo, O.W.; Gilbert, R.G.; Fox, G.P. The effects of variable nitrogen application on barley starch structure under drought stress. J. Inst. Brew. 2015, 121, 502–509. [Google Scholar] [CrossRef] [Green Version]
  67. Zhang, L.; Liang, Z.-Y.; He, X.-M.; Meng, Q.-F.; Hu, Y.; Schmidhalter, U.; Zhang, W.; Zou, C.-Q.; Chen, X. Improving grain yield and protein concentration of maize (Zea mays L.) simultaneously by appropriate hybrid selection and nitrogen management. Field Crop. Res. 2020, 249, 107754. [Google Scholar] [CrossRef]
  68. Zhong, Y.; Xu, D.; Hebelstrup, K.H.; Yang, D.-L.; Cai, J.; Wang, X.; Zhou, Q.; Cao, W.; Dai, T.; Jiang, D. Nitrogen topdressing timing modifies free amino acids profiles and storage protein gene expression in wheat grain. BMC Plant Biol. 2018, 18, 353. [Google Scholar] [CrossRef]
  69. Harrigan, G.G.; Stork, L.G.; Riordan, S.G.; Reynolds, T.L.; Taylor, J.P.; Masucci, J.D.; Cao, Y.; LeDeaux, J.R.; Pandravada, A.; Glenn, K.C. Impact of environmental and genetic factors on expression of maize gene classes: Relevance to grain composition. J. Food Compos. Anal. 2009, 22, 158–164. [Google Scholar] [CrossRef]
  70. Huang, M.; Zhang, H.; Zhao, C.; Chen, G.; Zou, Y. Amino acid content in rice grains is affected by high temperature during the early grain-filling period. Sci. Rep. 2019, 9, 2700. [Google Scholar] [CrossRef] [PubMed]
  71. Aguirrezabal, L.A.N.; Martre, P.; Pereyrairujo, G.; Echarte, M.M.; Izquierdo, N.G. Improving grain quality: Ecophysiological and modeling tools to develop management and breeding strategies. In Crop Physiology; Sadras, V.O., Calderini, D.F., Eds.; Academic Press: Cambridge, MA, USA, 2015; pp. 423–465. [Google Scholar]
  72. Geesing, D.; Diacono, M.; Schmidhalter, U. Site-specific effects of variable water supply and nitrogen fertilisation on winter wheat. J. Plant Nutr. Soil Sci. 2014, 177, 509–523. [Google Scholar] [CrossRef]
  73. Singer, S.D.; Zou, J.; Weselake, R.J. Abiotic factors influence plant storage lipid accumulation and composition. Plant Sci. 2016, 243, 1–9. [Google Scholar] [CrossRef] [PubMed]
  74. Alves, L.S.; Stark, E.M.L.M.; Zonta, E.; Fernandes, M.S.; Dos Santos, A.M.; De Souza, S.R. Different nitrogen and boron levels influence the grain production and oil content of a sunflower cultivar. Acta Sci. Agron. 2017, 39, 59. [Google Scholar] [CrossRef] [Green Version]
  75. Obeng, E.; Obour, A.K.; Nelson, N.O.; Moreno, J.A.; Ciampitti, I.A.; Wang, D.; Durrett, T.P. Seed yield and oil quality as affected by Camelina cultivar and planting date. J. Crop. Improv. 2019, 33, 202–222. [Google Scholar] [CrossRef]
  76. Van Der Merwe, R.; Labuschagne, M.; Herselman, L.; Hugo, A. Effect of heat stress on seed yield components and oil composition in high- and mid-oleic sunflower hybrids. S. Afr. J. Plant Soil 2015, 32, 121–128. [Google Scholar] [CrossRef]
  77. Schulte, L.R.; Ballard, T.C.; Samarakoon, T.B.; Yao, L.; Vadlani, P.V.; Staggenborg, S.; Rezac, M. Increased growing temperature reduces content of polyunsaturated fatty acids in four oilseed crops. Ind. Crop. Prod. 2013, 51, 212–219. [Google Scholar] [CrossRef] [Green Version]
  78. Martínez-Rivas, J.M.; Sánchez-García, A.; Sicardo, M.D.; García-Díaz, M.T.; Mancha, M. Oxygen-independent temperature regulation of the microsomal oleate desaturase (FAD2) activity in developing sunflower (Helianthus annuus) seeds. Physiol. Plant. 2003, 117, 179–185. [Google Scholar] [CrossRef]
  79. Parsons, D.; Cherney, J.; Gauch, H.G. Alfalfa Fiber Estimation in Mixed Stands and Its Relationship to Plant Morphology. Crop. Sci. 2006, 46, 2446–2452. [Google Scholar] [CrossRef]
Figure 1. The geographical location of Pakdasht city (35.4669° N, 51.6861° E), Tehran province, Iran.
Agriculture 11 00011 g001
Figure 2. Variability of average daily temperatures (°C) during the reproductive stage of maize for conventional and late planting dates in 2018 and 2019: the upper and lower hinges of the box indicate the 75th percentile and 25th percentile of the data set, respectively. The line in the box indicates the median value of the data, and the upper and lower whiskers represent the maximum and minimum of the data, respectively. PD1, planting date 21 June; PD2, planting date 22 July; C1, KSC704; C2, KSC260.
Agriculture 11 00011 g002
Figure 3. Plots of principal component 1 versus principal component 2 based on measured maize grain quality characteristics: the loading plot (A) shows the eigenvector of each characteristic. The score plot (B) shows the means, grouped by year and irrigation treatment. Each marker represents the mean of replicates in the field. Abbreviations; I1, Irrigation at 12-day intervals; I2, Irrigation at 6 day-intervals; ΣEAA, total essential amino acids; ΣNEAA, total non-essential amino acids; ΣSFA, total saturated fatty acids; ΣUSFA, total unsaturated fatty acids.
Agriculture 11 00011 g003
Figure 4. Least square means of maize grain starch (A), amylopectin (B) and amylose (C) in response to interaction effects of irrigation and nitrogen, and least square means of maize grain amylose in response to interaction effects of irrigation and cultivar (D); nitrogen, planting date and cultivar (E); nitrogen, cultivar and irrigation (F); planting date and cultivar (G); and planting date and nitrogen (H). I1, irrigation at 12-day intervals; I2, irrigation at 6 day-intervals; PD1, planting date 21 June; PD2, planting date 22 July; C1, KSC704; C2, KSC260; N1, 0; N2, 184 kg N ha−1. Least square means labelled with the same letter do not differ significantly at p < 0.05 based on Tukey’s test. Vertical bars represent the 95% confidence interval.
Agriculture 11 00011 g004
Figure 5. Least square means of maize grain for total nonessential amino acids (ΣNEAA) in response to interaction effects of planting date and cultivar (A) and least square means of maize grain total essential amino acids (ΣEAA) in response to interaction effects of irrigation and nitrogen (B), planting date and nitrogen (C), and planting date and cultivar (D). I1, irrigation at 12-day intervals; I2, irrigation at 6 day-intervals; PD1, planting date 21 June; PD2, planting date 22 July; C1, KSC704; C2, KSC260; N1, 0; N2, 184 kg N ha−1. Least square means labelled with the same letter do not differ significantly at p < 0.05 based on Tukey’s test. Vertical bars represent the 95% confidence interval.
Agriculture 11 00011 g005
Figure 6. Least square means of maize grain oil (A,B), total unsaturated fatty acids (ΣUSFA) (C,D) and total saturated fatty acids (ΣSFA) (E,F) in response to interaction effects of irrigation and nitrogen. I1, irrigation at 12-day intervals; I2, irrigation at 6 day-intervals; PD1, planting date 21 June; PD2, planting date 22 July; C1, KSC704; C2, KSC260; N1, 0; N2, 184 kg N ha−1. Least square means labelled with the same letter do not differ significantly at p < 0.05 based on Tukey’s test. Vertical bars represent the 95% confidence interval.
Agriculture 11 00011 g006
Table 1. Average minimum and maximum daily air temperatures and monthly total precipitation during the summer maize growing season from June through November of 2018 and 2019 in Pakdasht city, Iran.
MonthTemperature (°C)Precipitation (mm)
MinimumMaximum
201820192018201920182019
June20.320.838.739.10.10.0
July24.424.242.441.90.00.0
August22.521.040.139.30.00.0
September17.816.935.135.30.00.0
October12.312.226.626.90.30.8
November6.74.416.515.60.90.6
Total17.316.633.233.00.240.23
Table 2. Planting dates, harvesting dates, maturity period and growing degree days (GDDs) of cultivars in 2018 and 2019.
YearMaize HybridsPlanting DateHarvesting DateMaturity Period (Days)GDDs (°C)
2018KSC70420 June7 November1402424
21 July26 November1381839
KSC26020 June18 October1202311
21 July11 November1181796
2019KSC70420 June2 November1352370
21 July28 November1301855
KSC26020 June12 October1202220
21 July14 November1161704
The temperature thresholds used to calculate GDDs were 10 °C (base temperature), 34 °C (optimum) and 40 °C (maximum) (Cutforth and Shaykewich, 1990).
Table 3. Least square means, significances and standard errors of maize grain starch, amylopectin, amylose, protein, total nonessential amino acids (ΣNEAA), total essential amino acids (ΣEAA), oil, total unsaturated fatty acids (ΣUFA) and total saturated fatty acids (ΣSFA) in response to treatment main effects (irrigation, planting date, cultivar and nitrogen rate) in 2018 and 2019.
TreatmentStarchAmylopectinAmyloseProteinΣNEAAΣEAAOilΣUSFAΣSFA
g kg−1
201820192018201920182019201820192018201920182019201820192018201920182019
I1668.10682.50549.17494.23100.48187.36105.00121.4042.2061.9031.8043.3031.3031.9026.9827.204.244.60
I2750.80684.00637.77509.22128.26173.9997.50116.1039.0058.5031.5041.6048.7041.7042.7136.335.755.30
p-value0.0560.9370.0430.5650.0350.1330.2060.3370.0420.1370.0120.3340.0680.0220.0650.0220.0830.005
SEM7.3115.516.0018.441.502.832.523.112.147.360.059.421.863.371.623.200.190.55
PD1705.90685.60594.67496.33111.31187.59101.50115.1040.4060.7031.4043.0043.0037.2037.4331.955.435.06
PD2713.00680.90592.26507.12117.43173.77101.00122.5040.8059.7031.9041.8037.0036.5032.2631.574.564.84
p-value0.5090.8140.7570.6630.1540.1290.8980.2540.3090.4000.0070.4210.1910.2910.1940.4470.1430.016
SEM7.3115.516.0018.441.502.832.523.112.147.360.059.421.863.371.623.200.190.55
C1710.40688.50593.72499.36112.94187.5299.20117.5040.0060.3031.2043.1040.0036.4034.7831.385.024.89
C2708.50677.90593.22504.09115.80173.84103.40120.0041.2060.2032.1041.8040.0037.2034.9132.154.975.02
p-value0.6280.0110.8950.2510.015<0.0010.0560.212<0.0010.866<0.0010.0120.9550.1880.8810.1810.6970.194
SEM3.893.903.7540.411.091.892.101.881.512.240.354.961.026.380.885.640.130.95
N1711.50682.90589.59493.17119.25190.1898.10111.8038.9059.1031.2041.7040.2033.9034.9929.105.084.67
N2707.50683.50597.35510.28109.50171.17104.40125.7042.3061.4032.0043.1039.8039.8034.7034.434.915.24
p-value0.3160.8780.049<0.001<0.001<0.0010.006<0.001<0.001<0.001<0.0010.0090.669<0.0010.743<0.0010.214<0.001
SEM3.893.903.7540.411.091.892.101.881.512.240.354.961.026.380.885.640.130.95
I1, irrigation at 12-day intervals; I2, irrigation at 6 day-intervals; PD1, planting date 21 June; PD2, planting date 22 July; C1, cultivar KSC704; C2, cultivar KSC260; N1, zero-nitrogen; N2, 184 kg ha−1 nitrogen.
Publisher’s Note: MDPI stays neutral with regard to jurisdictional claims in published maps and institutional affiliations.

