Article

Comparison of Soil Biology Quality in Organically and Conventionally Managed Agro-Ecosystems Using Microarthropods

1
Department of Life, Health and Environmental Sciences, University of L’Aquila, Via Vetoio, 67100 L’Aquila, Italy
2
Department of Biology, University of Florence, Via Madonna del Piano 6, 50019 Firenze, Italy
3
Regione Abruzzo, Ufficio Attività Culturali di Sulmona e Castel di Sangro—Centro Regionale Beni Culturali, Via Passolanciano 75, 65124 Pescara, Italy
*
Author to whom correspondence should be addressed.
Submission received: 10 September 2021 / Revised: 9 October 2021 / Accepted: 14 October 2021 / Published: 19 October 2021
(This article belongs to the Special Issue Soil Biodiversity in Sustainable Agriculture)

Abstract

:
Since management practices profoundly influence soil characteristics, the adoption of sustainable agro-ecological practices is essential for soil health conservation. We compared soil health in organic and conventional fields in the Abruzzi region (central Italy) by using (1) the soil biology quality (QBS) index (which expresses the level of specialisation in soil environment shown by microarthropods) and (2) microarthropod diversity expressed by Hill numbers. QBS values were calculated using both the original formulation based on only presence/absence data and a new abundance-based version. We found that organic management improves soil biology quality, which encourages the use of organic farming to maintain soil health. Including arthropod abundance in QBS calculation does not change the main outcomes, which supports the use of its original, speedier formulation. We also found that agricultural fields included in protected areas had greater soil health, which shows the importance of the matrix in determining agricultural soil health and highlights the importance of land protection in preserving biodiversity even in managed soils. Finally, we found that soil biology quality and microarthropod community structure are distinctly influenced by certain physical and chemical characteristics of the soil, which supports the use of microarthropods as biological indicators.

1. Introduction

Soils are a fundamental component of terrestrial ecosystems, for which they play many essential services [1,2,3,4]. Transformation of natural ecosystems into arable land leads to the loss of biodiversity associated with natural habitats and profoundly alters soil characteristics [5,6], with detrimental impacts on surrounding habitats (for instance, through soil erosion or pollution run-off) [7].
In agro-ecosystems, management practices influence many soil quality characteristics, such as biodiversity, stability, level of internal nutrients, and resilience to disturbance or stress [8]. Thus, the adoption of sustainable agro-ecological practices is essential for the conservation of soil health [9,10].
Soil biotas are of paramount importance for soil quality and vitality [11,12,13] and play several supporting and regulating ecosystem services [14,15]. Thus, preventing the decline in soil animal communities in agro-ecosystems is a key ecological strategy to effectively combine productive and sustainability goals [16]. In particular, comparative studies on biodiversity in conventional and organic fields indicated that organic farming exerts a beneficial effect on the biodiversity of agro-ecosystems [17,18,19,20,21,22] and, in particular, on their soil quality and biodiversity [23,24,25,26].
Within the soil biota, edaphic animals, i.e., those species that live below the soil surface, play a pivotal role in maintaining many soil characteristics (such as porosity, aeration, infiltration, and distribution of organic matter in soil horizons) and soil-related ecosystem services (such as plant nutrition and detoxification) through bioturbation, nutrient cycling, and organic matter decomposition and mineralisation [27,28,29,30,31,32,33,34]. In particular, using direct and indirect mechanisms, edaphic animals can release soil nitrogen and carbon, thereby modifying their availability [35]. Soil animals also provide organic matter to soil microorganisms, which, in turn, influence nutrients’ availability for plant absorption and pest suppression [36,37]. Due to these multiple functions in maintaining soil characteristics, and especially in regulating soil nutrients essential for plant life, soil animal communities are frequently used to evaluate soil quality [16,38,39,40,41,42,43,44,45,46,47,48,49,50,51,52].
Arthropods are the most abundant and diversified group among soil faunas [53], and in agro-ecosystems they provide essential ecological services, including the decomposition of crop residues to form humus and the recycling of mineral nutrients for successive crops [54,55,56]. Owing to their ability to respond to variations in environmental conditions, soil properties, and changes in land management, soil arthropods are gaining increasing interest as effective indicators of soil biology quality [27,31,40,57,58,59,60], especially in agro-ecosystems or polluted or degraded sites [6,38,48,61,62,63,64,65,66,67,68,69,70,71,72,73,74,75,76,77,78,79].
The QBS-ar index (also known as SBQ-ar; soil biology quality based on arthropods) [40] has been introduced to expresses the biological quality of soil according to the degree of specialisation of the edaphic arthropods, because the most specialised forms are particularly sensitive to soil disturbance and might not survive to alterations due to, for example, agricultural cultivation and trampling [40,80,81,82,83].
More generally, since the taxonomic diversity and species abundance of the edaphic arthropods are highly dependent on species’ tolerance limits to environmental conditions [84,85], the study of microarthropod community structure may add significant information on the soil status [6,16,26,41,78,79,86,87,88,89,90].
In general, soil arthropods are highly sensitive to the effects of agricultural management practices [91], and there are indications that organically managed fields contain a greater abundance and diversity of arthropods than conventionally managed fields [22,92,93,94]. However, relatively few works have explicitly evaluated the influence of management strategies on soil biology quality as expressed by the edaphic arthropod communities [11,26,48,72,76,95,96].
The aim of this study was to determine the effect of management practices (organic vs. conventional) on edaphic arthropods as indicators of soil biology quality. We used the QBS-ar index in its standard formulation, as well as a new formulation, proposed here for the first time, which takes into account the abundance of the various arthropod groups, and which we called QBS-ab.
We also considered the effect of management practices on the diversity of edaphic arthropods using Hill numbers, a mathematically unified family of indices that (1) combine information on species richness, species rarity, and species dominance and (2) are all expressed in the same units (i.e., the effective number of species), being therefore comparable between each other [97,98]. In addition to these indices, we also investigated the influence of management practices on total arthropod abundance (total numbers of individuals). In particular, we hypothesised that organic management may positively affect the abundance, diversity, and quality indices. Additionally, taking advantage of the presence of protected areas in the study area, we tested the influence of land protection on the soil health of agricultural fields.
Despite the increasing interest in the use of QBS-ar [99], virtually no study has attempted to investigate the influence of specific soil characteristics on the values of this index. In this paper, we tested the influence of soil physical and chemical characteristics on QBS-ar, QBS-ab, Hill numbers, and total abundance.

2. Materials and Methods

2.1. Study Area and Soil Characterisation

The study was conducted in the Abruzzi Region, central Italy. We used 12 agricultural fields (sites) randomly distributed through six major production areas in the region (Altopiano delle Cinque Miglia, Valle Peligna, Valle Subequana, Val Vomano, Montagna Aquilana, Fucino).
Then, each field was classified according to the form of management as organic (8 fields) or conventional (4 fields). Organic fields were cultivated without herbicide and synthetic pesticides. Except for a site cultivated with field beans and a site cultivated with carrots, ploughing, harrowing, and manure were absent in organically managed fields. Milling was also absent in most organically managed fields, and, when present, it was less than 20 cm. Conventionally managed fields were treated with fungicides, insecticides, and herbicides and were subjected to ploughing and harrowing (30–40 cm) and/or milling (20–25 cm). Fertilisation with agrochemicals was carried out in conventional fields, while organic fields were not fertilised, except for the two abovementioned fields fertilised with animal manure.
Abruzzi is an Italian region with the largest proportion of protected land (about a third of its territory is set aside as protected areas), with many agricultural areas included in protected areas. Thus, for each site, we also recorded if it was within (4 fields) or outside (8 fields) a protected area, in addition to the type of crop present during sampling (grain: 4 fields, carrots: 2 fields, fallow: 2 fields, field bean; 1 field, barley: 1 field, melons: 1 field, and soya: 1 field).
From each site, three soil samples were collected for routine physical and chemical analyses. Soil physical–chemical analyses were performed on soil samples dried at room temperature, crushed, and sieved to exclude particles >2 mm. Soil fractions smaller than 2 mm were analysed for texture; pH and electrical conductivity (EC); cation exchange capacity; calcium; total carbon (TC); total organic carbon (TOC) and inorganic carbon (IC); organic matter; total, ammoniacal, and nitric nitrogen; humic and fulvic acids; assimilable phosphorus; metals (Mg, K, and Na). Analyses were performed by Laboratori ISPA—Istituto Sperimentale Problematiche Ambientali Panetta S.r.l., Atina (Italy), mostly following Italian standards [100]. Soil texture was characterised using a volumetric cylinder and diluting soil samples with distilled water (1:4 ratio). The samples were mixed two times (after dilution and after 24 h) and left to stand 48 h until the three fractions (clay Ø < 0.002 mm; silt Ø = 0.002–0.05 mm; sand Ø = 0.05–2 mm) were clearly distinguishable and the volumes on the volumetric cylinder calculated. To measure soil pH and EC, soil samples were mixed with distilled water (1:5 ratio, 1 h at room temperature), and a HI2550 multiparameter pH metre (Hanna Instruments, Slovenia) was used. Cation exchange capacity was obtained by soil treatment with a pH-7 ammonium acetate solution (1:2 ratio, 1 h at room temperature and overnight standing) and inductively coupled plasma (ICP) determination. Calcium was determined by hydrochloric acid reaction (1:2.5 ratio until complete reaction at room temperature) and calcimeter estimation. The parameters TC, TOC, and IC (TC-TOC) were determined by high-temperature digestion of samples in an air/O2 stream at 850 °C through a VARIO TOC cube analyser (Elementar Italia Srl, Lomazzo, Italy). With this method, the fully bonded carbon was converted into CO2 and was quantitatively determined by a non-dispersive infrared sensor detector. Considering the average carbon content in soil organic matter to be 58%, organic matter (g/kg) was determined by multiplying the organic carbon values by 1.724. Total, ammoniacal, and nitric nitrogen contents were measured by potassium chloride reaction (1:10 ratio, 1 h at 20 °C) and ion chromatography. Humic and fulvic acids were analysed by alkaline extraction (0.1 M NaOH and 0.1 M Na4P2O7, 1:25 ratio, 24 h), sample acidification (pH < 2), purification with Florsil® cartridges, dilution (1:20), and determination by VARIO TOC cube analyser (Elementar Italia Srl, Lomazzo, Italy). Assimilable phosphorus was determined by using the Olsen and Sommers method. Metals were determined by inductively coupled plasma–mass spectrometry (ICP-MS) determination.
Correlation analyses showed that many chemical variables were highly inter-correlated (Pearson r > 0.75) and were therefore omitted from statistical analyses. Retained variables were organic matter, pH, % sand, % silt, humic and fulvic acids, ammoniacal nitrogen, nitric nitrogen, assimilable phosphorus, calcium, magnesium, potassium, and sodium. Site location and characteristics are given in Tables S1 and S2.

2.2. Calculation of Soil Biological Quality Index

Investigated fields were very small, being in the range of 0.2–3.5 hectares, with an average of about 1 hectare (average ± standard deviation: 0.95 ± 0.89 hectares). In each site, we collected three soil samples (10 cm × 10 cm × 10 cm). Soil microarthropods were extracted by using Berlese–Tullgren extractors [101], equipped with a mesh screen of 2 mm and an incandescent lamp (60 W), for one week. Extracted microarthropods were placed in ethanol 95%. Microarthropods were classified into main groups, and each group received a score reflecting its specialisation in soil life, following Parisi et al. [40]. For groups including organisms with different levels of soil adaptation, the highest score was taken to reflect the most highly adapted microarthropods belonging to that group. The QBS-ar index for a soil sample was calculated as the sum of the scores recorded for each taxon.
In addition to this already established protocol, we applied a new approach that takes into consideration the abundance of the groups used in the QBS-ar calculation. To this end, we multiplied the score of a given group by its abundance, expressed as the number of collected individuals. Prior to calculations, the number of individual was log10(x + 1-transformed to reduce the impact of extremely abundant groups (Acarina and Collembola), which are typically present with hundreds or even thousands of individuals in most samples. For groups which included species with different levels of soil adaptation, and which had a range of scores, we made separate calculations for the different levels of specialisation, to reflect the actual composition of the arthropod assemblage. As in this new formulation of the QBS index the scores were weighted by the abundance of each group, we termed the new index “QBS-ab” (abundance-based QBS-ar). Data on arthropods are given in Tables S3–S14.
We used generalised linear mixed models using the glmmTMB R package to test the effects of agricultural management, land protection, and type of cultivation on QBS-ar and QBS-ab values, with sites nested into geographical areas as a random factor. Data were checked for normality (Shapiro–Wilk test and Q-Q plot) and homoscedasticity (Bartlett test) before analyses. The r.squaredGLMM function of the MuMIn R package was used to calculate the R2 explained by fixed and random factors in generalised linear mixed models. Potential spatial autocorrelation in the residuals of generalised linear mixed models was checked using Moran’s I test as implemented in the moran.test function of the spdep R package. We correlated QBS-ar and QBS-ab values with soil characteristics using a Pearson correlation coefficient. All statistical analyses were performed using R 4.0.3 software [102].

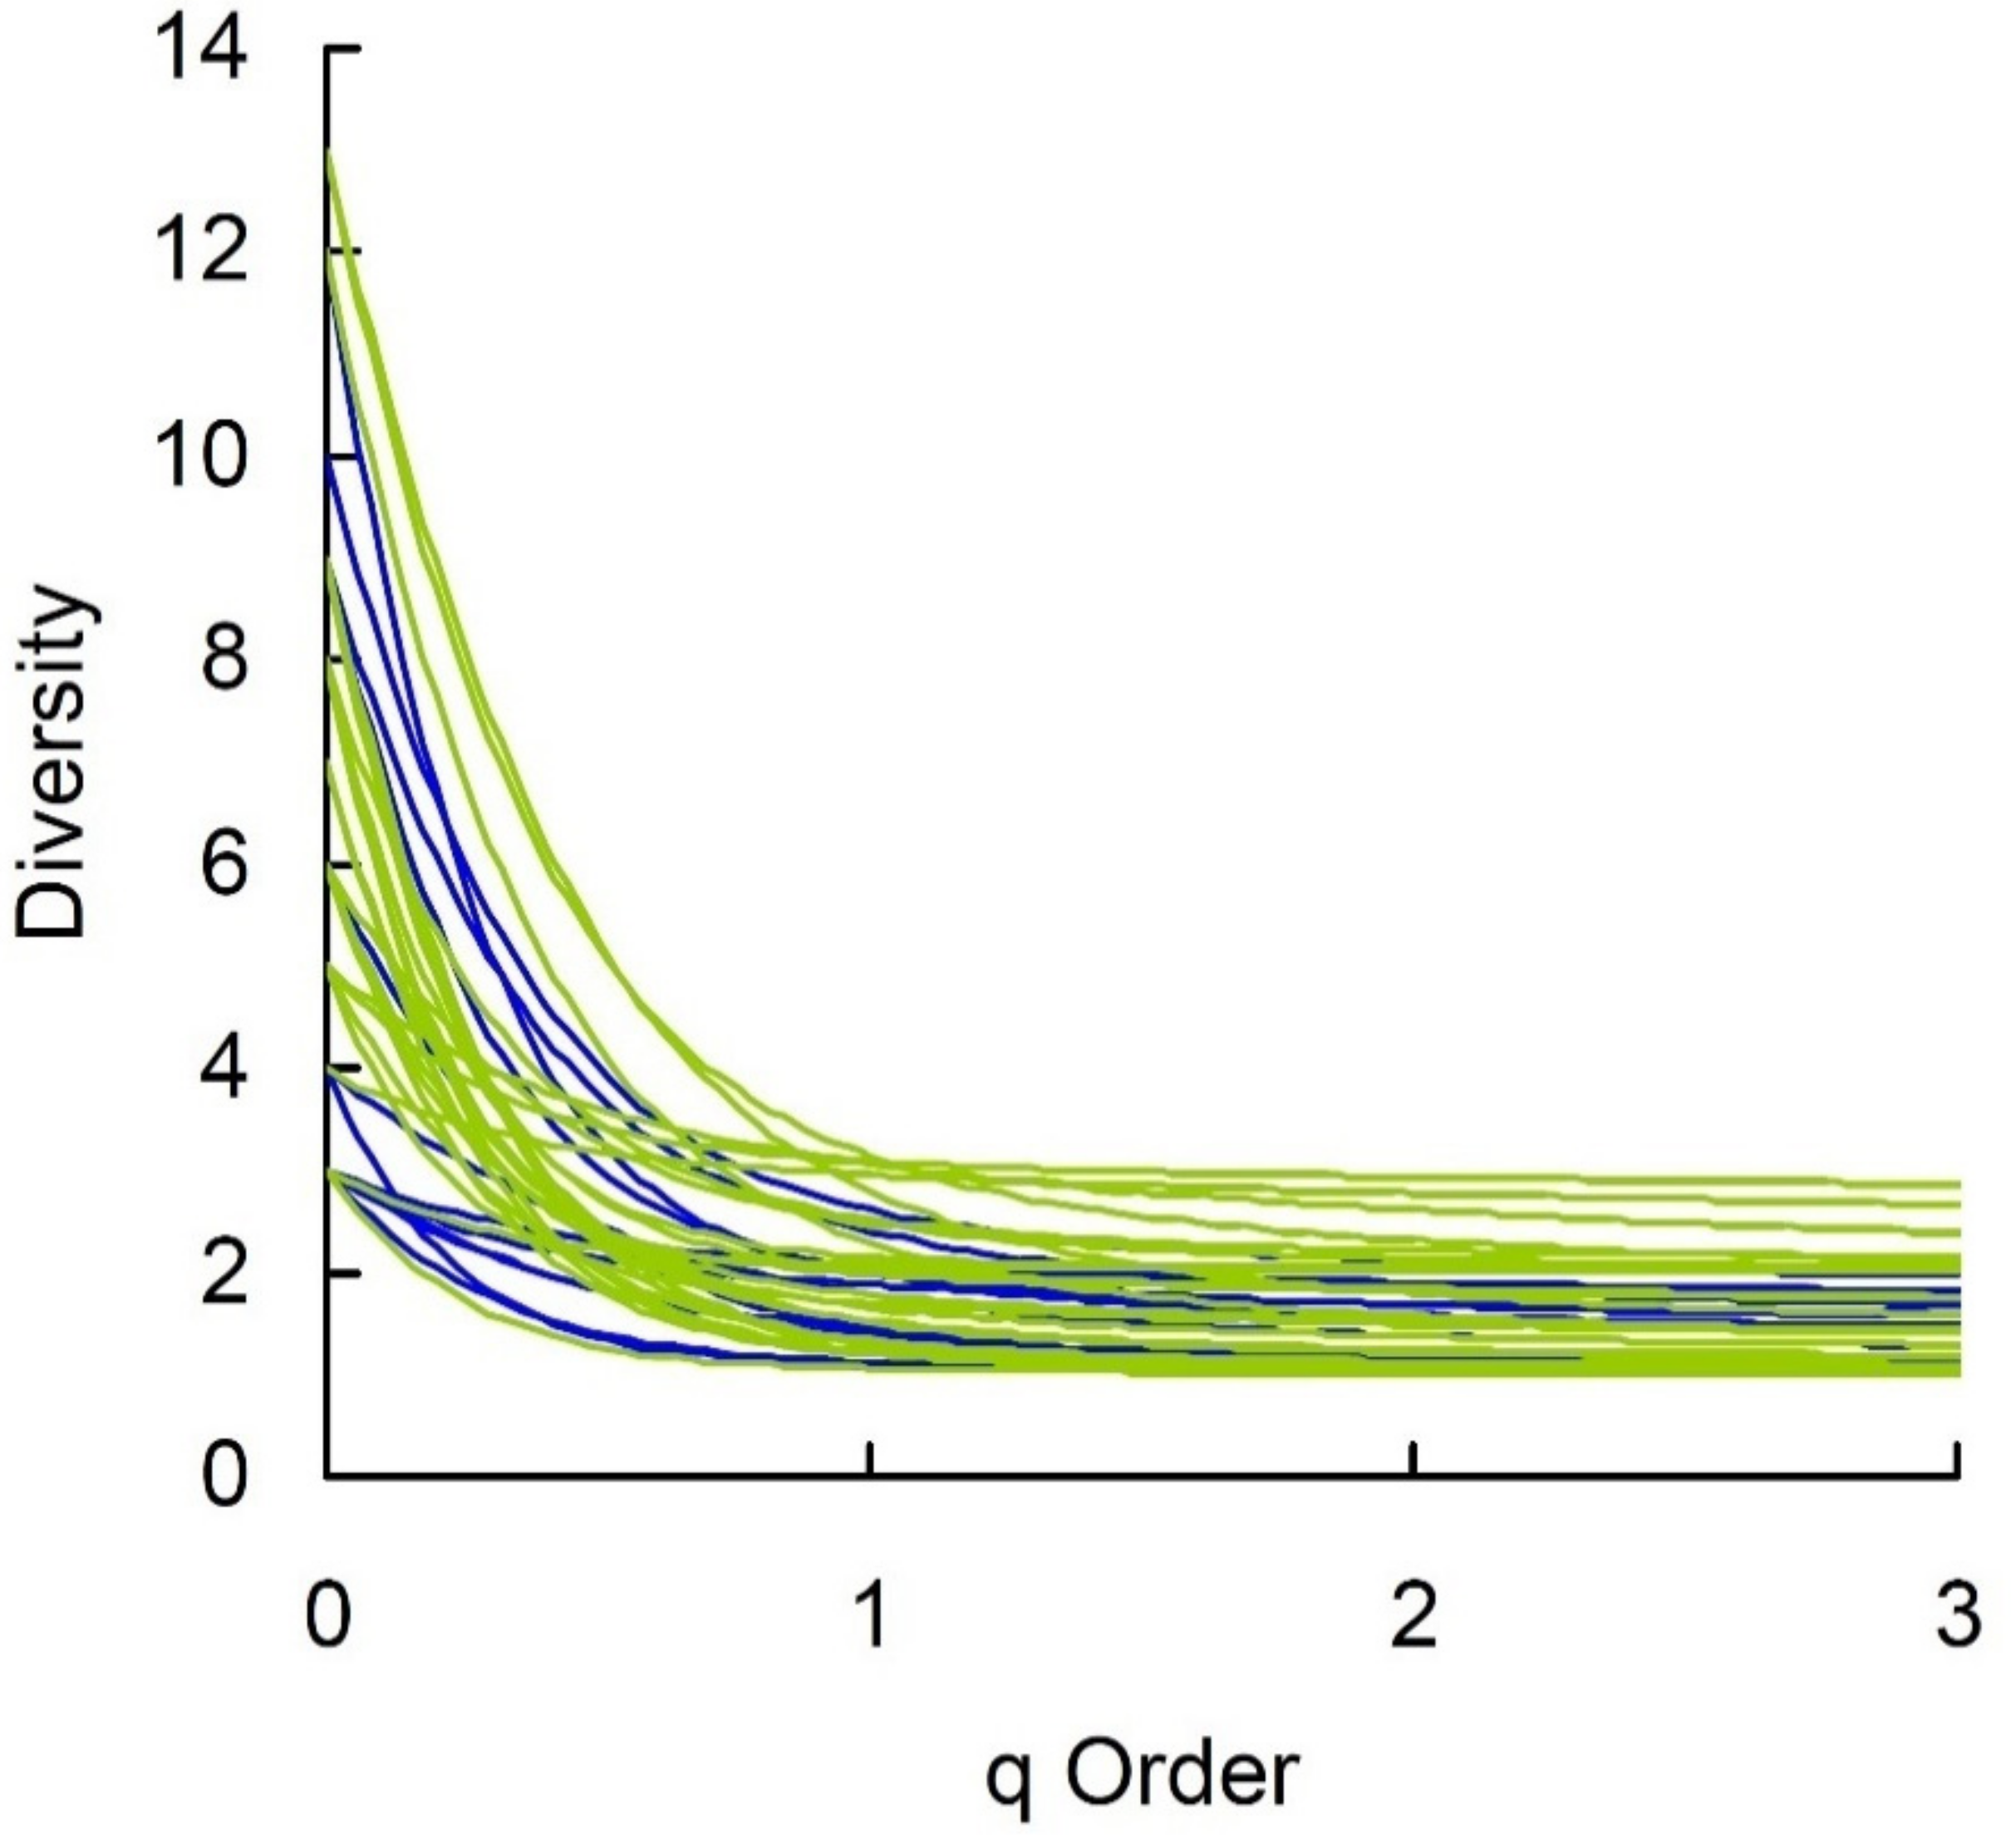
2.3. Arthropod Diversity

Previous research attempted to express the arthropod biodiversity of soil samples using diversity indices at the level of class (Diplopoda, Chilopoda, Symphyla, Pauropoda) or order (insects, chelicerates, and crustaceans) [16,26,89]. Indeed, there are a plethora of proposed measures of diversity that combine richness and abundance into a single metric [103,104] and different authors used different indices [6,16,26,48,76,86,89]. Among the vast multitude of available diversity measures, Hill numbers qD are increasingly used [97,105,106]. Hill numbers, which differ among themselves only by the exponent q, include three widely used species diversity measures as special cases: species richness (when q = 0), exponential Shannon diversity (when q = 1 as the limiting case, since the equation for Hill numbers is undefined for q = 1) and Simpson diversity (q = 2) [97,98]. As the diversity order q can assume any value, it is possible to construct, for any given species assemblage, a diversity profile plotting qD versus q [105]. Here, we used Hill numbers to compare diversity profiles of soil samples from biological and conventional fields. Calculations of Hill numbers were carried out using PAST 3 [107].
We tested differences in species richness (q = 0), Shannon diversity (q = 1) and Simpson diversity (q = 2), and total abundance values using, in all cases, generalised linear mixed models as described above. A Poisson distribution was applied for count data (richness and abundance). We correlated richness (log-transformed), Shannon diversity, Simpson diversity, and total abundance (log-transformed) values with soil characteristics using Pearson correlation coefficients.

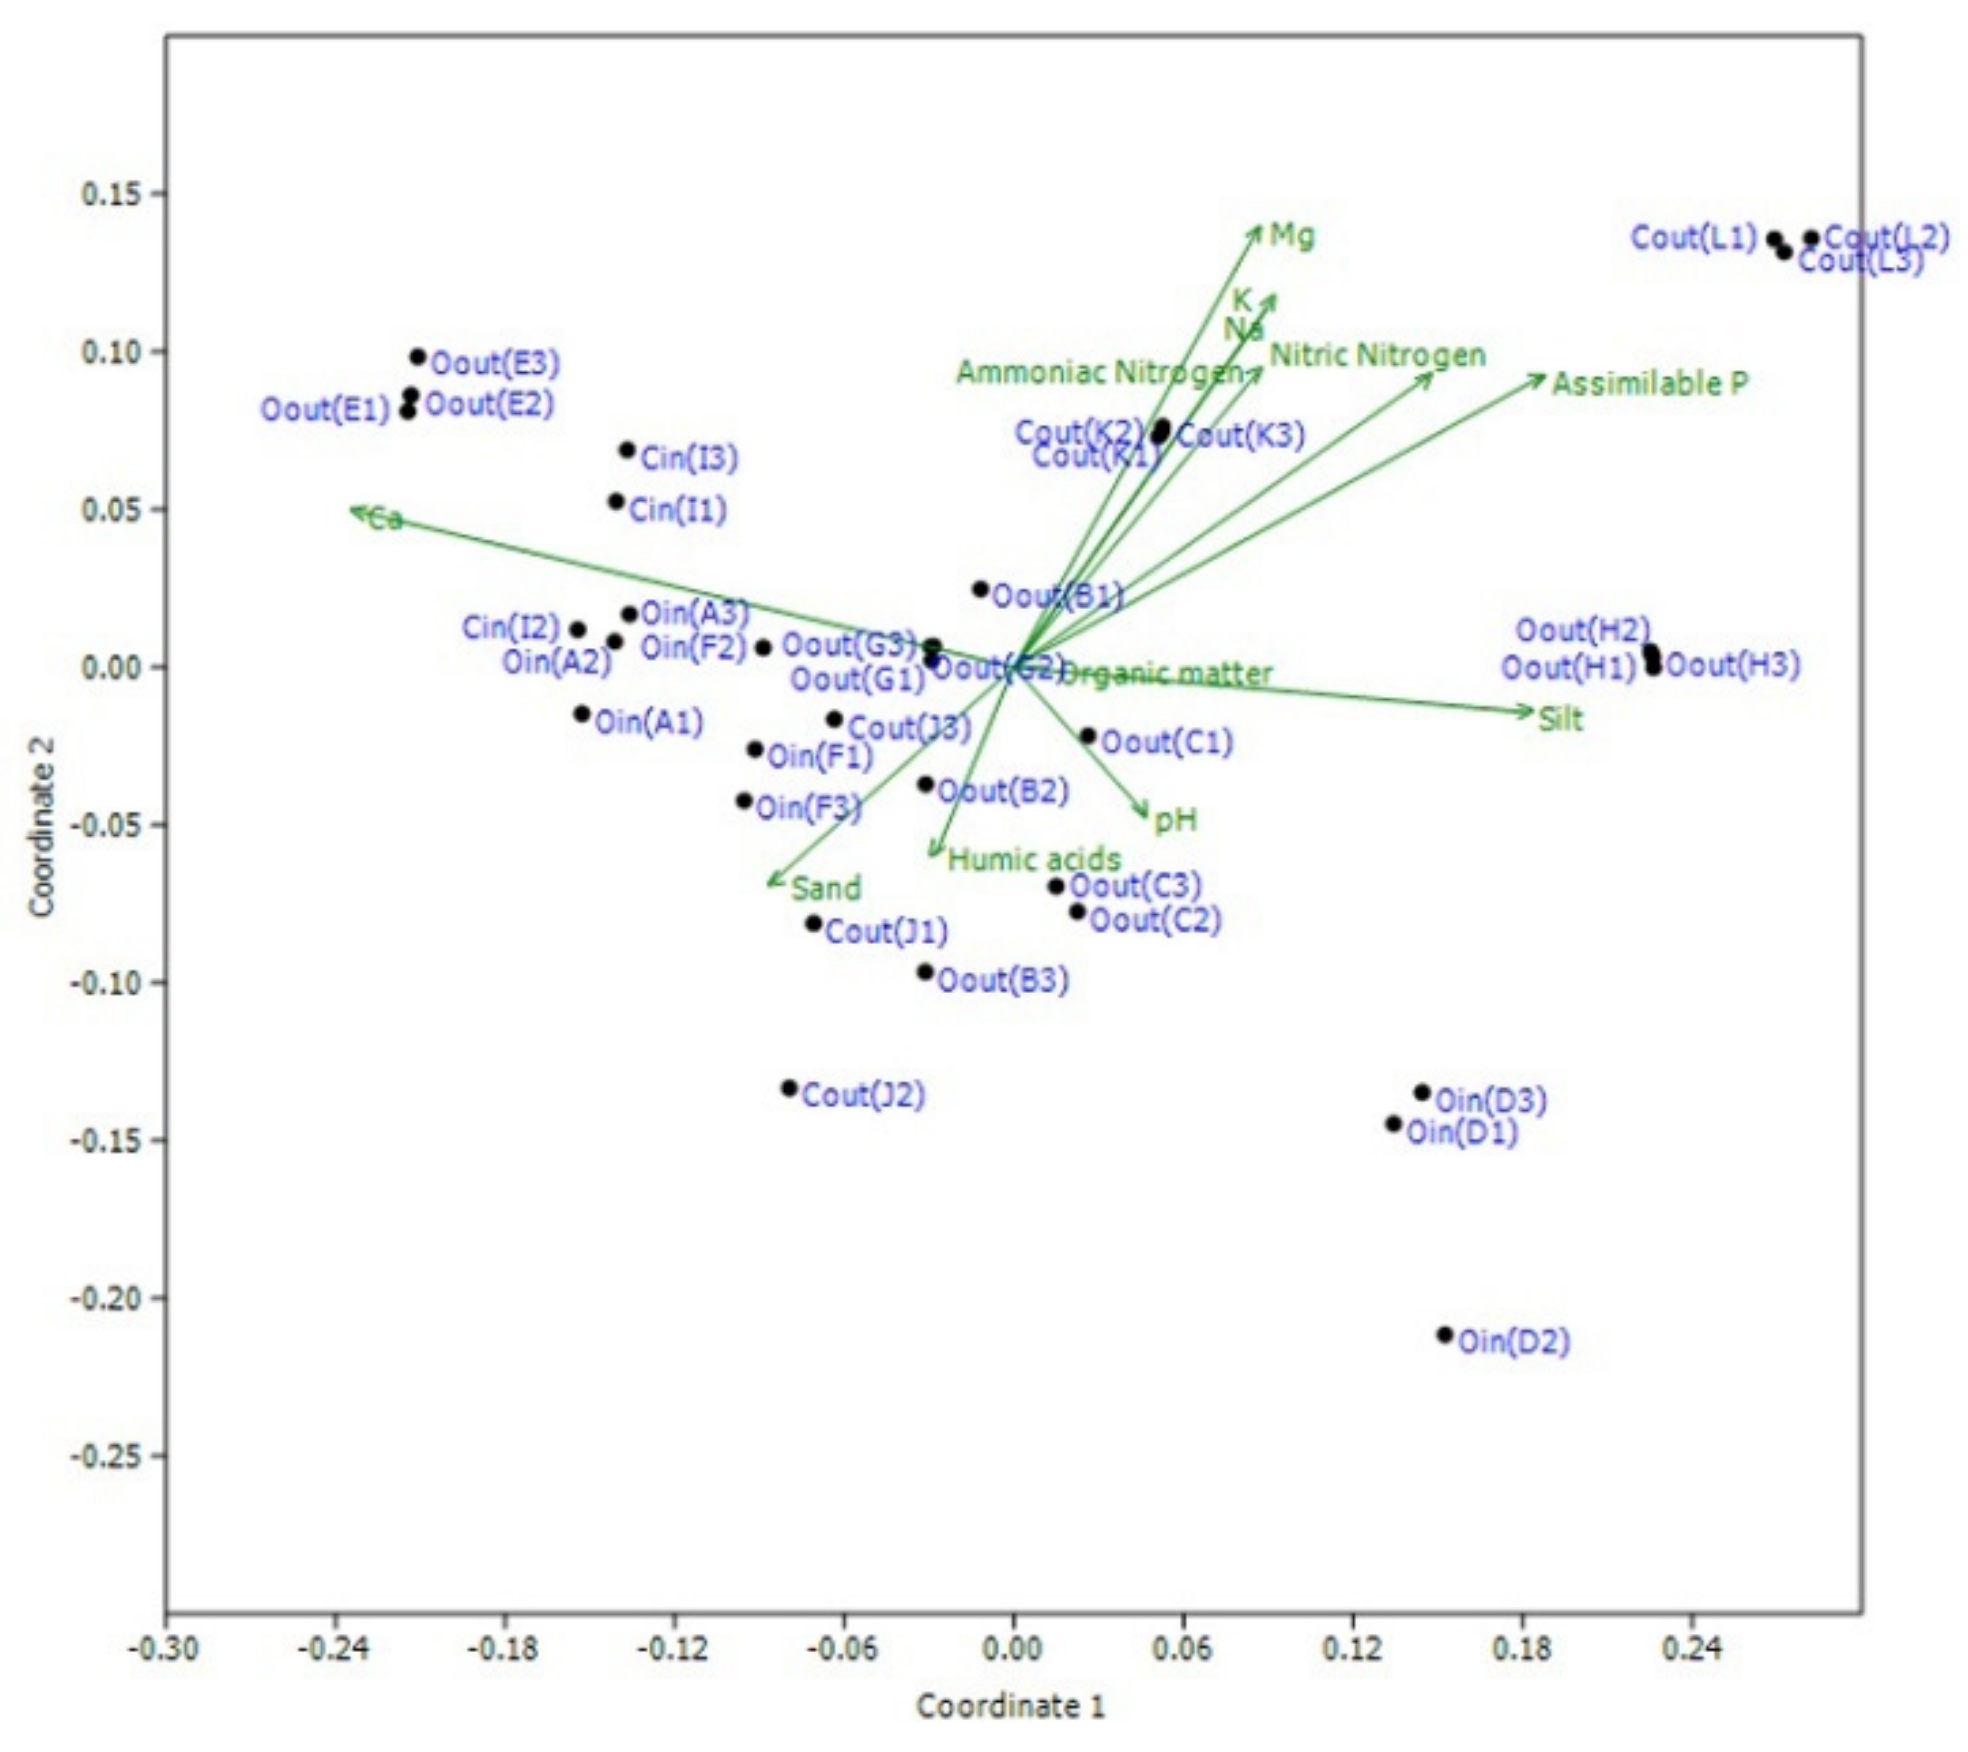
2.4. Influence of Soil Characteristics on Variation in Soil Arthropod Composition
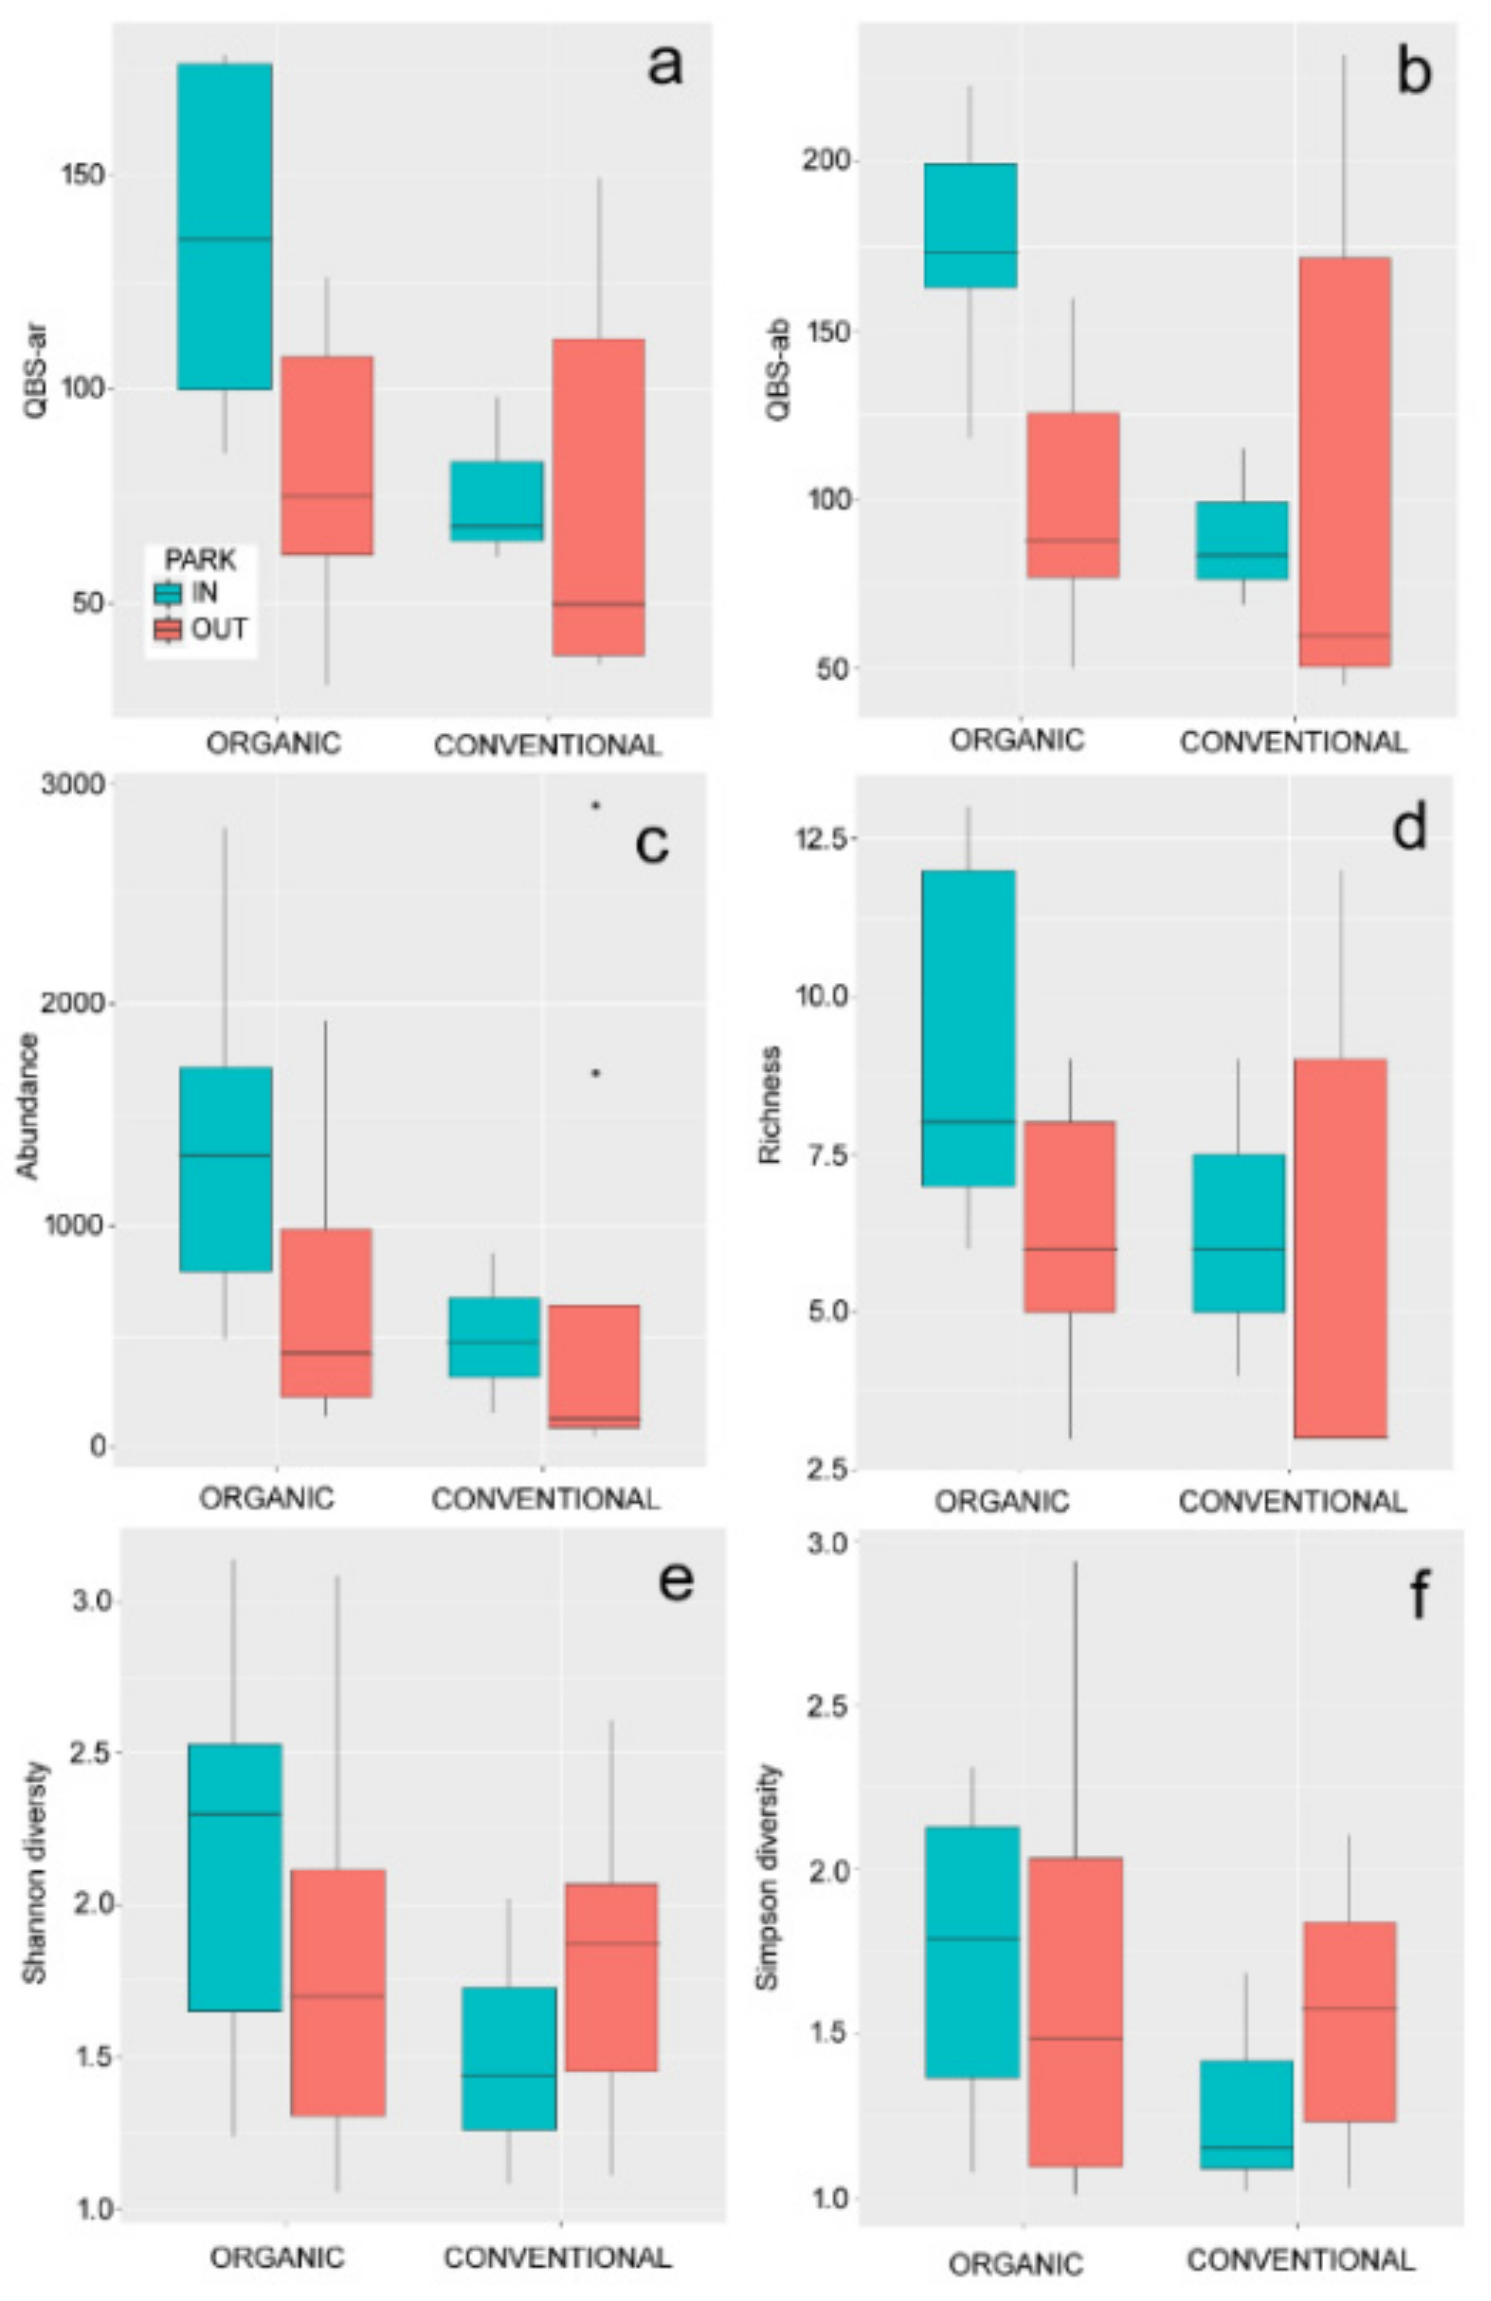
We investigated variability in arthropod community structure and composition using a non-metric multidimensional scaling with Bray–Curtis dissimilarity calculated on abundance data. Then, we calculated the correlation between soil characteristics and the first two dimensions extracted by the non-metric multidimensional scaling. Calculations were carried out using PAST 3 [107].

3. Results

We assigned soil arthropods to ecomorphological groups, belonging to five subphyla: Chelicerata, including Acarina, Pseudoscorpionida, and Araneae; Hexapoda, including Collembola, Protura, Diplura and nine insect orders; Crustacea, only represented by Isopoda; Myriapoda, including Diplopoda, Chilopoda, Pauropoda, and Symphyla (Tables S3–S14). Acarina were present in all samples; Collembola were present in all samples except one; Pauropoda, Diptera, and Coleoptera were recorded in more than 50% of samples; Symphila, Diplura, Hemiptera, Hymenoptera (including Formicidae), and Thysanoptera were found in 30–50% of samples; the other groups were less frequent (<20% and of samples). Values of QBS-ar, QBS-ab, taxon richness, Shannon diversity, Simpson diversity, and abundance are given in Table S2. Values of QBS-ar, QBS-ab, and taxon richness were significantly higher in organic than conventional fields (Table 1, Figure 1). The position of sites within or outside a protected area had a significant effect on QBS-ar, QBS-ab, Shannon diversity, and Simpson diversity (Table 1, Figure 1). In all these measures, sites within protected areas showed, on average, significantly higher values than those outside protected areas. All diversity measures and abundance varied according to the type of cultivation (Table 1). In all cases, most of the variance was explained by fixed factors (Table 1). The residuals did not show any significant spatial autocorrelation (Table 1). The use of diversity profiles indicates that most of the sites with organic management had higher diversity than those with conventional management (Figure 2).
Correlations between QBS indices, diversity indices, abundance, and soil characteristics are given in Table 2. The two QBS indices (QBS-ar and QBS-ab) were strongly correlated. Both QBS-ar and QBS-ab were correlated with total arthropod abundance, taxon richness, and Shannon diversity but not with Simpson diversity.
Organic matter was negatively correlated with richness. Percent of sand was positively correlated with QBS-ar, QBS-ab, richness, and abundance. Nitric nitrogen was negatively correlated with QBS-ar, QBS-ab, richness, and abundance. Phosphorus was negatively correlated with QBS-ar, QBS-ab, richness, and abundance but positively with Shannon diversity and Simpson diversity. Magnesium was negatively correlated with QBS-ar, QBS-ab, richness, abundance, Shannon diversity, and Simpson diversity. Potassium was negatively correlated with QBS-ar, QBS-ab, richness, and abundance. Sodium was negatively correlated with richness and abundance.
Results of non-metric multidimensional scaling (Figure 3) show that sites do not form clearly distinguishable groups on the basis of their arthropod composition. However, samples from the same sites tend to be grouped closely, thus showing high similarities in arthropod community structure. Moreover, high concentrations of magnesium, potassium, sodium, assimilable phosphorus, nitric, and ammoniac nitrogen seem to be associated with sites from conventional fields, whereas a high percentage of silt influences the microarthropod composition of a site organically managed.

4. Discussion

Our study demonstrated that (1) organic management improves soil biology quality (as expressed by the soil biology quality index based on microarthropods) and microarthropod richness; (2) including arthropod abundance in QBS-ar calculation does not change the main outcomes; (3) fields that are included in protected areas have better soil health (higher values of soil biology quality, Shannon diversity, and Simpson diversity), even under conventional management; (4) values of soil biology quality and community structure are distinctly influenced by certain physical and chemical characteristics of the soil, which supports the use of microarthropods as biological indicators.
Research studies on the effects of different management practices on soil arthropods in agro-ecosystems produced variable results [11,40,90,95,96,108,109]. Although some studies have shown no significant positive effect of organic farming on certain soil arthropods [110], in general, organic farming increases species richness and abundance of soil organisms, compared with conventional systems [78,94,111,112,113]. As regards the QBS-ar, Tóth et al. [109] found no significant positive effect of organic and integrated management on QBS-ar index, and Mazzoncini et al. [95] observed higher QBS-ar values in conventional fields than in the organic ones because of the unique presence of few rare individuals of Protura and Chilopoda in the conventional system. However, most research indicated that organic farming increases soil biology quality as expressed by the QBS-ar index (see [40,90]). Our results are, therefore, in line with previous studies and support the use of organic management to preserve soil health.
The beneficial effect of organic management on soil health can be due to the reduced use of both tillage and chemicals. Tillage negatively affects soil arthropods both directly, by crushing their soft bodies, and indirectly, by destroying the channels they use to move around in [16,114,115]. In general, fields that are not subject to intensive tillage have higher values of arthropod abundance and diversity [39,48,76,116,117,118,119,120,121,122]. For example, House and Parmelee [116] and Hendrix et al. [117] reported higher abundance and biomass of microarthropods in no-tillage than in conventional tillage systems. Cortet et al. [121] found that the mites were more abundant in no-tillage than in conventional tillage conditions. Ferraro and Ghersa [122] similarly reported higher values of mite density in association with a decrease in tillage impact. Tabaglio et al. [48] also observed that mites were more abundant in no-tillage, compared with traditional tillage, although results on total microarthropods were equivocal and no effect was detected for QBS-ar. Sapkota et al. [76] reported that no-tillage affected positively microarthropod richness and Simpson diversity, as well as QBS-ar values (no effect was deduced for evenness).
As regards the influence of chemicals, it is known that their application can negatively affect the soil fauna community [123,124], and thus, organic management may assist the preservation of soil arthropod communities. In our study, the organically managed fields were characterised by no-tillage (or very reduced tillage) and no use of synthetic pesticides and fertilisers, whereas all conventionally managed fields were subject to repeated tillage and use of chemicals, so we could not disentangle the possible different contribution of these two factors (tillage and chemicals) in improving soil health in organic fields.
Another key result of our study is the positive influence of land protection on the soil health of agricultural fields. The influence of landscape characteristics on soil microarthropods has been investigated in relatively few studies involving mites [125,126], collembolans [127,128,129], or both [130,131,132]. The current opinion is that soil-dwelling animals are more affected by local factors than landscape features, mostly because of their limited home ranges and dispersal ability [111,113,128,133,134]. However, recent research demonstrated the influence of landscape characteristics on soil fauna community structure [129], for example, by constraining habitat conditions at finer spatial scales [127,135].
We found that fields within protected areas had higher soil health than those outside protected areas, as demonstrated by higher values of QBS-ar, QBS-ab, Shannon index, and Simpson index, which indicates a beneficial role exerted by the conservation status of the areas surrounding the fields. This beneficial effect may have two non-mutually exclusive explanations.
First, in protected areas, even conventional agriculture follows more sustainable practices, because (1) some chemicals are always prohibited, (2) some chemicals are allowed but with more restrictions than in non-protected areas, and (3) the reduction in the use of chemicals is incentivised. As a result, the use of agrochemicals is strongly limited in park territories [136].
Second, fields within protected areas may benefit from the good environmental quality of the surrounding matrix. In contrast to fields outside the protected areas, which are typically embedded into matrices with comparable or even lower environmental quality (such as other fields, urbanised areas, or semi-natural landscapes often subject to high disturbance), agricultural fields located within natural parks are embedded into a high-quality matrix. This may allow microarthropods of agricultural fields in protected areas to benefit more from rescue effects, i.e., the maintenance of viable populations owing to immigration from adjacent areas [137,138,139]. To the best of our knowledge, our study is the first that highlights the positive effect of land protection on soil health in agricultural fields. Since farmers are frequently hostile to land protection, as it is perceived as a limit to the agricultural exploitation of a territory [130], our results may have important implications in promoting the importance of land protection in sustainable farming.
We also found that crop type may have a role in determining soil biology health, as already observed in other agricultural contexts [79]. However, because of unbalanced sampling, we cannot disentangle the possible effect of crop type from those of management and land protection, and further research is needed to explore the role of crop type.
Various studies attempted to use diversity measures in conjunction with QBS index, including number of observed taxa [16,26,88,89], Menhinick diversity [6,88], Margalef diversity [26,88], Shannon diversity [6,16,26,48,88,89], Simpson diversity [76], Pielou evenness [6,16,26,48,89], Buzas and Gibson evenness [26], Simpson dominance [6,26,88], and Berger and Parker dominance [26]. Surprisingly enough, possible correlations between QBS-ar and measures of community structure have been almost completely unexplored. Exceptions are a study by Galli et al. [89], who found that QBS-ar was positively correlated with Shannon index but not with Pielou evenness, and one by Blasi et al. [88], who reported a positive relationship between QBS-ar values and the number of taxonomic groups.
We found that QBS-ar (and its variant based on abundances) was strongly correlated with total abundance and taxon richness and, less strongly, with Shannon diversity but not with Simpson diversity. Since in the QBS-ar the various taxa are weighted according to their ecomorphological specialisation, the positive correlation between QBS-ar and taxon richness indicates that weighting by specialisation in soil life has a secondary role and that most of the information is given simply by the number of taxa. In Hill number, the importance of species abundances increases with the q-order: thus, Simpson index (q = 2) places more weight on the frequencies of abundant species than Shannon index (q = 1), and the contribution of rare species is emphasised by richness (q = 0) [97,140]. The positive correlation of QBS-ar with Shannon index and its lack of correlation with Simpson index are, therefore, consequences of the strong dependence of QBS-ar on richness.
Given the correlation of QBS-ar with richness, it is not surprising that QBS-ar and richness produced parallel results in highlighting the importance of management. By contrast, using Shannon and Simpson indices, the generalised linear mixed models showed no significant influence of management, but the importance of land protection appeared to be significant. This suggests that land protection profoundly affects community diversity possibly through rescue effects. Elia et al. [88] found that QBS-ar was able to show significant differences in soil quality when indices of community diversity (Shannon, Menhinhick, Margalef) or dominance (Simpson) failed. Our results confirm that QBS-ar is sensitive to more factors than diversity measures such as Shannon and Simpson diversity. However, it should be noted that in all these studies (including our own), diversity indices were calculated using the level of class or order, which is a very low taxonomic resolution; it would be interesting, in the future, to investigate the relationship between QBS-ar and diversity indices calculated using identification to species.
An important point of merit of the QBS-ar index is that it does not require abundance data, being based on only the presence/absence of all groups found in the sample. The underlying assumption is that the presence of an animal belonging to a group means the possibility of this group to live in that soil, independently from its abundance [44,73]. This characteristic makes QBS-ar calculation very fast because the researcher does not have to spend time counting, for the various groups, the number of individuals arthropods, which, even in a single sample, may amount to hundreds or thousands. On the other hand, discounting abundances may be considered a potential limit of the QBS-ar; thus, one objective of our research was to test if considering abundances would lead to different results. We found that the results obtained with abundances paralleled those achieved with only presence/absence. This is a positive result, as indicates that the original, easier formulation of the QBS-ar is effective, and there is no need to spend time counting arthropod individuals.
Research on the influence of soil characteristics on edaphic arthropod communities is still limited and mostly focused on the influence of soil texture, soil organic matter content, and pH (e.g., [38,74,80,87,111,141,142,143,144,145,146]). In general, however, such types of studies produced contradictory results, depending on the study area and the taxa [78]. For example, Andrén and Lagerlöf [141], Kautz et al. [143], and Salmon et al. [144] found that the amount of organic material in the soil increases the abundance of soil microarthropods, and Tóth et al. [109] reported that soil organic matter content had a significant positive correlation with QBS index. However, Moço et al. [78] found a negative influence of organic carbon on the richness of fauna, and Begum et al. [147] and Santorufo et al. [6] reported no correlation of QBS-ar values with soil organic carbon and organic matter content, respectively. In our study, organic matter was correlated (negatively) only with richness, and correlation was weak (albeit significant), which suggests that organic matter was not a limiting factor in the studied systems and that an excess of it may have a negative effect on soil arthropods.
Salmon et al. [144] found a positive correlation between pH and diversity (Shannon index) of zoological groups, and Moço et al. [87] observed a positive effect of soil pH on the richness of fauna, but Begum et al. [147], Santorufo et al. [6] and Tóth et al. [109] reported no correlation between QBS-ar values and pH. We also found no effect of pH on either QBS-ar or diversity indices and total abundances.
Moço et al. [87] reported a negative effect of clay content on the richness of fauna, but Tóth et al. [109] reported no effect of clay percentage on QBS-ar values. We did not make correlations with clay, as it was strongly negatively correlated with sand and humic acids, and we preferred to retain sand, as it was not correlated with humic acids. We found a positive effect of sand content on QBS-ar, richness, and total abundance, although correlations were not very strong. Sandy soils are generally characterised by a high macroporosity and lower capacity of water storage than those with a heavier texture [148]. Thus, these positive correlations can be explained by the fact that a higher sand content makes the soil more penetrable and hence more favourable to edaphic microarthropods [149]. This hypothesis is in line with Müller and Rauhe [150], who also described a higher level of collembolan density in sandy soils than loamy ones. Although silt did not affect soil quality, a high silt percentage was associated with the arthropod composition of an organically managed field. In highly silty conditions, organic management might influence profoundly arthropod composition due to the increase in organic matter provided by the use of manure in this field.
Negative (albeit not very strong) correlations of nitric nitrogen and potassium with QBS-ar, richness, and abundance, as well as their importance in characterising assemblage similarity of sites from conventionally managed fields, can be explained by the fact that the excessive application of these substances creates a stratification of inorganic forms unavailable for plant absorption, representing a pollution source of immobilised forms with negative effects on biodiversity and species trophic interactions [151,152]. Moço et al. [87] already reported a negative indirect effect of total nitrogen on the richness of fauna, and Tabaglio et al. [48] observed a negative effect of nitrogen on mite and collembolan abundance but not on Shannon diversity, evenness, and QBS-ar values.
Sodium was slightly negatively correlated with richness and abundance and was important in characterising assemblage similarity of sites from conventionally managed fields, which is an expected result, as saline soils are more hostile environments for most organisms [153]. However, we found no significant effects of sodium on QBS-ar and Shannon or Simpson indices, which suggests that an increase in sodium (at least until a certain value) affects more richness and total abundances than the relative abundance of the taxa, and affects them irrespective of their specialisation towards the edaphic life. On the other hand, an increase in magnesium, which is also a form of salinisation, negatively influences richness and abundance, QBS-ar, Shannon diversity, and Simpson diversity, and characterises assemblage similarity of sites from conventionally managed fields. This suggests that magnesium has a general negative influence on soil microarthropods and also affects more specifically those less common and more specialised. Magnesium induces both accumulations of sodium in soil and soil aggregate destabilisation by increasing clay dispersion [154,155]. These indirect and direct impacts on soil structure create more hostile environments and may have a negative effect on edaphic animals.
Phosphorus was negatively correlated with QBS-ar, richness, and abundance but positively with Shannon and Simpson diversity (albeit not strongly) and characterises assemblage similarity of sites from conventionally managed fields. In general, the amount of phosphorus may be considered an indication of the intensity of the use of fertilisers, as it is one of the main three nutrients most found in fertilisers, that is, nitrogen, phosphorus, and potassium [156]. Thus, these negative correlations may reflect, more generally, the impact of management (in our case, conventionally managed fields have a higher phosphorus content than those organically managed; median values: 10 mg × Kg−1 in organic fields against 72.5 mg × Kg−1 in conventional fields; Mann–Whitney U-test: U = 54.0, P = 0.002). Surprisingly, increasing values of phosphorus increase Shannon and Simpson diversity values. This situation paralleled the effect of soil metal pollution, which seemed to cause an increase in invertebrate diversity and evenness in urban soils [6]. A possibility is that by reducing the abundance of the most abundant taxa, pollution increases equitability and hence increases diversity but after wiping out the most sensitive species. Thus, caution should be paid in using arthropod diversity metrics to evaluate soil health.

5. Conclusions

We found that organic management improves soil biology quality, as indicated by the QBS-ar index, a widely used index which expresses the level of specialisation of microarthropods to the soil environment. This should encourage the use of organic farming to maintain soil health. QBS-ar is based only on the presence/absence of taxa, with no reference to their abundances. We demonstrated that including arthropod abundance in QBS-ar calculation does not change the main outcomes, which supports the use of its original, more user-friendly formulation. We also found that agricultural fields included in protected areas had greater soil health, which shows the importance of the matrix in determining agricultural soil health and highlights the importance of land protection in preserving biodiversity even in managed soils. Finally, we found that soil biology quality and microarthropod community structure are distinctly influenced by certain physical and chemical characteristics of the soil, which supports the use of microarthropods as biological indicators.

Supplementary Materials

The following are available online at https://0-www-mdpi-com.brum.beds.ac.uk/article/10.3390/agriculture11101022/s1: Table S1: Site location (coordinates), Table S2: Site characteristics. Area codes: ACM = Altopiano delle Cinque Miglia, MA = Montagna Aquilana, FUC = Fucino, VP = Valle Peligna, VS = Valle Subequana, VV = Val Vomano. For each replicate, values of QBS-ar, QBS-ab, richness, Shannon diversity, Simpson diversity, and abundance are provided, Tables S3–14: Scores reflecting specialisation (ecomorphological index, EMI) and abundance of arthropods sampled in each replicate used for calculating QBS-ab. For groups with variable EMI scores, the highest value was used in QBS-ar calculation. Replicates have the same codes as in Table S2.

Author Contributions

Conceptualisation, C.M. and S.F.; methodology, C.M., M.P., L.D., M.M.D.G., D.S., and S.F.; software, S.F. and L.D.; validation, C.M., M.P., and L.P.; formal analysis, C.M., M.P., S.F., L.D., and M.M.D.G.; investigation, C.M., M.P., and M.M.D.G.; resources, M.M.D.G., L.P., and S.F.; data curation, C.M.; writing—original draft preparation, S.F.; writing—review and editing, C.M., M.P., L.D., M.M.D.G., L.P., D.S., and S.F.; visualisation, C.M. and S.F.; supervision, S.F., M.M.D.G., and L.P.; project administration, S.F.; funding acquisition, S.F., M.M.D.G., and L.P. All authors have read and agreed to the published version of the manuscript.

Funding

This research was conducted within the project “Profili tellurici della biodiversita—Programma a Titolarità—Misura 7.6.1 PSR 2014–2020” funded by Regione Abruzzo and the project ”Pattern altimetrici della diversità animale, vegetale e microbica” founded by the Department Grant ”Bando Ricerca FFO 2021”.

Institutional Review Board Statement

Not applicable.

Informed Consent Statement

Not applicable.

Data Availability Statement

All data are provided as Tables S1–S14.

Acknowledgments

We are grateful to farmers who allowed us to access their properties and to four anonymous reviewers for their comments on a previous version of this paper.

Conflicts of Interest

The authors declare no conflict of interest. The funders had no role in the design of the study; in the collection, analyses, or interpretation of data; in the writing of the manuscript, or in the decision to publish the results.

References

  1. Brevik, E.C.; Burgess, L.C. Soils and Human Health; CRC Press: Boca Raton, FL, USA, 2012; pp. 1–408. [Google Scholar]
  2. Turbé, A.; De Toni, A.; Benito, P.; Lavelle, P.; Lavelle, P.; Ruiz, N.; Van der Putten, W.H.; Labouze, E.; Mudgal, S. Soil Biodiversity: Functions, Threats and Tools for Policy Makers; Report for European Commission; European Commission (DG Environment): Brussels, Belgium, 2010; pp. 1–250. [Google Scholar]
  3. Adhikari, K.; Hartemink, A.E. Linking soils to ecosystem services—A global review. Geoderma 2016, 262, 101–111. [Google Scholar] [CrossRef]
  4. Baveye, P.C.; Baveye, J.; Gowdy, J. Soil “Ecosystem” Services and Natural Capital: Critical Appraisal of Research on Uncertain Ground. Front. Environ. Sci. 2016, 4, 41. [Google Scholar] [CrossRef]
  5. DeFries, R.S.; Foley, J.A.; Asner, G.P. Land-use choices: Balancing human needs and ecosystem function. Front. Ecol. Environ. 2004, 2, 249–257. [Google Scholar] [CrossRef]
  6. Santorufo, L.; Van Gestel, C.A.; Rocco, A.; Maisto, G. Soil invertebrates as bioindicators of urban soil quality. Environ. Pollut. 2012, 161, 57–63. [Google Scholar] [CrossRef] [PubMed]
  7. Smith, P.; House, J.I.; Bustamante, M.; Sobocká, J.; Harper, R.; Pan, G.; West, P.C.; Clark, J.M.; Adhya, T.; Rumpel, C.; et al. Global change pressures on soils from land use and management. Glob. Chang. Biol. 2016, 22, 1008–1028. [Google Scholar] [CrossRef] [PubMed]
  8. Urruty, N.; Tailliez-Lefebvre, D.; Huyghe, C. Stability, robustness, vulnerability and resilience of agricultural systems. A review. Agron. Sustain. Dev. 2016, 36, 15. [Google Scholar] [CrossRef]
  9. Montanarella, L.; Vargas, R. Global governance of soil resources as a necessary condition for sustainable development. Curr. Opin. Environ. Sustain. 2012, 4, 559–564. [Google Scholar] [CrossRef]
  10. Bengtsson, J.; Ahnström, J.; Weibull, A.C. The effects of organic agriculture on biodiversity and abundance: A meta-analysis. J. Appl. Ecol. 2005, 42.2, 261–269. [Google Scholar] [CrossRef]
  11. Gardi, C.; Menta, C.; Leoni, A. Evaluation of the environmental impact of agricultural management practices using soil microarthropods. Fresen. Environ. Bull. 2008, 17, 1165–1169. [Google Scholar]
  12. Lavelle, P.; Decaëns, T.; Aubert, M.; Barot, S.; Blouin, M.; Bureau, F.; Margerie, P.; Mora, P.; Rossi, J.-P. Soil invertebrates and ecosystem services. Eur. J. Soil Biol. 2006, 42, S3–S15. [Google Scholar] [CrossRef]
  13. Narula, A.; Vats, L.K.; Handa, S. Collembolans and mites of deciduous forest stand. Ind. J. For. 1996, 21, 147–149. [Google Scholar]
  14. Jeffery, S.; Gardi, C.; Jones, A.; Montanarella, L.; Marmo, L.; Miko, L.; Ritz, K.; Peres, G.; Römbke, J.; van der Putten, W.H. European Atlas of Soil Biodiversity; European Commission; Publications Office of the European Union: Luxembourg, 2010; pp. 1–136. [Google Scholar]
  15. Geisen, S.; Wall, D.H.; Van Der Putten, W.H. Challenges and Opportunities for Soil Biodiversity in the Anthropocene. Curr. Biol. 2019, 29, R1036–R1044. [Google Scholar] [CrossRef]
  16. Menta, C.; Leoni, A.; Gardi, C.; Conti, F.D. Are grasslands important habitats for soil microarthropod conservation? Biodivers. Conserv. 2011, 20, 1073–1087. [Google Scholar] [CrossRef]
  17. Stolze, M.; Piorr, A.; Häring, A.; Dabbert, S. The Environmental Impacts of Organic Farming in Europe; Department of Farm Economics, University of Hohenheim: Stuttgart-Hohenheim, Germany, 2000; pp. 1–127. [Google Scholar]
  18. Mäder, P.; Fliessbach, A.; Dubois, D.; Gunst, L.; Fried, P.; Niggli, U. Soil fertility and biodiversity in organic farming. Science 2002, 296, 1694–1697. [Google Scholar] [CrossRef]
  19. Scialabba, N.; Hattam, C. (Eds.) Organic Agriculture, Environment and Food Security; Environment and Natural Resources Series No. 4; Food and Agriculture Organization: Rome, Italy, 2002; pp. 1–252. [Google Scholar]
  20. Vignola, I.; Stolton, S.; Bernward, G.; McNeely, J.A. (Eds.) The Relationship Between Nature Conservation, Biodiversity and Organic Agriculture, Proceedings of an International Workshop; IFOAM: Tholey-Theley, Germany, 2000; pp. 1–224. [Google Scholar]
  21. Lampkin, N.; Pearce, B. Organic Farming and Biodiversity; IFOAM: Brussels, Belgium, 2020; pp. 1–67. [Google Scholar]
  22. Pimentel, D.; Hepperly, P.; Hanson, J.; Dous, D.; Seidel, R. Environmental, energetic and economics comparisons of organic and conventional farming systems. Bioscience 2005, 55, 573–582. [Google Scholar] [CrossRef]
  23. Esperschütz, J.; Gattinger, A.; Mäder, P.; Schloter, M.; Fließbach, A. Response of soil microbial biomass and community structures to conventional and organic farming systems under identical crop rotations. FEMS Microbiol. Ecol. 2007, 61, 26–37. [Google Scholar] [CrossRef] [PubMed]
  24. Fließbach, A.; Oberholzer, H.R.; Gunst, L.; Mäder, P. Soil organic matter and biological soil quality indicators after 21 years of organic and conventional farming. Agric. Ecosyst. Environ. 2007, 118, 273–284. [Google Scholar] [CrossRef]
  25. Birkhofer, K.; Bezemer, T.M.; Bloem, J.; Bonkowski, M.; Christensen, S.; Dubois, D.; Ekelund, F.; Fließbach, A.; Gunst, L.; Hedlund, K.; et al. Long-term organic farming fosters below and aboveground biota: Implications for soil quality, biological control and productivity. Soil Biol. Biochem. 2008, 40, 2297–2308. [Google Scholar] [CrossRef]
  26. Gagnarli, E.; Goggioli, D.; Tarchi, F.; Guidi, S.; Nannelli, R.; Vignozzi, N.; Valboa, G.; Lottero, M.R.; Corino, L.; Simoni, S.; et al. Case study of microarthropod communities to assess soil quality in different managed vineyards. Soil 2015, 1, 527–536. [Google Scholar] [CrossRef]
  27. Brussaard, L. Biodiversity and Ecosystem Functioning in Soil. Ambio 1997, 26, 563–570. [Google Scholar]
  28. Bird, S.B.; Coulson, R.N.; Fisher, R.F. Changes in soil and litter arthropod abundance following tree harvesting and site preparation in a loblolly pine (Pinus taeda L.) plantation. For. Ecol. Manag. 2004, 202, 195–208. [Google Scholar] [CrossRef]
  29. Nielsen, U.N.; Ayres, E.; Wall, D.H.; Bardgett, R.D. Soil biodiversity and carbon cycling: A review and synthesis of studies examining diversity–function relationships. Eur. J. Soil Sci. 2011, 62, 105–116. [Google Scholar] [CrossRef]
  30. Bernard, L.; Chapuis-Lardy, L.; Razafimbelo, T.; Razafindrakoto, M.; Pablo, A.L.; Legname, E. Endogeic earthworms shape bacterial functional communities and affect organic matter mineralization in a tropical soil. ISME J. 2012, 6, 213–222. [Google Scholar] [CrossRef]
  31. Culliney, T.W. Role of arthropods in maintaining soil fertility. Agriculture 2013, 3, 629–659. [Google Scholar] [CrossRef]
  32. De Vries, F.T.M.; Thébault, E.; Liiri, M.; Birkhofer, K.; Tsiafouli, M.A.; Bjørnlund, L.; Bracht Jørgensen, H.; Brad, M.V.; Christensen, S.; de Ruiter, P.C.; et al. Soil food web properties explain ecosystem services across European land use systems. Proc. Natl. Acad. Sci. USA 2013, 110, 14296–14301. [Google Scholar] [CrossRef] [PubMed]
  33. Wagg, C.; Bender, S.F.; Widmer, F.; Van Der Heijden, M.G. Soil biodiversity and soil community composition determine ecosystem multifunctionality. Proc. Natl. Acad. Sci. USA 2014, 111, 5266–5270. [Google Scholar] [CrossRef]
  34. Bedano, J.C.; Domínguez, A.; Arolfo, R.; Wall, L.G. Effect of Good Agricultural Practices under no-till on litter and soil invertebrates in areas with different soil types. Soil Tillage Res. 2016, 158, 100–109. [Google Scholar] [CrossRef]
  35. Sjursen, H.; Holmstrup, M. Direct measurement of ammonium excretion in soil microarthropods. Funct. Ecol. 2004, 18, 612–615. [Google Scholar] [CrossRef]
  36. Maaß, S.; Caruso, T.; Rillig, M.C. Functional role of microarthropods in soil aggregation. Pedobiologia 2015, 58, 59–63. [Google Scholar] [CrossRef]
  37. Neher, D.; Barbercheck, M. Soil Microarthropods and Soil Health: Intersection of decomposition and pest suppression in agroecosystems. Insects 2019, 10, 414. [Google Scholar] [CrossRef]
  38. Van Straalen, N.M. Evaluation of bioindicator systems derived from soil arthropod communities. Appl. Soil Ecol. 1998, 9, 429–437. [Google Scholar] [CrossRef]
  39. Cortet, J.; Gomot-De Vauflery, A.; Poinsot-Balaguer, N.; Gomot, L.; Texier, C.; Cluzeau, D. The use of invertebrate soil fauna in monitoring pollutant effects. Eur. J. Soil Biol. 1999, 35, 115–134. [Google Scholar] [CrossRef]
  40. Parisi, V.; Menta, C.; Gardi, C.; Jacomini, C.; Mozzanica, E. Microarthropod communities as a tool to assess soil quality and biodiversity: A new approach in Italy. Agric. Ecosyst. Environ. 2005, 105, 323–333. [Google Scholar] [CrossRef]
  41. De Goede, R.G.M.; Brussaard, L. Soil zoology: An indispensable component of integrated ecosystem studies. Eur. J. Soil Biol. 2001, 38, 1–6. [Google Scholar] [CrossRef]
  42. Duelli, P.; Obrist, M.K. Regional biodiversity in an agricultural landscape: The contribution of seminatural habitat islands. Basic Appl. Ecol. 2003, 4, 129–138. [Google Scholar] [CrossRef]
  43. Van Straalen, N.M. The use of soil invertebrates in ecological survey of contaminated soils. In Vital Soil: Function, Value and Properties; Doelman, P., Eijsackers, H.J.P., Eds.; Elsevier: Amsterdam, The Netherlands, 2004; pp. 159–194. [Google Scholar]
  44. Cole, L.; Bradford, M.A.; Shaw, P.J.; Bardgett, R.D. The abundance, richness and functional role of soil meso-and macrofauna in temperate grassland—A case study. Appl. Soil Ecol. 2006, 33, 186–198. [Google Scholar] [CrossRef]
  45. Menta, C.; Leoni, A.; Bardini, M.; Gardi, C.; Gatti, F. Nematode and microarthropod communities: Comparative use of soil quality bioindicators in covered dump and natural soils. Environ. Bioindic. 2008, 3, 35–46. [Google Scholar] [CrossRef]
  46. Blocksom, K.A.; Johnson, B.R. Development of a regional macroinvertebrate index for large river bioassessment. Ecol. Indic. 2009, 9, 313–328. [Google Scholar] [CrossRef]
  47. Baldigo, B.P.; Lawrence, G.B.; Bode, R.W.; Simonin, H.A.; Roy, K.M.; Smith, A.J. Impacts of acidification on macroinvertebrate communities in streams of the western Adirondack Mountains, New York, USA. Ecol. Indic. 2009, 9, 226–239. [Google Scholar] [CrossRef]
  48. Tabaglio, V.; Gavazzi, C.; Menta, C. Physico-chemical indicators and microarthropod communities as influenced by no-till, conventional tillage and nitrogen fertilisation after four years of continuous maize. Soil Tillage Res. 2009, 105, 135–142. [Google Scholar] [CrossRef]
  49. Cluzeau, D.; Guernion, M.; Chaussod, R.; Martin-Laurent, F.; Villenave, C.; Cortet, J.; Camacho-Ruiz, N.; Perpin, C.; Mateille, T.; Philippot, L.; et al. Integration of biodiversity in soil quality monitoring: Baselines for microbial and soil fauna parameters for different land-use types. Eur. J. Soil Biol. 2012, 49, 63–72. [Google Scholar] [CrossRef]
  50. Testi, A.; Fanelli, G.; Crosti, R.; Castigliani, V.; D’Angeli, D. Characterizing river habitat quality using plant and animal bioindicators: A case study of Tirino River (Abruzzo Region, Central Italy). Ecol. Indic. 2012, 20, 24–33. [Google Scholar] [CrossRef]
  51. Yan, S.; Singh, A.N.; Fu, S.; Liao, C.; Wang, S.; Li, Y.; Cui, Y.; Hu, L. A soil fauna index for assessing soil quality. Soil Biol. Biochem. 2012, 47, 158–165. [Google Scholar] [CrossRef]
  52. Visioli, G.; Menta, C.; Gardi, C.; Conti, F.D. Metal toxicity and biodiversity in serpentine soils: Application of bioassay tests and microarthropod index. Chemosphere 2013, 90, 1267–1273. [Google Scholar] [CrossRef] [PubMed]
  53. Hishi, T.; Fujimaki, R.; McGonigle, T.P.; Takeda, H. Relationships among fine roots, fungal hyphae and soil microarthropods among different soil microhabitats in a temperate coniferous forest of Chmaecyparis obtusa. Eur. J. Soil Biol. 2008, 44, 473–477. [Google Scholar] [CrossRef]
  54. Persson, T. Role of soil animals in C and N mineralisation. Plant Soil 1989, 115, 241–245. [Google Scholar] [CrossRef]
  55. Tomlin, A.D.; Protz, R. Soil faunal activity and soil microfabrics in sustainable cropping systems. Proc. Entomol. Soc. Ont. 1990, 121, 24–41. [Google Scholar]
  56. Kaczmarek, M.; Kajak, A.; Wasilewska, L. Interaction between diversity of grassland vegetation, soil fauna and decomposition processes. Acta Zool. Fenn. 1995, 196, 236–238. [Google Scholar]
  57. Wallwork, J.A. Distribution patterns and population dynamics of the micro-arthropods of a desert soil in southern California. J. Anim. Ecol. 1972, 291–310. [Google Scholar] [CrossRef]
  58. Parisi, V. The biological soil quality, a method based on microarthropods. Acta Nat. Aten. Parm. 2001, 37, 97–106. [Google Scholar]
  59. Ruf, A.; Beck, L.; Dreher, P.; Hund-Rinke, K.; Römbke, J.; Spelda, J. A biological classification concept for the assessment of soil quality: “biological soil classification scheme” (BBSK). Agric. Ecosyst. Environ. 2003, 98, 263–271. [Google Scholar] [CrossRef]
  60. Juan-Ovejero, R.; Benito, E.; Barreal, M.E.; Rodeiro, J.; Briones, M.J.I. Tolerance to fluctuating water regimes drives changes in mesofauna community structure and vertical stratification in peatlands. Pedobiologia 2019, 76, 150571. [Google Scholar] [CrossRef]
  61. Frampton, G.K. The potential of Collembola as indicators of pesticide usage: Evidence and methods from the UK arable ecosystem. Pedobiologia 1997, 41, 179–184. [Google Scholar]
  62. Ruf, A. A maturity index for predatory soil mites (Mesostigmata: Gamasina) as an indicator of environmental impacts of pollution on forest soils. Appl. Soil Ecol. 1998, 9, 447–452. [Google Scholar] [CrossRef]
  63. Marasas, M.E.; Sarandón, S.J.; Cicchino, A.C. Changes in soil arthropod functional group in a wheat crop under conventional and no tillage systems in Argentina. Appl. Soil Ecol. 2001, 18, 61–68. [Google Scholar] [CrossRef]
  64. Villenave, C.; Bongers, T.; Ekschmitt, K.; Djigal, D.; Chotte, J.L. Changes in nematode communities following cultivation of soils after fallow periods of different length. Appl. Soil Ecol. 2001, 17, 43–52. [Google Scholar] [CrossRef]
  65. Blakely, J.K.; Neher, D.A.; Spongberg, A.L. Soil invertebrate and microbial communities, and decomposition as indicators of polycyclic aromatic hydrocarbon contamination. Appl. Soil Ecol. 2002, 21, 71–88. [Google Scholar] [CrossRef]
  66. Gardi, C.; Tomaselli, M.; Parisi, V.; Petraglia, A.; Santini, C. Soil quality indicators and biodiversity in northern Italian permanent grasslands. Eur. J. Soil Biol. 2002, 38, 103–110. [Google Scholar] [CrossRef]
  67. Hadjicharalampous, E.; Kalburtji, K.L.; Mamolos, A.P. Soil Arthropods (Coleoptera, Isopoda) in Organic and Conventional Agroecosystems. Environ. Manag. 2002, 29, 683–690. [Google Scholar] [CrossRef]
  68. Huhta, V. Soil macroarthropod communities in planted birch stands in comparison with natural forests in central Finland. Appl. Soil Ecol. 2002, 20, 199–209. [Google Scholar] [CrossRef]
  69. Büchs, W.; Harenberg, A.; Zimmermann, J.; Weiß, B. Biodiversity, the ultimate agri-environmental indicator?: Potential and limits for the application of faunistic elements as gradual indicators in agroecosystems. Agric. Ecosyst. Environ. 2003, 98, 99–123. [Google Scholar] [CrossRef]
  70. Bedano, J.C.; Cantú, M.P.; Doucet, M.E. Soil springtails (Hexapoda: Collembola), symphylans and pauropods (Arthropoda: Myriapoda) under different management systems in agroecosystems of the subhumid Pampa (Argentina). Eur. J. Soil Biol. 2006, 42, 107–119. [Google Scholar] [CrossRef]
  71. Chauvat, M.; Wolters, V.; Dauber, J. Response of collembolan communities to land-use change and grassland succession. Ecography 2007, 30, 183–192. [Google Scholar] [CrossRef]
  72. Tabaglio, V.; Gavazzi, C.; Menta, C. The influence of no-till, conventional tillage and nitrogen fertilization on physico-chemical and biological indicators after three years of monoculture barley. Ital. J. Agron. 2008, 3, 233–240. [Google Scholar] [CrossRef]
  73. Aspetti, G.P.; Boccelli, R.; Ampollini, D.; Del Re, A.A.; Capri, E. Assessment of soil-quality index based on microarthropods in corn cultivation in Northern Italy. Ecol. Indic. 2010, 10, 129–135. [Google Scholar] [CrossRef]
  74. Andrés, P.; Moore, J.C.; Simpson, R.T.; Selby, G.; Cotrufo, F.; Denef, K.; Haddix, M.L.; Shaw, E.A.; de Tomasel, C.M.; Molowny-Horas, R.; et al. Soil food web stability in response to grazing in a semi-arid prairie: The importance of soil textural heterogeneity. Soil Biol. Biochem. 2016, 97, 131–143. [Google Scholar] [CrossRef]
  75. Hartley, W.; Dickinson, N.M.; Riby, P.; Shutes, B. Sustainable ecological restoration of brownfield sites through engineering or managed natural attenuation? A case study from Northwest England. Ecol. Eng. 2012, 40, 70–79. [Google Scholar] [CrossRef]
  76. Sapkota, T.B.; Mazzoncini, M.; Bàrberi, P.; Antichi, D.; Silvestri, N. Fifteen years of no till increase soil organic matter, microbial biomass and arthropod diversity in cover crop-based arable cropping systems. Agron. Sustain. Dev. 2012, 32, 853–863. [Google Scholar] [CrossRef]
  77. Gkisakis, V.; Volakakis, N.; Kollaros, D.; Bàrberi, P.; Kabourakis, E.M. Soil arthropod community in the olive agroecosystem: Determined by environment and farming practices in different management systems and agroecological zones. Agric. Ecosyst. Environ. 2016, 218, 178–189. [Google Scholar] [CrossRef]
  78. Ghiglieno, I.; Simonetto, A.; Orlando, F.; Donna, P.; Tonni, M.; Valenti, L.; Gilioli, G. Response of the Arthropod Community to Soil Characteristics and Management in the Franciacorta Viticultural Area (Lombardy, Italy). Agronomy 2020, 10, 740. [Google Scholar] [CrossRef]
  79. Menta, C.; Conti, F.D.; Lozano Fondón, C.; Staffilani, F.; Remelli, S. Soil Arthropod Responses in Agroecosystem: Implications of Different Management and Cropping Systems. Agronomy 2020, 10, 982. [Google Scholar] [CrossRef]
  80. Van Straalen, N.M.; Verhoef, H.A. The Development of a Bioindicator System for Soil Acidity Based on Arthropod pH Preferences. J. Appl. Ecol. 1997, 34, 217–232. [Google Scholar] [CrossRef]
  81. Ponge, J.F.; Gillet, S.; Dubs, F.; Fedoroff, E.; Haese, L.; Souza, J.P.; Lavelle, P. Collembolan communities as bioindicators of land use intensification. Soil Biol. Biochem. 2003, 35, 813–826. [Google Scholar] [CrossRef]
  82. Dunger, W.; Voigtländer, K. Soil fauna (Lumbricidae, Collembola, Diplopoda and Chilopoda) as indicators of soil eco-subsystem development in post-mining sites of eastern Germany–A review. Soil Org. 2009, 81, 1–51. [Google Scholar]
  83. Menta, C. Soil fauna diversity-function, soil degradation, biological indices, soil restoration. In Biodiversity Conservation and Utilization in a Diverse World; Lameed, G.A., Ed.; IntechOpen: London, UK, 2012; pp. 59–94. [Google Scholar]
  84. Faber, J.H.; Verhoef, H.A. Functional differences between closely-related soil arthropods with respect to decomposition processes in the presence or absence of pine tree roots. Soil Biol. Biochem. 1991, 23, 15–23. [Google Scholar] [CrossRef]
  85. Chikoski, J.M.; Ferguson, S.H.; Meyer, L. Effects of water addition on soil arthropods and soil characteristics in a precipitation-limited environment. Acta Oecol. 2006, 30, 203–211. [Google Scholar] [CrossRef]
  86. Elia, E.; Bianchi, A.; Ferrazzi, P.; Bergström, R.; Kjell Danell, K.; Chamberlain, D.E.; Persson, I.L. Impacts of moose (Alces alces) at different simulated densities on eco-morphological groups of soil mesofauna. Entomol. Fenn. 2010, 21, 168–180. [Google Scholar] [CrossRef]
  87. Moço, M.K.S.; Gama-Rodrigues, E.F.; Gama-Rodrigues, A.C.; Machado, R.C.; Baligar, V.C. Relationships between invertebrate communities, litter quality and soil attributes under different cacao agroforestry systems in the south of Bahia, Brazil. Appl. Soil Ecol. 2010, 46, 347–354. [Google Scholar] [CrossRef]
  88. Blasi, S.; Menta, C.; Balducci, L.; Conti, F.D.; Petrini, E.; Piovesan, G. Soil microarthropod communities from Mediterranean forest ecosystems in Central Italy under different disturbances. Environ. Monit. Assess. 2013, 185, 1637–1655. [Google Scholar] [CrossRef]
  89. Galli, L.; Capurro, M.; Menta, C.; Rellini, I. Is the QBS-ar index a good tool to detect the soil quality in Mediterranean areas? A cork tree Quercus suber L. (Fagaceae) wood as a case of study. Ital. J. Zool. 2014, 81, 126–135. [Google Scholar] [CrossRef]
  90. Rüdisser, J.; Tasser, E.; Peham, T.; Meyer, E.; Tappeiner, U. The dark side of biodiversity: Spatial application of the biological soil quality indicator (BSQ). Ecol. Ind. 2015, 53, 240–246. [Google Scholar] [CrossRef]
  91. Crossley, D.A., Jr.; Mueller, B.R.; Perdue, J.C. Biodiversity of microarthropods in agricultural soils: Relations to processes. Agric. Ecosyst. Environ. 1992, 40, 37–46. [Google Scholar] [CrossRef]
  92. Berry, N.A.; Wratten, S.D.; McErlich, A.; Frampton, C. Abundance and diversity of beneficial arthropods in conventional and organic carrot crops in New Zealand, New Zea. J. Crop Hort. 1996, 24, 307–313. [Google Scholar] [CrossRef]
  93. Reddersen, J. The arthropod fauna of organic versus conventional cereal fields in Denmark. Biol. Agric. Hortic. 1997, 15, 61–71. [Google Scholar] [CrossRef]
  94. Hole, D.G.; Perkins, A.J.; Wilson, J.D.; Alexander, I.H.; Grice, P.V.; Evans, A.D. Does organic farming benefit biodiversity? Biol. Conserv. 2005, 122, 113–130. [Google Scholar] [CrossRef]
  95. Mazzoncini, M.; Canali, S.; Giovannetti, M.; Castagnoli, M.; Tittarelli, F.; Antichi, D.; Nannelli, R.; Cristani, C.; Bàrberi, P. Comparison of organic and conventional stockless arable systems: A multidisciplinary approach to soil quality evaluation. Appl. Soil Ecol. 2010, 44, 124–132. [Google Scholar] [CrossRef]
  96. Simoni, S.; Nannelli, R.; Castagnoli, M.; Goggioli, D.; Moschini, V.; Vazzana, C.; Benedettelli, S.; Migliorini, P. Abundance and biodiversity of soil arthropods in one conventional and two organic fields of maize in stockless arable systems. Redia 2013, 96, 37–44. [Google Scholar]
  97. Chao, A.; Gotelli, N.J.; Hsieh, T.C.; Sander, E.L.; Ma, K.H.; Colwell, R.K.; Ellison, A.M. Rarefaction and extrapolation with Hill numbers: A framework for sampling and estimation in species diversity studies. Ecol. Monogr. 2014, 84, 45–67. [Google Scholar] [CrossRef]
  98. Chao, A.; Jost, L. Coverage-based rarefaction and extrapolation: Standardizing samples by completeness rather than size. Ecology 2012, 93, 2533–2547. [Google Scholar] [CrossRef]
  99. Menta, C.; Conti, F.D.; Pinto, S.; Bodini, A. Soil Biological Quality index (QBS-ar): 15 years of application at global scale. Ecol. Indic. 2018, 85, 773–780. [Google Scholar] [CrossRef]
  100. Ministero Delle Politiche Agricole Alimentari e Forestali. Approvazione dei “Metodi Ufficiali di Analisi Chimica del Suolo”. Gazz. Uff. Della Repubb. Ital. 1999, 248, 1–222. [Google Scholar]
  101. Schinner, F.; Öhlinger, R.; Kandeler, E.; Margesin, R. Methods in Soil Biology; Springer: Berlin/Heidelberg, Germany, 2012; p. 426. [Google Scholar]
  102. R Core Team. A Language and Environment for Statistical Computing; R Foundation for Statistical Computing: Vienna, Austria, 2020. [Google Scholar]
  103. Magurran, A.E. Ecological Diversity and its Measurement; Princeton University Press: Princeton, NJ, USA, 1988; pp. 1–192. [Google Scholar]
  104. Magurran, A.E. Measuring Biological Diversity; Wiley Blackwell: Oxford, UK, 2004; pp. 1–264. [Google Scholar]
  105. Chiu, C.H.; Chao, A. Distance-based functional diversity measures and their decomposition: A framework based on Hill numbers. PloS ONE 2020, 9, e100014. [Google Scholar] [CrossRef]
  106. Mantoni, C.; Tsafack, N.; Palusci, E.; Di Pietro, S.; Fattorini, S. Diversity Patterns of Dung Beetles along a Mediterranean Elevational Gradient. Insects 2021, 12, 781. [Google Scholar] [CrossRef]
  107. Hammer, O.; Harper, D.A.T.; Ryan, P.D. PAST: Paleontological statistics software package for education and data analysis. Palaeontol. Electron. 2001, 4, 9. [Google Scholar]
  108. Hansen, B.; Alrøe, H.F.; Kristensen, E.S. Approaches to assess the environmental impact of organic farming with particular regard to Demmark. Agric. Ecosyst. Environ. 2001, 83, 11–26. [Google Scholar] [CrossRef]
  109. Tóth, Z.; Hornung, E.; Dombos, M. Tea Bag method: A new possibility to assess impacts of agri-environmental measures on soil functioning. Hung. Agric. Eng. 2017, 2, 19–26. [Google Scholar]
  110. Alvarez, T.M.; Frampton, G.K.; Goulson, D. Epigeic Collembola in winter wheat under organic, integrated and conventional farm management regimes. Agric. Ecosyst. Environ. 2001, 83, 95–110. [Google Scholar] [CrossRef]
  111. Bengtsson, G.; Hedlund, K.; Rundgren, S. Food-and density-dependent dispersal: Evidence from a soil collembolan. J. Anim. Ecol. 1994, 63, 513–520. [Google Scholar] [CrossRef]
  112. Ghiglieno, I.; Simonetto, A.; Donna, P.; Tonni, M.; Valenti, L.; Bedussi, F.; Gilioli, G. Soil Biological Quality Assessment to Improve Decision Support in the Wine Sector. Agronomy 2019, 9, 593. [Google Scholar] [CrossRef]
  113. Caprio, E.; Nervo, B.; Isaia, M.; Allegro, G.; Rolando, A. Organic versus conventional systems in viticulture: Comparative effects on spiders and carabids in vineyards and adjacent forests. Agric. Syst. 2015, 136, 61–69. [Google Scholar] [CrossRef]
  114. Dubie, T.R.; Greenwood, C.M.; Godsey, C.; Payton, M.E. Effects of Tillage on Soil Microarthropods in Winter Wheat. Southwest. Entomol. 2011, 36, 11–20. [Google Scholar] [CrossRef]
  115. Peachey, R.E.; Moldenke, A.; William, R.D.; Berry, R.; Ingham, E.; Groth, E. Effect of cover crops and tillage system on symphylan (Symphlya: Scutigerella immaculata, Newport) and Pergamasus quisquiliarum Canestrini (Acari: Mesostigmata) populations, and other soil organisms in agricultural soils. Appl. Soil Ecol. 2002, 21, 59–70. [Google Scholar] [CrossRef]
  116. House, G.J.; Parmelee, R.W. Comparison of soil arthropods and earthworms from conventional and no-tillage agroecosystems. Soil Tillage Res. 1985, 5, 351–360. [Google Scholar] [CrossRef]
  117. Hendrix, P.F.; Parmelee, R.W.; Crossley, D.A.; Coleman, D.C.; Odum, E.P.; Groffman, P.M. Detritus food webs in conventional and no-tillage agroecosystems. Bioscience 1986, 36, 374–380. [Google Scholar] [CrossRef]
  118. Wardle, D.A. Impact of disturbance on detritus food-webs in agro-ecosystems of contrasting tillage and weed management practices. Adv. Ecol. Res. 1995, 26, 105–185. [Google Scholar]
  119. Garrett, C.J.; Crossley, D.A.; Coleman, D.C.; Hendrix, P.F.; Kisselle, K.W.; Potter, R.L. Impacts of the rhizosphere on soil microarthropods in agroecosystems on the Georgia piedmont. Appl. Soil Ecol. 2001, 16, 141–148. [Google Scholar] [CrossRef]
  120. Coleman, D.; Fu, S.; Hendrix, P.; Crossley, D., Jr. Soil foodwebs in agroecosystems: Impacts of herbivory and tillage management. Eur. J. Soil Biol. 2002, 38, 21–28. [Google Scholar] [CrossRef]
  121. Cortet, J.; Ronce, D.; Poinsot-Balaguer, N.; Beaufreton, C.; Chabert, A.; Viaux, P.; Cancela de Fonseca, P.J. Impacts of different agricultural practices on the biodiversity of microarthropod communities in arable crop systems. Eur. J. Soil Biol. 2002, 38, 239–244. [Google Scholar] [CrossRef]
  122. Ferraro, D.O.; Ghersa, C.M. Exploring the natural and human-induced effects on the assemblage of soil microarthropod communities in Argentina. Eur. J. Soil Biol. 2007, 43.2, 109–119. [Google Scholar] [CrossRef]
  123. Paoletti, M.G.; Sommaggio, D.; Favretto, M.R.; Petruzzelli, G.; Pezzarossa, B.; Barbafieri, M. Earthworms as useful bioindicators of agroecosystem sustainability in orchards and vineyards with different inputs. Appl. Soil Ecol. 1998, 10, 137–150. [Google Scholar] [CrossRef]
  124. Thiele-Bruhn, S.; Bloem, J.; de Vries, F.T.; Kalbitz, K.; Wagg, C. Linking soil biodiversity and agricultural soil management. Curr. Opin. Environ. Sustain. 2012, 4, 523–528. [Google Scholar] [CrossRef]
  125. Lindo, Z.; Winchester, N.N. Spatial and environmental factors contributing to patterns in arboreal and terrestrial oribatid mite diversity across spatial scales. Oecologia 2009, 160, 817–825. [Google Scholar] [CrossRef] [PubMed]
  126. Bowler, D.E.; Benton, T.G. Testing the interaction between environmental variation and dispersal strategy on population dynamics using a soil mite experimental system. Oecologia 2011, 166, 111–119. [Google Scholar] [CrossRef] [PubMed]
  127. Da Silva, P.M.; Berg, M.P.; Serrano, A.R.; Dubs, F.; Sousa, J. P Environmental factors at different spatial scales governing soil fauna community patterns in fragmented forests. Landsc. Ecol. 2012, 27, 1337–1349. [Google Scholar] [CrossRef]
  128. Da Silva, P.M.; Berg, M.P.; da Silva, A.A.; Dias, S.; Leitão, P.J.; Chamberlain, D.; Niemelä, J.; Serrano, A.R.M.; Sousa, J.P. Soil fauna through the landscape window: Factors shaping surface-and soil-dwelling communities across spatial scales in cork-oak mosaics. Landsc. Ecol. 2015, 30, 1511–1526. [Google Scholar] [CrossRef]
  129. Querner, P.; Bruckner, A.; Drapela, T.; Moser, D.; Zaller, J.G.; Frank, T. Landscape and site effects on Collembola diversity and abundance in winter oilseed rape fields in eastern Austria. Agric. Ecosyst. Environ. 2013, 164, 145–154. [Google Scholar] [CrossRef]
  130. Åström, J.; Bengtsson, J. Patch size matters more than dispersal distance in a mainland–island metacommunity. Oecologia 2011, 167, 747. [Google Scholar] [CrossRef]
  131. Chisholm, C.; Lindo, Z.; Gonzalez, A. Metacommunity diversity depends on connectivity and patch arrangement in heterogeneous habitat networks. Ecography 2011, 34, 415–424. [Google Scholar] [CrossRef]
  132. Ingimarsdóttir, M.; Caruso, T.; Ripa, J.; Magnúsdóttir, O.B.; Migliorini, M.; Hedlund, K. Primary assembly of soil communities: Disentangling the effect of dispersal and local environment. Oecologia 2012, 170, 745–754. [Google Scholar] [CrossRef]
  133. Ettema, C.H.; Wardle, D.A. Spatial soil ecology. Trends Ecol. Evol. 2002, 17, 177–183. [Google Scholar] [CrossRef]
  134. Berg, M.P.; Bengtsson, J. Temporal and spatial variability in soil food web structure. Oikos 2007, 116, 1789–1804. [Google Scholar] [CrossRef]
  135. Heiniger, C.; Barot, S.; Ponge, J.F.; Salmon, S.; Botton-Divet, L.; Carmignac, D.; Dubs, F. Effect of habitat spatiotemporal structure on collembolan diversity. Pedobiologia 2014, 57, 103–117. [Google Scholar] [CrossRef]
  136. Grandi, C.; Triantafyllidis, A. Organic Agriculture in Protected Areas: The Italian Experience; Natural Resources Management and Environment Department; Food and Agriculture Organization of the United Nations: Rome, Italy, 2010; pp. 1–29. [Google Scholar]
  137. Hufbauer, R.A.; Szűcs, M.; Kasyon, E.; Youngberg, C.; Koontz, M.J.; Richards, C.; Melbourne, B.A. Three types of rescue can avert extinction in a changing environment. Proc. Natl. Acad. Sci. USA 2015, 112, 10557–10562. [Google Scholar] [CrossRef] [PubMed]
  138. Eriksson, A.; Elías-Wolff, F.; Mehlig, B.; Manica, A. The emergence of the rescue effect from explicit within-and between-patch dynamics in a metapopulation. Proc. R. Soc. B. 2014, 281, 20133127. [Google Scholar] [CrossRef] [PubMed]
  139. Van Schmidt, N.D.; Beissinger, S.R. The rescue effect and inference from isolation–Extinction relationships. Ecol. Lett. 2020, 23, 598–606. [Google Scholar] [CrossRef]
  140. Tuomisto, H. A diversity of beta diversities: Straightening up a concept gone awry. Part 2. Quantifying beta diversity and related phenomena. Ecography 2010, 33, 23–45. [Google Scholar] [CrossRef]
  141. Andrén, O.; Lagerlöf, J. Soil fauna (microarthropods, enchytraeids, nematodes) in Swedish agricultural cropping systems. Acta Agric. Scand. 1983, 33, 33–52. [Google Scholar] [CrossRef]
  142. Lavelle, P.; Chauvel, A.; Fragoso, C. Faunal activity in acid soils. In Plant-Soil Interactions at Low pH: Principles and Management. Developments in Plant and Soil Sciences; Date, R.A., Grundon, N.J., Rayment, G.E., Probert, M.E., Eds.; Springer: Dordrecht, The Netherlands, 1995; Volume 64, pp. 201–211. [Google Scholar]
  143. Kautz, T.; López-Fando, C.; Ellmer, F. Abundance and biodiversity of soil microarthropods as influenced by different types of organic manure in a long-term field experiment in Central Spain. Appl. Soil Ecol. 2006, 33, 278–285. [Google Scholar] [CrossRef]
  144. Salmon, S.; Artuso, N.; Frizzera, L.; Zampedri, R. Relationships between soil fauna communities and humus forms: Response to forest dynamics and solar radiation. Soil Biol. Biochem. 2008, 40, 1707–1715. [Google Scholar] [CrossRef]
  145. Shakir, M.M.; Ahmed, S. Seasonal abundance of soil arthropods in relation to meteorological and edaphic factors in the agroecosystems of Faisalabad, Punjab, Pakistan. Int. J. Biometeorol. 2015, 59, 605–616. [Google Scholar] [CrossRef]
  146. Potapov, A.; Goncharov, A.; Semenina, E.; Korotkevich, A.; Tsurikov, S.; Rozanova, O.; Anichkin, A.; Zuev, A.; Samoylova, E.; Semenyuk, I.; et al. Arthropods in the subsoil: Abundance and vertical distribution as related to soil organic matter, microbial biomass and plant roots. Eur. J. Soil Biol. 2017, 82, 88–97. [Google Scholar] [CrossRef]
  147. Begum, F.; Bajracharya, R.M.; Sharma, S.; Sitaula, B.K. Influence of slope aspect on soil physico-chemical and biological properties in the mid hills of central Nepal. Int. J. Sustain. Dev. World Ecol. 2010, 17, 438–443. [Google Scholar] [CrossRef]
  148. Kanal, A. Effects of fertilisation and edaphic properties on soil-associated Collembola in crop rotation. Agron. Res. 2004, 2, 153–168. [Google Scholar]
  149. Brussaard, L.; Van Faassen, H.G. Effects of compaction on soil biota and soil biological processes. In Soil Compaction in Crop Production; Soane, B.D.D., Van Ouwerkerk, C., Eds.; Elsevier: Amsterdam, The Netherlands, 1994; pp. 215–235. [Google Scholar]
  150. Müller, G.; Rauhe, K. Zur Tiefkultur auf leichten Böden im besonderen Hinblick auf die Bodenbiologie. Z. Acker. Pflanzenbau 1959, 109, 309–322. [Google Scholar]
  151. Rusco, E.; Montanarella, L.; Bosco, C. Soil erosion: A main threats to the soils in Europe. In Threats to Soil Quality in Europe; No. EUR 23438 EN in EUR—Scientific and Technical Research Series; Tóth, G., Montanarella, L., Rusco, E., Eds.; Office for Official Publications of the European Communities: Luxemburg, 2008; pp. 37–45. [Google Scholar]
  152. Tylianakis, J.M.; Didham, R.K.; Bascompte, J.; Wardle, D.A. Global change and species interactions in terrestrial ecosystems. Ecol. Lett. 2008, 11, 1351–1356. [Google Scholar] [CrossRef] [PubMed]
  153. Imadi, S.R.; Shah, S.W.; Kazi, A.G.; Azooz, M.M.; Ahmad, P. Phytoremediation of Saline Soils for Sustainable Agricultural Productivity. In Plant Metal Interaction; Ahmad, P., Ed.; Elsevier: Amsterdam, The Netherlands, 2016; pp. 455–468. [Google Scholar]
  154. Bronick, C.J.; Lal, R. Soil structure and management: A review. Geoderma 2005, 124, 3–22. [Google Scholar] [CrossRef]
  155. Zhang, X.; Norton, L. Effect of exchangeable Mg on saturated hydraulic conductivity, disaggregation and clay dispersion of disturbed soils. J. Hydrol. 2002, 260, 194–205. [Google Scholar] [CrossRef]
  156. Zimdahl, R.L. Six Chemicals That Changed Agriculture; Academic Press: Cambridge, MA, USA, 2015; pp. 1–216. [Google Scholar]
Figure 1. Box plots (median, quartiles, ranges and outliers) comparing values of (a) soil biology quality (QBS-ar), (b) soil biology quality weighted by abundance (QBS-ab), (c) total arthropod abundance, (d) arthropod richness, (e) Shannon diversity, and (f) Simpson diversity between biological and conventional fields in central Italy. Park indicates whether the field was inside (in) or outside (out) a protected area. Differences between organic and conventional fields were significant in all cases except for the Shannon index; differences between parks within and outside protected areas were significant for QBS-ar, QBS-ab, abundance, and richness but not for Shannon and Simpson indices (see Table 1).
Agriculture 11 01022 g001
Figure 2. Soil arthropod diversity profiles for organically (green) and conventionally (blue) managed fields in central Italy obtained by using Hill numbers.
Agriculture 11 01022 g002
Figure 3. Ordination of soil samples by non-metric multidimensional scaling with Bray–Curtis dissimilarity index based on arthropod abundances. Stress = 0.078. Cin = conventional sites within protected areas; Cout = conventional sites outside protected areas; Oin = organic sites within protected areas; Out = organic sites outside protected areas. Codes in parentheses identify samples as in Table S2. Arrows indicate correlations with soil characteristics: organic matter, pH, % sand, % silt, humic and fulvic acids, ammoniacal nitrogen, nitric nitrogen, assimilable phosphorus, calcium (Ca), magnesium (Mg), potassium (K), and sodium (Na).
Agriculture 11 01022 g003
Table 1. Results of generalised linear mixed models for soil biology quality (QBS-ar), soil biology quality weighted by abundance (QBS-ab), total arthropod abundance, arthropod richness, Shannon diversity, and Simpson diversity in organic and conventional fields in central Italy with different crops. Park indicates whether the field was inside or outside a protected area: Df = degrees of freedom; P = probability. Goodness-of-fit (R2) values were calculated including the random effect (sites nested into geographical areas; R2c) and for the fixed factors (R2m). Values of Moran’s I and respective P-values testing for occurrence of significantly spatially autocorrelated residuals are also provided.
QBS-arQBS-ab
χ2DfPχ2DfP
Management5.50610.0197.53910.006
Park12.0241<0.000111.7351<0.001
Crop40.2606<0.000128.7496<0.0001
R2c = 0.80 R2m = 0.740;
I = −0.082, P = 0.839
R2c = 0.83 R2m = 0.700;
I = −0.051, P = 0.666
AbundanceRichness
χ2DfPχ2DfP
Management5.50610.0197.53910.006
Park12.0241<0.000111.7351<0.001
Crop40.2606<0.000128.7496<0.0001
R2c = 0.999, R2m = 0.890;
I = −0.100, P = 0.911
R2c = 0.519, R2m = 0.519;
I = −0.077, P = 0.811
Shannon IndexSimpson Index
χ2DfPχ2DfP
Management2.27510.1324.80410.028
Park2.60110.1072.44810.115
Crop61.1296<0.000123.4696<0.001
R2c = 0.810, R2m = 0.540;
I = −0.095, P = 0.887
R2c = 0.770, R2m = 0.560;
I = −0.085, P = 0.851
Table 2. Correlations between QBS indices, diversity indices, abundance, and soil characteristics. * = P < 0.05, ** = P < 0.01, *** = P < 0.001. In all correlations, n = 36.
QBS-arQBS-abShannon IndexSimpson IndexRichnessAbundance
QBS-ar 0.919 ***0.387 *0.1730.924 ***0.721 ***
QBS-ab 0.452 **0.2600.843 ***0.817 ***
Shannon index 0.943 ***0.3050.072
Simpson index −0.029
Richness 0.769 ***
Organic substance−0.300−0.101−0.0280.109−0.352 *−0.023
pH0.1880.025−0.110−0.2070.254−0.015
Sand0.338 *0.419 *0.1870.2060.463 **0.552 ***
Silt−0.119−0.1390.2480.298−0.188−0.169
Humic acids0.0330.1940.0160.0920.0060.264
Ammoniac nitrogen−0.249−0.303−0.101−0.075−0.286−0.297
Nitric nitrogen−0.429 **−0.3260.0230.084−0.420 *−0.364 *
Phosphorus−0.438 **−0.400 *0.426 **0.533 ***−0.472 ***−0.572 ***
Calcium0.0790.083−0.230−0.2870.1710.172
Magnesium−0.563 ***−0.576 ***−0.372 *−0.350 *−0.604 ***−0.644 ***
Potassium−0.441 **−0.423 **−0.244−0.152−0.449 **−0.350 *
Sodium−0.174−0.172−0.004−0.027−0.335 *−0.371 *
Publisher’s Note: MDPI stays neutral with regard to jurisdictional claims in published maps and institutional affiliations.

