1. Introduction
The quality of milk is directly related to its composition [
1,
2]. At present, there are no ready-made systems that provide simultaneous measurement of all milk components. Farms usually send milk samples to specialized laboratories for a comprehensive analyses of milk quality. The express analysis of milk and the determination of all its quality parameters are also important for the milk processing industry, since the supply of milk that is already separated by fat content and other parameters would reduce the time and financial costs of milk sorting. Rapid control of milk quality is important for prompt reaction to deviations of the physiological state of animals and for timely correction of food rations in the case of milk yield decrease.
Methods of non-destructive diagnostics of micro- and nanostructures of liquid dispersed systems are increasingly used for technological control in many industries. One of the main requirements for the automation of processes in the food industry is the need for a permanent assessment of the composition and physical properties of liquids and their mixtures at the most important stages of processing. However, the determination of the physical characteristics of food products using traditional monitoring methods is difficult if the analyzed product is in a polydisperse state, i.e., contains particles of various sizes and shapes. On the basis of optical methods, it is possible to develop reliable and universal sensors for non-invasive monitoring of the composition of products in real time.
Currently, the accurate measurements of the concentration of milk components are performed, for example, using systems based on transmission/reflection of infrared radiation, which stand out due to high cost. Therefore, a less expensive system for measuring both fat and protein content, compact and easy to calibrate, combined with an increased level of accuracy, would have advantages in terms of reducing milk processing costs and improving quality control.
Techniques based on measuring the characteristics of light scattering (scatterometry) are a promising direction in the development of such systems. For example, the work in [
3] reports on the development of inexpensive fiber sensors that measure backscattering (diffuse reflection) of multiple scattering liquids. Crofcheck et al. argue that similar sensors can be used to determine the content of milk fat in skim milk [
4]. However, these studies did not take into account the change in the state of polarization upon scattering in a medium.
A method that measures changes in the polarization of scattered light in addition to the intensity of scattered light can provide additional information about the scattering particles and improve the accuracy of determining their microphysical parameters (for example, particle size). In particular, the angular dependences of the elements of the light scattering matrix (LSM) describing such a change in the of polarization state of light scattered by the dispersed medium make it possible to determine the number and size distribution of particles, as well as to distinguish solid particles from clusters consisting of smaller particles.
A technique that measures changes in the polarization of scattered light, in addition to the light scattering intensity, can provide additional information about the scattering particles and improve the accuracy of determining their microphysical parameters (for example, particle size). In particular, the angular dependences of the elements of the light scattering matrix (LSM) describing such a change in the of polarization state of light scattered by the dispersed medium and make it possible to determine the number and size distribution of particles, as well as to distinguish solid particles from clusters consisting of smaller particles. As follows from the literature, the LSM method, which is also called laser polarimetric scatterometry (LPS) or Mueller matrix scatterometry (MMS), can be used to analyze various mineral and bioorganic dispersed systems [
5,
6,
7,
8,
9,
10,
11,
12,
13,
14,
15,
16]. It should be noted that an attempt to empirically determine milk fat by measuring the LSM of diluted milk samples was made in [
5]. However, the inverse scattering problem was not solved to additionally determine the protein content.
Regarding the application of LPS to the analysis of milk composition, the light scattering theory implies that it has the potential to simultaneously determine the parameters of two dispersed components in milk, specifically fat and protein, since the structural model of their particles is initially known. We assume that different types of scattering particles of milk (fat and protein) make independent contributions to the measured elements of LSM. This assumption is acceptable under single-scattering conditions, which are achieved by appropriate dilution of milk samples. In our work, we experimentally tested the analytical capabilities of the method, and also offered an algorithm for solving the inverse scattering problem to reconstruct the size histograms and then determine the percentage of both fat and protein.
2. Materials and Methods
2.1. Milk Sample Preparation
For testing the ability of laser polarimetric scatterometry (LPS) to analyze milk composition, we experimented with a series of cow milk samples with a nominal fat percentage of 0.05%, 1.5%, 2.5% and 3.5–4.5% commercially produced using ultra-high-temperature (UHT) pasteurization and homogenization. Protein content was reported as 3.1 g per 100 g of product for all of these milk samples. In preparation for measurements, we subjected milk samples to 1000-fold dilution by volume with purified water obtained using a Milli-Q Integral 5 (Merck Millipore, Molsheim, France) with a pH of 5.5 under normal conditions. The degree of dilution was chosen by the need for the single scattering of light from dispersed particles in milk, which, in its original form without dilution, is a multiple scattering medium. Diluted samples from this set of milk fat were studied by LPS using the setup described in detail in [
17]. The LPS setup with the laser wavelength 532 nm (second harmonic of diode-laser pumped Nd: YAG laser) is capable of measuring the full scattering matrix (also called Mueller matrix) as a function of the scattering angle for a 40 mL liquid sample placed in a cylindrical glass cuvette with a diameter of 40 mm.
2.2. LPS Method
The gist of the LPS method is in the sensitivity of the light scattering matrix (LSM) to dispersed milk components. For a macroscopically isotropic medium that contains identical numbers of randomly oriented scatterers and their mirror-symmetric counterparts, LSM
(4 × 4) has a block-diagonal form [
18,
19]
where
,
. For spherical particles,
,
,
,
, thus only four elements are independent. The dependence of element
on the scattering angle
describes the scattering indicatrix of nonpolarized radiation.
As is known, fat globules in milk range from 0.1 to 15 μm in diameter [
20,
21]. Primary casein micelles are spherical with a size of about 10 nm. They tend to aggregate into secondary micelles, forming casein clusters that have a close packing with a size of about 100 nm [
22,
23]. As follows from the scattering theory [
19], the clusters of densely packed spheres also have block-diagonal LSM.
To analyze the disperse composition, the measured LSM is represented as a weighted sum of the theoretical scattering matrices calculated for model particles with different sizes. The values of the corresponding weights that ensured a minimum of mean square deviations of the theoretical and experimental data determined the sought particle size distribution. In measurements of LSM, a dilution of milk samples is necessary to provide a single scattering mode, so that the representation of the measured LSM as a linear combination of LSM calculated for individual particles would be valid.
2.3. Retreiving the Size Distirbution
To reconstruct the particle size distribution, the elements of experimental scattering matrix
were represented as the sums of contributions from particles of various types [
15]:
where
is a value of the scattering angle from a measured set
,
is the coefficient of the contribution into the scattering matrix from the particles of p-type,
is the scattering cross section of p-type particles, and
are the matrix elements of the p-type particles. The LSMs for particles of each type were calculated within the framework of the model of spherical scatterers.
The contribution coefficients
for particles of various types were determined, providing a minimum for the sum of squares of the deviations of the theoretical matrix elements (2) from the experimental ones
:
where for all elements except
, the deviations are defined as:
where
is the measurement error of the matrix element. For
, the deviation is defined as:
The Levenberg–Marquardt algorithm [
24] was used to determine the values of the contribution coefficients
that ensure the minimum of the function. The array of
values gives us a size histogram through which the fat and protein contents of the milk sample can be calculated.
The restoration of the size histogram was carried out by choosing 28 size channels; each channel is associated with a specific type of particles considered in the expansion (2): 1–20 channels are spheres (fat globules with relative refractive index
= 1.10) and
varies in the channel from 0.05 μm (1st channel is limited to 0.05–0.0646 μm) to 8.34 μm (20th channel is limited to 6.46–8.34 μm). Channels 21–28 are aggregates (casein micelles with relative refractive index
= 1.18); the sizes of aggregates vary from
= 34 nm (gyration radius
= 35 nm) in the 28th channel to
= 204.8 nm (gyration radius
= 238 nm) in the 21st channel. The size of an aggregate of spherical monomers
is defined as the radius of a sphere of equivalent volume:
where
is the number of monomers in the aggregate and
is the radius of the sphere, whose volume is equal to the volume of monomer.
It was assumed that the size of the casein monomers is
= 10 nm, and the fractal dimension is
= 2.8). The reconstruction was carried out from the sum of the squares of the deviations of the experimental and theoretical values of the three elements
,
,
in the range of scattering angles 25–160°. The scattering matrices of model particles (for spheres) were calculated using the program that is based on the T-matrix method developed by Mishchenko [
18] for an ensemble of randomly oriented spheroids.
In the calculations, the values of the elements
,
of the casein aggregates were assumed to be equal to the corresponding values of the elements of the Rayleigh matrix due to their small difference for the aggregates with monomer sizes much smaller than the wavelength [
16]. The values of the element
and the scattering cross sections of casein aggregates were calculated in the Rayleigh–Gans–Debye approximation, which is valid under the conditions:
where
is the size parameter of the monomer.
2.4. Determination of the Fat and Protein Content
The particle size distributions can be used to calculate the content of fat and protein in the milk. Define the fat of milk as:
is the average mass of one fat particle,
is the number of fat particles in the scattering volume,
is the volume number density of fat particles in the scattering volume
.
is the fat density (assume that
= 0.9225 g/cm
3) [
25].
The fraction of the fat particles with a radius
ri is:
is the contribution coefficient of the fat particles with radius
ri to the total amount of scattering.
Similarly, the average mass of one protein particle is:
is the protein density (assume that
= 1.3398 g/cm
3) [
25].
The fraction of the protein particles with radius
ri is:
is the contribution coefficient of the protein particles with radius
ri to the total amount of scattering. The mass of the total protein in the scattering volume is:
is the average mass of one protein particle,
is the number of protein particles in the scattering volume, and
is the volume number density of protein particles in the scattering volume. The volume number density of both fat and protein particles can be expressed through the scattering coefficient [
6]:
is the experimental value of scattering intensity;
is the mean scattering cross section for one particle;
is the mean value of the element
;
and
are the scattering coefficient and scattering intensity of toluene, which is commonly used as a calibration fluid [
26];
and
are the refractive indices of toluene and solvent (in the case of milk, water).
Next, using the entire set of the contribution coefficients
from particles of all sorts (fat and protein):
We can calculate:
is the scattering cross section for the particles of the
i-th type.
The whole mass of milk is:
is the density of water;
,
are the average volumes of one particle of fat and protein, respectively, which can be calculated as:
Thus, to determine the content of fat and protein, it is necessary to obtain a size histogram for the milk sample.
3. Results
3.1. Scattering Matrix Measurements
In experiments, the block-diagonal elements of LSM
,
,
,
were measured as functions of the scattering angle in the range of scattering angles 15–160° for milk samples with a nominal fat percentage of 0.05%, 1.5%, 2.5%, 3.5–4.5%, diluted with water 1000 times by volume. The corresponding graphs of the angular dependences of the matrix elements are shown in
Figure 1. By
, we mean matrix elements
normalized to
(
). The absolute measurement error of the normalized matrix elements was 0.03.
As can be seen in
Figure 1, the angular profiles of the matrix elements exhibit a monotonic dependence on the fat content in milk in the following ranges of scattering angles: ~50–120° (
); ~40–120° (
); ~80–150° (
) и ~100–140° (
).
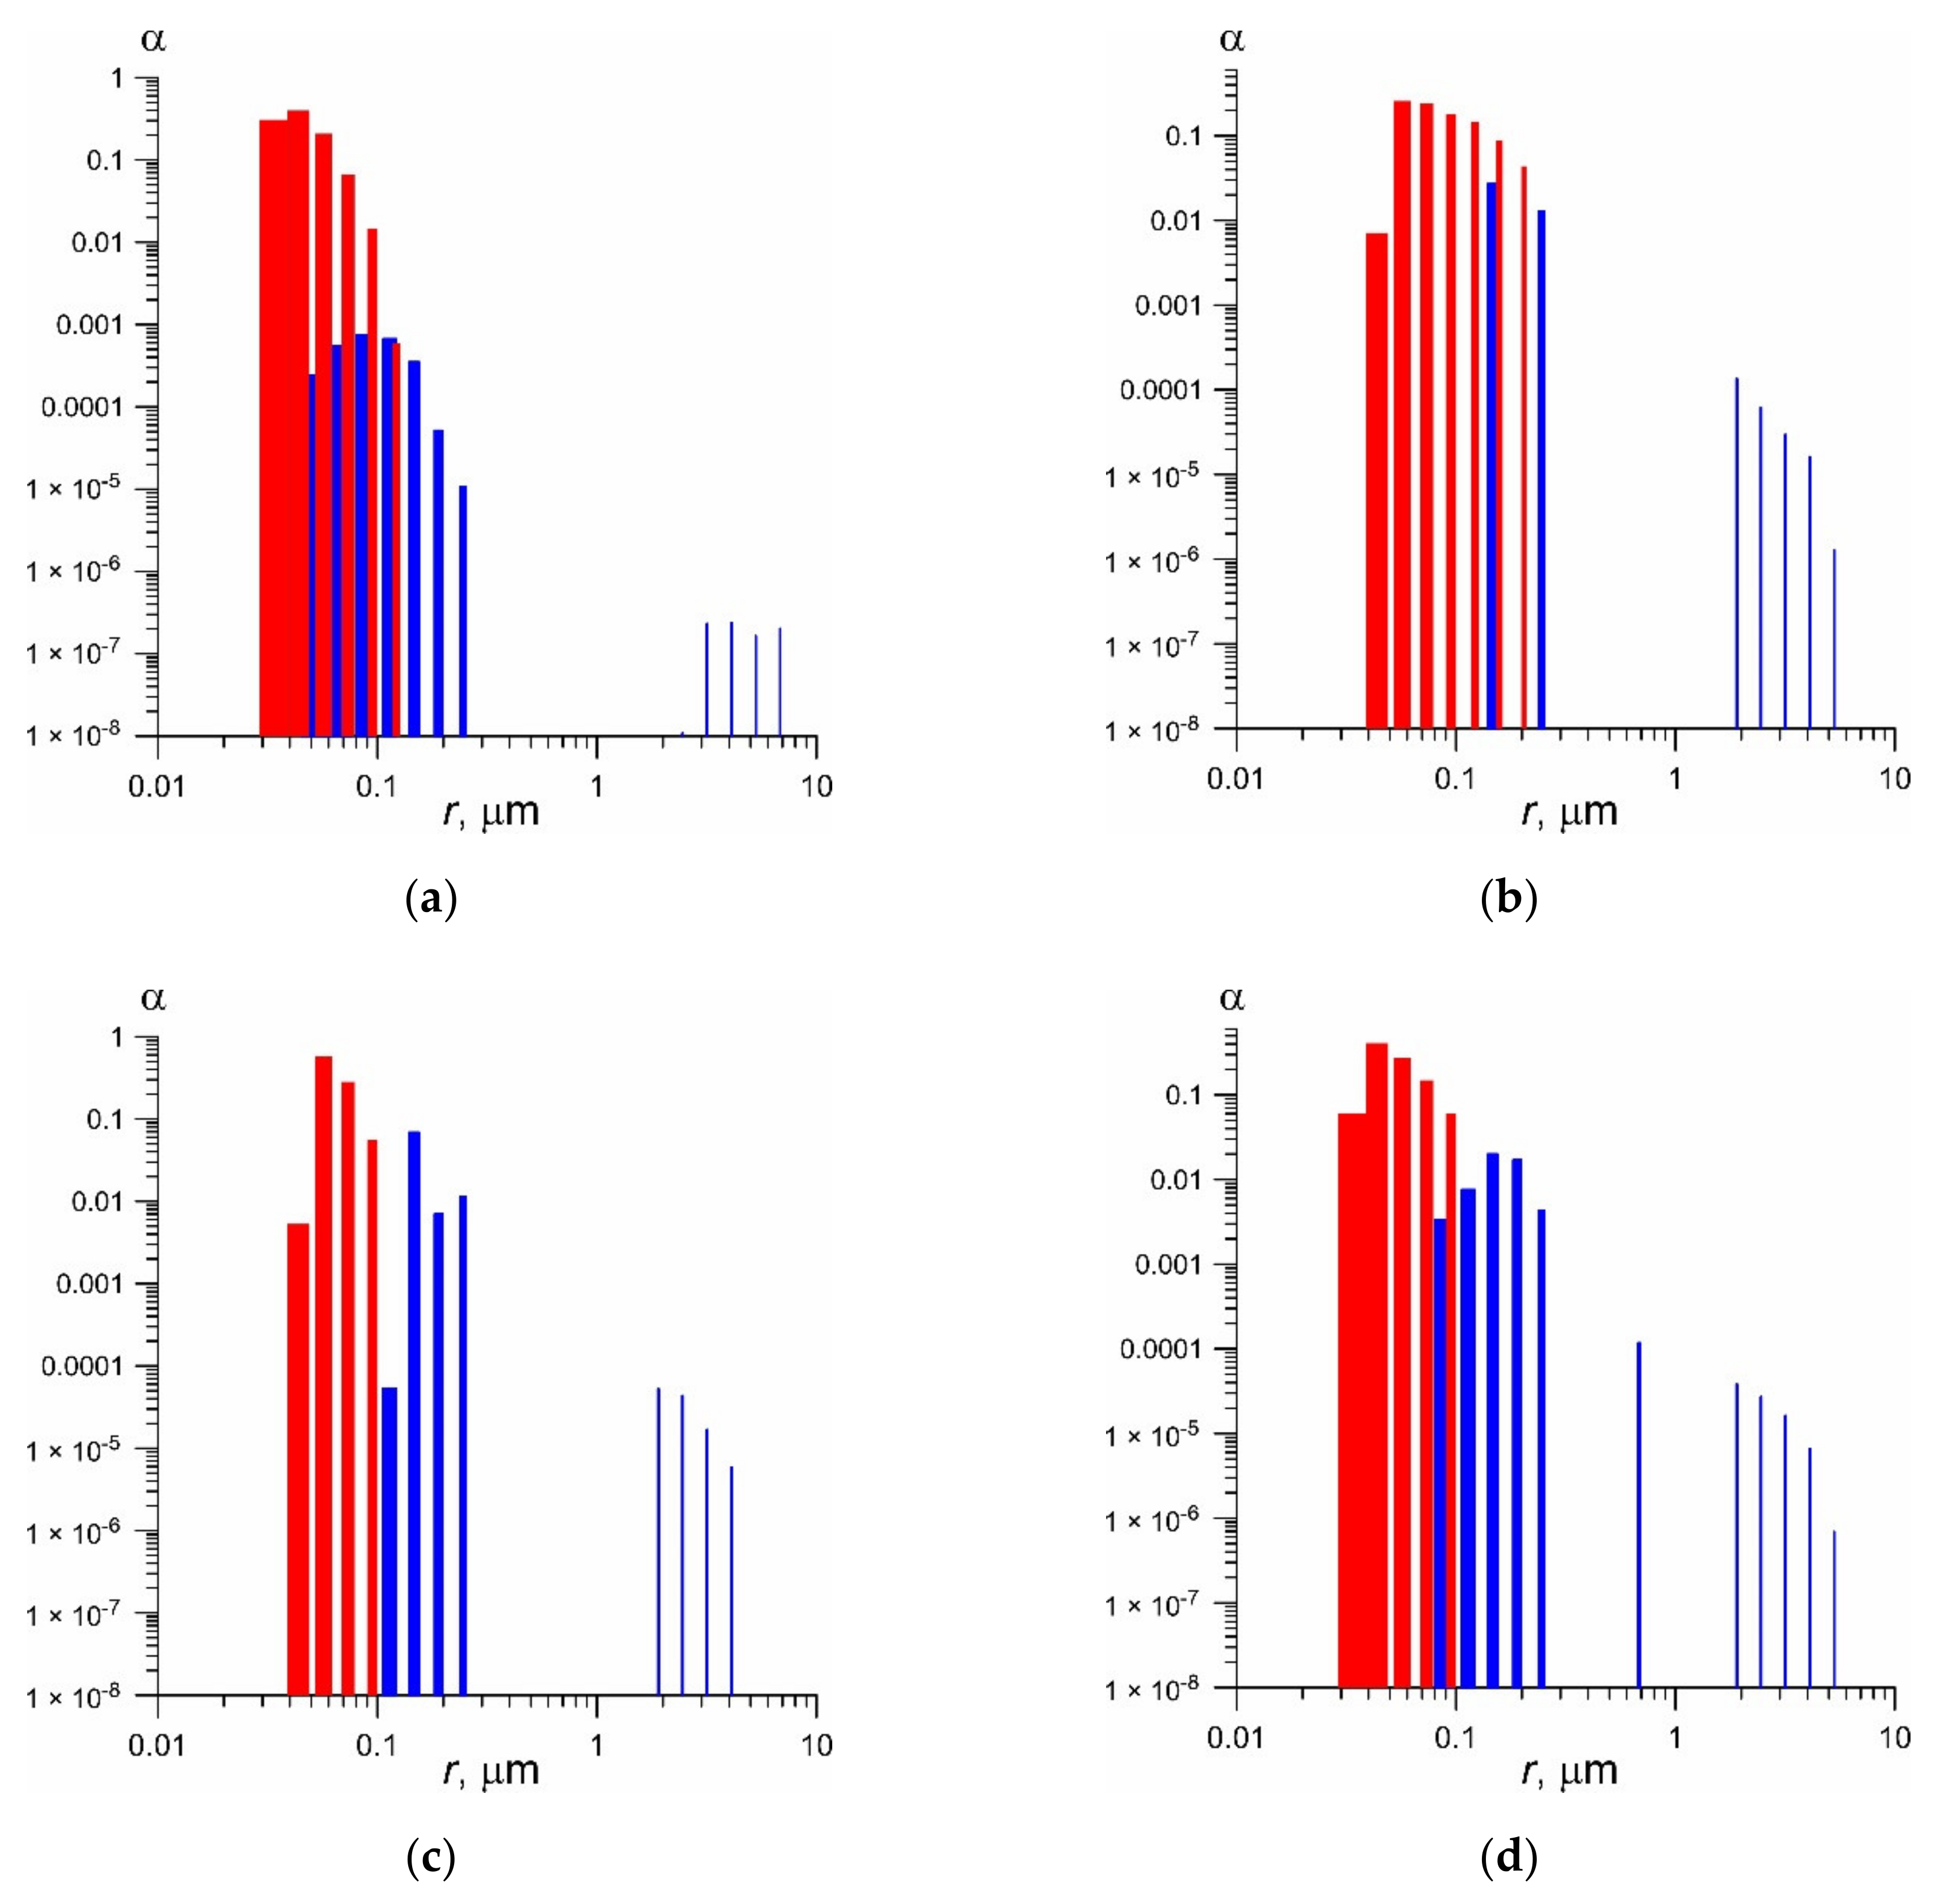
3.2. Particle Size Distributions
We reconstructed the particle distributions over sizes based on the scattering matrix data (
Figure 1) for cow milk with nominal fat percentages of 0.05, 1.5, 2.5 and 3.5–4.5%. The corresponding size histograms are shown in
Figure 2. In each of the graphs, the fractions of fat particles and casein aggregates are shown in different colors. Typical sizes of casein aggregates are 40–200 nm. Fat particles are characterized by the presence of large (2–7 microns) and small (60–200 nm) portions. The fraction of particles of the fine portion is small, amounting to 10
−6–10
−4.
Using the formulas given in
Section 1, the estimated fat content is equal to 0.002, 0.011, 0.024, and 0.042 and the estimated casein content is equal to 0.026, 0.030, 0.035, and 0.038 for cow milk with nominal fat percentages of 0.05, 1.5, 2.5 and 3.5–4.5%, respectively. The corresponding protein-to-fat ratio values are 13, 2.7, 1.5, and 1.1, respectively.
4. Discussion
The results of measurements of the light scattering matrix for samples of industrial cow milk with different fat content, diluted with water, showed that the values of the block-diagonal matrix elements change with a change in the fat content of the milk. Experimentally found differences in the values of matrix elements for milk samples with a nominal fat percentage of 0.05%, 1.5%, 2.5%, 3.5–4.5%, diluted with water 1000 times by volume, allow us to conclude that the LSM elements , , and are the most sensitive to fat content. The values of these elements can serve as a direct analytical signal in a fat content sensor analyzing diluted milk samples. In order to simultaneously determine the content of fat and protein, an algorithm for solving the inverse problem was developed.
The measured values of fat and protein percentage turned out to be close to nominal, except for low-fat milk (0.05%). The discrepancies between the manufacturer’s declared and the fat content determined experimentally can be explained by the indirect nature of the method used, namely: first, measuring the dependences on the scattering angle of matrix elements, then solving the inverse problem of retrieving the distribution of dispersed particles under the assumption that the dispersed medium is two-component, and, finally, the actual fat content calculation. In this case, of course, errors may arise due to errors in experimental measurements, the approximation of the used model of a dispersed medium, errors in the algorithm for solving the inverse problem and determining the volume concentration of particles. Improving the accuracy of the final result can be achieved by increasing the number of readings during experimental measurements and refining the model used to interpret them. This includes the possible consideration of the size distribution of monomers, the clarification of the size of the monomers in casein aggregates and the fractal dimension of aggregates, taking into account the non-sphericity of the shape of fat particles and Rayleigh scattering by water molecules.
The complexities of the problem to be solved for determining the fat content should include not only two (many) components of the dispersed medium, but also the bimodality of the distribution of fat particles (
Figure 2). Moreover, the number of larger particles (2–7 microns) is 2–4 orders of magnitude less than the number of smaller particles (70–200 nm), but nevertheless their contribution to the total scattering intensity is noticeable. The proposed approach allows us to take this circumstance into account and, in addition, to determine the content of casein in milk, and thus also assess the protein-to-fat ratio. It is worth noting that the size of the fat particles in the measured milk samples is rather small if compared with raw milk, where fat particles can reach a size of 100 microns. This fact is apparently related to milk homogenization.
Alternatively, it is possible to obtain the size distribution of dispersed particles by the method of dynamic light scattering (DLS) [
27] or from the measured scattering indicatrix solely. However, even in these cases, the correct determination of the milk fat alone requires an interpretation model of a multicomponent medium and solving the inverse scattering problem. Compared to the registration of only the scattering intensity or the correlation function, the registration of the polarization characteristics (the elements of the scattering matrix) can improve the accuracy of the solution of the inverse problem.
The experimental results obtained indicate that the LPS method is capable of determining the content of fat and casein in milk. In comparison, for example, with the DLS method [
27], the proposed method for solving the sample problem allows retrieving the individual contributions to the scattering intensity from fat and protein particles and does not require the extraction of these components from a milk sample. Thus, it is possible to determine at once the content of both of these components.
Although the proposed method for the measurement of the fat and protein content in milk involves sampling with dilution, the analysis of milk parameters itself takes a relatively short time within a minute, which allows this method to be classified as an express analysis. On the basis of the described measuring principle, it is possible to develop a compact and relatively fast sensor of fat and protein percentage, which could be in demand in dairy farms and dairy industries.
5. Conclusions
Our experimental tests showed that the laser polarimetric scatterometry is a promising technique for the development of convenient and inexpensive analyzers of milk composition for regular operation on dairy farms or milk processing lines.
Author Contributions
Conceptualization, A.V.S., S.V.G.; methodology, S.N.C., A.V.S.; validation, M.E.A., N.F.B.; formal analysis, S.N.C.; investigation, A.V.S., D.N.I., M.E.A. and S.N.C.; data curation, N.F.B.; writing—original draft preparation, A.V.S., S.N.C.; writing—review and editing, S.V.G., N.F.B.; visualization, D.N.I., S.N.C.; supervision, A.V.S.; project administration, S.V.G. All authors have read and agreed to the published version of the manuscript.
Funding
This work was supported by a grant of the Ministry of Science and Higher Education of the Russian Federation for large scientific projects in priority areas of scientific and technological development (grant number 075-15-2020-774).
Institutional Review Board Statement
Not applicable.
Informed Consent Statement
Not applicable.
Data Availability Statement
Not applicable.
Acknowledgments
The authors are grateful to the Center for Collective Use of the GPI RAS for the equipment provided.
Conflicts of Interest
The authors declare no conflict of interest.
References
- Harding, F. (Ed.) Milk Quality; Springer: Boston, MA, USA, 1995. [Google Scholar] [CrossRef]
- Griffiths, M.W. (Ed.) Improving the Safety and Quality of Milk: Milk Production and Processing; Elsevier Science & Technology: Cambridge, UK, 2010; Volume 1. [Google Scholar]
- Meeten, G.H.; Wood, P. Optical fiber methods for measuring the diffuse reflectance of fluids. Meas. Sci. Technol. 1993, 4, 643–648. [Google Scholar] [CrossRef]
- Crofcheck, C.L.; Payne, F.A.; Hicks, C.L.; Mengüç, M.P.; Nokes, S.E. Fiber optic sensor response to low levels of fat in skim milk. J. Food Process Eng. 2000, 23, 163–175. [Google Scholar] [CrossRef]
- Crofcheck, C.L.; Wade, J.; Swamy, J.N.; Aslan, M.M.; Mengüç, M.P. Effect of Fat and Casein Particles in Milk on the Scattering of Elliptically Polarized Light. Trans. Am. Soc. Agric. Eng. 2005, 48, 1147–1155. [Google Scholar] [CrossRef]
- Bunkin, N.F.; Shkirin, A.V.; Ninham, B.W.; Chirikov, S.N.; Chaikov, L.L.; Penkov, N.V.; Kozlov, V.A.; Gudkov, S.V. Shaking-Induced Aggregation and Flotation in Immunoglobulin Dispersions: Differences between Water and Water–Ethanol Mixtures. ACS Omega 2020, 5, 14689–14701. [Google Scholar] [CrossRef]
- Bunkin, N.F.; Glinushkin, A.P.; Shkirin, A.V.; Ignatenko, D.N.; Chirikov, S.N.; Savchenko, I.V.; Meshalkin, V.P.; Samarin, G.N.; Maleki, A.; Kalinitchenko, V.P. Identification of Organic Matter Dispersions Based on Light Scattering Matrices Focusing on Soil Organic Matter Management. ACS Omega 2020, 5, 33214–33224. [Google Scholar] [CrossRef]
- Juárez-Rivera, O.R.; Mauricio-Sánchez, R.A.; Järrendahl, K.; Arwin, H.; Mendoza-Galván, A. Shear-Coated Linear Birefringent and Chiral Cellulose Nanocrystal Films Prepared from Non-Sonicated Suspensions with Different Storage Time. Nanomaterials 2021, 11, 2239. [Google Scholar] [CrossRef] [PubMed]
- Zallat, J.; Stoll, M.P. Polarized bidirectional scattering by bare soils. J. Opt. A Pure Appl. Opt. 2000, 2, 169–178. [Google Scholar] [CrossRef]
- Ding, H.; Lu, J.Q.; Brock, R.S.; McConnell, T.J.; Ojeda, J.F.; Jacobs, K.M.; Hu, X.H. Angle-resolved Mueller matrix study of light scattering by B-cells at three wavelengths of 442, 633, and 850 nm. J. Biomed. Opt. 2007, 12, 034032. [Google Scholar] [CrossRef] [PubMed] [Green Version]
- Hadley, K.C.; Vitkin, I.A. Optical rotation and linear and circular depolarization rates in diffusively scattered light from chiral, racemic, and achiral turbid media. J. Biomed. Opt. 2002, 7, 291–299. [Google Scholar] [CrossRef] [PubMed]
- Bronk, B.V.; Li, Z.Z.; Czégé, J. Polarized light scattering as a rapid and sensitive assay for metal toxicity to bacteria. J. Appl. Toxicol. 2001, 21, 107–113. [Google Scholar] [CrossRef] [PubMed] [Green Version]
- Diaspro, A.; Radicchi, G.; Nicolini, C. Polarized Light Scattering: A biophisical Method for Studying Bacterial Cells. IEEE Trans. Biomed. Eng. 1995, 42, 1038–1042. [Google Scholar] [CrossRef] [PubMed]
- Liu, J.; Zhang, Q.; Huo, Y.; Wang, J.; Zhang, Y. An experimental study on light scattering matrices for Chinese loess dust with different particle size distributions. Atmos. Meas. Tech. 2020, 13, 4097–4109. [Google Scholar] [CrossRef]
- Chirikov, S.N.; Shkirin, A.V. Determination of the Disperse Composition of a PbO Suspension Containing Aggregates of Particles of Lamellar Shape by the Laser-Polarimetry Method. Opt. Spectrosc. 2018, 124, 575–584. [Google Scholar] [CrossRef]
- Wu, Y.; Cheng, T.; Zheng, L.; Chen, H. Effect of morphology on the optical properties of soot aggregated with spheroidal monomers. J. Quant. Spectrosc. Radiat. Transf. 2016, 168, 158–169. [Google Scholar] [CrossRef]
- Bunkin, N.F.; Shkirin, A.V.; Kozlov, V.A.; Starosvetskiy, A.V. Laser Scattering in Water and Aqueous Solutions of Salts. In Proceedings of the SPIE—Society of Photo-Optical Instrumentation Engineers, Laser Applications in Life Sciences, Oulu, Finland, 24 November 2010; Society of Photo-Optical Instrumentation Engineers: Bellingham, WA, USA, 2010. [Google Scholar] [CrossRef]
- Mishchenko, M.I.; Travis, L.D.; Lacis, A.A. Scattering, Absorption, and Emission of Light by Small Particles; Cambridge University Press: Cambridge, UK, 2002. [Google Scholar]
- Doicu, A.; Wriedt, T.; Eremin, Y.A. Light Scattering by Systems of Particles; Springer: Berlin/Heidelberg, Germany, 2006. [Google Scholar]
- Singh, H.; Gallier, S. Nature’s complex emulsion: The fat globules of milk. Food Hydrocoll. 2017, 68, 81–89. [Google Scholar] [CrossRef]
- Couvreur, S.; Hurtaud, C.; Marnet, P.G.; Faverdin, P.; Peyraud, J.L. Composition of Milk Fat from Cows Selected for Milk Fat Globule Size and Offered Either Fresh Pasture or a Corn Silage-Based Diet. J. Dairy Sci. 2007, 90, 392–403. [Google Scholar] [CrossRef] [Green Version]
- De Kruif, C.G.; Huppertz, T.; Urban, V.S.; Petukhov, A.V. Casein micelles and their internal structure. Adv. Colloid Interface Sci. 2012, 171–172, 36–52. [Google Scholar] [CrossRef] [PubMed]
- McMahon, D.J.; Oommen, B.S. Supramolecular Structure of the Casein Micelle. J. Dairy Sci. 2008, 91, 1709–1721. [Google Scholar] [CrossRef] [PubMed] [Green Version]
- Nocedal, J.; Wright, S.J. Numerical Optimization; Springer: New York, NY, USA, 1999. [Google Scholar]
- Gorbatova, K.K. Chemistry and Physics of Milk: Textbook for Universities; GIORD: Saint Petersburg, Russia, 2004. [Google Scholar]
- Fabelinskii, I.L. Molecular Scattering of Light; Plenum Press: New York, NY, USA, 1968. [Google Scholar]
- Stocker, S.; Foschum, F.; Krauter, P.; Bergmann, F.; Hohmann, A.; Scalfi Happ, C.; Kienle, A. Broadband Optical Properties of Milk. Appl. Spectrosc. 2017, 71, 951–962. [Google Scholar] [CrossRef] [PubMed]
| Publisher’s Note: MDPI stays neutral with regard to jurisdictional claims in published maps and institutional affiliations. |
© 2021 by the authors. Licensee MDPI, Basel, Switzerland. This article is an open access article distributed under the terms and conditions of the Creative Commons Attribution (CC BY) license (https://creativecommons.org/licenses/by/4.0/).


 ,
, 

