Article

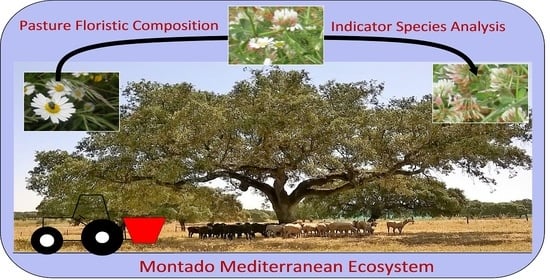
Floristic Composition: Dynamic Biodiversity Indicator of Tree Canopy Effect on Dryland and Improved Mediterranean Pastures

1
MED-Mediterranean Institute for Agriculture, Environment and Development, Instituto de Investigação e Formação Avançada (IIFA), University of Évora, Pólo da Mitra, Ap. 94, 7006-554 Évora, Portugal
2
Escuela de Ingenierías Agrarias, Universidad de Extremadura, Avenida Adolfo Suárez, S/N, 06007 Badajoz, Spain
3
Departamento de Expresión Gráfica, Escuela de Ingenierías Industriales, Universidad de Extremadura, Avenida de Elvas, S/N, 06006 Badajoz, Spain
*
Author to whom correspondence should be addressed.
Submission received: 29 September 2021 / Revised: 7 November 2021 / Accepted: 8 November 2021 / Published: 11 November 2021

Abstract

:
Montado is a characteristic ecosystem of the Mediterranean region. The adequate management of this silvo-pastoral ecosystem requires good understanding of the effect of factors such as tree canopy, fertilization and soil amendment on pasture growth. The main objectives of this work were: (1) to evaluate the effect of tree canopy on soil characteristics and pasture productivity and quality; and (2) to test floristic composition assessment as a bio-indicator of soil improvements (amendment and fertilization) in each study area (under and outside tree canopy). Topsoil was characterized at the beginning of the project (October 2015) and at the end of the experiments (spring 2020). Soil parameters obtained by electronic sensors (soil moisture content, soil cone index and surface temperature) were monitored monthly during the 2017/2018 pasture vegetative cycle. Pasture productivity, quality and floristic composition were evaluated every two years (2016, 2018 and 2020) in the spring flowering period. The results of the floristic inventory were submitted to a multilevel pattern analysis (Indicator Species Analysis, ISA). Pasture biodiversity was evaluated based on the calculation of richness indices. This study showed a positive effect of tree canopy on soil fertility and pasture quality (e.g., CP). Pasture productivity, on the other hand, was higher in areas outside tree canopy. The great potential of ISA as a tool for identification of bio-indicator species was also demonstrated. Pasture species were identified as ecological and dynamic attributes characteristic of each study area, before and after soil amendment and fertilization.

Graphical Abstract

1. Introduction

Montado is a characteristic ecosystem of the Mediterranean region, consisting of trees and biodiverse pastures grazed by animals [1]. Pastures are one of the most important terrestrial ecosystems on earth, currently covering about a quarter of the world’s land area [2]. Evergreen trees, mainly Quercus ilex subsp. rotundifolia Lam. (Holm oak) and Quercus suber L. (Cork oak) are important shelter zones for the animals in days of thunderstorms and intense winter rains, and provide some thermal comfort in the hot summer period [3]. Several studies also show that, in these silvopastoral ecosystems, under tree canopy areas (UTC) have different characteristics from open or outside tree canopy areas (OTC), in terms of fertility, compaction or soil moisture [4,5]. These specific characteristics (microclimate and edaphic) created by the trees, associated with the animal grazing effect, differentially influence pasture productivity, quality and floristic composition [4,6], creating a mosaic of distinct patches of vegetation associated with scattered trees [7].
Pastures constitute the essential food resource for herbivores animals (mainly sheep and cows) in extensive livestock systems and prevent the consumption of supplementary feed (and the consequent economic cost) during the growing season [2,8]. Nonetheless, these dryland pastures have low productivity [6], as they predominantly occupy poor and acid Cambisols and are subject to a marked seasonal and inter-annual variability of temperature and, especially, of the distribution of precipitation along the productive seasons (autumn, winter and spring), followed by summer drought stress [9]. The recommended procedure to adequately manage and to increase the productivity of these extensive production systems is based on soil fertility amendment through chemical fertilizer applications [10], which requires a good understanding of the effect of factors such as tree canopy, fertilization and soil amendment on the pasture growth, allowing managers to make informed decisions [11].
The Montado ecosystem also assumes a fundamental role as a reservoir of biodiversity [2,8], especially important in the face of the challenges resulting from climate changes and fluctuations [12,13]. Species richness declines with increasing site productivity, at least in anthropogenic grasslands [7,14], and thus monitoring the balance between these two dimensions, productivity (agricultural goal) and biodiversity (conservation/ecological goal) [7], represents a holistic approach and can be a tool to support farm manager’s decision-making process from an economic and environmental perspective.
In recent years, Precision Agriculture approach has translated into an exponential incorporation of technology in the agricultural and livestock sector [15]. The expansion in the application of proximal or remote sensing currently provides a more complete knowledge of the complex scenario of the Montado ecosystem, both in terms of the soil spatial variability [16], as well as in terms of the estimation of pasture productivity [17] or pasture quality [18], which allows farmers to improve the grazing management and the animal feed supplementation needs in the critical periods of summer and autumn [19]. Nevertheless, grassland systems frequently exhibit small-scale botanical and structural heterogeneity with pronounced spatio-temporal dynamics, features that present particular challenges for sensor applications [20]. On the other hand, this approach is not optimized since it leaves out the assessment of the intrinsic component related to the botanical species’ diversity. This is required in order to maintain high nutritive value in grasslands [8] and, in essence, constitute the source of animal food, but, at the same time, there are vulnerable hotspots in terms of biodiversity [13]. Biodiversity can be viewed as a dynamic bio-indicator of the long-term evolution and conservation of the capacity of this ecosystem to provide valuable services [11,13], functioning under future environmental scenarios [12]. “Indicator species analysis” (ISA) are good diagnostic tools to simplify and understand observed species patterns [21], to identify potential risk of invasive plants’ expansion [13] or ecological niches of species with relatively narrow habitat and microclimatic requirements [21]. Indicator species could be used in three distinct ways: (i) to reflect the biotic or abiotic state of the environment; (ii) to reveal evidence of the impact of environmental changes; and (iii) to indicate the diversity of other species or communities within an area [22].
In this context, the experimental field used in this case study is intended as a Mediterranean-climate reference laboratory for global change research because of its transitional climate, the high spatiotemporal variability of its environmental conditions, rich and unique biodiversity, and a wide range of socio-economic conditions [13]. Therefore, the main objectives of this work were: (1) to evaluate, over six years, tree canopy effects on soil characteristics and pasture productivity and quality; and (2) to test the floristic composition assessment as a bio-indicator of each study area (under and outside tree canopy, UTC and OTC, respectively), temporally sensitive to soil improvements (amendment and fertilization).

2. Materials and Methods

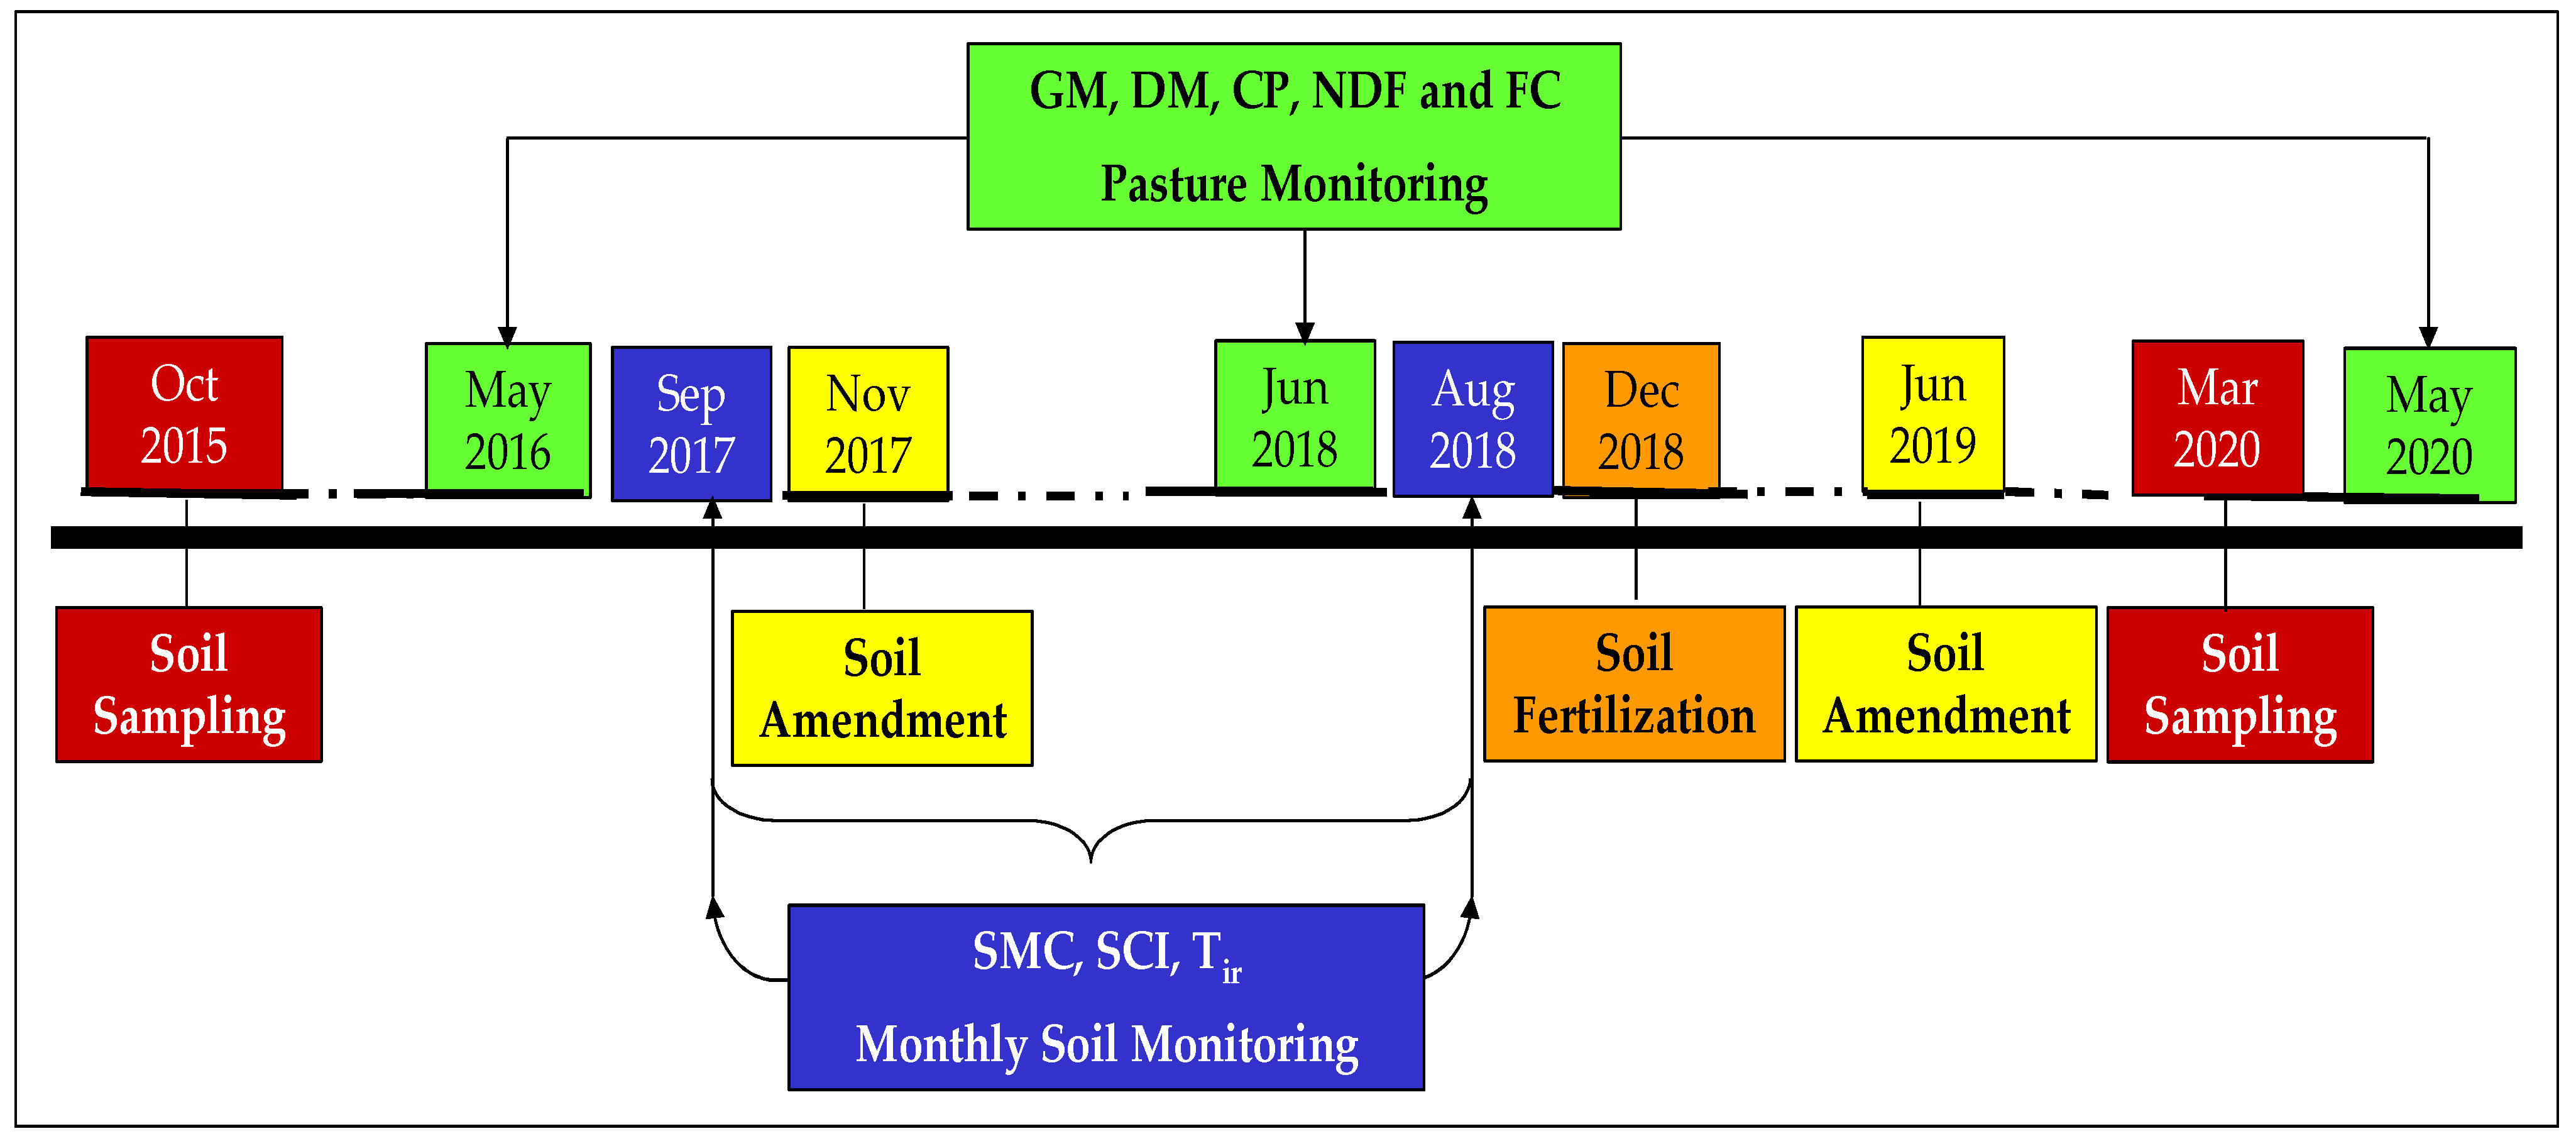
2.1. Chronological Approach

Figure 1 shows the chronological diagram of the interventions and soil and pasture measurements carried out between October 2015 and May 2020 for monitoring the Montado ecosystem at the Mitra experimental field. The effect of tree canopy, soil amendments and fertilization were evaluated at the level of pasture productivity (GM and DM), quality (CP and NDF) and floristic composition (FC) at the peak of production (April–May) of three pasture vegetative cycles: 2015/2016, 2017/2018 and 2019/2020.
In this period, two soil amendments (superficial application of 2000 kg ha−1 with dolomitic limestone were carried out, the first in November 2017 and the second in June 2019), and one soil fertilization (surface application of 100 kg ha−1 of ammonium phosphate carried out in December 2018). Pasture was permanently grazed by sheep (mean number of 10 animals per hectare).

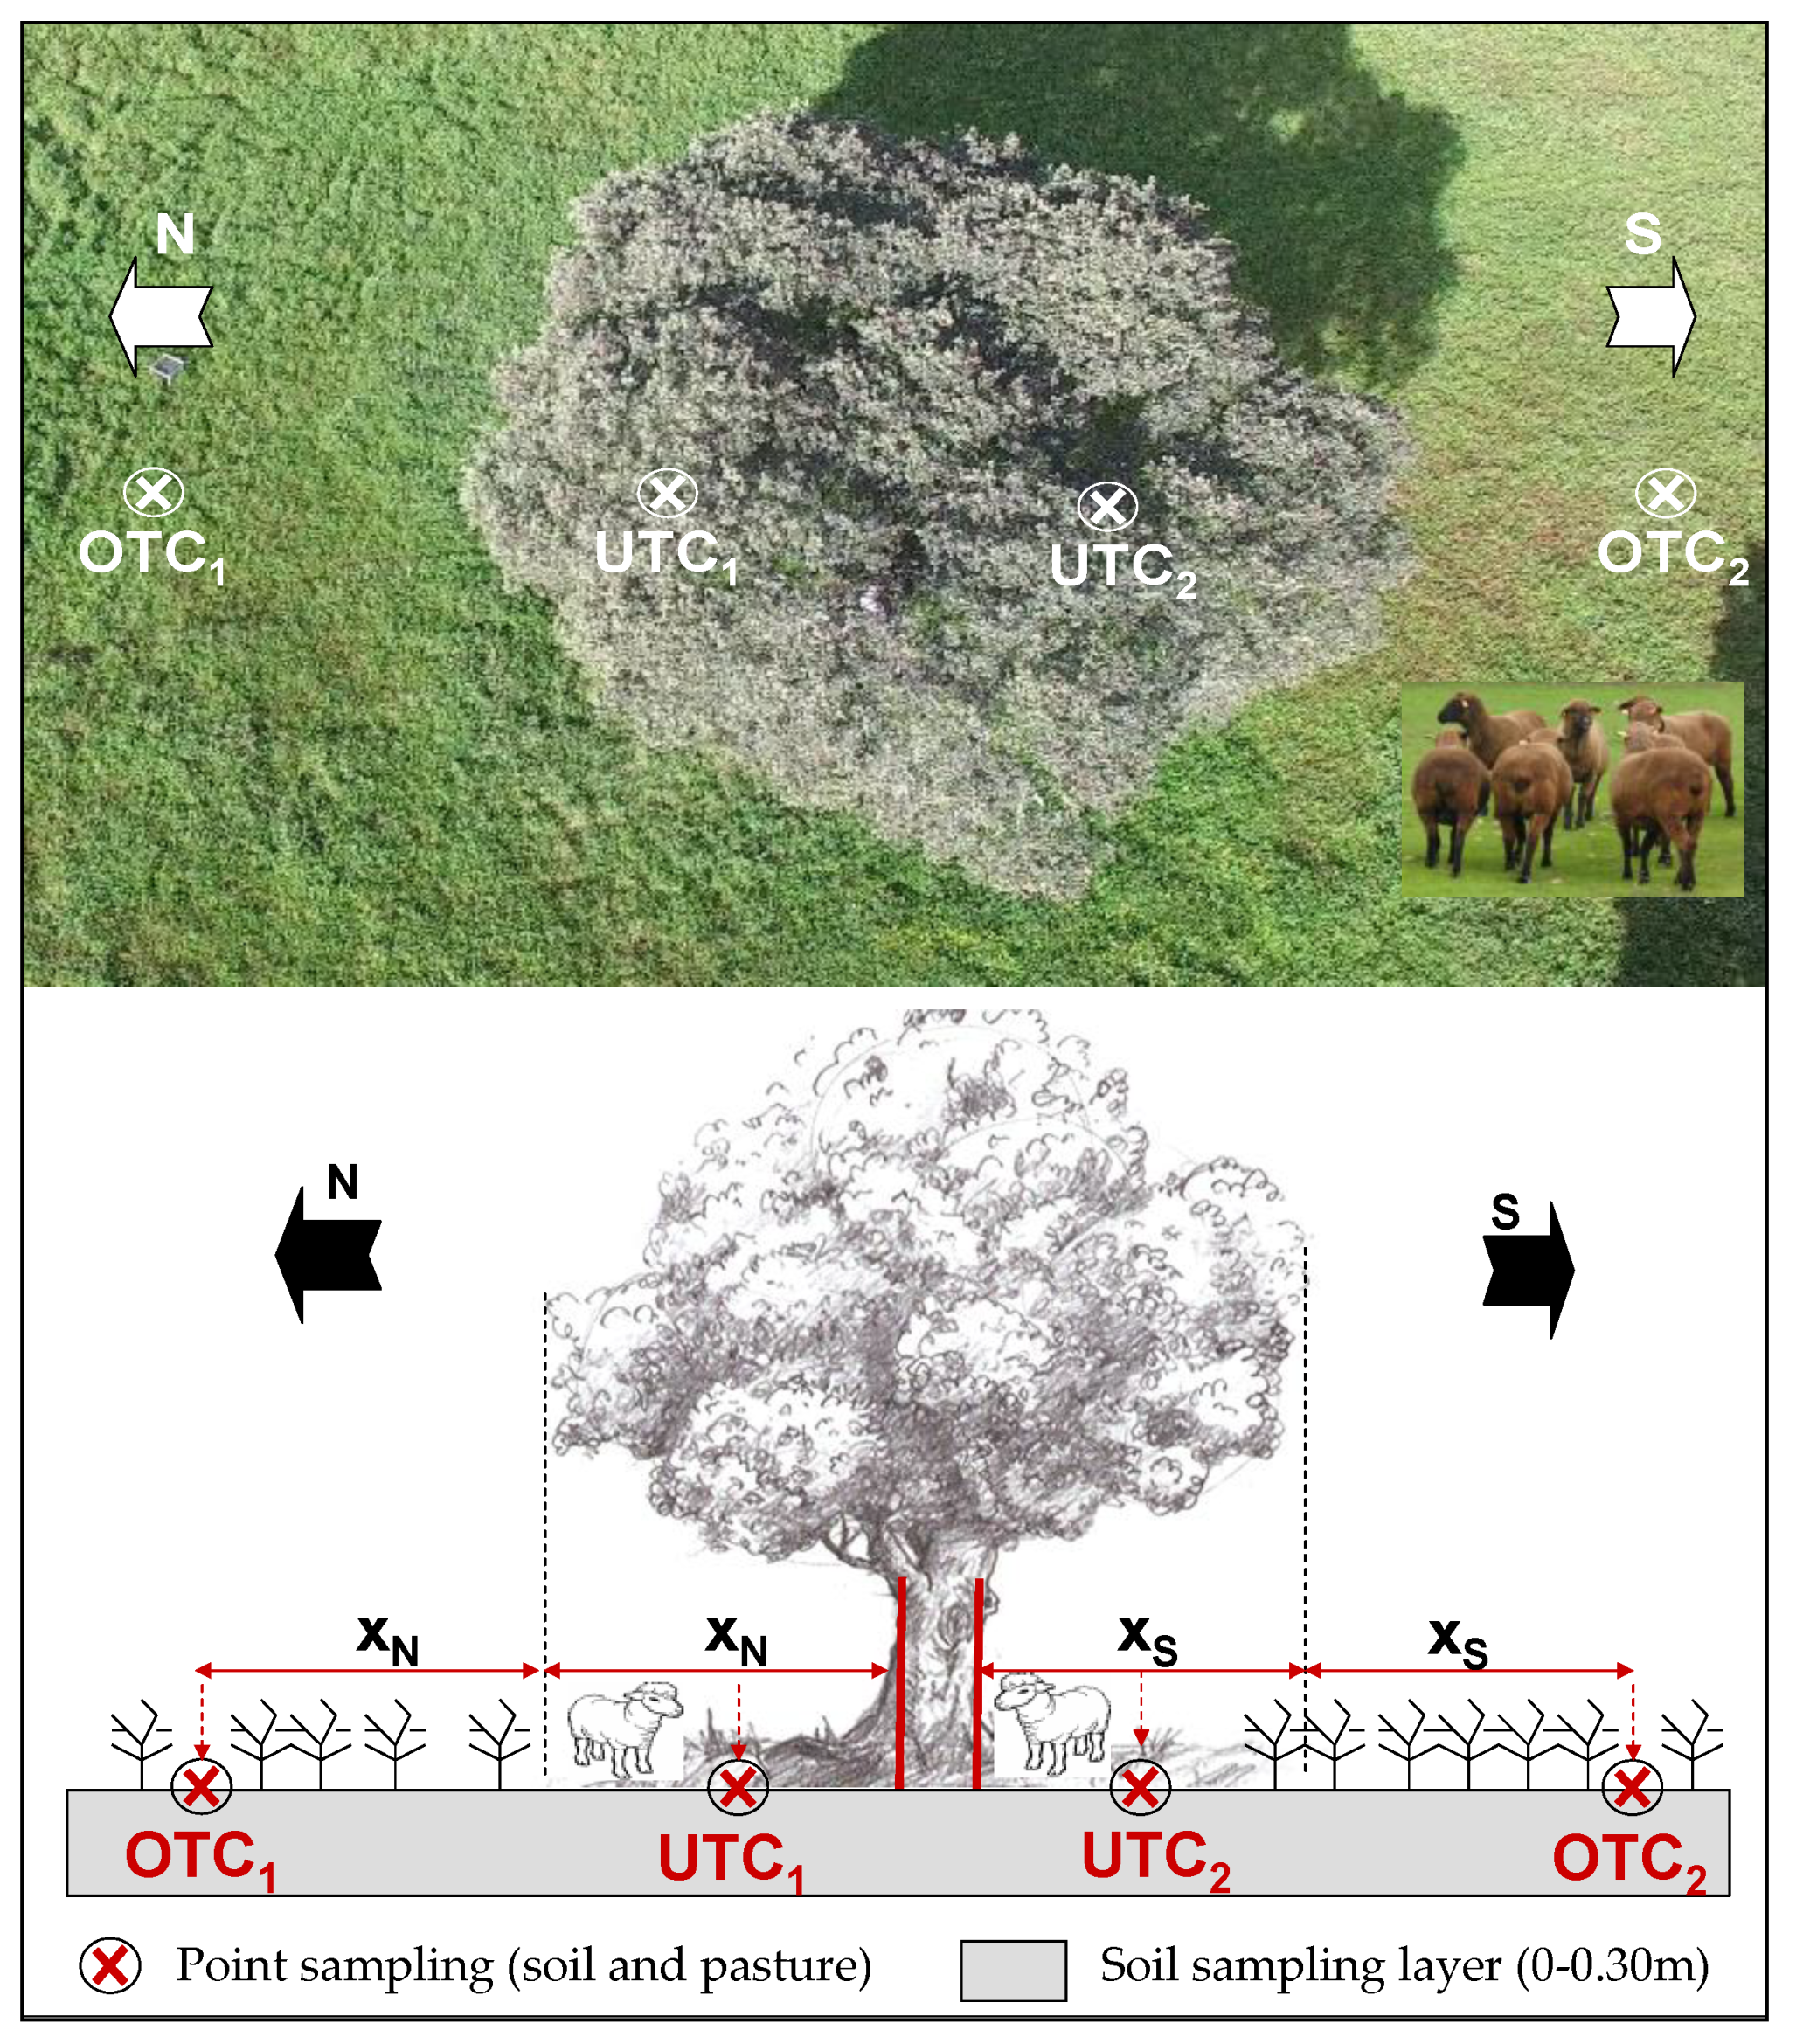
2.2. Experimental Field Characteristics and Sampling Scheme

This research was conducted at a farm called Mitra (38°32.2′ N, 8°1.1′ W), located in the proximity of Valverde, 10 km southwest of Évora (southern Portugal). In the study area (2.3 ha), six trees were used as reference in the sampling process (for more details please see [1]). For each reference tree four sampling points were geo-referenced, two under tree canopy (UTC) and two outside tree canopy (OTC), half facing North and half facing South (Figure 2). In each of these twenty-four sampling points, a wooden grazing exclusion cage (dimensions 0.5 m × 0.5 m × 0.5 m) was installed.
The predominant soil of this field is classified as a Cambisol derived from granite [23]. Cambisols are characterised by slight or moderate weathering of parent material and absence of appreciable quantities of illuviated clay, OM, aluminum, and/or iron compounds. These soils are not very fertile and are used mainly for mixed arable farming and as forest and grazing land.
The climate of this area is Mediterranean, modified by the interior location and by oceanic influences from the Atlantic. According to the Köppen-Geiger classification, it is a Csa climate type [24]. It is characterized by dry and hot summers, mild winters, and variable intra-annual rainfall. The monthly average temperature is between 8 and 26 °C. Minimum temperatures are close to 0 °C between December and February, and the maximum occasionally reaches more than 40 °C in summer. The annual rainfall is between 400 and 600 mm. However, one of the most important characteristics of the precipitation is its inter-annual variability. There is a dry season, from June to September, and a wet season, from October to May. Figure 3 shows the monthly precipitation and temperature between September 2015 and August 2020. This inter-annual variability is evidenced in the period of this study (2015–2020), with accumulated rainfall between 313 mm in 2018/2019 and more than twice as much (683 mm) in 2017/2018 (Table 1). In this five-year period (2015–2020; Table 1) it was possible to observe the fluctuation of maximum rainfall: October, November or April.

2.3. Soil Sample Collection and Analysis

Soil samples were collected in October 2015 using a gouge auger and a hammer, in a depth range of 0–0.30 m [1]. One composite soil sample was taken in each of the twenty-four geo-referenced sampling points, comprising four subsamples from within 1 m of the center of the exclusion cage.
Based on standard methods of soil analytic determination [25] this soil was characterized in terms of texture (sand, silt, and clay components), pH, organic matter (OM), total nitrogen (Ntotal), phosphorus (P), potassium (K), magnesium (Mg) and manganese (Mn).
Soil samples were kept in plastic bags, air-dried, and analysed for particle-size distribution using a sedimentographer (Sedigraph 5100, manufactured by Micromeritics), after passing the fine components through a 2 mm sieve. The fine components (<2 mm) were analyzed using the following methods [26]: (i) pH in 1:2.5 (soil:water) suspension, using the potentiometric method; (ii) organic matter was measured by combustion and CO2 by infrared detection cell; (iii) Ntotal with the Kjeldahl method; (iv) P and K were extracted by the Egner-Riehm method, P was measured using colorimetric method, and K content was measured with a flame photometer; and (v) Mg and Mn were measured using atomic absorption spectrometry.
Soil samples were collected again in March 2020 using the same procedures to obtain the pH, Mg and Mn [19].
Soil moisture content (SMC, in %) was measured monthly between September 2017 and August 2018. Twenty four plastic tubes were installed in the ground at up to 0.30 m depth, twelve UTC and twelve OTC. These probe access tubes provide rapid, reliable, and non-destructive recording of SMC profiles using portable Time Domain Reflectometry (TDR) probes (TRIME-FM, IMKO—Micromodultechnik, GmbH, Ettlingen, Germany). The measurements were carried out at the following depths: 0.10, 0.20, 0.30 m.
Soil cone index (SCI, in kPa) was measured monthly between December 2017 and March 2018. Measurements were carried out in the twenty-four sampling points with a FieldScout SC 900 (Spectrum Technologies, Aurora, IL, USA) electronic cone penetrometer. In this study, the SCI values between 0 and 0.30 m (at 2.5 cm intervals) were used. In the months of September, October and November 2017 and April, May, June, July and August 2018, the soil was very hard, making it difficult to perform adequate measurements with the probe. The average of four measurements dates was used.
Soil/pasture surface temperature was measured monthly by infrared thermography (Tir, °C) between September 2017 and August 2018. This is a technique that captures the emission of thermal radiation by a body and converts it into a visible colored digital image. Infrared thermography images were obtained from each of the twenty-four sampling points always at the same time of the day (9:00 a.m.) using an infrared camera (ThermaCAMTM FLIR Systems, Wilsonville, OR, USA). Thermography images were analyzed using ResearchIR® 3.0 (FLIR Systems, Wilsonville, OR, USA) and data from each infrared image was exported to a spreadsheet where the information was processed to calculate the mean and standard deviation of soil/pasture surface temperature.

2.4. Pasture Samples Collection and Analysis

During the pasture flowering period of the 2015/2016, 2017/2018 and 2019/2020 vegetative cycles, a floristic inventory of species present in each of the sampling points (floristic composition, FC) was carried out by an expert in conservation biology based on the phytosociological method of Braun-Blanquet [27]. In each sampling area (0.25 m2), the percentage of coverage by each species was recorded. The first assessment (2016) was carried out at the beginning of the study (before any soil amendment), the second assessment (2018) was carried out at the middle of the study, after an application of dolomitic limestone (November 2017) and the third assessment was carried out at the end of study, after two dolomitic limestone applications (November 2017 and June 2019), interspersed (December 2018) by a fertilizer application (Figure 1). Pasture sampling process was carried out every two years (2016, 2018 and 2020) during spring, at the peak of pasture production (May or June). Pasture inside each of the twenty-four exclusion cages (0.5 m × 0.5 m) was cut with a portable grass shears at 1–2 cm above ground level and stored in marked plastic bags. The pasture samples were then taken to the Animal Nutrition Laboratory of the University of Évora, where they were weighed, dried (for 72 h at 65 °C), and then weighed again to establish pasture productivity in terms of green matter (kg GM ha−1) and dry matter (kg DM ha−1) according to standard procedures [28]. The dehydrated samples were subjected to standard analysis of wet chemistry according to the Association of Official Analytical Chemists [25] to obtain pasture crude protein (CP), and neutral detergent fibre (NDF), both in % of DM.

2.5. Statistical Analysis of the Data

Descriptive statistical analysis (mean, standard variation, and range) was performed for soil and pasture parameters. Then, ANOVA of the data was carried out considering a one-factor experiment (influence of tree canopy, UTC vs. OTC), using “MSTAT-C” software with a 95% significance level (p < 0.05). The “Fisher” (“Fisher’s least significant difference, LSD”) test was applied whenever the ANOVA results presented significant differences between factors.
Data of pasture FC were submitted to a multilevel pattern analysis (Indicator Species Analysis—ISA), a specific package for “R” statistic software (St. Louis, MO, USA) [29]. ISA involves the calculation of an indicator value (IV) for species, corresponding to the product of the relative abundance (specificity) and relative frequency (fidelity), expressed as a degree (in percentage) [30]. The indicator value ranges between 0 (species absent in a given group) and 100 (species that occurs in all samples within the group and does not occur in other groups) [31]. In order to identify bio-indicator species, characteristic of each study area throughout the period under evaluation, two approaches were taken in this analysis: (i) tree canopy (UTC and OTC) factor; and (ii) year of evaluation (2016, 2018 and 2020). Pasture biodiversity was evaluated based on the calculation of richness, Simpson’s diversity index (DI; Equation (1)) [14] and Shannon-Wiener diversity index (H’; Equation (2)) [22]. The richness was normalized using the log (x + 1) transformation and was represented by the species matrix for each of the trial treatments. Statistical significance was assessed using α = 0.05. There are two main components that contribute to biodiversity, the species richness (describes the number of different species present in an area) and species evenness (describes the relative abundance of the different species in an area).
D I = 1 p i 2
H = [ ( p i ) × ln ( p i ) ]
where “DI” is the Simpson’s diversity index; “H′” is the Shannon-Wiener index; and “pi” is the proportion of each “i” species.

3. Results

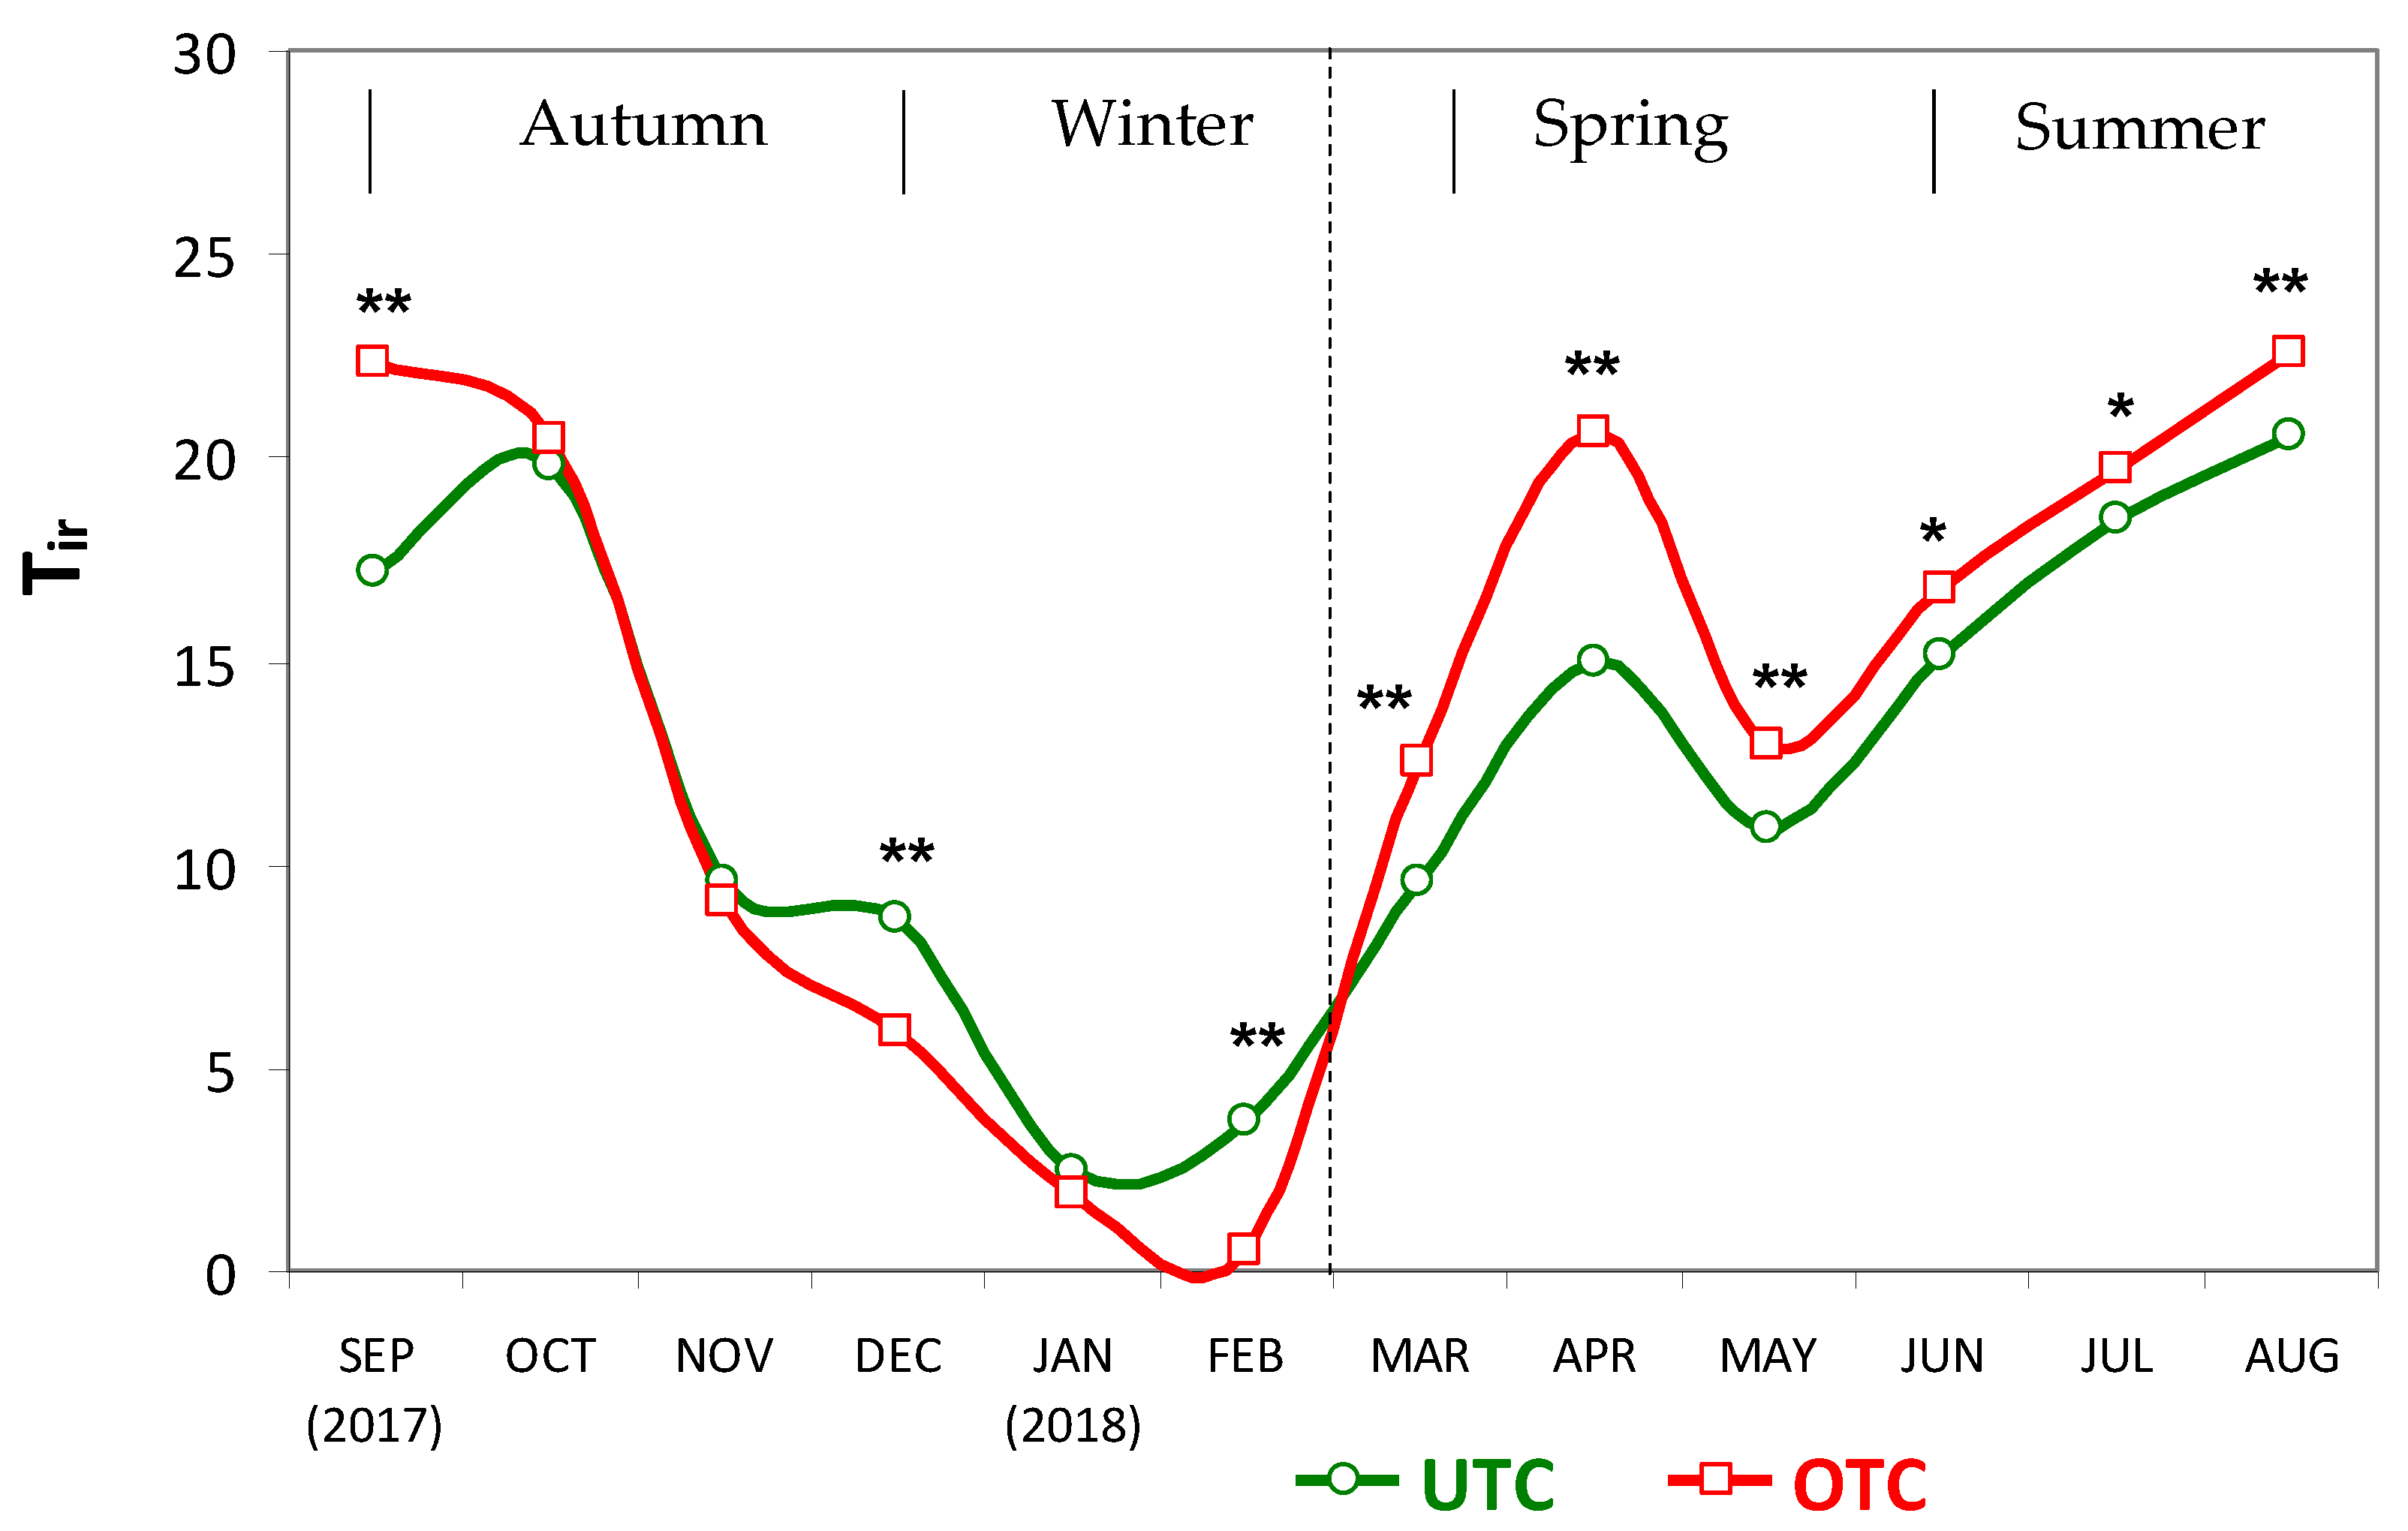
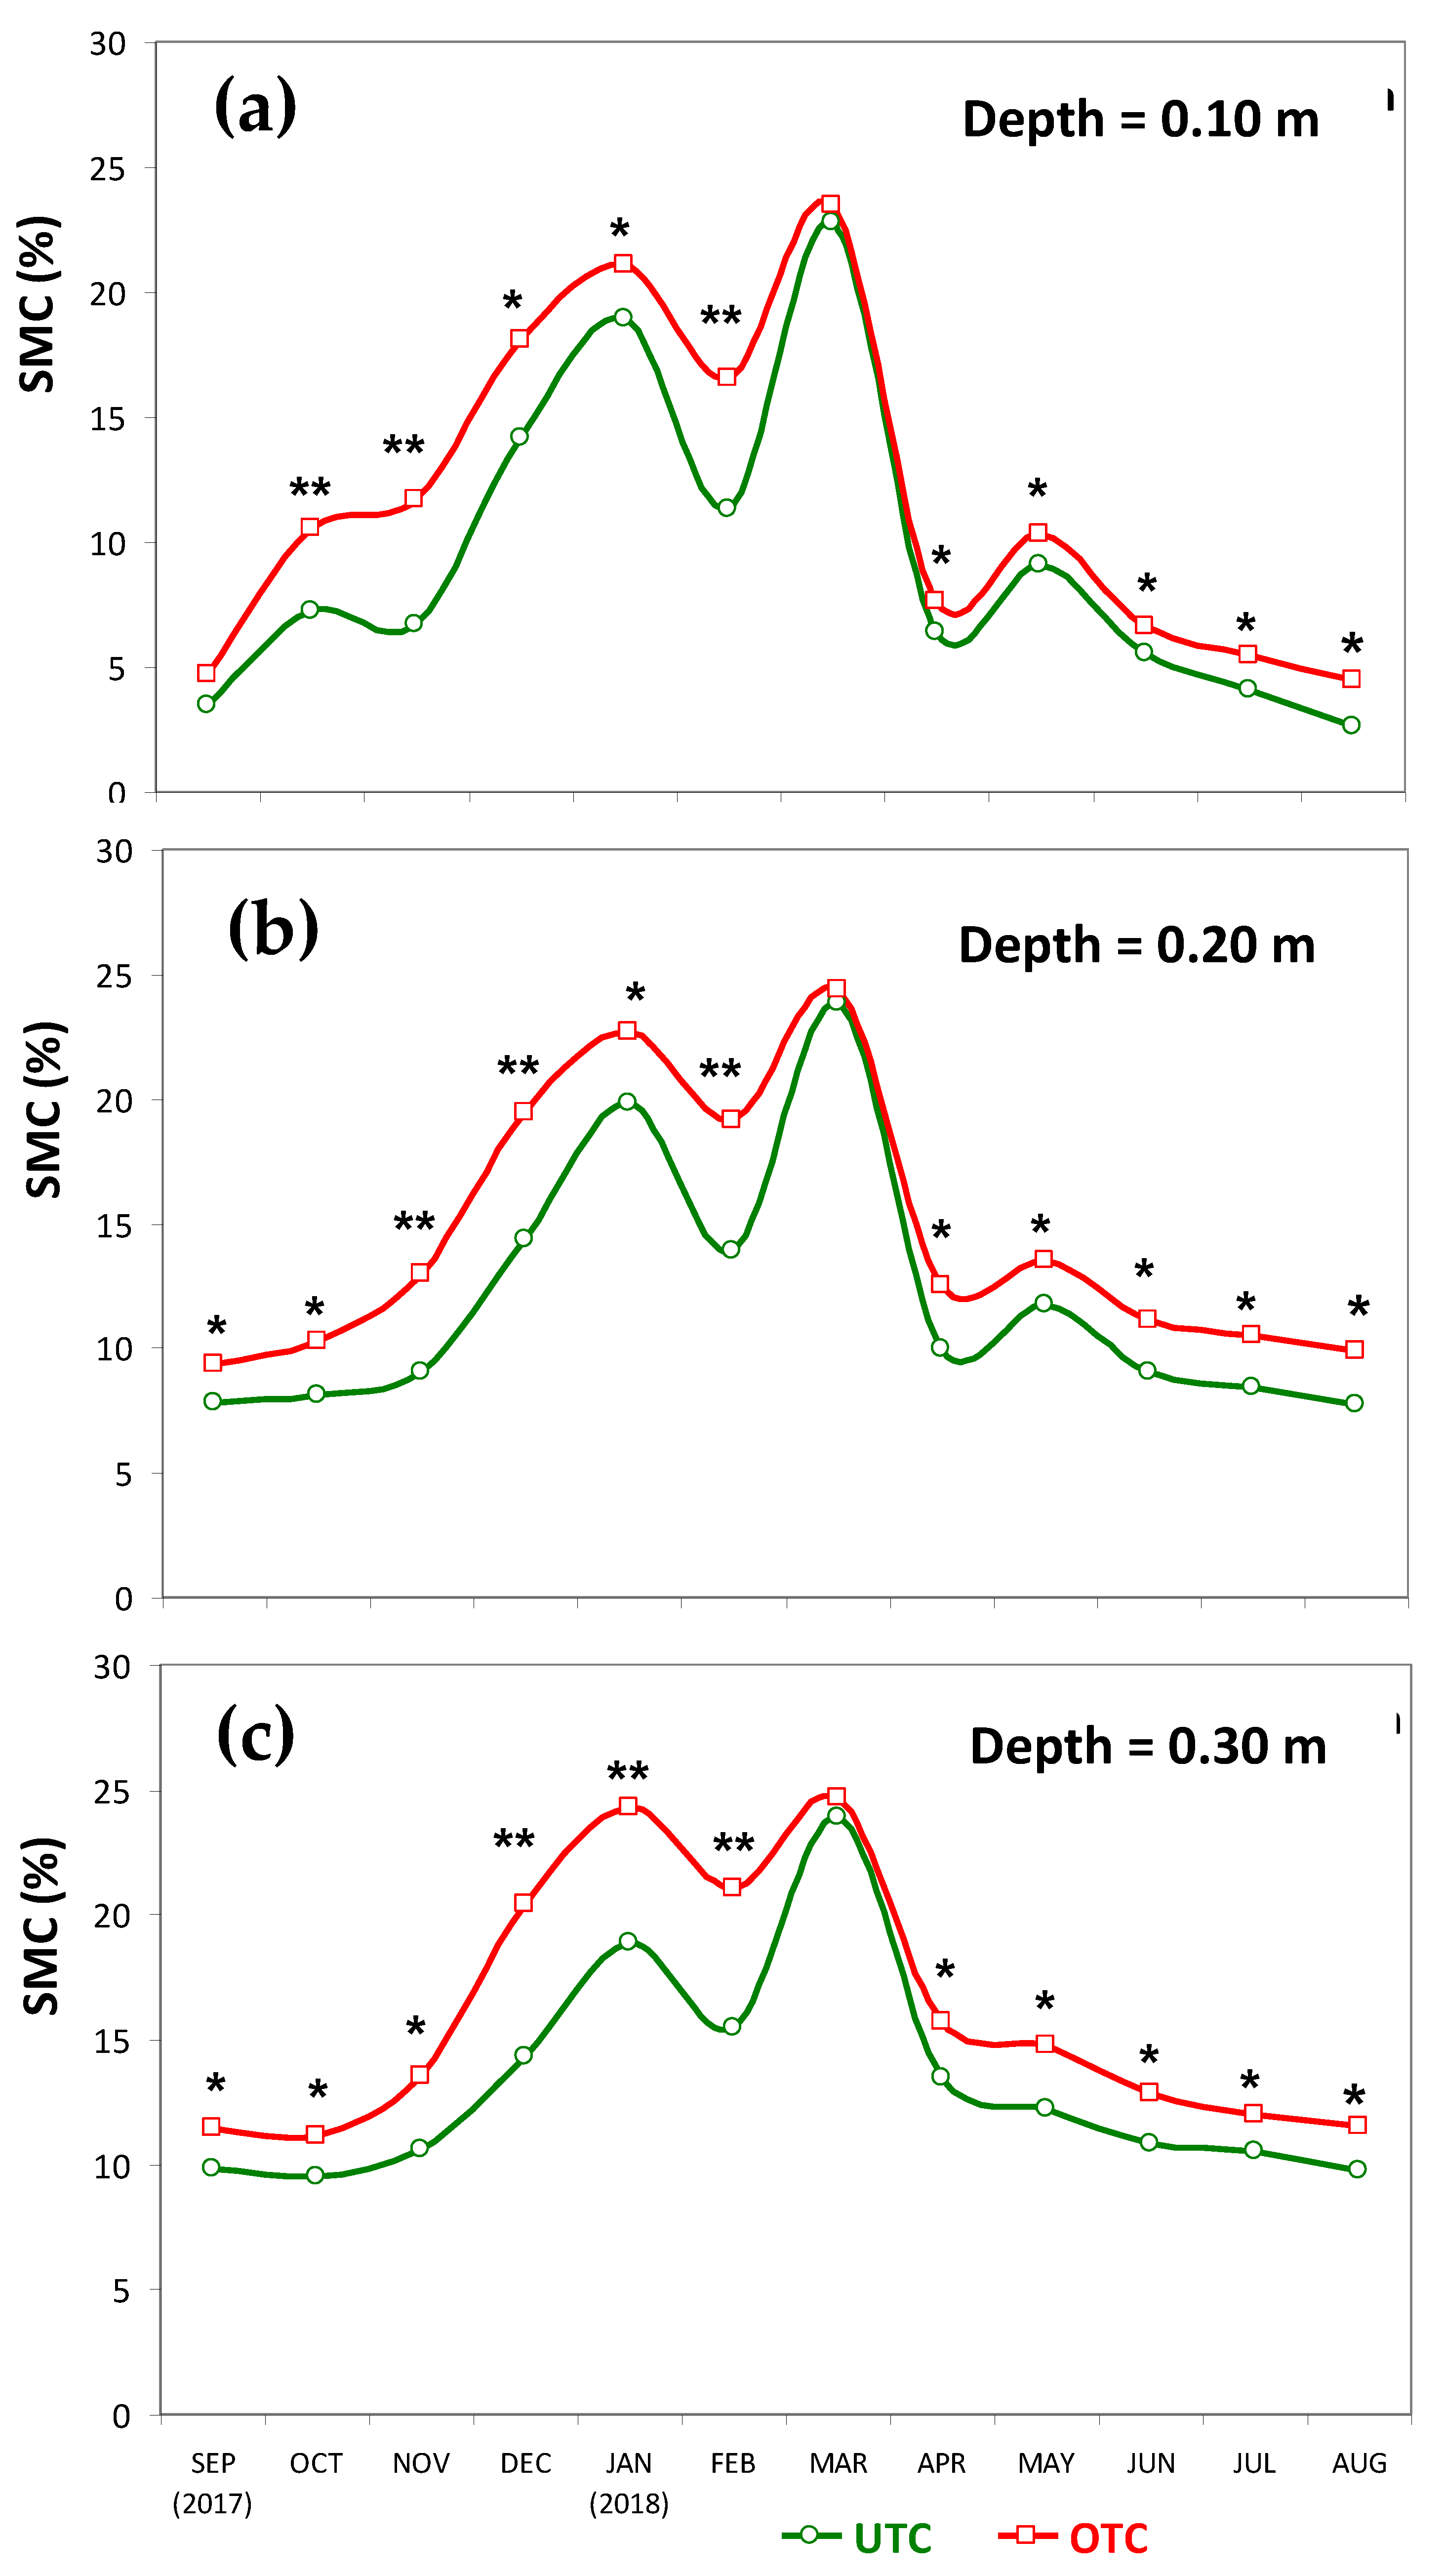
3.1. Soil Characteristics UTC and OTC

Table 2 shows the clear effect of tree canopy on OM and macro and micronutrients (Nt, P2O5, K2O, Mg and Mn), with OM accumulation and greater fertility (significantly higher contents) in UTC areas, relative to OTC areas, as well as the low pH (5.3–5.4) of the topsoil of the experimental field (Table 2) at the beginning of the project (October 2015). No significant differences were found between these areas in terms of texture (sand, silt and clay) and pH. Six years later (March 2020, near the end of the experiment), two soil amendments, one soil fertilization and permanent sheep grazing, led to a generalized but slight upward trend in pH, significantly more pronounced UTC (pH = 5.8, against 5.6 OTC) accompanied by a clear increase in the ratio Mg/Mn.
Some other parameters that could justify the differentiated growth of the pasture UTC and OTC include soil/pasture surface temperature (Tir; Figure 4), soil moisture content (SMC; Figure 5) and soil cone index (SCI; Figure 6).
Figure 4 shows a clear and statistically significant Tir gradient of 3 to 5 °C between March and September (between Spring and Summer), favouring OTC areas, the opposite of what happened in Winter months (in particular December and February). The lower temperature UTC during spring months may have a positive effect on the pasture by delaying the advance of the vegetative cycle (and the consequent quality degradation), but it may also represent lower pasture productivity, attenuating the catalytic effect of temperature on the physiological processes of biomass production, especially if soil moisture is available. Tree canopy effect was again positive, both for the animals and for the development of the pasture, in winter, preventing the temperature from falling to values close to 0 °C.
Soil moisture had a similar temporal pattern at all depths (0.10, 0.20 and 0.30 m; Figure 5), both UTC and OTC. There was a clear increase in early winter (December) and an abrupt break at the beginning of spring (March), which is a decisive factor in the duration of the vegetative cycle. The most salient and even surprising aspect was the systematic trend, throughout practically the whole year, of significantly higher SMC in OTC areas, which certainly had an impact on differential pasture productivity.
Soil cone index (SCI), shown in average terms in Figure 6, gradually increased to a depth of 0.20 m, decreasing slightly to a depth of 0.30 m. UTC and OTC had a similar profile of this parameter in the 0–0.15 m soil layer but in the 0.15–0.30 m layer UTC showed significantly higher values.

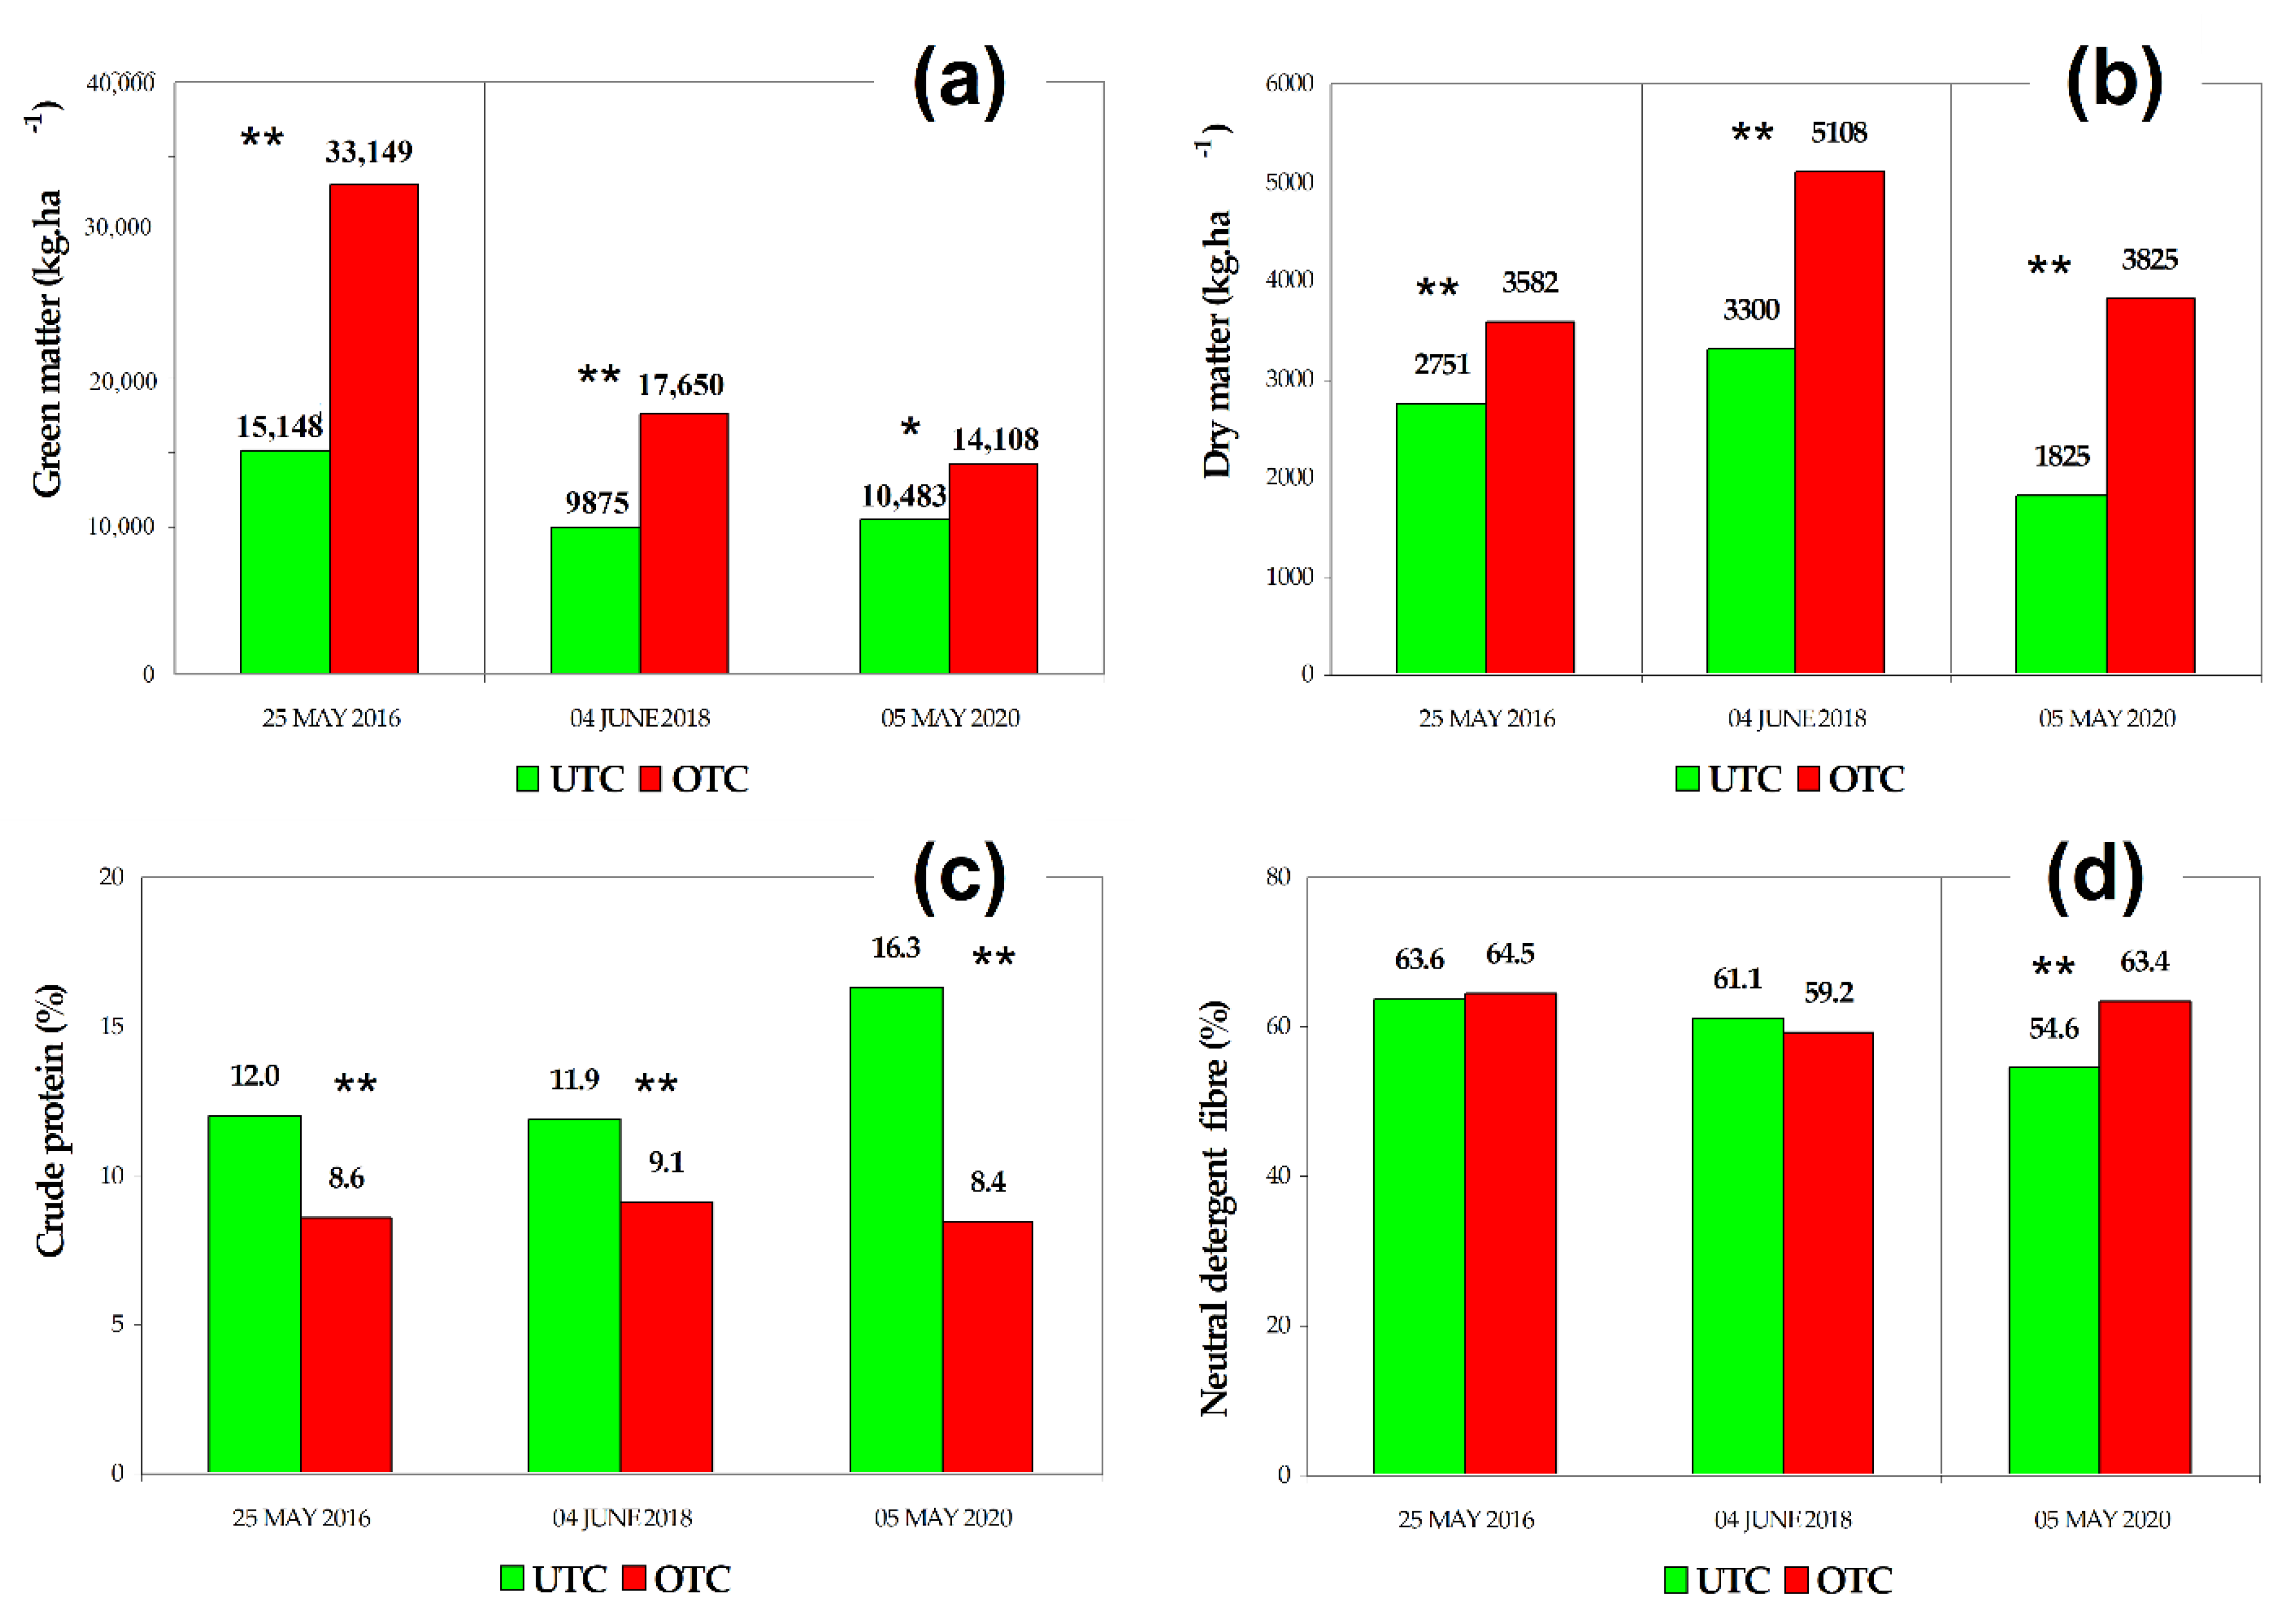
3.2. Pasture Productivity and Quality UTC and OTC

Pasture productivity, evaluated by GM and DM (in kg ha−1; Figure 7a,b, respectively) at peak production, was systematically (2016, 2018 and 2020) and significantly higher for OTC than UTC. Tree canopy areas, nonetheless, presented in the same period, higher levels of CP (in % DM; Figure 7c), i.e., greater pasture quality. This positive aspect conferred by tree canopies on the pasture quality was further reinforced in the spring of 2020, with significantly lower fibre contents (NDF, in % DM; Figure 7d). These results highlight, further, a relatively low pasture productivity (in terms of GM) and relatively high CP contents in spring 2020. This last result is probably related to the earlier production assessment in 2020 (beginning of May) compared to 2016 and 2018 (late May–early June).

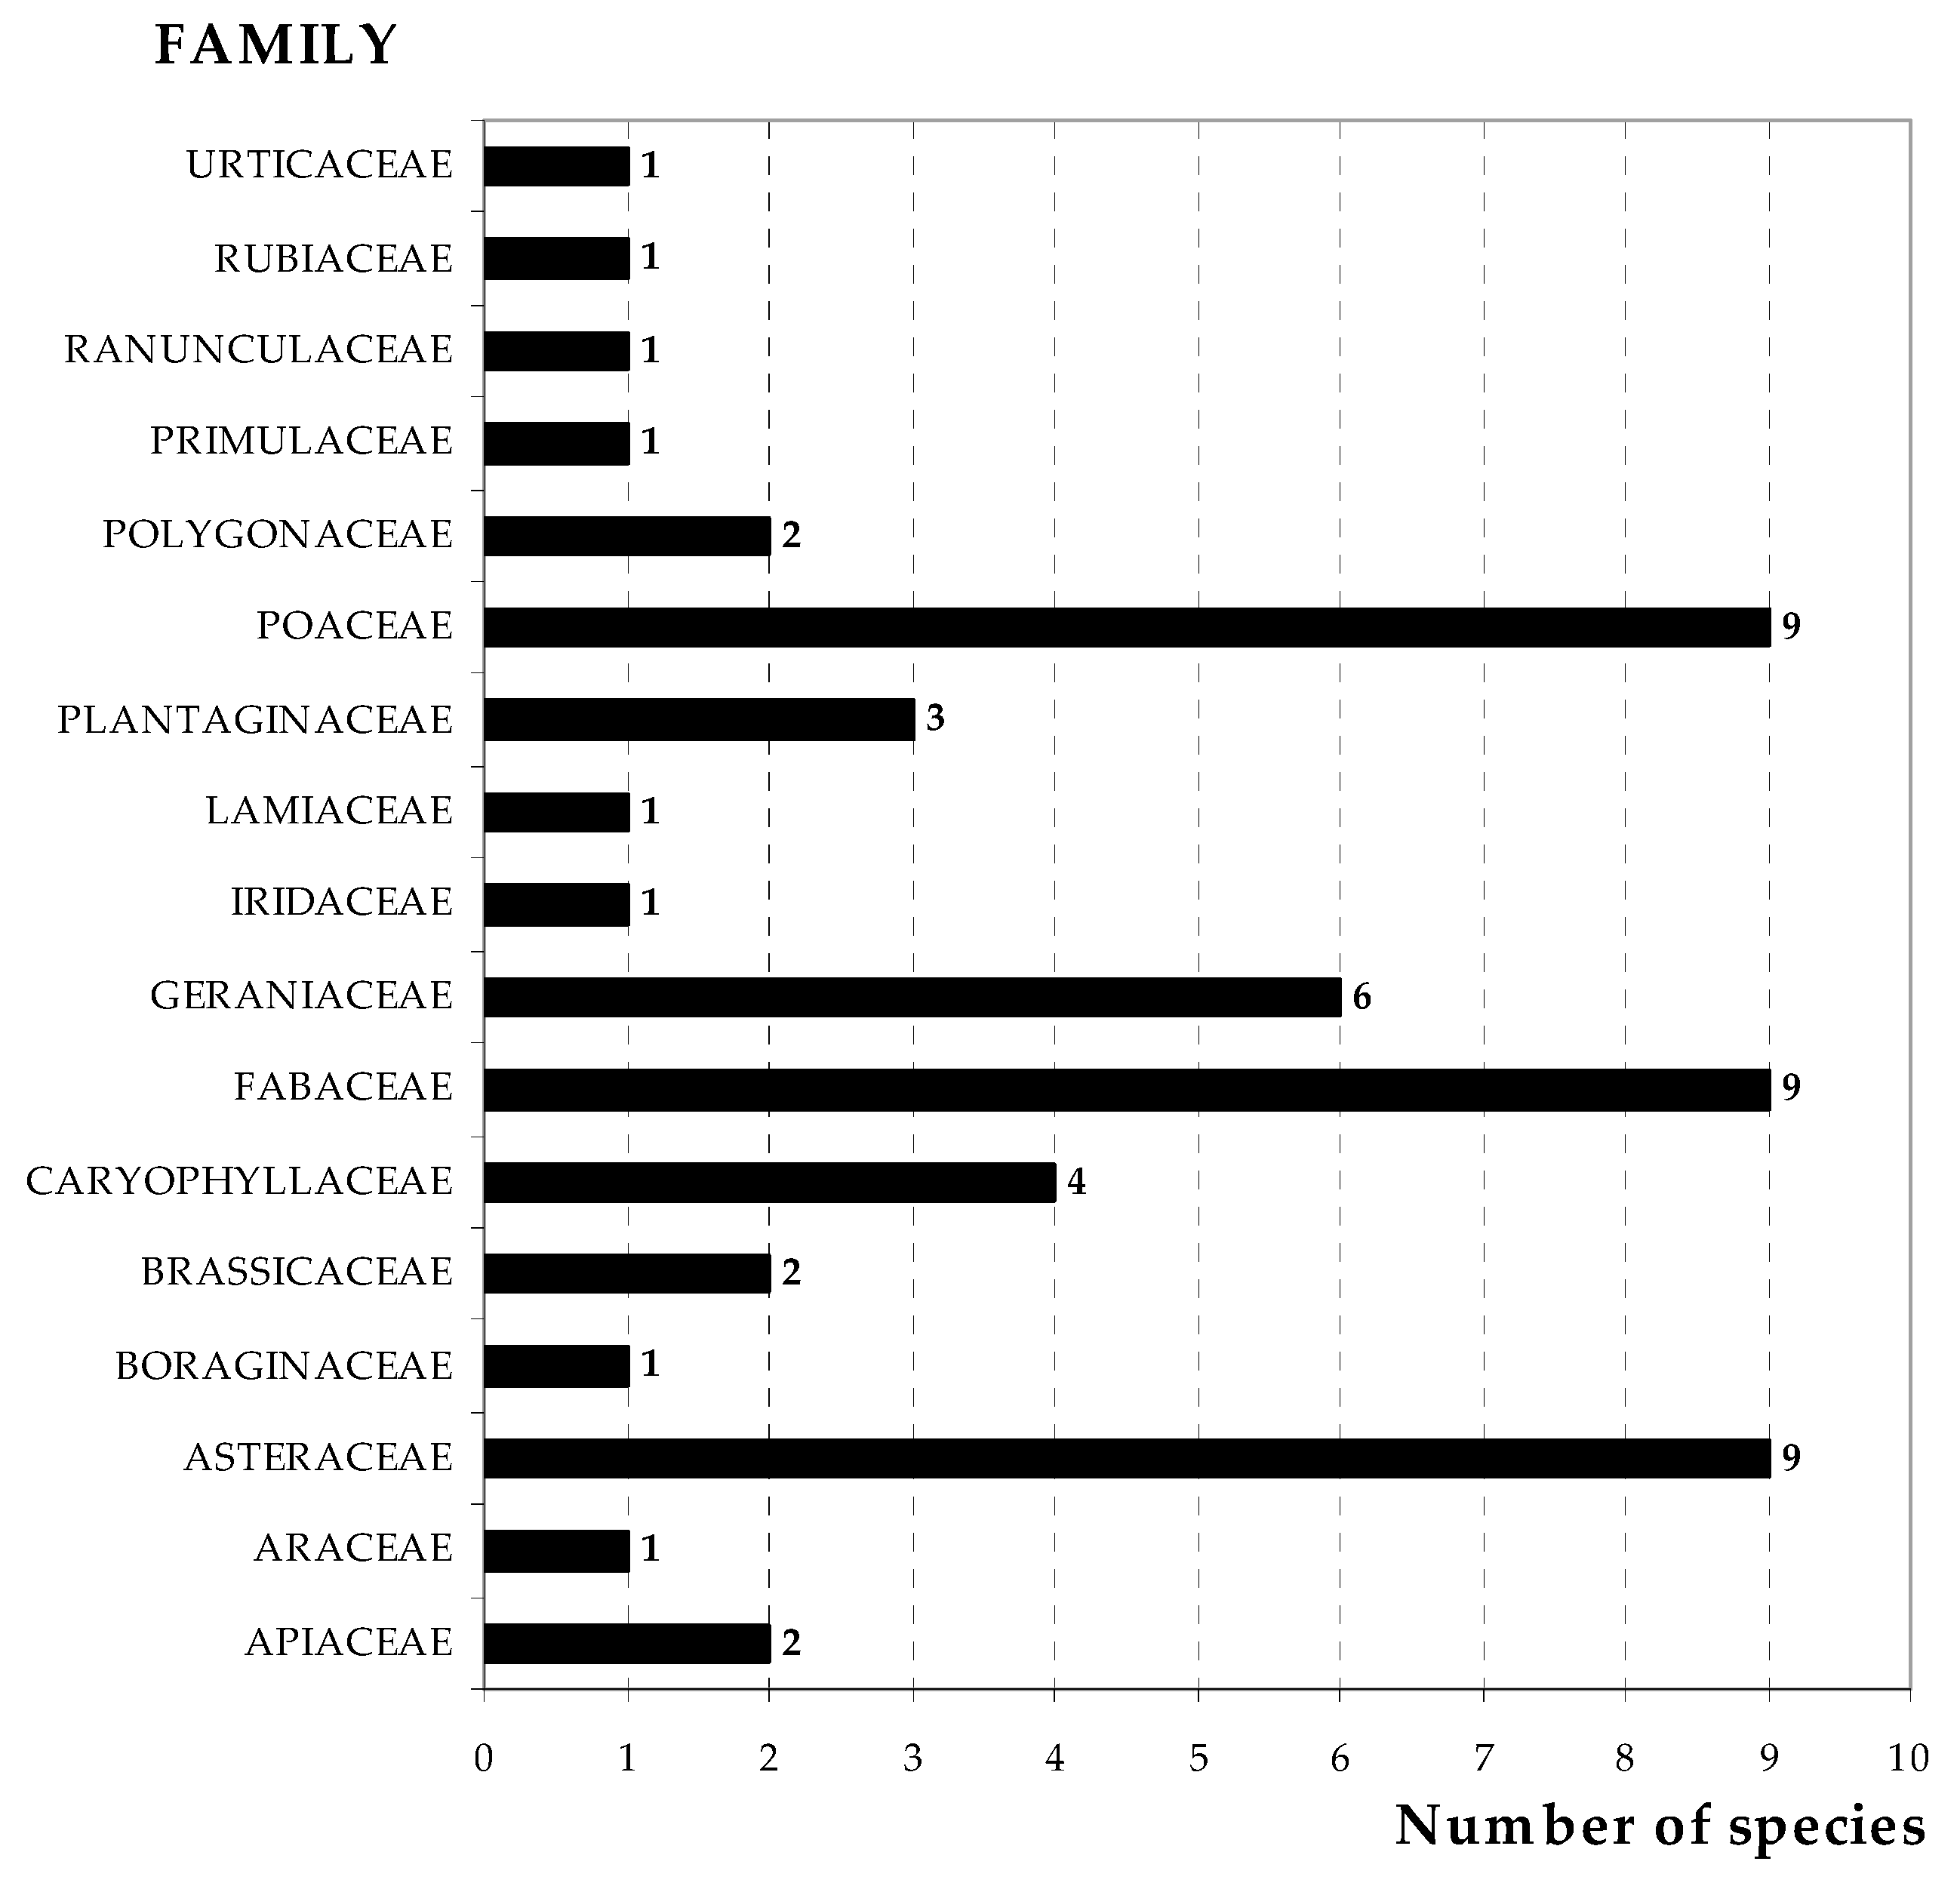
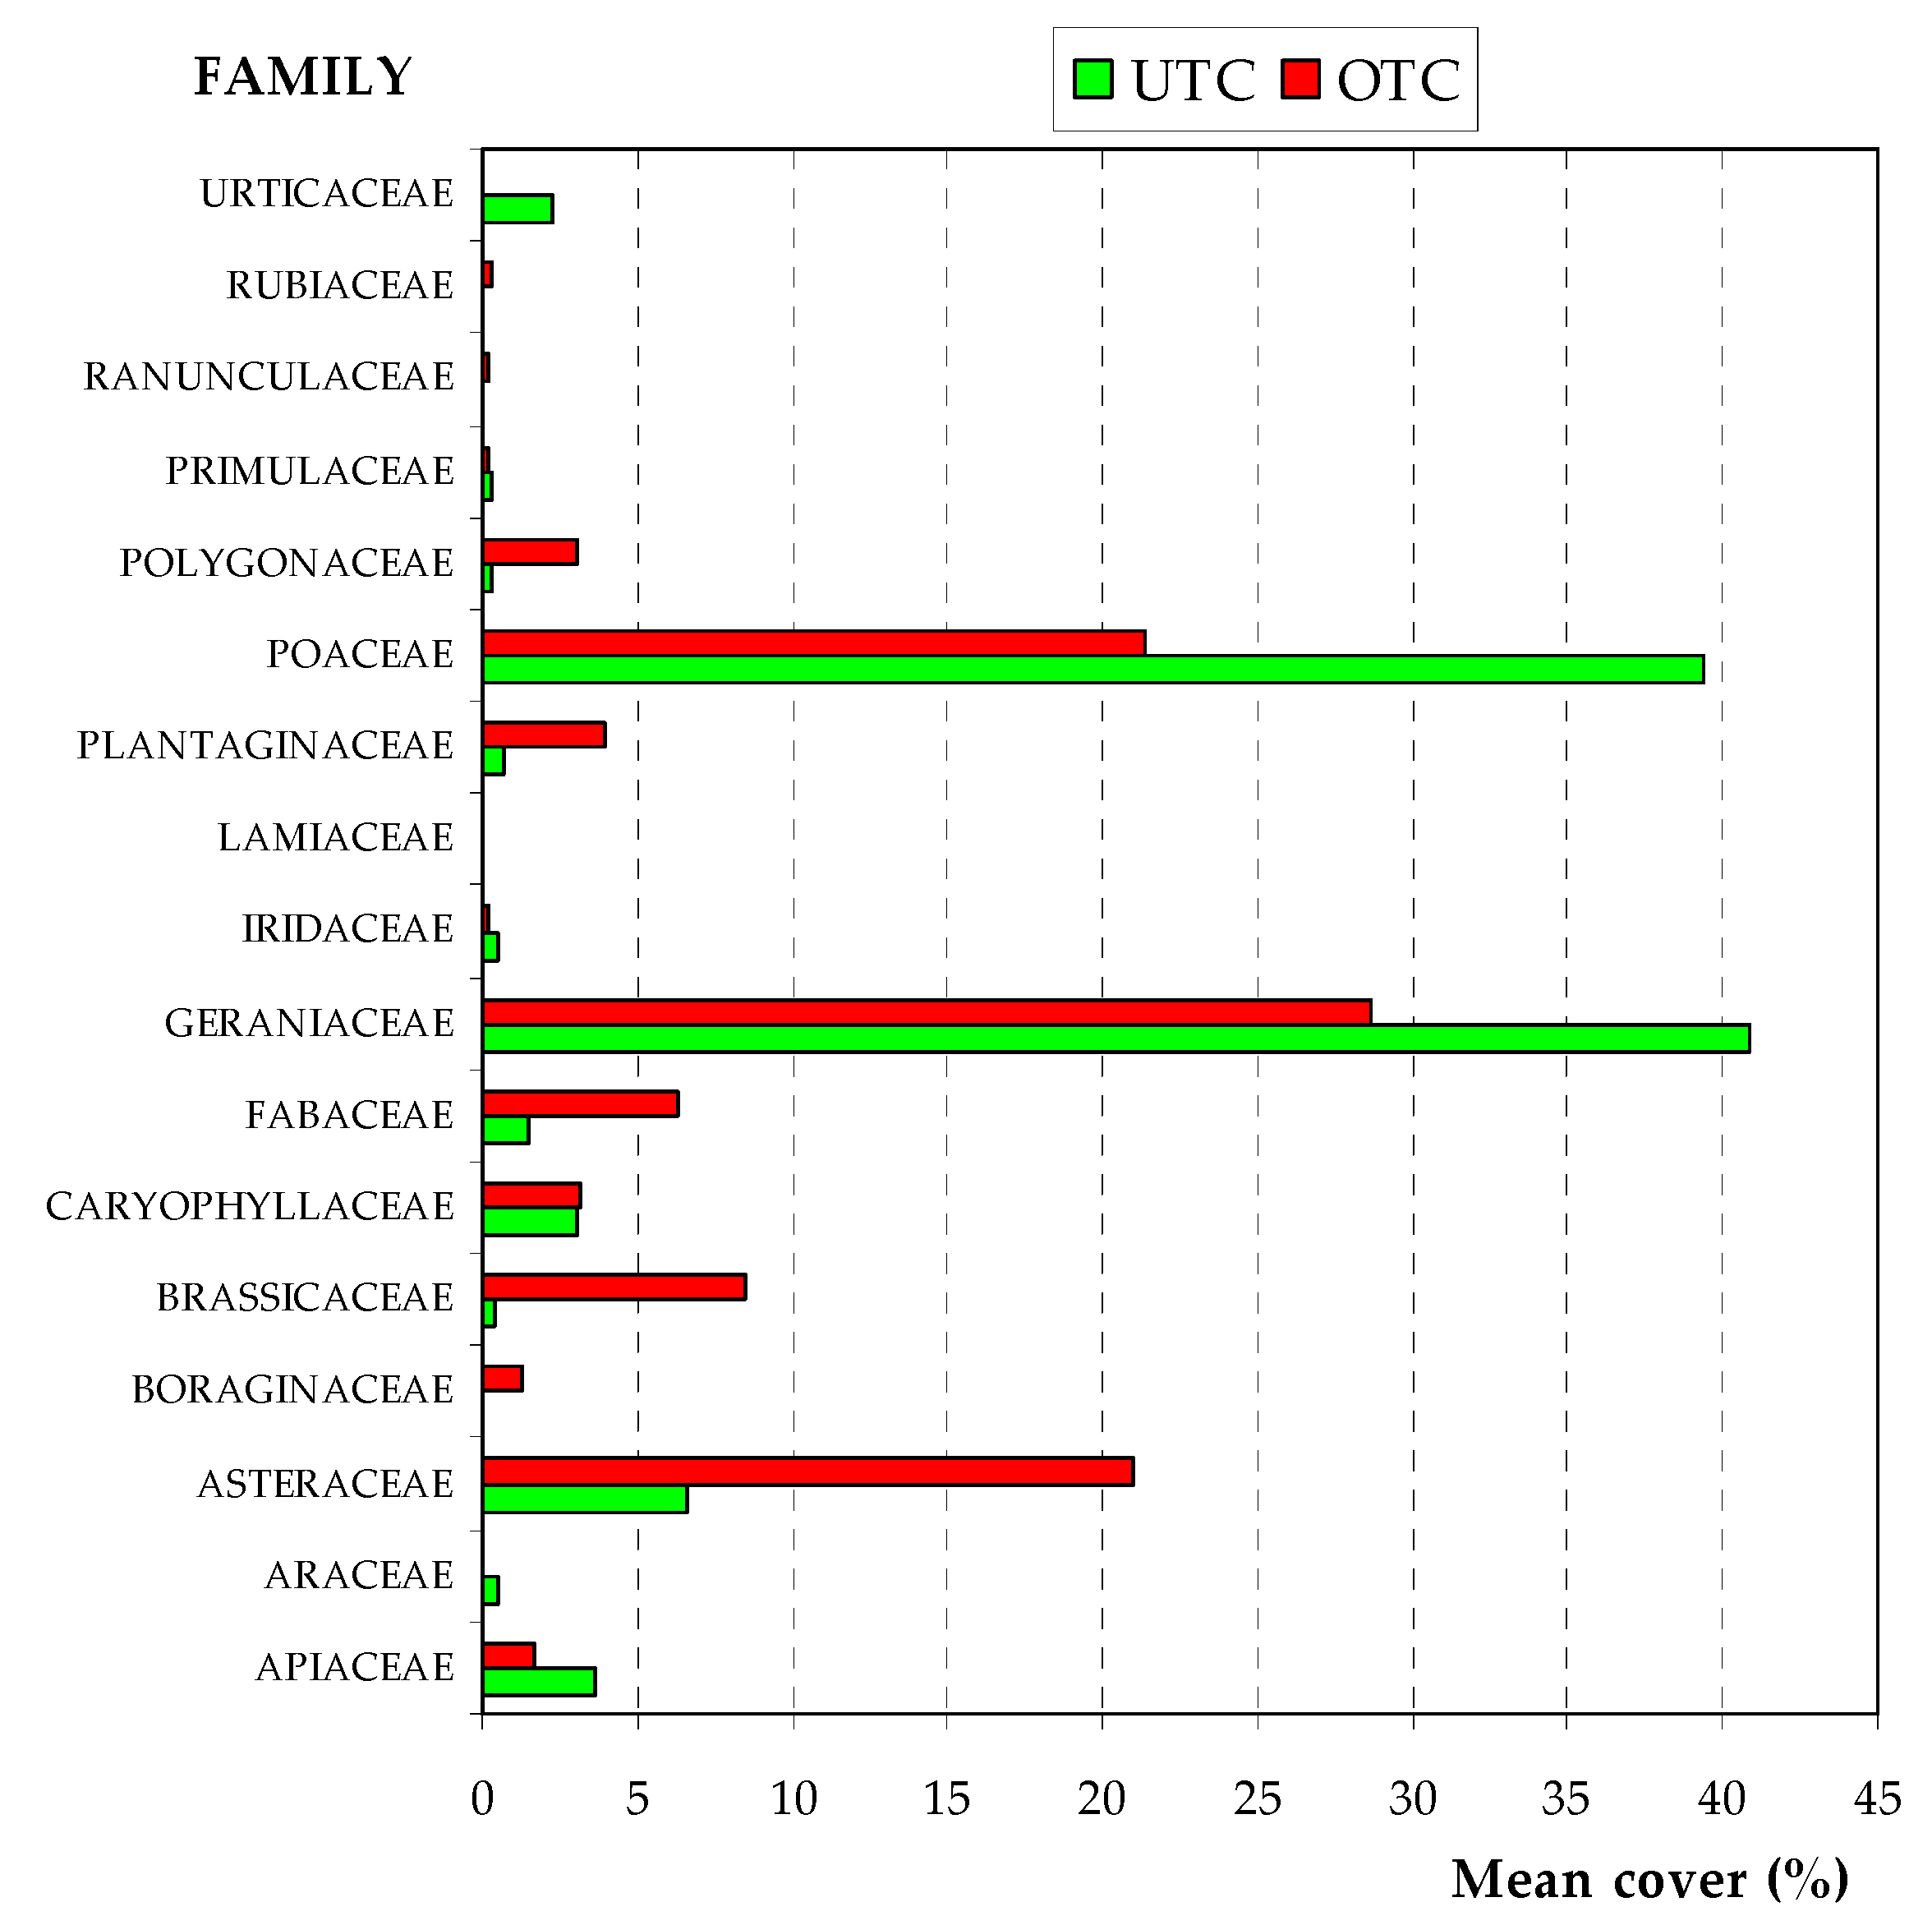
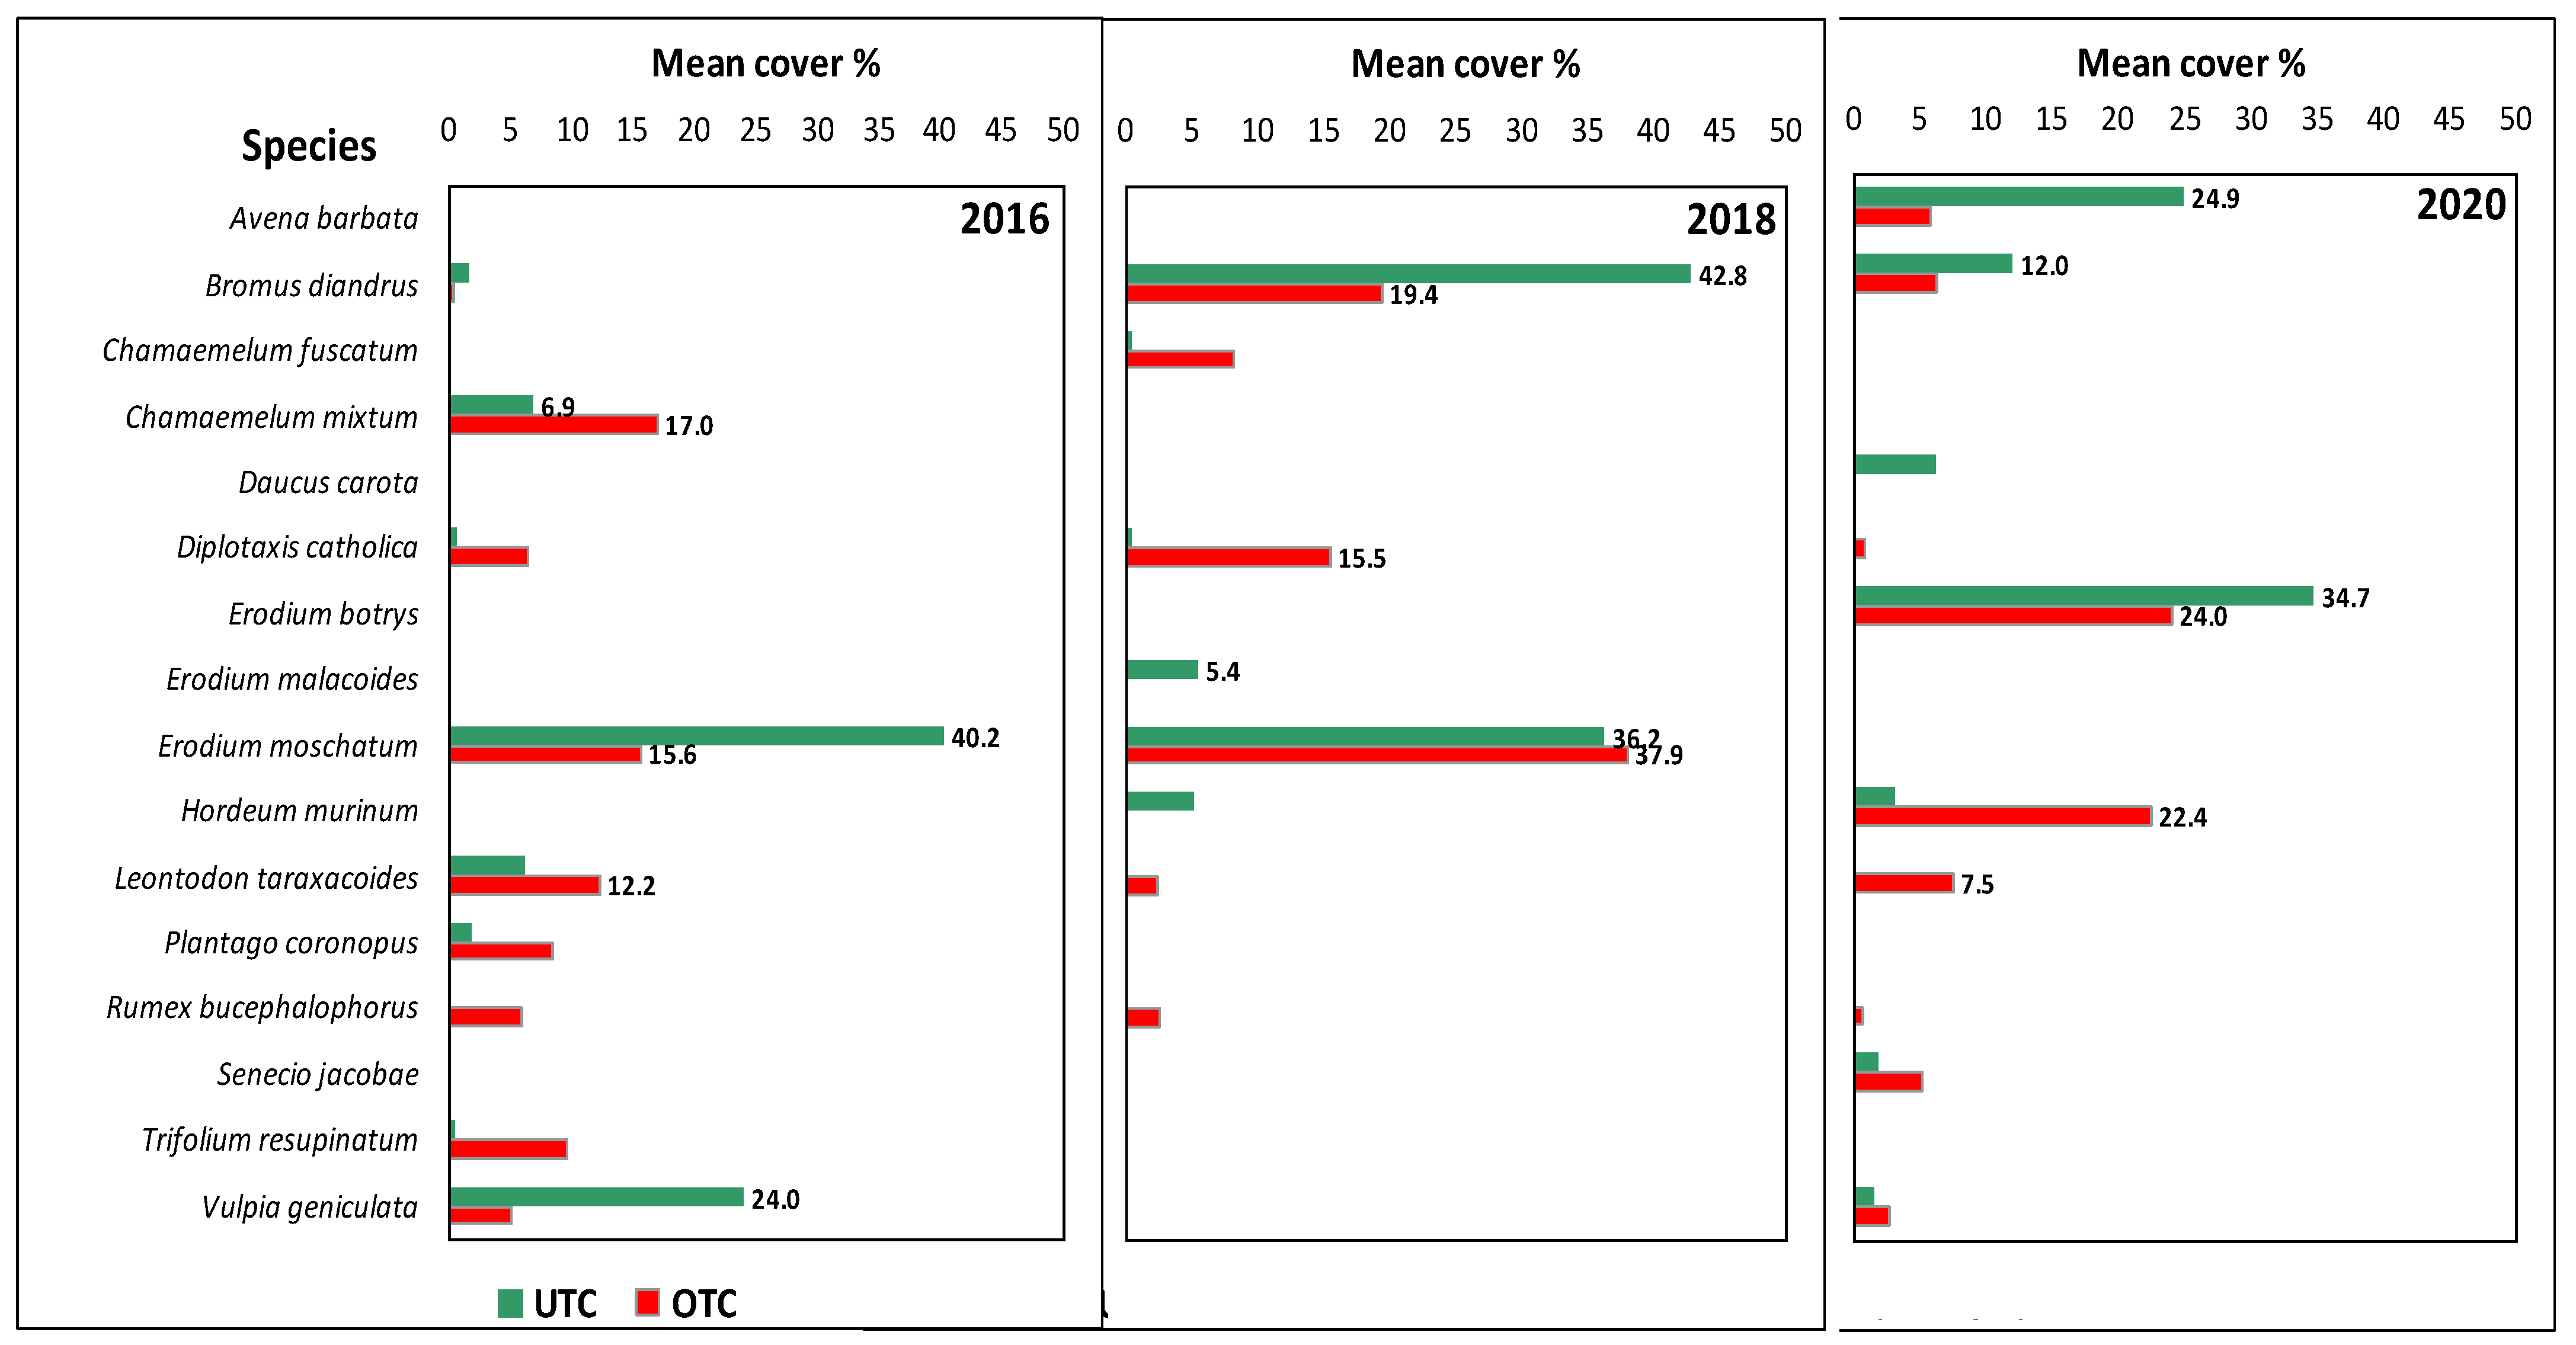
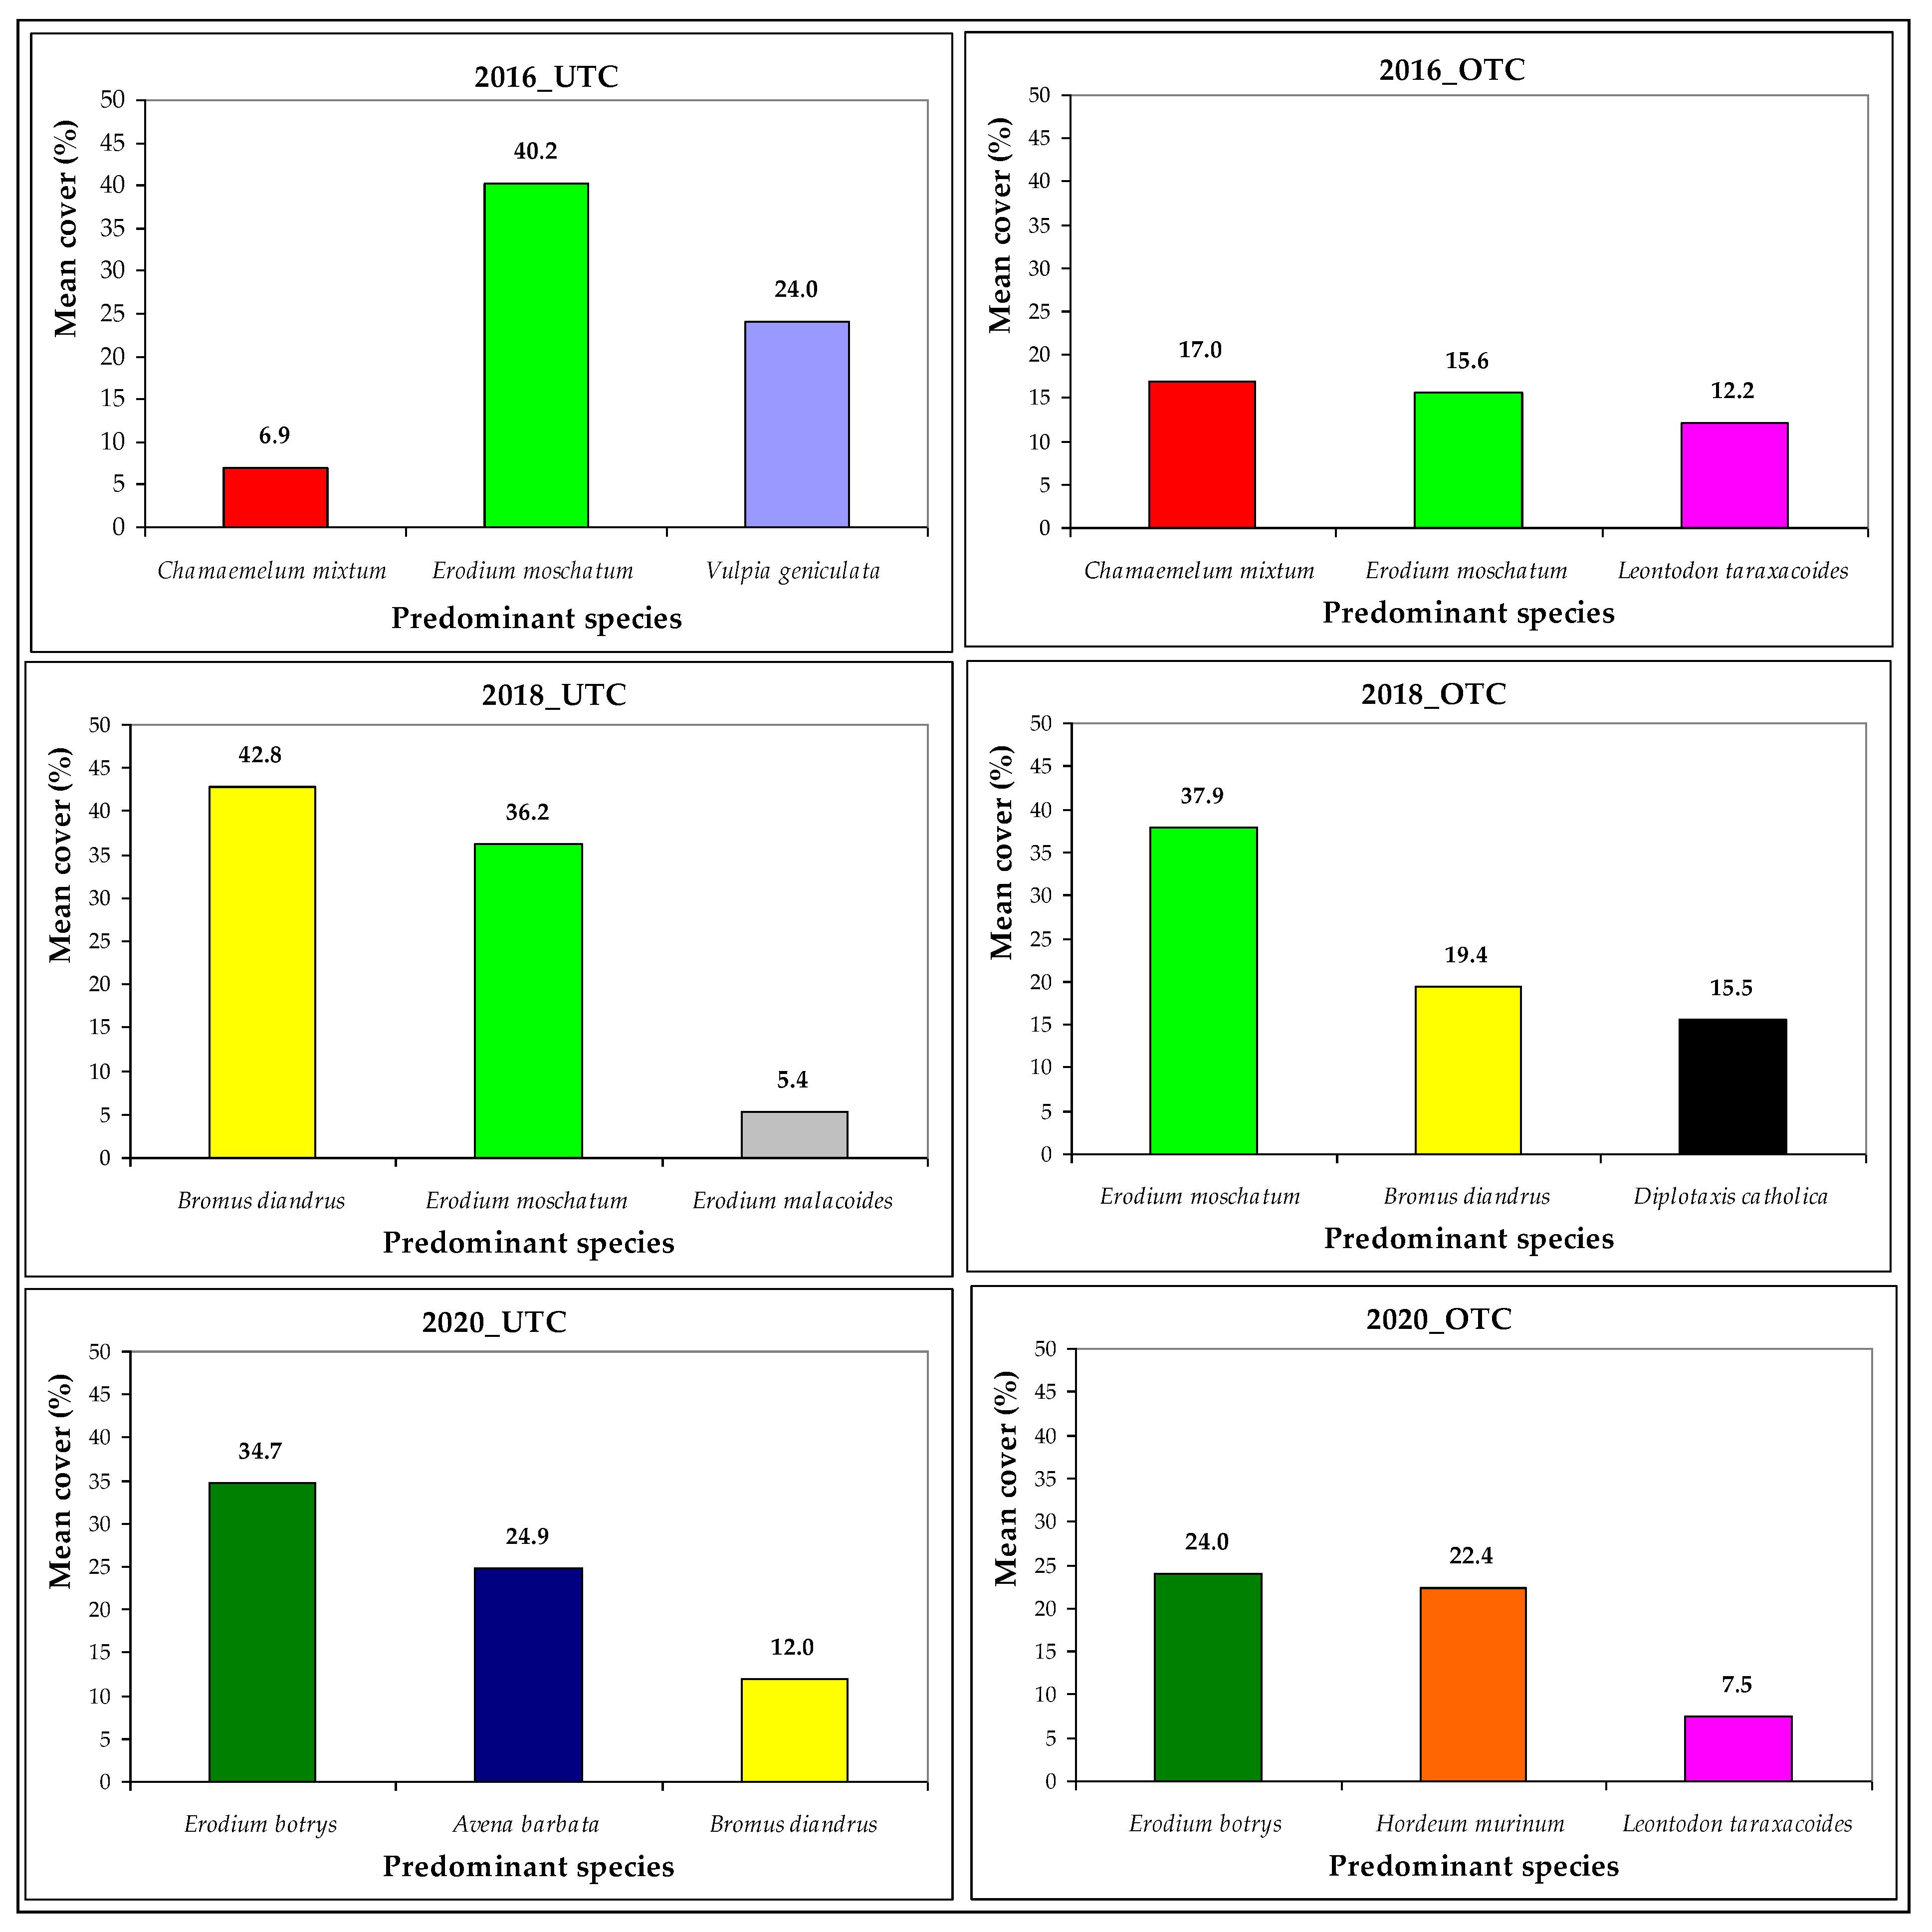
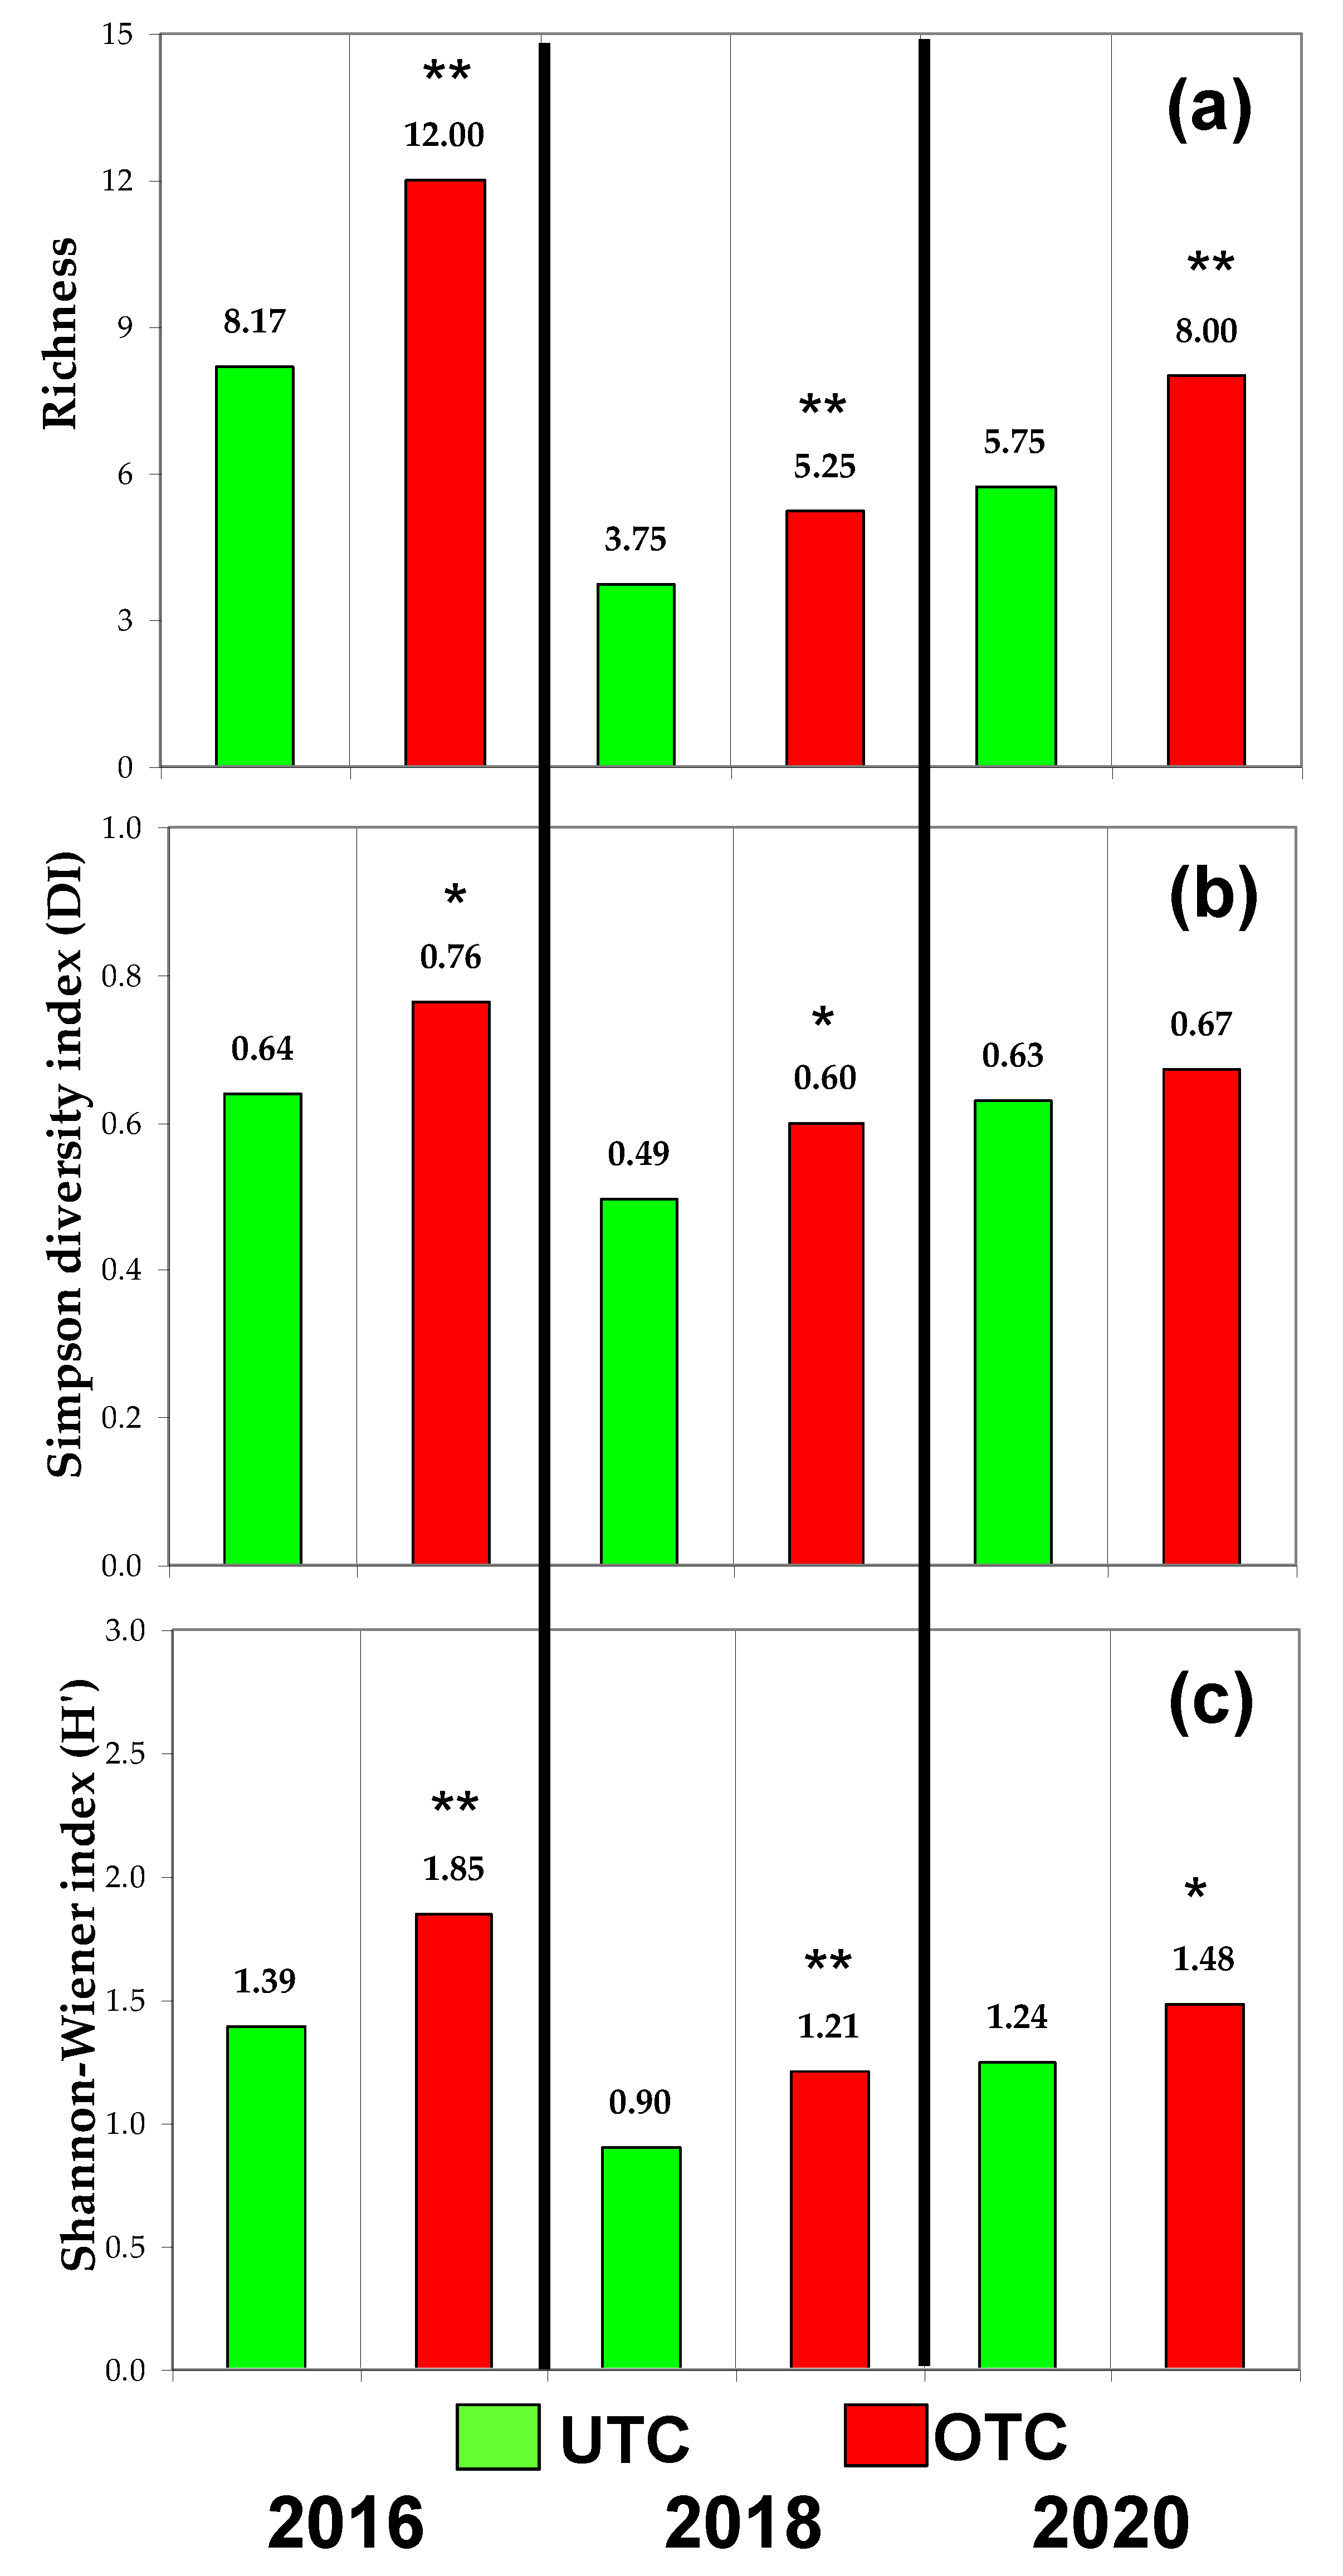
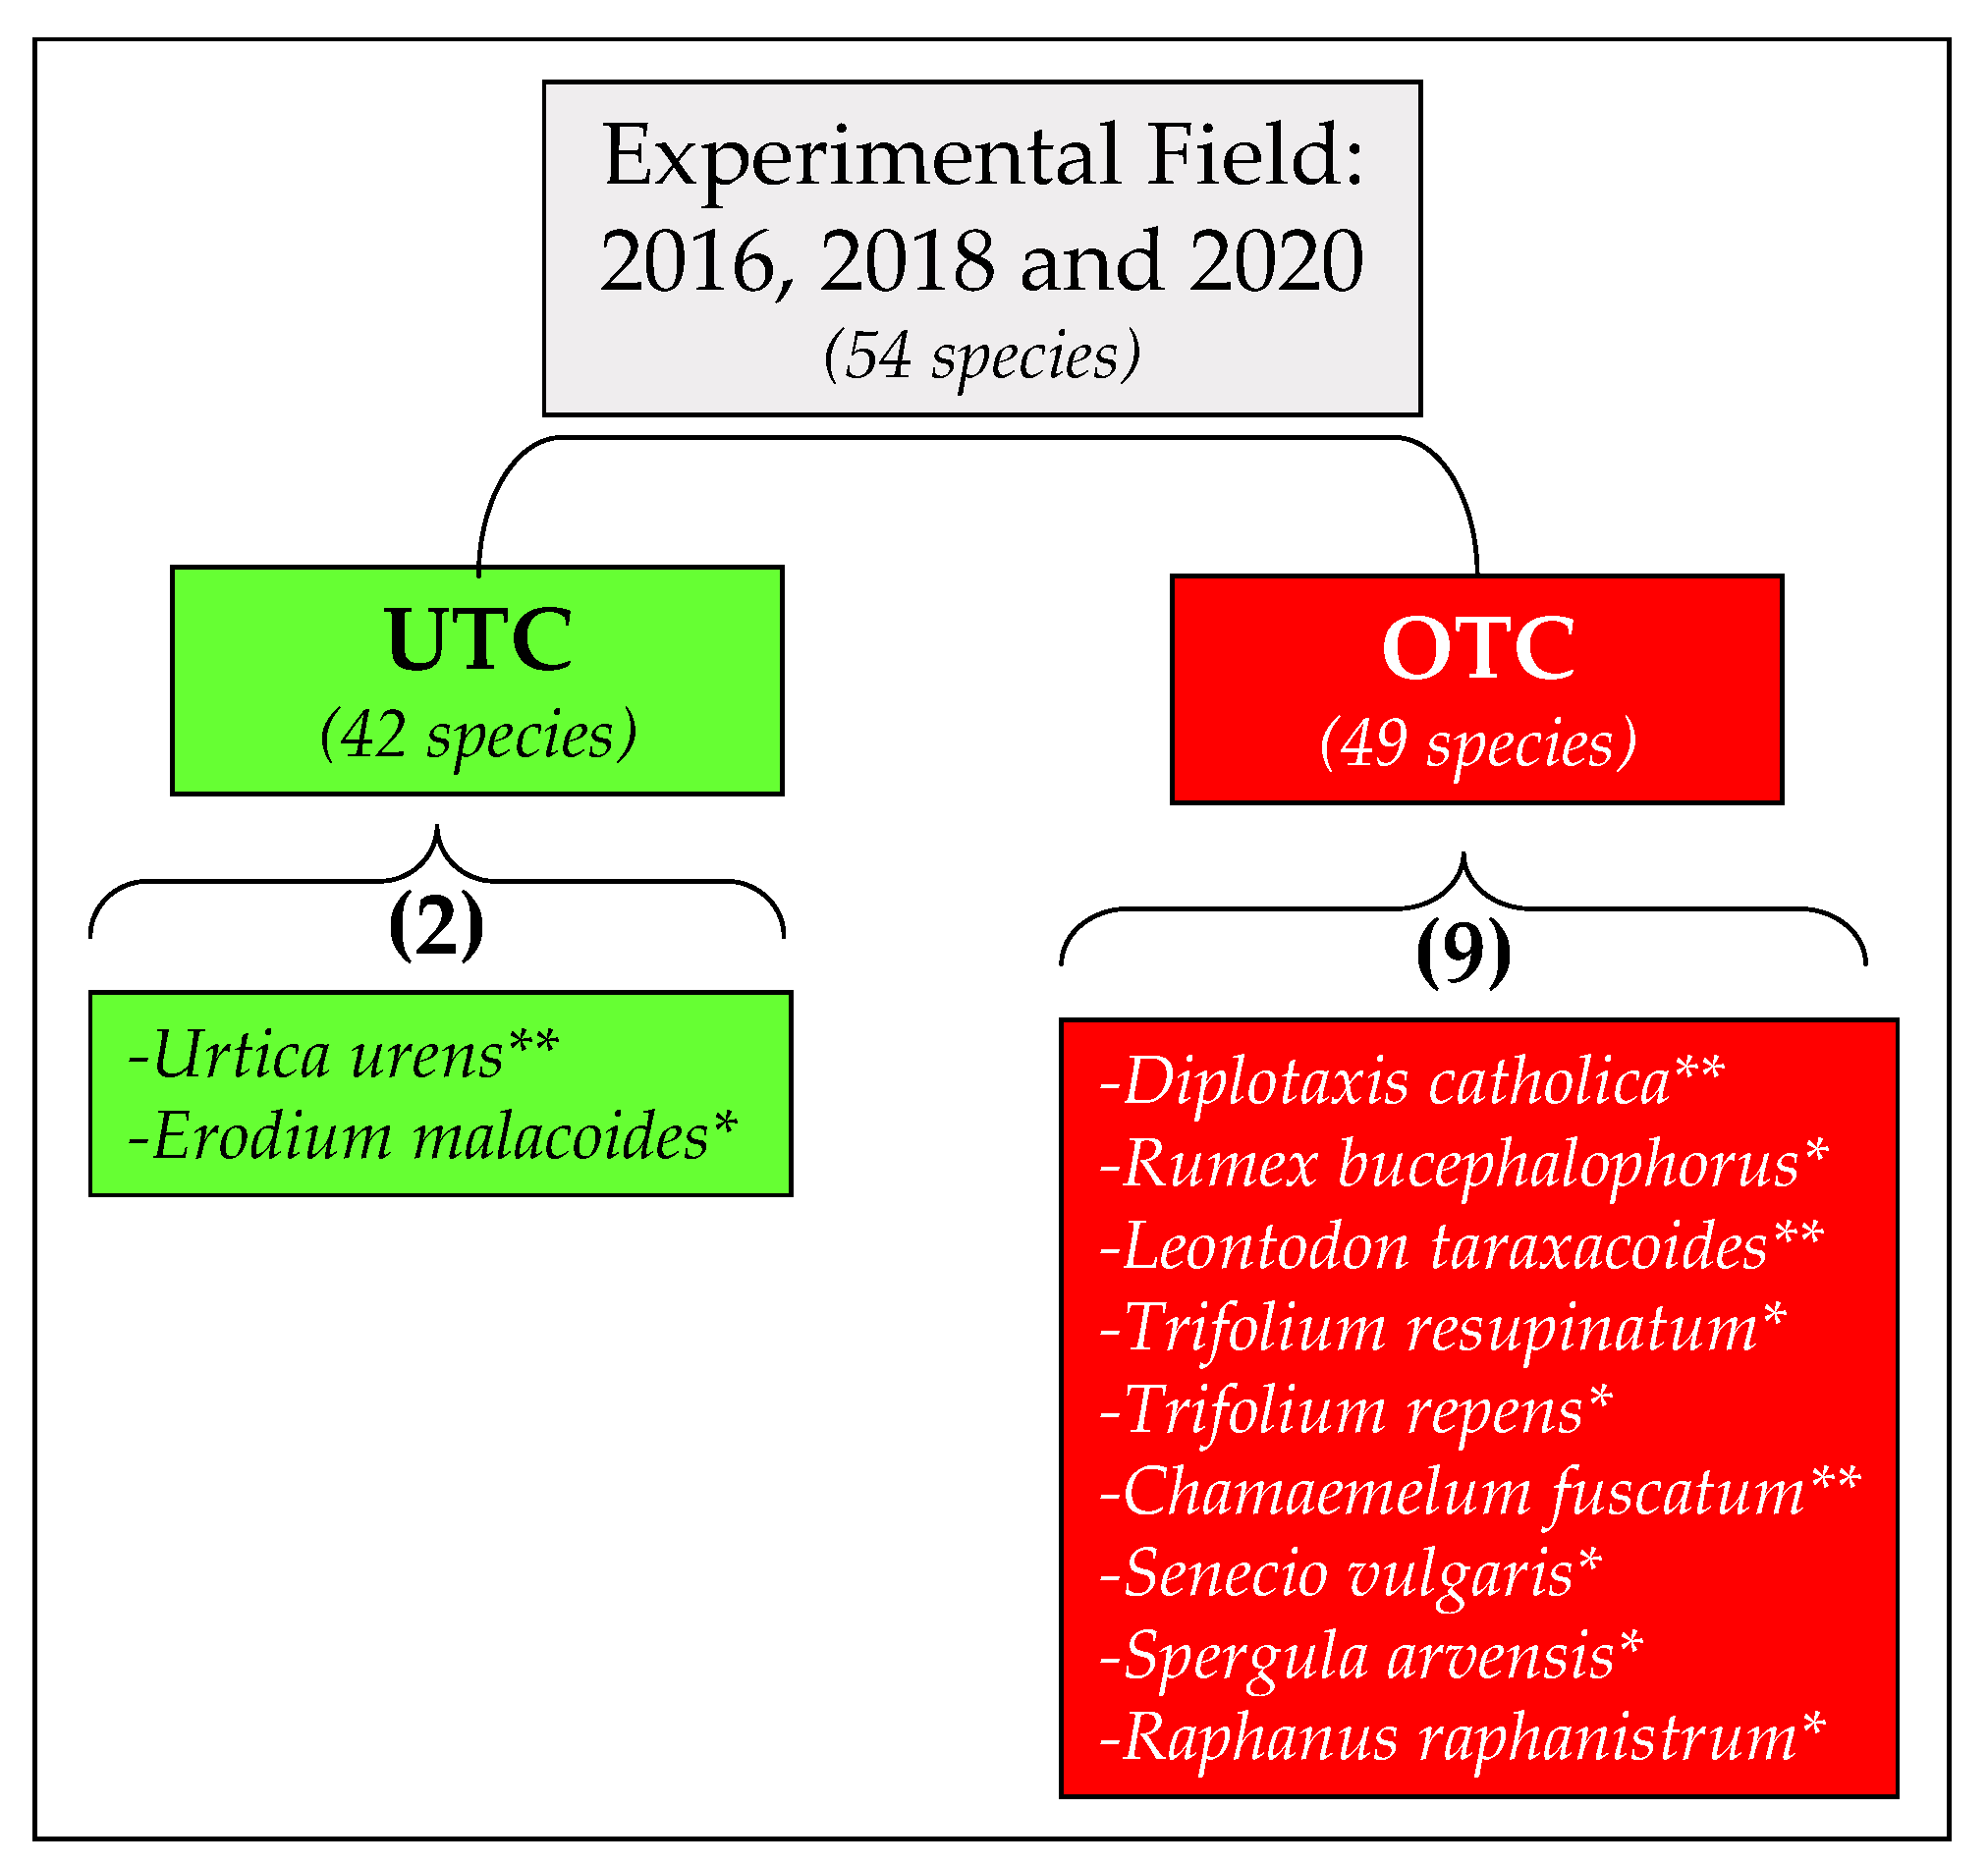
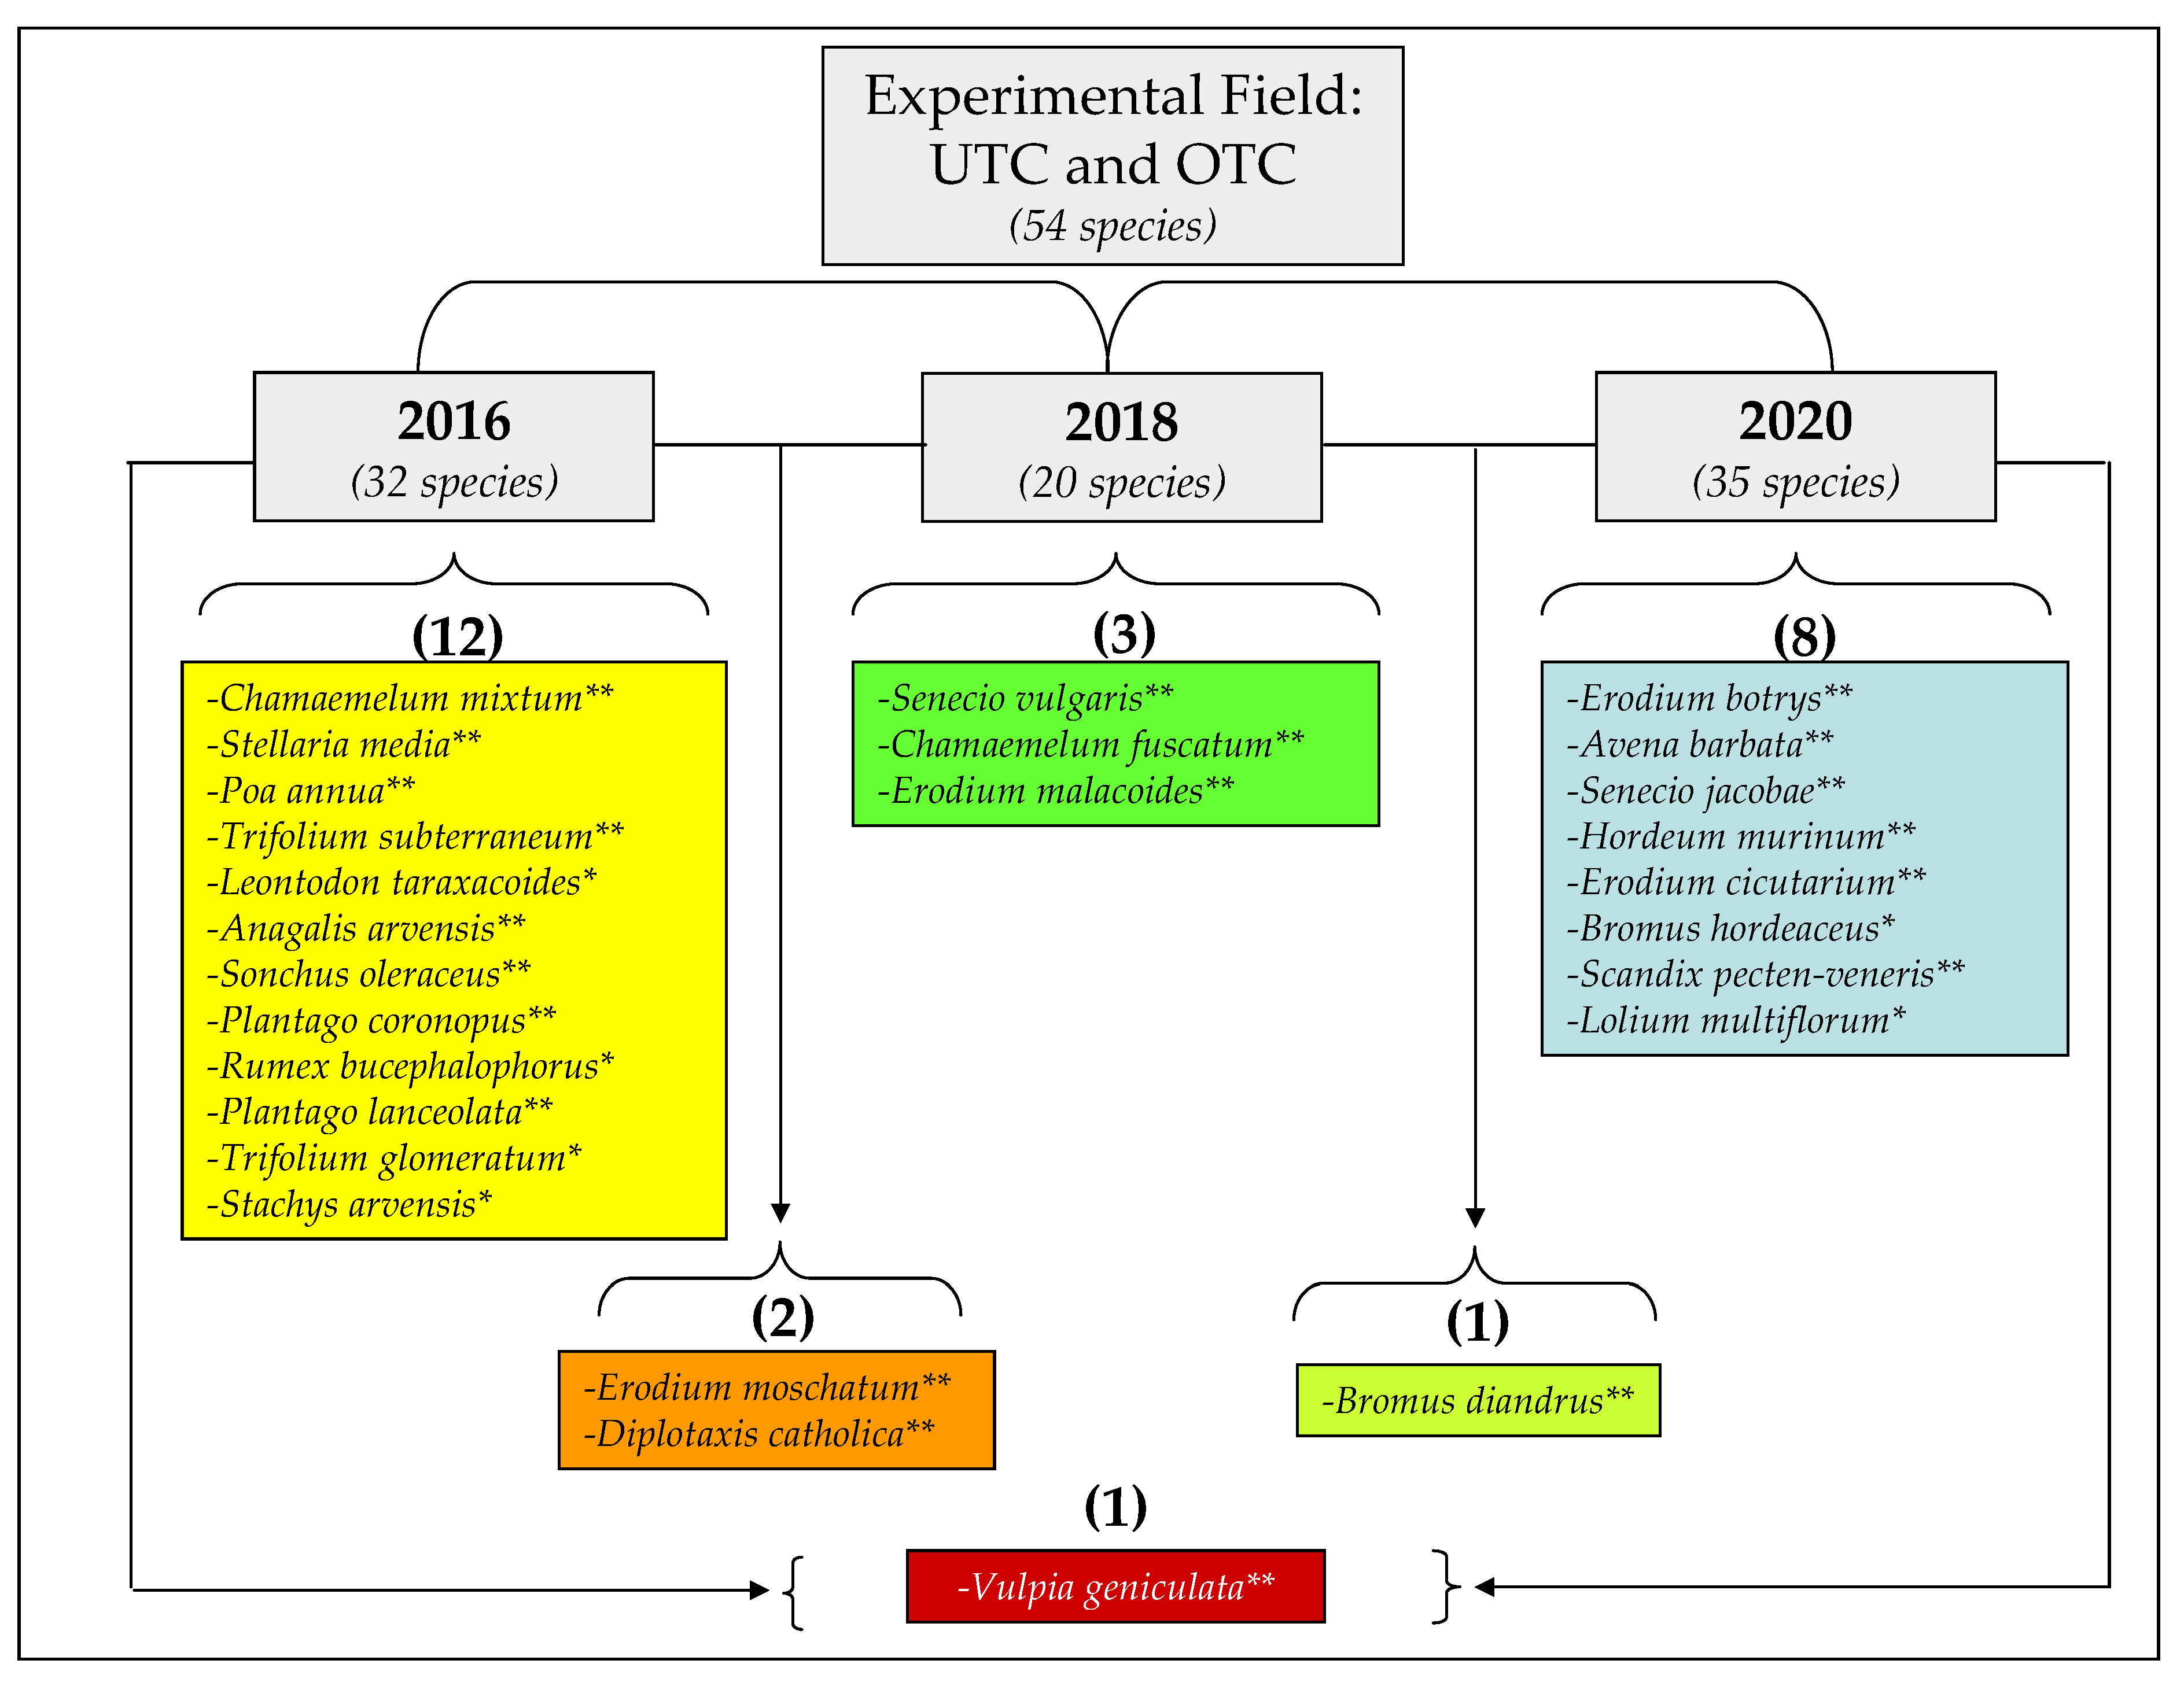
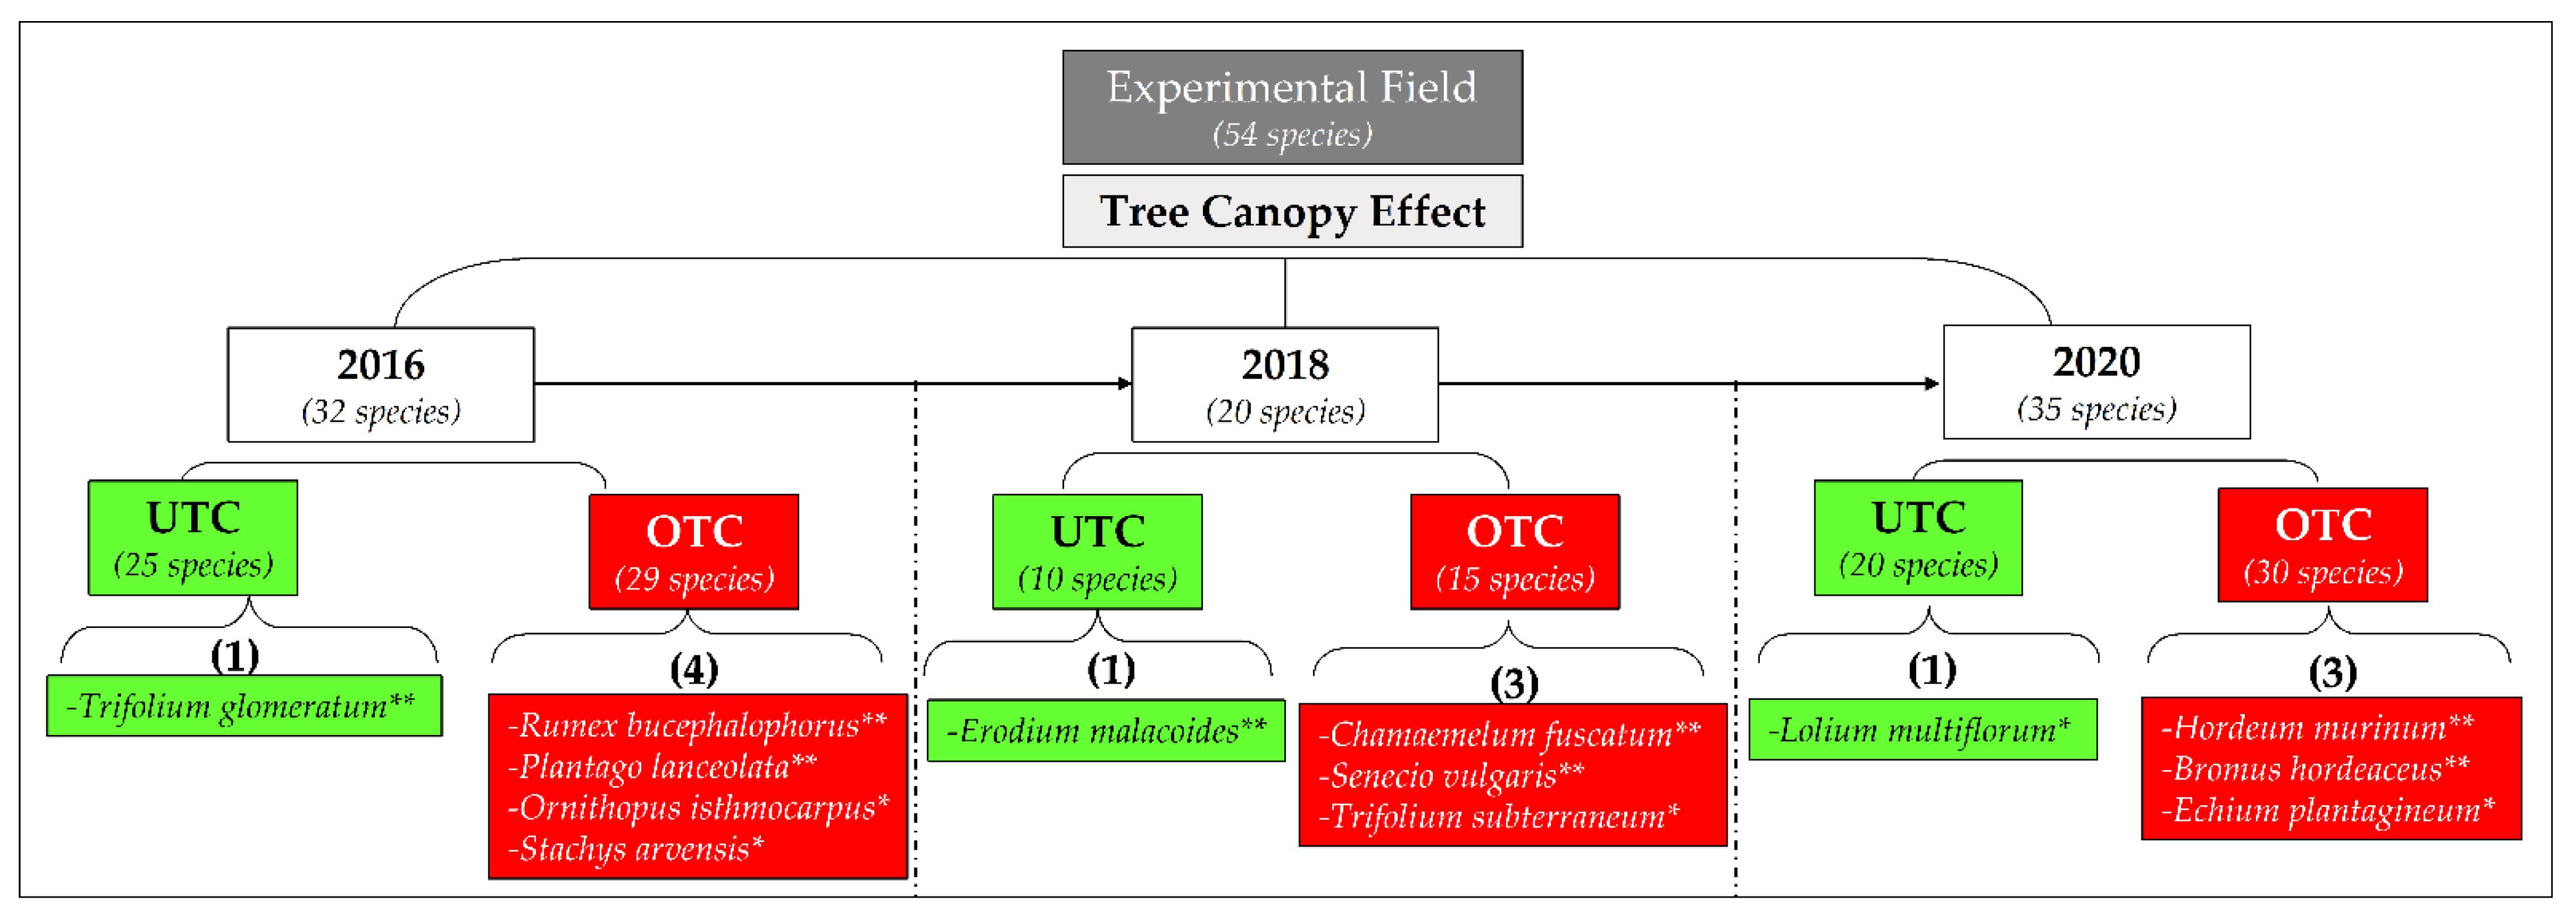
3.3. Pasture Floristic Composition UTC and OTC

The results of pasture floristic composition (FC) evaluations, carried out UTC and OTC in spring 2016, 2018 and 2020, are presented in Table 3. The different species in each area (UTC and OTC) and in each year (2016, 2018 and 2020) are indicated by bold font. Over the three evaluation dates (2016, 2018 and 2020) a total of fifty-four botanical species (forty-two UTC and forty nine OTC) were identified, corresponding to seventeen families. It should be noted that three of these families (Asteraceae, Fabaceae and Poaceae) included twenty-seven species, i.e., 50% of the total number of species (Figure 8). In terms of coverage area, and as an average of three evaluation times (2016, 2018 and 2020), species from just two families (Geraniaceae and Poaceae) represented 80.2% of the UTC area, while species from just three families (Geraniaceae, Poaceae and Asteraceae) represented 71.0% of the OTC area (Figure 9).
The temporal evolution showed the presence of thirty-two species in 2016, a significant drop to twenty species in 2018 and a clear recovery to thirty-five species in 2020 (Table 3). Pasture botanical species with mean cover >5% in each evaluation date (2016, 2018 and 2020), UTC and OTC are presented in Figure 10. There was a very dynamic evolution of the predominant species in each area (UTC and OTC) over the years. While in the UTC areas there was a clear predominance of one or two species in each year (Erodium moschatum in 2016, Bromus diandrus and Erodium moschatum in 2018 and Erodium botrys in 2020), in the OTC areas only in 2018 there was a clear predominance of one species (Erodium moschatum), with a more balanced representation of the various species in 2016 and 2020. Figure 11 shows a marked spatial and inter-annual dynamics of the three botanical species with greater ground cover. In 2016 Erodium moschatum, Vulpia geniculata and Chamaemelum mixtum were the predominant species UTC and Chamaemelum mixtum, Erodium moschatum and Leontodon taraxacoides were the predominant species OTC, i.e., Vulpia geniculata and Leontodon taraxacoides were the species that differentiated the UTC and OTC sites. In 2018 Bromus diandrus, Erodium moschatum and Erodium malacoides were the predominant species UTC and Erodium moschatum, Bromus diandrus and Diplotaxis catholica were the predominant species OTC, i.e., Erodium malacoides and Diplotaxis catholica were the species that differentiated the UTC and OTC sites. In 2020 Erodium botrys, Avena barbata and Bromus diandrus were the predominant species UTC and Erodium botrys, Hordeum murinum and Leontodon taraxacoides were the predominant species OTC, i.e., in terms of predominant species only Erodium botrys was common to both areas (UTC and OTC).
The evolution of pasture biodiversity measured through several indices (richness, Simpson’s and Shannon-Wiener) is illustrated in Figure 12. All these indices show the same trend: higher OTC values than UTC and a fall in 2018, compared to 2016 and 2020, which is in line with the aforementioned significant drop of species number in 2018, followed by an important recovery in 2020.
After assessing the trends in terms of biodiversity patterns in the overall study period (2015–2020), two bio-indicator species associated with UTC areas and nine bio-indicator species associated with OTC areas were identified through indicator species analysis (ISA) (Figure 13). Dendogram representing the ISA application by year of evaluation (Figure 14) shows a total of twenty seven different indicator species, that is half of the total species that were present in the experimental field throughout the study, twelve in 2016 (at the beginning of the study), three in 2018 (at the middle of the study, after a correction of the soil pH), eight in 2020 (at the end of the study, after two corrections of the soil pH and one fertilization), two in 2016 and 2018, one in 2018 and 2020, and one in 2016 and 2020. Dendogram representing ISA applied to the pair tree canopy effect-year (tree canopy effect in each evaluation, 2016, 2018 and 2020; Figure 15) shows one indicator species of UTC areas in each year and three (in 2018 and 2020) or four (in 2016) indicator species associated to OTC areas, all different, confirming the great dynamics and inter-annual variability of pasture FC.

4. Discussion

Reliable measures of biomass, composition of plant communities and nutritive value are critical to assessing the ecological health of a landscape and provide important indicators of the status of pastures, allowing managers to make informed decisions [11]. Pasture growth rates vary due to abiotic (soil, climate, elevation, among others) and biotic conditions (pasture genetic potential, soil microbiology, grazing management, among others) which together highlight the need for regular paddock-level pasture cover assessment [32]. This need is especially justified in Mediterranean areas, globally facing a challenge in terms of management and decision-making policies addressing dynamic processes and patterns of biodiversity that ensure long-term ecosystem conservation [13]. Efficient pasture management is one of the key factors governing economic viability of the ruminant meat industry by ensuring accurate and well-planned pasture allocation for optimal grazing [2].

4.1. Soil Variability and Pasture Productivity and Quality UTC and OTC

The spatial variability of soil parameters has been published in several works on agro-forestry systems [33,34,35]. Areas under tree canopy tend to increase soil fertility [4,5,36,37] as a result of the combined effect of trees and animal grazing [4,5], through the input of organic matter in sheep feces (dung and urine), of leaves of the trees and through nutrient redistribution [35,38]. These modified conditions under tree canopies, with changes in certain soil properties, create conditions for differences in pasture productivity, mediated by shifts in plant community composition [12]. Soil parameters, especially texture and fertility, have been considered the main drivers of vegetation characteristics, factors causing structural and floristic variation of vegetation [34] and may even enable the germination and establishment of woody species which otherwise would not succeed in open pasture conditions [38].
This soil spatial variability is the basis of the concept of Precision Agriculture, seeking to identify homogeneous management zones and implement a different management for each one of them according to their productive potential or their limitations [16]. Different management at the level of pastures in the Montado ecosystem may involve, for example, correction of pH or soil fertilization, reseeding of botanical species, stocking rates or grazing intervals in each parcel [39]. In this study, the re-evaluation of pH, Mg and Mn six years after the start of the project (Table 2) and after soil amendments (twice) and fertilization (once), in addition to permanent grazing by sheep, showed significant changes, although slight and positive, in pH and Mg/Mn ratio. It is known that soil acidity restricts agricultural production, mainly due to nutrient deficiency (or unavailability) and toxicity by metals such as Mn [6]. Manganese toxicity is one of the most important limiting factors of crop productivity in the South of Portugal [6], leading to the general practice of applying dolomitic limestone to the extensive pastures of the Alentejo region, acting at the level of the soil reaction but also favouring the Mg/Mn ratio [40]. The results of our study, having led to a slight rise in pH and a clear improvement in the Mg/Mn ratio (practically doubled between the beginning and the end of this study), show that the surface application (not incorporated into the soil through mobilization) of amendments/fertilizers does not result in an immediate and significant increase in the soil pH/fertility, but rather in a gradual increase over time [41]. That is why these studies on the effect of interventions to improve soil fertility should span several years or even decades [10], to allow time for this complex system to readjust itself, visibly improving the productivity of the crops.
Despite the greater fertility normally associated with areas UTC, competition for resources (water, light, and nutrients) between tree and pasture roots is the main reason for decreased crop yields in these areas [4]. It is important to add the potential effect of soil compaction provided by animals, especially in resting areas, preferably under the tree canopy [33]. Soil UTC tends to have higher density and lower porosity as a result of the greater compaction caused by the animals [36]. These factors (tree roots and animal grazing) can explain the significantly higher SCI values measured by the cone penetrometer in UTC areas in the 0.15–0.30 m soil layer (Figure 6).
Among the abiotic factors that, in addition to the soil, influence the development of pasture, climatic factors stand out, especially temperature and precipitation [12]. Despite the tendency in this region for the average temperature to fall by 3–5 °C in autumn and a tendency to rise on average by 2–3 °C in spring [1], the main abiotic factor that will affect the phenological responses and the growth of different botanical species of these biodiverse pastures [12] is the distribution of precipitation [10]. In terms of accumulated rainfall, in the three years in which the pasture assessment was carried out, the first (2015/2016) can be identified as relatively dry (accumulated rainfall of 466 mm), especially in autumn (only 53 mm), but the second and third years (respectively, 2017/2018 and 2019/2020) can be considered normal (accumulated rainfall of 683 mm and 668 mm, respectively), with the precipitation evenly distributed in the autumn, winter and spring seasons. In comparative terms, the reduced rainfall of autumn 2015/2016 may have delayed the emergence of the pasture (which takes place a few days after the first significant rains) and, therefore, it may have shortened the productive cycle of the pasture. These factors (temperature and rainfall) directly affect the pasture in terms of surface temperature and available soil moisture, both with direct impact on dryland productivity [42].
Tree canopy effect is potentially positive for the development of the pasture in winter, preventing the soil/pasture surface temperature from falling to values close to 0 °C. On the other hand, the lower soil/pasture surface temperature UTC during spring months may have a positive effect on the pasture by delaying the conclusion of the vegetative cycle (and the consequent quality degradation) [42], but it may also lead to lower pasture productivity in these areas, reflecting lower light transmission to the understory and, consequently, the reduction of photosynthetic rates in zones with lower sun exposure [43]. Light interception by plant leaves is used in photosynthesis to provide energy for plant maintenance, to grow new leaves and roots, and to produce carbohydrates stored within cells and translocated to energy sinks [44].
Another aspect that can be responsible for the lower pasture productivity UTC is related to the SMC pattern: throughout the vegetative cycle, higher SMC values were systematically observed OTC than UTC at all depths (0.10 m, 0.20 m and 0.30 m). Nonetheless this issue is not consensual. While some studies refer to the tendency for greater accumulation of moisture UTC due to positive effect of tree shade on the reduction of evapotranspiration [4,38], other studies show that the soil beneath trees has lower moisture content than soil beneath open pasture [42]. The latter is based on the reduced rainfall received by the understorey due to the interception by tree canopy and evaporation [42]. The general pattern of SMC (UTC and OTC), with an abrupt break at the beginning of spring, associated with a significant increase in temperature are decisive factors for the evolution of the vegetative cycle of the dryland pastures, with a decrease in their nutritional value during spring [39]. Soil water deficit results in lower forage dry matter yield, primarily due to limited leaf area development, and reduced photosynthesis caused by stomatal closure [4]. Pullanagari et al. [45] also showed a positive tree effect on pasture quality and a negative effect on their productivity.
In summary, the effect of trees on pasture is a direct consequence of the extent to which they modify the microclimate and soil properties [4]. It is known that (i) a reduction in the quantity and quality of light UTC directly affects the physiological processes of plants, decreasing pasture carbohydrate synthesis and net dry matter production [42]; (ii) lack of light, cool temperatures and low SMC under trees reduce the growth rate of pasture species, and consequently delay their life cycle [4].

4.2. Pasture Floristic Composition UTC and OTC: Biodiversity and Indicator Species Analysis

One aspect that increases the complexity of this ecosystem is related to the diversity of botanical species involved in these pastures. Preserving the plant diversity is a prerequisite for maintaining high forage nutritive value in grasslands [8,10]. The evaluation of the pasture FC during the study allowed several spatial and temporal approaches. These approaches showed a marked spatial and inter-annual species dynamics, which seems to indicate the joint involvement of several edapho-climatic factors (pH, fertility, soil compaction, temperature, precipitation, etc.), but also the effect of grazing and factors of competition between trees and pasture, or among the various species/families of the biodiverse pastures.
It is recognized that high number of legume species is an indicator of high quality pastures [46]. According to Avdiu et al. [46] the main indicator regarding the degradation of pasture quality is the very small presence of the legumes functional group. In our study the Fabaceae family (which includes the species known as legumes) covered, as an average of three evaluations (2016, 2018 and 2020), only about 2% of the UTC area and only about 7% of the OTC area (Figure 9), and with a clear tendency to decrease over time. The five species of the genus Trifolium present in experimental field in 2016 covered 3.9% of UTC areas and 14.9% of OTC areas, having disappeared in UTC areas in 2018 and 2020 and showed very low expression in OTC coverage areas (1.1% in 2018 and 2.3% in 2020), which seems to be a clear indicator of pasture quality impoverishment. The negative effect of soil acidity and the presence of high levels of Mn on legume species was also referred by Paço et al. [6]. According to these authors, even among legumes, the tolerance to these soil conditions depends on the plant species, for example, Trifolium repens is considered very sensitive to acidity and Mn toxicity, while the Trifolium subterraneum is considered to be relatively tolerant. In terms of balance, another aspect that can indicate a low pasture quality in this experimental field is a clear preponderance of species from the Poaceae (Gramineae) family, usually with low nutritional value for animal grazing [19]: in average, these covered approximately 22% of OTC area and approximately 40% of UTC area. According to Costa and Mesquita [47] the major feature of the dominance of this family in many degraded pastures is related to the way most of their species grow with dense clumps or the presence of rhizomatous and stoloniferous individuals widely scattered in the weed community.
Land-use change is a major driver of plant species richness [7]. Relative to the 2016 assessment, pasture in spring 2018 showed a significant increase of productivity in terms of DM (in kg ha−1), both UTC (with a relative increase of 20%) and OTC (with a relative increase of 43%). This higher productivity may have resulted from the greater amount of accumulated rainfall (683 mm in 2018 against 466 mm in 2016) but also from the effect of the application of dolomitic limestone (in November 2017). As mentioned above, however, this second evaluation revealed an important drop in the number of botanical species (from thirty-two species in 2016 to twenty species in 2018). According to Socher et al. [14], generally, more intensive land use leads to higher productivity, mostly driven by fertilization/correction, however, species richness declines with increasing site productivity, at least in anthropogenic grassland.
Pasture in spring 2020 showed a significant decrease of productivity in terms of DM (in kg ha−1), both UTC (with a relative decrease of 45%) and OTC (with a relative decrease of 25%) when compared to the 2018 assessment. This drop of productivity was unexpected, as rainfall was similar (668 mm in 2020 against 683 mm in 2018) and land management included a binary fertilizer application (P and N; in December 2018) and a new application of dolomitic limestone (in June 2019). Despite this drop in productivity, there was a good response in terms of biodiversity, with the recovery of the diversity of species present (going from twenty species in 2018 to thirty-five species in 2020), thus confirming the inverse relationship suggested by Socher et al. [14] between species richness and pasture productivity. In this study, however, it is not possible to evaluate synergistic or competitive phenomena between botanical species, and the distribution and coverage in the experimental field may reflect their efficiency in reproduction and dispersion, as well as survival strategies specific to each [48].
The evolution of pasture biodiversity measured through several indices (richness, Simpson’s and Shannon-Wiener) show higher OTC values than UTC and a fall in 2018, compared to 2016 and 2020, which is in line with the aforementioned significant drop of species number in 2018, followed by an important recovery in 2020. The smaller number of species present UTC may, therefore, reveal the reduced capacity of some botanical species to sustain animal grazing, especially with moist soil in autumn and winter, or the effect of tree shade [36]. On the other hand, pasture quality measured by CP content [8] systematically (in the three evaluation moments: Spring 2016, 2018 and 2020) presented values significantly higher UTC than OTC, which is in line with several works [4,39,42,43]. Therefore, it can be concluded that the higher quality resulting from the delay in the conclusion of the pasture vegetative cycle (and the consequent quality degradation) due to the microclimate created under the tree canopy at Spring [43] is superimposed on the loss of quality that may result from the lower diversity of botanical species. However, these diversity indices do not capture whether and how different functional plant groups respond distinctly to different aspects of land use [14].
Thus, after assessing the trends in terms of biodiversity patterns, IV, were obtained through ISA [31]. Based on the criteria proposed by Dufrêne and Legendre [49], only eight of the fifty-four botanical species can be considered strong bio-indicator for each group (IV > 25%). The five botanical species with higher values were: Bromus diandrus (54%), Sherardia arvensis (51%), Vulpia geniculata (49%), Erodium moschatum (45%) and Raphanus raphanistrum (41%). Bio-indicator species associated with UTC areas and OTC areas in the overall study period (2015–2020), in each year of evaluation (2016, 2018 and 2020), and in each pair tree canopy-year (tree canopy effect in each evaluation, 2016, 2018 and 2020) were identified. This study revealed two bio-indicator species associated with UTC areas and nine bio-indicator species associated with OTC areas, which shows greater stability of floristic patterns OTC than UTC and that allows the interpretation of the IV as predictive value [14]. This stability of tree effect reflects the accumulated consequence of several decades in this Montado ecosystem [19]. The ISA by tree effect and year, shows that half of the total species present in the experimental field (twenty-seven species) were identified as indicator species, different at all times of evaluation. The ISA by year shows one indicator species of UTC areas in each year and three (in 2018 and 2020) or four (in 2016) indicator species associated to OTC areas, which are all different. This behaviour confirms the great dynamics and inter-annual variability of pasture FC and reveals the complexity of identifying bio-indicator species of areas where fertilizer or dolomitic limestone was applied, especially because it is a slow and gradual process [28]. In the Montado ecosystem this complexity is even greater because grazing intensity is a major factor influencing grassland plant diversity, in particular the ability of sheep to create high fine-scale sward heterogeneity [14]. All these factors are also affected by the marked seasonality and inter-annual variability of the temperature-precipitation pair, characteristic of the Mediterranean climate [50].

4.3. Perspectives of Application of Grassland Biodiversity Studies

Grassland composition constitutes the basis for various farm decisions at the strategic level (for example, long-term planning decisions), tactical level (for example, medium-term decisions of species for overseeding) or operational level (for example, day-to-day decisions of fertilizer or corrective application, or of grazing intensity) [20]. This type of study, on the effect of trees on vegetation dynamics in pastures, could be a starting point in the design of spatial patterns in the landscape which permit a sustainable exploitation of natural resources in Montado ecosystem [38]. The knowledge of pasture botanical species that are more important for livestock may be achieved by carrying out floristic surveys and phytosociology studies and is a prerequisite for elaborating management programs to recover degraded pastures [47]. Floristic survey is, however, a demanding process, involving the participation of specialists in Conservation Biology, complying with exhaustive procedures and standard protocols. Future studies should incorporate the dynamic processes and patterns of biodiversity that ensure long-term conservation, a critical topic to make accurate predictions that are particularly challenging in the current context of climate change [12,13]. Grassland systems frequently exhibit small-scale botanical and structural heterogeneity with spatio-temporal dynamics, features that present particular challenges for sensor application [20]. It is recognized that plant identification and mapping using sensing technology are incapable of fully replacing field work for comprehensive inventories of species on most landscapes [11]. It is, therefore, expected that in the coming years, within the scope of Precision Agriculture and integrated into the growing incorporation of technology, further research is carried out using systems with complementary proximal and remote sensors, which will help to overcome the limitations of single sensors and provide better information about othe dynamics and evolution patterns of grassland composition [20].

5. Conclusions

The adequate management of the Montado silvo-pastoral ecosystem requires good understanding of the effect of factors such as tree canopy, fertilization and soil amendment on pasture productivity, quality and floristic composition. This study showed a positive effect of tree canopy on soil fertility and pasture quality (in terms of crude protein). Pasture productivity, on the other hand, was higher in areas outside tree canopy. The great potential of Indicator Species Analysis (ISA) as a tool for identification of bio-indicator species characteristic of each study area (under and outside tree canopy) was also demonstrated. The identification of ecological and dynamic attributes (bio-indicator species) constitutes a pre-requisite for management programs to recover degraded pastures and for strategic, tactical and operational farm decisions in the context of the current climate change. In this field, after soil amendment and fertilization, it would now be recommended to re-establish the balance of botanical species present by incorporating seeds of species from the fabaceae family (legumes), enhancing soil fertility through the fixation of atmospheric nitrogen.

Author Contributions

Conceptualization, J.S., A.P. and M.d.C.; formal analysis, J.S., S.S., L.L.P., F.M. and M.d.C.; funding acquisition, J.S. and M.d.C.; investigation, J.S., E.M. and E.C.; methodology, J.S., S.S., E.M., L.L.P., E.C., F.M., A.P. and M.d.C.; project administration, J.S. and A.P.; supervision, J.S., A.P. and M.d.C.; validation, J.S., S.S., L.L.P. and F.M.; visualization, J.S. and S.S.; writing—original draft preparation, J.S.; writing—review and editing, J.S. and S.S. All authors have read and agreed to the published version of the manuscript.

Funding

This work was funded by National Funds through FCT (Foundation for Science and Technology) under the Project UIDB/05183/2020 and by the projects PDR2020−101-FEADER-032167, PDR2020−101-030693 and PDR2020−101-031244 (“Programa 1.0.1-Grupos Operacionais”).

Institutional Review Board Statement

Not applicable.

Informed Consent Statement

Not applicable.

Data Availability Statement

Not applicable.

Conflicts of Interest

The authors declare no conflict of interest.

References

  1. Serrano, J.; Shahidian, S.; Da Silva, J.M.; Paixão, L.; Carreira, E.; Pereira, A.; Carvalho, M. Climate Changes Challenges to the Management of Mediterranean Montado Ecosystem: Perspectives for Use of Precision Agriculture Technologies. Agronomy 2020, 10, 218. [Google Scholar] [CrossRef] [Green Version]
  2. Punalekar, S.M.; Thomson, A.; Verhoef, A.; Humphries, D.J.; Reynolds, C.K. Assessing Suitability of Sentinel-2 Bands for Monitoring of Nutrient Concentration of Pastures with a Range of Species Compositions. Agronomy 2021, 11, 1661. [Google Scholar] [CrossRef]
  3. Serrano, J.; Shahidian, S.; Da Silva, J.M.; Sales-Baptista, E.; De Oliveira, I.F.; De Castro, J.L.; Pereira, A.; De Abreu, M.C.; Machado, E.; de Carvalho, M. Tree influence on soil and pasture: Contribution of proximal sensing to pasture productivity and quality estimation in montado ecosystems. Int. J. Remote Sens. 2017, 39, 4801–4829. [Google Scholar] [CrossRef]
  4. Benavides, R.; Douglas, G.B.; Osoro, K. Silvopastoralism in New Zealand: Review of effects of evergreen and deciduous trees on pasture dynamics. Agrofor. Syst. 2008, 76, 327–350. [Google Scholar] [CrossRef]
  5. Marcos, G.M.; Obrador, J.J.; Garcia, E.; Cubera, E.; Montero-Parejo, M.J.; Pulido, F.; Dupraz, C. Driving competitive and facilitative interactions in oak dehesas through management practices. Agrofor. Syst. 2007, 70, 25–40. [Google Scholar] [CrossRef]
  6. Paço, A.; Da-Silva, J.R.; Torres, D.P.; Glick, B.R.; Brígido, C. Exogenous ACC Deaminase Is Key to Improving the Performance of Pasture Legume-Rhizobial Symbioses in the Presence of a High Manganese Concentration. Plants 2020, 9, 1630. [Google Scholar] [CrossRef] [PubMed]
  7. Socher, S.A.; Prati, D.; Boch, S.; Müller, J.; Klaus, V.H.; Hölzel, N.; Fischer, M. Direct and productivity-mediated indirect effects of fertilization, mowing and grazing on grassland species richness. J. Ecol. 2012, 100, 1391–1399. [Google Scholar] [CrossRef]
  8. García-Baquero, G.; Odriozola, I.; Aldezabal, A. Floristic Composition Mediates Change in Forage Nutritive Quality of Atlantic Mountain Grasslands after Experimental Grazing Exclusion. Agronomy 2020, 11, 25. [Google Scholar] [CrossRef]
  9. Scocco, P.; Piermarteri, K.; Malfatti, A.; Tardella, F.M.; Catorci, A. Short communication: Effects of summer rainfall variations on sheep body state and farming sustainability in sub-Mediterranean pastoral systems. Span. J. Agric. Res. 2016, 14, 1–4. [Google Scholar] [CrossRef] [Green Version]
  10. Efe Serrano, J. Pastures in Alentejo: Technical Basis for Characterization, Grazing and Improvement; Universidade de Évo-ra—ICAM, Ed.; Gráfica Eborense: Évora, Portugal, 2006; pp. 165–178. (In Portuguese) [Google Scholar]
  11. Ghajar, S.; Tracy, B. Proximal Sensing in Grasslands and Pastures. Agriculture 2021, 11, 740. [Google Scholar] [CrossRef]
  12. Pérez-Ramos, I.M.; Cambrolléb, J.; Hidalgo-Galveza, M.D.; Matías, L.; Montero-Ramírez, A.; Santolaya, S.; Godoy, Ó. Phe-nological responses to climate change in communities of plants species with contrasting functional strategies. Environ. Exp. Bot. 2020, 170, 103852. [Google Scholar] [CrossRef]
  13. Salmerón-Sánchez, E.; Mendoza-Fernández, A.J.; Lorite, J.; Mota, J.F.; Peñas, J. Plant conservation in Mediterranean-type ecosystems. Mediterr. Bot. 2021, 42, e71333. [Google Scholar] [CrossRef]
  14. Socher, S.A.; Prati, D.; Boch, S.; Müller, J.; Baumbach, H.; Gockel, S.; Hemp, A.; Schöning, I.; Wells, K.; Buscot, F.; et al. Interacting effects of fertilization, mowing and grazing on plant species diversity of 1500 grasslands in Germany differ between regions. Basic Appl. Ecol. 2013, 14, 126–136. [Google Scholar] [CrossRef]
  15. Schellberg, J.; Hill, M.J.; Gerhards, R.; Rothmund, M.; Braun, M. Precision agriculture on grassland: Applications, perspectives and constraints. Eur. J. Agron. 2008, 29, 59–71. [Google Scholar] [CrossRef]
  16. Serrano, J.; Shahidian, S.; Da Silva, J.M.; Paixão, L.; Calado, J.; De Carvalho, M. Integration of Soil Electrical Conductivity and Indices Obtained through Satellite Imagery for Differential Management of Pasture Fertilization. AgriEngineering 2019, 1, 567–585. [Google Scholar] [CrossRef] [Green Version]
  17. Serrano, J.; Shahidian, S.; Marques da Silva, J. Calibration of GrassMaster II to estimate green and dry matter yield in Medi-terranean pastures: Effect of pasture moisture content. Crop Pasture Sci. 2016, 67, 780–791. [Google Scholar] [CrossRef]
  18. Serrano, J.; Shahidian, S.; Marques da Silva, J.; Paixão, L.; Carreira, E.; Carmona-Cabezas, R.; Nogales-Bueno, J.; Rato, A.E. Evaluation of near infrared spectroscopy (NIRS) and remote sensing (RS) for estimating pasture quality in Mediterranean Montado ecosystem. Appl. Sci. 2020, 10, 4463. [Google Scholar] [CrossRef]
  19. Serrano, J.; Shahidian, S.; Costa, F.; Carreira, E.; Pereira, A.; Carvalho, M. Can soil pH correction reduce the animal supple-mentation needs in the critical autumn period in Mediterranean Montado ecosystem? Agronomy 2021, 11, 514. [Google Scholar] [CrossRef]
  20. Wachendorf, M.; Fricke, T.; Möckel, T. Remote sensing as a tool to assess botanical composition, structure, quantity and quality of temperate grasslands. Grass Forage Sci. 2017, 73, 1–14. [Google Scholar] [CrossRef]
  21. De Cáceres, M.; Legendre, P.; Moretti, M. Improving indicator species analysis by combining groups of sites. Oikos 2010, 119, 1674–1684. [Google Scholar] [CrossRef]
  22. De Cáceres, M.; Legendre, P. Associations between species and groups of sites: Indices and statistical inference. Ecology 2009, 90, 3566–3574. [Google Scholar] [CrossRef]
  23. IUSS Working Group WRB. World Reference Base for Soil Resources 2014; International Soil Classification System for Naming Soils and Creating Legends for Soil Maps. Update 2015; World Soil Resources Report 106; Food and Agriculture Organization (FAO): Rome, Italy, 2015; 188p. [Google Scholar]
  24. Peel, M.C.; Finlayson, B.L.; McMahon, T.A. Updated world map of the Köppen-Geiger climate classification. Hydrol. Earth Syst. Sci. 2007, 11, 1633–1644. [Google Scholar] [CrossRef] [Green Version]
  25. AOAC. Official Method of Analysis of AOAC International, 18th ed.; AOAC International: Arlington, VA, USA, 2005. [Google Scholar]
  26. Egner, H.; Riehm, H.; Domingo, W.R. Utersuchungeniiber die chemische Bodenanalyse als Grudlagefir die Beurteilung des Nahrstof-zunstandes der Boden. II. K. Lantbrhogsk. Annlr 1960, 20, 199–216. (In German) [Google Scholar]
  27. Braun-Blanquet, J. Pflanzensoziologie, 3rd ed.; Grundzüge der Vegetationskunde; Springer: Vienna, Austria; New York, NY, USA, 1964. [Google Scholar]
  28. Serrano, J.; Shahidian, S.; Da Silva, J.M.; Moral, F.; Carvajal-Ramirez, F.; Carreira, E.; Pereira, A.; De Carvalho, M. Evaluation of the Effect of Dolomitic Lime Application on Pastures—Case Study in the Montado Mediterranean Ecosystem. Sustainability 2020, 12, 3758. [Google Scholar] [CrossRef]
  29. Shore, A. DESeq and Indicator Species Analysis R Script; Figshare, Software: Cambridge, MA, USA, 2020. [Google Scholar]
  30. Oksanen, J.; Blanchet, F.G.; Friendly, M.; Kindt, R.; Legendre, P.; McGlinn, D.; Wagner, H. Vegan: Community Ecology Package; R Package Version 2.5-3; The Comprehensive R Archive Network: Wien, Austria, 2018. [Google Scholar]
  31. Bakker, J.D. Increasing the utility of Indicator Species Analysis. J. Appl. Ecol. 2008, 45, 1829–1835. [Google Scholar] [CrossRef]
  32. Ara, I.; Harrison, M.T.; Whitehead, J.; Waldner, F.; Bridle, K.; Gilfedder, L.; Da Silva, J.M.; Marques, F.; Rawnsley, R. Modelling seasonal pasture growth and botanical composition at the paddock scale with satellite imagery. Silico Plants 2021, 3, 1–15. [Google Scholar] [CrossRef]
  33. Serrano, J.M.; Shahidian, S.; Marques da Silva, J.; Carvalho, M. Monitoring of soil organic carbon over 10 years in a Mediter-ranean silvo-pastoral system: Potential evaluation for differential. Precis. Agric. 2016, 17, 274–295. [Google Scholar] [CrossRef]
  34. Demarchi, L.O.; Scudeller, V.V.; Moura, L.C.; Dias-Terceiro, R.G.; Lopes, A.; Wittmann, F.K.; Piedade, M.T.F. Floristic composition, structure and soil-vegetation relations in three white-sand soil patches in central Amazonia. Acta Amaz. 2018, 48, 46–56. [Google Scholar] [CrossRef] [Green Version]
  35. Škornik, S.; Vidrih, M.; Kaligarič, M. The effect of grazing pressure on species richness, composition and productivity in North Adriatic Karst pastures. Plant Biosyst. 2010, 144, 355–364. [Google Scholar] [CrossRef]
  36. Gómez-Rey, M.X.; Garcês, A.; Madeira, M. Soil organic-C accumulation and N availability under improved pastures estab-lished in Mediterranean Oak Woodlands. Soil Use Manag. 2012, 28, 497–507. [Google Scholar] [CrossRef]
  37. Seddaiu, G.; Porcua, G.; Luigi, L.; Roggero, P.P.; Agnelli, A.; Cortic, G. Soil organic matter content and composition as influ-enced by soil management in a semi-arid Mediterranean agro-silvo-pastoral system. Agric. Ecosyst. Environ. 2013, 167, 1–11. [Google Scholar] [CrossRef]
  38. Guevara, S.; Meave, J.; Moreno-Casasola, P.; Laborde, J. Floristic composition and structure of vegetation under isolated trees in neotropical pastures. J. Veg. Sci. 1992, 3, 655–664. [Google Scholar] [CrossRef]
  39. Serrano, J.; Shahidian, S.; Marques da Silva, J. Evaluation of normalized difference water index as a tool for monitoring pasture seasonal and inter-annual variability in a Mediterranean agro-silvo-pastoral system. Water 2019, 11, 62. [Google Scholar] [CrossRef] [Green Version]
  40. Carvalho, M.; Goss, M.J.; Teixeira, D.M. Manganese toxicity in Portuguese Cambisols derived from granitic rocks: Causes, limitations of soil analyses and possible solutions. Rev. Cienc. Agrar. 2015, 38, 518–527. [Google Scholar] [CrossRef]
  41. Li, G.D.; Conyers, M.K.; Helyar, K.R.; Lisle, C.J.; Poile, G.J.; Cullis, B.R. Long-term surface application of lime ameliorates subsurface soil acidity in the mixed farming zone of south-eastern Australia. Geoderma 2018, 338, 236–246. [Google Scholar] [CrossRef]
  42. Serrano, J.; Shahidian, S.; da Silva, J.M.; Carvalho, M. A holistic approach to the evaluation of the Montado ecosystem using proximal sensors. Sensors 2018, 18, 570. [Google Scholar] [CrossRef] [Green Version]
  43. Guevara-Escobar, A.; Kemp, P.D.; Mackay, A.; Hodgson, J. Pasture production and composition under poplar in a hill environment in New Zealand. Agrofor. Syst. 2007, 69, 199–213. [Google Scholar] [CrossRef]
  44. Rayburn, E.B.; Griggs, T.C. Light Interception and the Growth of Pastures under Ideal and Stressful Growing Conditions on the Allegheny Plateau. Plants 2020, 9, 734. [Google Scholar] [CrossRef]
  45. Pullanagari, R.R.; Yule, I.J.; Tuohy, M.P.; Hedley, M.J.; Dynes, R.A.; King, W. Proximal sensing of the seasonal variability of pasture nutritive value using multispectral radiometry. Grass Forage Sci. 2012, 68, 110–119. [Google Scholar] [CrossRef]
  46. Avdiu, B.; Aliu, S.; Fetahu, S.; Zeka, D.; Rusinovci, I. The floristic composition of the natural pastures in Massive of Novo-berba. Agric. For. 2018, 64, 235–241. [Google Scholar]
  47. Costa, J.P.; Mesquita, M.L.R. Floristic and phytosociology of weeds in pastures in Maranhão State, Northeast Brazil. Rev. Cien. Agron. 2016, 47, 414–442. [Google Scholar] [CrossRef] [Green Version]
  48. Irume, M.V.; Morais, M.L.C.S.; Zartman, C.E.; Amaral, I.L. Floristic composition and community structure of epiphytic angiosperms in a terra firme forest in central Amazonia. Acta Bot. Bras. 2013, 27, 378–393. [Google Scholar] [CrossRef] [Green Version]
  49. Dufrêne, M.; Legendre, P. Species assemblages and indicator species: The need for a flflexible asymmetrical approach. Ecol. Monogr. 1997, 67, 345–366. [Google Scholar] [CrossRef]
  50. David, T.S.; Pinto, C.A.; Nadezhdina, N.; Kurz-Besson, C.; Henriques, M.O.; Quilhó, T.; Cermak, J.; Chaves, M.M.; Pereira, J.S.; David, J.S. Root functioning, tree water use and hydraulic redistribution in Quercus suber trees: A modeling approach based on root sap flow. For. Ecol. Manag. 2013, 307, 136–146. [Google Scholar] [CrossRef] [Green Version]
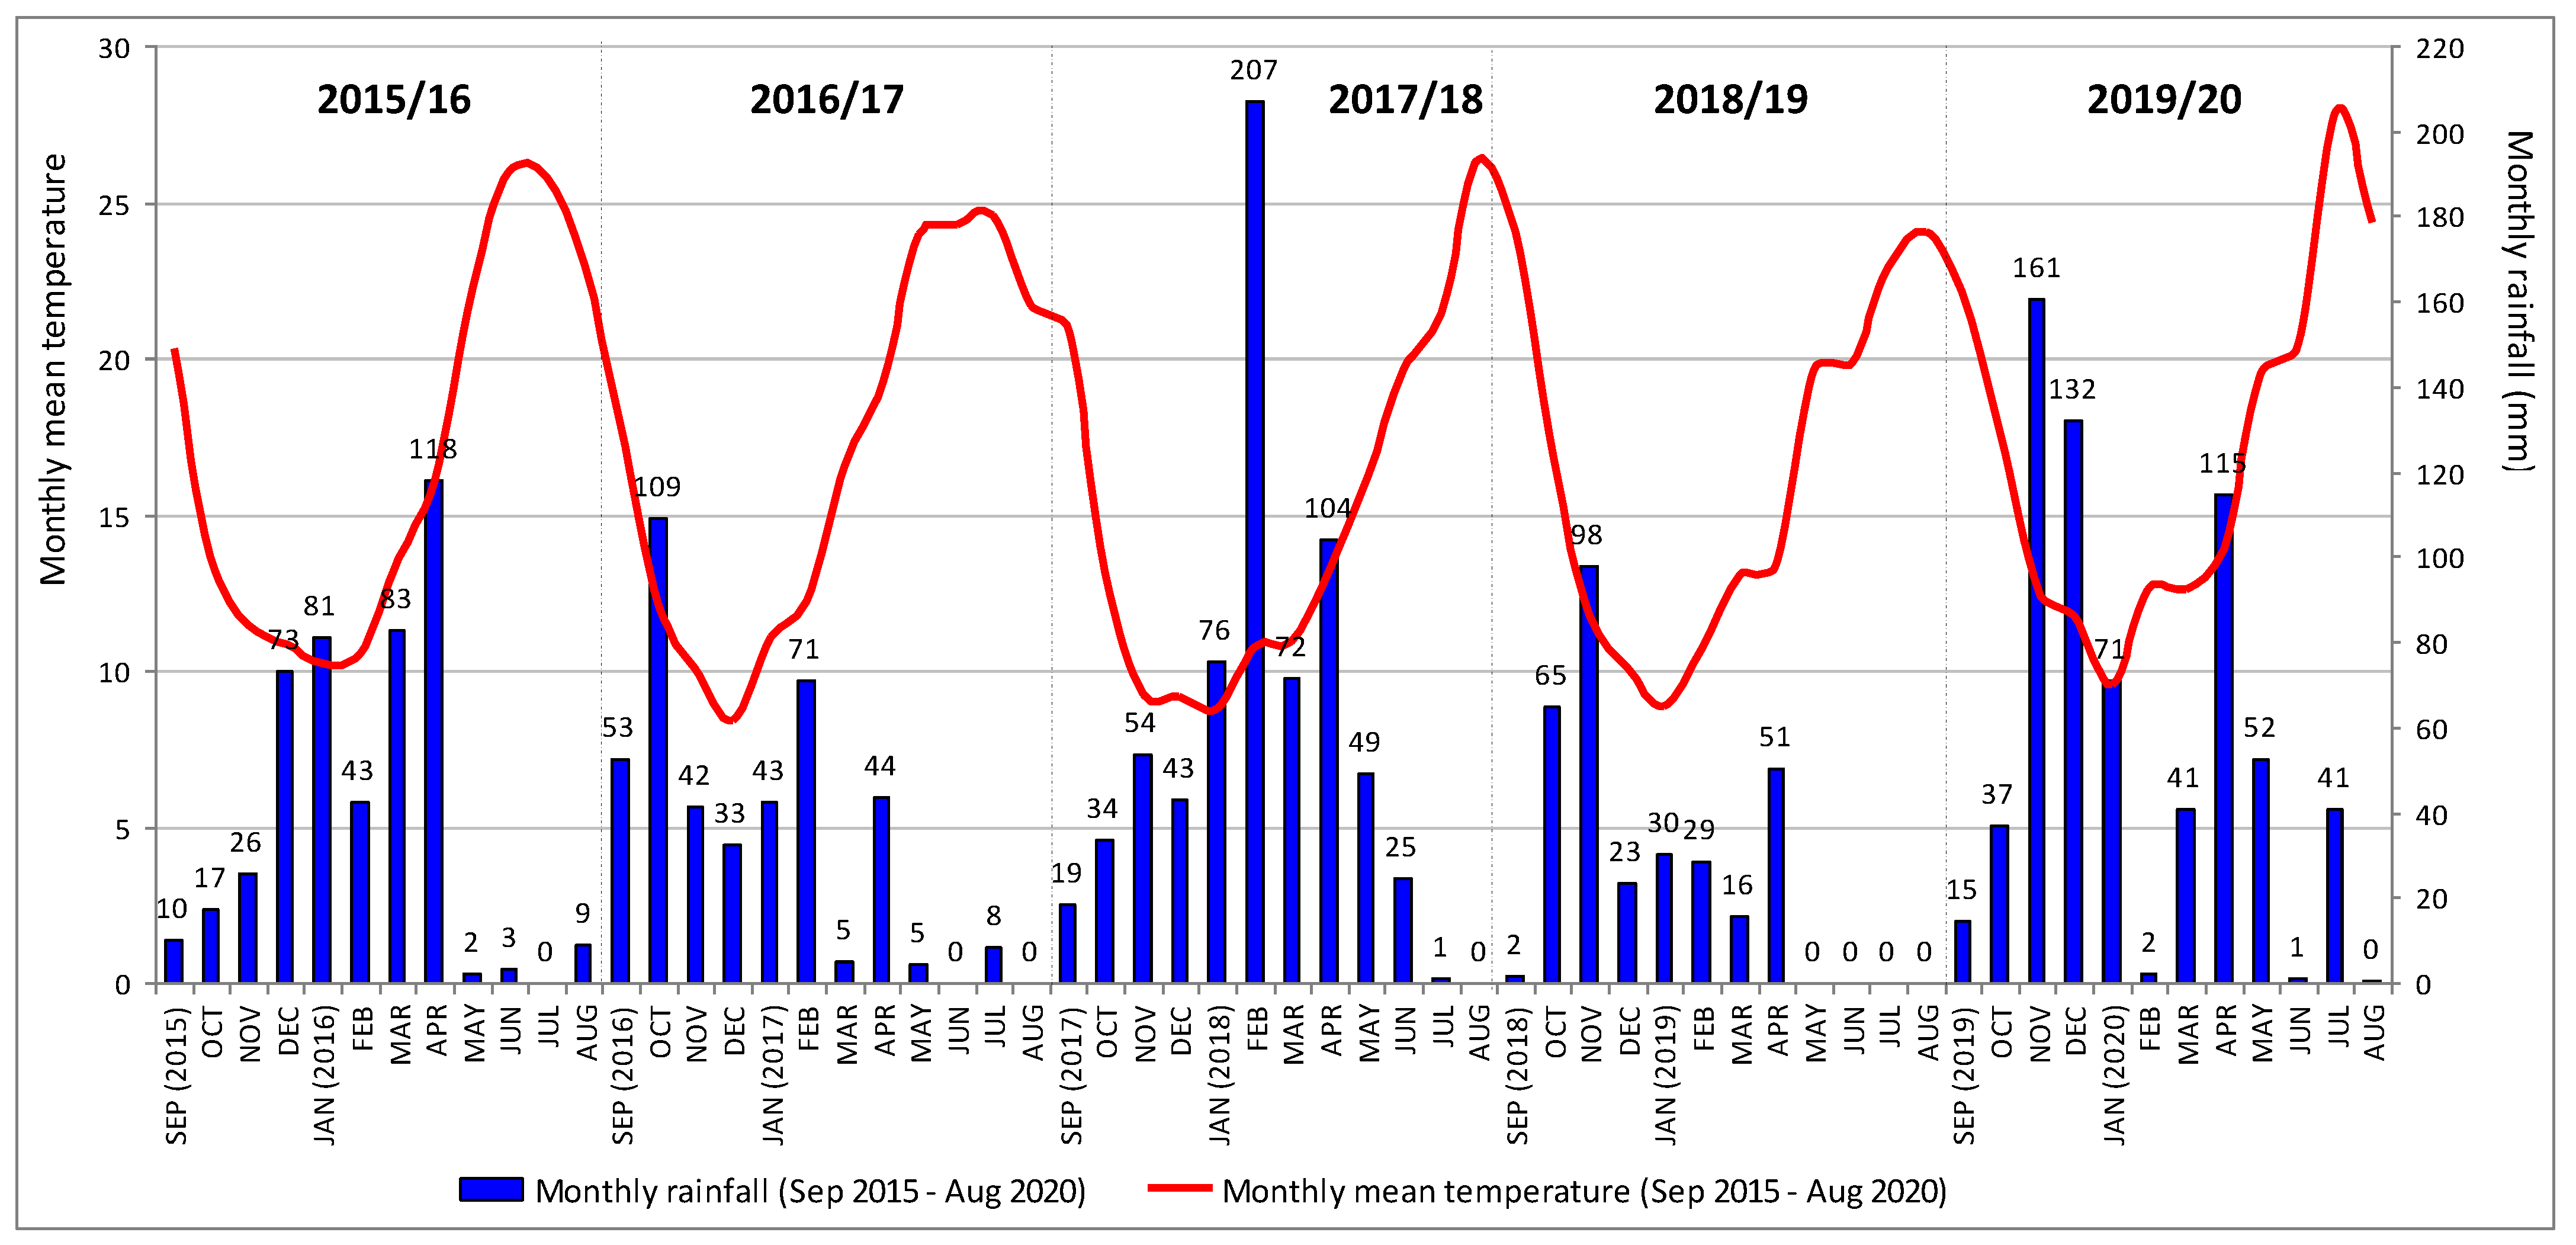
Figure 1. Chronological sequence of the interventions and measurements in the experimental field between October 2015 and May 2020. Annual pasture monitoring (GM—Green matter; DM—Dry matter; CP—Crude protein; NDF—Neutral detergent fibre; FC—Floristic composition) and monthly soil monitoring (SMC—Soil moisture content; SCI—Soil cone index; Tir—Temperature of infrared).
Agriculture 11 01128 g001
Figure 2. Sampling diagram of the experimental field. UTC—Under tree canopy; OTC—Outside tree canopy.
Agriculture 11 01128 g002
Figure 3. Thermo-pluviometric diagram of Meteorological Station of Mitra (Évora, Portugal) between September 2015 and August 2020.
Agriculture 11 01128 g003
Figure 4. Soil/pasture surface temperature (Tir) under tree canopy (UTC) and outside tree canopy (OTC), between September 2017 and August 2018. **—Probability < 0.01; *—Probability < 0.05.
Agriculture 11 01128 g004
Figure 5. Soil moisture content (SMC) at different depths (0.10 m (a); 0.20 m (b); and 0.30 m (c)), between September 2017 and August 2018, under tree canopy (UTC) and outside tree canopy (OTC). **—Probability < 0.01; *—Probability < 0.05.
Agriculture 11 01128 g005
Figure 6. Soil cone index (SCI) at different depths, under tree canopy (UTC) and outside tree canopy (OTC), average of monthly measurements between December 2017 and March 2018. **—Probability < 0.01.
Agriculture 11 01128 g006
Figure 7. Pasture green matter (a), dry matter (b), crude protein (c) and neutral detergent fibre (d) of the experimental field in spring 2016, 2018 and 2020. **—Probability < 0.01; *—Probability < 0.05.
Agriculture 11 01128 g007
Figure 8. Number of species in each family represented in the experimental field.
Agriculture 11 01128 g008
Figure 9. Mean coverage area (%) of each family represented in the experimental field, under tree canopy (UTC) and outside tree canopy (OTC).
Agriculture 11 01128 g009
Figure 10. Pasture botanical species with mean cover >5% in spring 2016, 2018 and 2020, under tree canopy (UTC) and outside tree canopy (OTC).
Agriculture 11 01128 g010
Figure 11. The three predominant botanical species (mean cover, %) present in the pasture of the studied field in each location (under tree canopy, UTC and outside tree canopy, OTC) in spring of 2016, 2018 and 2020.
Agriculture 11 01128 g011
Figure 12. Pasture biodiversity indicators: richness (a), Simpson’s diversity index (DI; (b)) and Shannon-Wiener index (H′; (c) of the experimental field in each location (under tree canopy, UTC and outside tree canopy, OTC) in spring of 2016, 2018 and 2020. **—Probability < 0.01; *—Probability < 0.05.
Agriculture 11 01128 g012
Figure 13. Output of indicator species analysis (ISA): bio-indicator species (with significant probability) under and outside tree canopy areas of the experimental field (UTC and OTC, respectively); **—Probability < 0.01; *—Probability < 0.05.
Agriculture 11 01128 g013
Figure 14. Dendogram representing the results of indicator species analysis (ISA) applied throughout the experimental field (UTC and OTC), by year of evaluation (2016, 2018 and 2020). **—Probability < 0.01; *—Probability < 0.05.
Agriculture 11 01128 g014
Figure 15. Dendogram representing the results of indicator species analysis (ISA) for under and outside tree canopy areas of the experimental field (UTC and OTC, respectively), in spring of 2016, 2018 and 2020. **—Probability < 0.01; *—Probability < 0.05.
Agriculture 11 01128 g015
Table 1. Accumulated rainfall (annual and per season) and maximum monthly rainfall in the five years between 2015 and 2020 and in the thirty-year period between 1981 and 2010.
Agricultural Year
(September/August)
Accumulated Rainfall
(mm)
Maximum Monthly Rainfall
AutumnWinterSpringSummerAnnual(mm)(Month)
2015/20165319720313466118April
2016/2017204146539412109October
2017/201810632622526683207April
2018/20191658266031398November
2019/202021220520842668161November
Period 1981–20102032081452958595December
Table 2. Soil parameters in experimental field at 0–0.30 m depth in October 2015 and March 2020, under tree canopy (UTC) and outside tree canopy (OTC).
Soil ParametersUTCOTCProbabilityCV (%)
October 2015
Coarse sand, %49.047.8ns5.3
Fine sand, %31.832.6ns6.3
Silt, %9.89.5ns26.2
Clay, %9.410.1ns27.8
OM, %2.71.30.000017.8
pH5.45.3ns5.4
Nt, %0.160.090.000122.0
P2O5, mg kg−1117.768.20.057163.0
K2O, mg kg−1359.3180.50.001239.9
Mg, mg kg−1115.076.30.050346.3
Mn, mg kg−1100.052.80.013153.2
March 2020
pH5.85.60.03314.9
Mg, mg kg−1102.479.80.021540.1
Mn, mg kg−147.634.30.044155.2
UTC—Under tree canopy; OTC—Outside tree canopy; CV—Coefficient of variation; OM—Organic matter; Ntotal—Total nitrogen; Mg—Magnesium; Mn—Manganese.
Table 3. Pasture floristic composition (botanical species mean cover, %) of the experimental field in spring 2016, 2018 and 2020.
Botanical SpeciesFAMILY IV_ISA Spring 2016Spring 2018Spring 2020
(Mean Cover, %) (%)UTCOTCUTCOTCUTCOTC
Anagalis arvensisPRIMULACEAE91.00.60.00.00.00.0
Arum italicumARACEAE120.00.01.10.00.50.0
Avena barbataPOACEAE180.00.00.00.024.95.8
Biserula pelecinusFABACEAE40.00.30.00.00.00.0
Bromus diandrusPOACEAE541.70.442.819.412.06.2
Bromus hordeaceusPOACEAE60.00.00.00.00.10.5
Calendula arvensisASTERACEAE90.10.10.00.00.00.0
Cerastium glomeratumCARYOPHYLLACEAE360.11.84.60.00.51.6
Chamaemelum fuscatumASTERACEAE50.00.00.48.10.00.0
Chamaemelum mixtumASTERACEAE96.917.00.00.00.00.1
Crepis capillarisASTERACEAE50.00.00.02.40.00.0
Daucus carotaAPIACEAE30.00.00.00.06.20.0
Diplotaxis catholicaBRASSICACEAE190.66.30.515.50.00.8
Echium plantagineumBORAGINACEAE60.00.10.00.00.03.8
Erodium botrysGERANIACEAE180.00.00.00.034.724.0
Erodium cicutariumGERANIACEAE180.00.00.00.01.43.6
Erodium malacoidesGERANIACEAE20.00.05.40.00.00.0
Erodium moschatumGERANIACEAE4540.215.636.237.90.00.0
Geranium dissectumGERANIACEAE60.00.00.00.00.00.6
Geranium molleGERANIACEAE111.01.40.00.03.62.9
Gynandriris sisyrinchiumIRIDACEAE311.40.00.00.20.00.4
Holcus lannatusPOACEAE180.00.00.00.00.10.1
Hordeum murinumPOACEAE60.00.05.10.03.122.4
Leontodon taraxacoidesASTERACEAE306.212.20.02.40.07.5
Lolium multiflorumPOACEAE30.00.00.00.01.20.3
Lolium rigidumPOACEAE180.00.00.00.00.30.2
Medicago polymorphaFABACEAE30.00.00.00.00.10.0
Ornithopus isthmocarpusFABACEAE40.00.30.00.00.00.0
Plantago coronopusPLANTAGINACEAE91.88.40.00.00.00.0
Plantago lagopusPLANTAGINACEAE50.00.00.01.40.00.0
Plantago lanceolataPLANTAGINACEAE40.41.70.00.00.00.2
Poa annuaPOACEAE91.21.10.00.00.10.0
Ranunculus muricatusRANUNCULACEAE60.00.00.00.00.00.7
Raphanus raphanistrumBRASSICACEAE410.01.00.00.60.01.1
Rumex bucephalophorusPOLYGONACEAE40.25.90.02.50.00.6
Rumex conglomeratusPOLYGONACEAE10.60.00.00.00.00.2
Scandix pecten-venerisAPIACEAE30.00.00.00.04.85.0
Senecio jacobaeASTERACEAE180.00.00.00.01.85.1
Senecio vulgarisASTERACEAE50.00.41.74.50.00.0
Sherardia arvensisRUBIACEAE510.10.10.00.50.00.3
Silene gallicaCARYOPHYLLACEAE10.10.00.00.00.00.0
Sonchus oleraceusASTERACEAE92.72.10.00.00.00.1
Spergula arvensisCARYOPHYLLACEAE190.51.70.02.70.00.0
Stachys arvensisLAMIACEAE40.00.30.00.00.00.0
Stellaria mediaCARYOPHYLLACEAE93.51.00.00.80.00.0
Tolpis barbataASTERACEAE60.00.00.00.00.00.8
Trifolium glomeratumFABACEAE12.00.10.00.00.00.0
Trifolium incarnatumFABACEAE40.01.00.00.00.00.0
Trifolium repensFABACEAE201.44.20.00.00.02.3
Trifolium resupinatumFABACEAE40.59.60.00.00.00.0
Trifolium subterraneumFABACEAE50.00.00.01.10.00.0
Urtica urensURTICACEAE221.90.12.20.02.70.0
Vicia sativaFABACEAE180.00.00.00.00.40.1
Vulpia geniculataPOACEAE4924.05.00.00.01.62.7
IV_ISA—Indicator value of Indicator Species Analysis; UTC—under tree canopy; OTC—Outside tree canopy.
Publisher’s Note: MDPI stays neutral with regard to jurisdictional claims in published maps and institutional affiliations.

