Article

Influence of Calving Ease on In-Line Milk Urea and Relationship with Other Milk Characteristics in Dairy Cows

by
Mindaugas Televičius
1,
Ramūnas Antanaitis
1,*,
Vida Juozaitienė
2,
Algimantas Paulauskas
2,
Dovilė Malašauskienė
1,
Mingaudas Urbutis
1 and
Walter Baumgartner
3
1
Large Animal Clinic, Veterinary Academy, Lithuanian University of Health Sciences, Tilžės St. 18, LT-47181 Kaunas, Lithuania
2
Department of Biology, Faculty of Natural Sciences, Vytautas Magnus University, K. Donelaičio St. 58, LT-44248 Kaunas, Lithuania
3
University Clinic for Ruminants, University of Veterinary Medicine, Veterinaerplatz 1, A-1210 Vienna, Austria
*
Author to whom correspondence should be addressed.
Submission received: 17 October 2021 / Revised: 11 November 2021 / Accepted: 16 November 2021 / Published: 18 November 2021
(This article belongs to the Special Issue Dairy Cow Nutrition and Milk Quality)

Abstract

:
The aim of this research was to identify the relationship of calvin ease and level of in-line milk urea (MU) and other milk components, namely milk yield (MY), electrical conductivity (EC), milk fat (MF), milk protein (MP), milk fat/protein ratio (MF/MP), and somatic cell count (SCC) in dairy cows. The cows for the research were selected following such criteria: cows were tested within the period of up to the first 30 days after calving and had had a range of lactation numbers from two to four. Each selected farm housed more than 500 dairy cows and a total of 4712 calving cases from the eight dairy farms were studied and evaluated. The 4-point scale was used for the evaluation of the calving according to the point value meanings where 1 = easy, unassisted; 2 = easy, assisted; 3 = difficult, assisted; 4 = difficult, requiring veterinary intervention. A total of 4712 calving cases were researched and scored. The chemical properties of milk in all research cows were analyzed during the early phase of lactation (from the onset of calving to 30 days past calving) every day, during each milking. Cows were classified into groups according to the level of urea in milk: Group 1 had MU ≤ 15 mg/dL (12.6% of cows), Group 2 had MU 16–30 mg/dL (62.4% of cows), and Group 3 had MU > 30 mg/dL (25.0% of cows). We found that cows with milk urea levels between 16 and 30 mg/dL had the lowest incidence of dystocia, and also the highest concentration of milk lactose (ML ≥ 4.6%), the lowest mean value of milk electrical conductivity, and the lowest value of milk SCC. Dystocia increased the risk of somatic cell growth in cow’s milk above the herd average (OR = 1.364; 95% CI = 1.184–1.571, p < 0.001), and normal urea in milk reduced this risk (OR = 0.749; 95% CI = 0.642–0.869, p = 0.05). In all groups of cows, according to the level of urea in milk, the productivity of cows without dystocia at calving was higher (2.50–5.51 kg) as well as the milk protein % (0.13–0.21%) and milk lactose % (0.07–0.19%). We concluded that, in all groups of cows, according to the level of urea in milk, the productivity and milk lactose concentration of cows without dystocia at calving was higher, and lower somatic cells count and electrical conductivity values were found in the milk compared with cows diagnosed with dystocia at calving. We can state that dystocia has a negative effect on milk urea concentration and can increase the risk of mastitis.

1. Introduction

Calving is an important factor of a cow’s biological life cycle as it conditions new lactation, which is respectively determined by the mode of calving ease. In the cases of dystocia, a lactation of a cow can start not only with a lower reading of milk production, but also with various diseases and/or complications after calving, such as retained pla-centa, metritis, ketosis, mastitis, displaced abomasum, and fertility disorder [1,2,3,4,5]. According to Dematawena et al. [6], dystocia causes damage to multiple parities and primary cows, and that damage has been reflected and evident in the lower and/or decreasing counts of milk yield, milk fat, and milk protein. Other studies also show that the higher counts of somatic cells and lower levels of lactose (C12H22O11) [7] in milk have been observed in cows with dystocia [8,9]. The majority of data analyses report that the percentage of such incidences after abnormal calving has been 10% in multiparous cows and up to 30% in prim parous cows [6,10].
The risks of dystocia [11] can be caused and increased by numerous factors-. Regardless of parity, calf’s sex, weight, body size, pelvic and dam measurements, such metabolic disorders as hypocalcemia and seasonal effects, as well as an impact of environmental stress at the time of or just before parturition have been identified as risk factors [12,13,14,15]. Complicated and prolonged calving that requires a veterinary surgical intervention is dystocia. Stage 1 (cervical dilatation) ends (normally) when the chorioallantois and/or amniotic sac appear outside the vulva, the onset of the Stage 2 (fetal expulsion), which is active labor and normally takes from 30 min up to 4 h with an average calving duration of 70 min. The duration of calving in heifers is longer than in cows [16]. The studies have estimated that, on average, the calving process in Stage 2 should not exceed the time length of 2–3 h. In the case it does, this alerts the most critical timing for a veterinarian intervention [17]. Although the severity of dystocia has been defined rather relatively, most studies for rating a degree of dystocia severity apply a dystocia point-scoring system based on the scale evaluation from 0 to 4 or from 0 to 5 points, where a 0 value means easy calving and no intervention is needed, and 4 (or 5) means difficult/complicated calving wherein veterinary intervention is needed [18,19]. Protein metabolism produces the urea (CH4N2O) [20] formation due to an excess of unused dietary protein in cows. Ammonia is a by-product of a break-down protein occurring in the liver and is toxic to animal bodies and tissues. Urea is formed in the liver for reducing tissue toxicity of ammonia above amounts utilized by ruminal microbes [19,21]. Blood circulation carries urea from the liver to other body parts and diffuses into other tissues, for instance, the udder and uterus [22].
Thus, during a urea cycle, ammonia converts into urea, and, by excreting urea into urine, this toxic substance is removed from the body. Urea has been measured in the saliva, bloodstream, and milk. A high correlation of milk urea levels with blood serum urea concentrations [23] has been found. A balanced diet in terms of energy and protein is defined by urea concentration and protein content in milk. Provided a protein content is within its normal range of 3.2–3.8%, and urea concentration ranges between 15–30 mg/100 mL, then it is considered that a supply of energy and crude protein is of an opti-mal level [24]. Cow’s state of health and reproductive disorders can also be evaluated by milk urea analysis. There has been an increasing tendency in using urea nitrogen (MUN) and the percentage of milk protein in order to indicate the protein-energy balance, monitor nutrition, and diagnose feeding disorders [25]. Several factors such as breed, parity, body weight, milk yield, fat and protein content, days in lactation, and time of year [26,27,28] influence urea concentration in milk. Based on the findings, MUN level and pregnancy ratio had a significantly negative association. This relationship is associated with changes in the pH and mineral balance of the lining of the uterus, and hormonal imbalances (gonado-tropin and progesterone) and toxic by-products of nitrogen metabolism from the rumen (ammonia) and liver (urea) can damage sperm, ovaries, or early survival [29]. According to Hojman et al. [30], there is a significant negative association between milk urea levels and pregnancy ratio; these data revealed that cows with lower urea in milk had a 2.3% higher chance of calving than cows with higher urea levels in milk, and urea levels > 19 mg/dL were associated with a reduction in reproductive performance. Although, there have been reports on the reduction of conception risks depending on MUN being either very low (<7 mg/dL) or very high (>17.6 mg/dL) [31].
Considering in-line milk urea levels and other milk components as important indicators for the evaluation of a cow’s health and productivity, the analysis of scientific literature was carried out. The analyzed studies showed that the information on how calving ease impacts the levels of in-line urea and milk components is not yet sufficient. The hypothesis of this study was that ease of calving does influence the urea concentrations of milk and that these concentration levels correlate highly.
The aim of this study was to determine the effect of calving ease on the level of in-line milk urea (MU) and to assess the relationship of these indicators with other characteristics of milk, such as milk yield (MY), milk fat (MF), milk protein (MP), milk lactose (ML), milk fat protein ratio (MF/MP), electrical conductivity (EC), and somatic cell count (SCC) in dairy cows.
We hypothesized that dystocia could negatively affect the metabolic processes of cows after calving, and especially the urea content in milk, which could also negatively affect other parameters of milk.

2. Materials and Methods

2.1. Location and Animals

This study was carried out at the eight dairy farms located in Lithuania in the period of 1 March 2018, until 18 October 2020. During the study period, the average air temperature in the country during the warm season was: 2018 −18.50 ° C ; 2019 −15.88 ° C ; 2020 −15.80 ° C . Each selected farm housed more than 500 dairy cows. A total of 4712 calving cases from the eight dairy farms were evaluated.
The following criteria for the selection of cows to be observed were applied: cows had to be within their first 30 days after calving, with two or more lactations produced. The cows were housed in a free-stall type barn. Their routine total mixed ration of feed (TMR) throughout the year was balanced to meet the physiological and production needs of the tested cows. A cow feeding schedule was set up for every day at 7:00 a.m. and 7:00 p.m. with TMR for high-productivity, multiparous cows. Cow diets were composed accordingly so that it was adequate and would meet or exceed the daily feed intake needs of a 550 kg Holstein cow yielding 35 kg of milk per day according to NRC [32]. Approximate chemical composition of feed rations at all eight farms compounded of dry matter (% of DM): 48.8; neutral detergent fiber (% of DM): 28.2; acid detergent fiber (% of DM): 19.8; non-fiber carbohydrates (% of DM): 38.7; crude protein (% of DM): 15.8; net energy for lactation (Mcal/kg): 1.6. During the milking phase with the milking robot, the cows were fed with, on average, 2 kg of concentrated feed per day.

2.2. Measurements

The chemical properties of milk in all research cows were analyzed during the early phase of lactation (from the onset of calving to 30 days past calving) every day, during each milking. DeLaval milking robots with free traffic and combined with a fully automated real-time milk analyzer Herd Navigator (DeLaval Inc., Tumba, Sweden) were used to milk the cows. During the milking process, a targeted sample of cow milk in the amount of several milliliters was taken by a milking robot automatically. During the research period of 2018–2020, properly trained farm technicians were collecting and recording the calving scores following the methodology of Jensen [33].
The mentioned 4-point scale was used for the evaluation of the calving according to the point value meanings, where 1 = easy, unassisted; 2 = easy, assisted; 3 = difficult, assisted; 4 = difficult, requiring veterinary intervention. A total of 4712 calving cases were researched and scored. The start of calving in all cows was detected applying the Saint-Dizier and Chastant-Maillard 3-Stage methodology [34].
The cow milk samples from the targeted cow groups that were having lactation for the second up to the fourth time were analyzed. The data on cow milk indicators received from milking robots during the first 30 days after calving were recorded daily and included counts in milk yield (MY) (kg/day), milk fat (MF) (%), milk protein (MP) (%), lactose (ML) (%), milk urea (MU) (mg/dL), milk somatic cell count (SCC), and milk electrical conductivity (EC) (mS/cm) of all quarters of the udder (Televičius et al.) [35]. All tests on milk urea were performed in an accredited laboratory professionally using advanced equipment and technique such as LactoScope FTIR (FT 1.0. 2001; Delta Instruments, the Netherlands) and an infrared mid-range radiation absorption method according to LST ISO 9622: 2000, which allows the analyzing of milk samples collected from cows at the time of control milking.

2.3. Data Analysis and Statistics

The values taken by collecting series of milk samples were realized through a statistical assay using the SPSS 25.0 software (IBM Corp. Released 2017. IBM SPSS Statistics for Windows, Version 25.0. IBM Corp, Armonk, NY, USA). The evaluation of indicators’ variation and distribution was assessed using a Shapiro-Wilk normality test. The logarithmic expression of somatic milk-cell indicator was analyzed with SCS = (log2 (SCC/100)) + 3 [36]. Normally distributed milk indicators were expressed as mean ± standard error of the mean (M ± SEM). The Bonferoni test was used to determine the differences between the mean values of the groups and the Wilcoxon-Mann-Whitney test allowed the statistical processing of the CE scores of cows.
For a data analysis, the level of urea in milk was the principal factor for the classification of cow accordingly: Group 1: MU ≤ 15 mg/dL (12.6% of cows), Group 2: MU = 16–30 mg/dL (62.4% of cows), Group 3: MU > 30 mg/dL (25.0% of cows).
Cows were grouped by the count of milk lactose (ML) into two groups: ML < 4.60% (57.8% cows) and ML ≥ 4.60% (42.2% cows); by the electrical conductivity of milk (EC) into three groups: EC < 4 mS/cm (23% of cows), EC = 4–6 mS/cm (40.0% of cows), and EC > 6 mS/cm (37% of cows), and the classification of cows based on the ratio of milk fat to protein (F/P) was divided into on three classes [35]: F/P < 1.2 (43.1% of cows), F/P = 1.2 (35.0% of cows), F/P > 1.2 (21.9% of cows). The Pearson chi-square test (χ2) of independence was used to evaluate the relationship between the CE cow scores and the classes of the indicators above.
We identified the milk urea class with the lowest incidence of dystocia in cows (Figure 1). We equated this grade of urea to the recommended, normal range. Cows whose milk urea did not meet the established interval were assigned to the class: did not meet the recommended range. A binary logistic regression was performed using milk urea as the dependent variable (where 1 is the normal range for milk urea, 0 means there is no normal range for this indicator). Logistic regression predictors were considered categorical variables. Results are presented as odds ratio (OR) and its 95% confidence interval (PI).
A linear relationship between MU and milk yield and chemical properties of milk composition were measured by applying Pearson‘s correlation method.
Multivariable logistic regression analysis was used to assess the effects of calving ease and milk urea levels on milk yield and somatic cell count. The cows were divided into two groups based on the arithmetic mean of these indicators: group 0 > arithmetic mean (MY = 30 kg, SCS = 1.89), group 1 ≥ arithmetic mean of all tested cows in the herd. The explanatory variables (MU and CE) were grouped into two classes (where 1 means the indicator is within the normal range, 0 means the indicator is outside the normal range).
A probability of less than 0.05 was considered as being significant (p < 0.05) for all tests.
One-way ANOVA test was used to assess the effect of urea levels on other properties of cow milk. We calculated the standard milk yield (SMY) for this analysis (0.4 × MY + 15*MF × MY) [37]. The effects of calving ease, milk urea, and their interaction on the properties of cow’s milk were evaluated using the following model:
yijk = µ + Ai + Bj + ABij + eijk
y—dependent variable (milk trait), µ—population mean, A—CE score, B—milk urea level, AB—interaction between A and B, e—random error.

3. Results

3.1. Distribution of the Number of Fresh Dairy Cows Classified Differently According to the Ease of Calving by the Level of Urea in Milk

It was found that the mean value of the CE score in cows with the MU level of 16–30 mg/dL (1.780) was lower than that of Group 1 (2.012) and Group 3 (1.865). Significant differences between these groups (p < 0.05) were revealed by the Wilcox-on-Mann Whitney test, whereas the Chi-square test (χ2) of independence showed a statistically significant relationship of a CE score with the level of milk urea (p < 0.001).
In Table 1, it is presented that the majority of cows in Group 2 (51.0%) in terms of the calving ease scored 1 point according to the point scoring system, and a total of 79.20% of all analyzed cow groups were evaluated with 1 or 2 points according to CE (80.0% of cows in Group 2; 77.4%, and 76.6% of cows in Groups 1 and 3 respectively).
The highest incidence of dystocia was associated with the lowest mean milk urea (MU = 11–15 mg/dL and MU ≤ 10 mg/dL; 21.7–25.5% of dystocia cases) or the highest MU level (MU > 30 mg/dL, 21.9–24.9% of dystocia cases) in milk of cows (Figure 1).
Cows with milk urea levels between 16 and 30 mg/dL had the lowest incidence of dystocia at calving (Figure 1). Logistic regression analysis showed that cows with dystocia (CE = 3–4) were less likely (OR = 1.254; 95% CI = 1.087–1.447, p = 0.002) to have this recommended urea level in milk (16–30 mg/dL) compared with cows with a CE score of 1–2.

3.2. The Relationship of Urea with Other Characteristics of Cow’s Milk

Compared with the other analyzed cow groups, the highest concentration of milk lactose, the lowest mean value of milk electrical conductivity (p < 0.05), and the lowest value of milk SCC (significantly lower than in cows of Group 1; p < 0.05) were observed in the cows of Group 2. In terms of milk protein, the data analysis showed that the same group of cows (Group 2) also had a better milk composition than the cows of other two groups. Cows of the third group were more productive than animals of other groups. Group had a statistically significant effect on all studied parameters of cow’s milk (Table 2).
In Group 2, a total of 9.6–11.8% more cows were found to have a higher milk lactose level (ML ≥ 4.6%) compared with Groups 1 and 3 of cows (p < 0.001). The majority of cows in Group 2, namely 2.5–2.41% more cows than in other groups, were found to have MF/MP = 1.2. This researched group of cows also had the least number of cows with the lowest MF/MP (6.68% and 11.64% less than in Group 3 and Group 1, respectively) (p < 0.001).
The analysis showed a slightly positive correlation occurred between milk urea and MY (r = 0.125), milk fat (r = 0.040), and protein (r = 0.020), and a negative correlation with SCS (r = −0.062) (p < 0.001).
Regardless of the fact that the milk composition in the cows of Group 2 had the largest number of readings for the lowest value of milk electrical conductivity, the relationship of milk urea with milk electrical conductivity, however, was not statistically significant (p < 0.001).

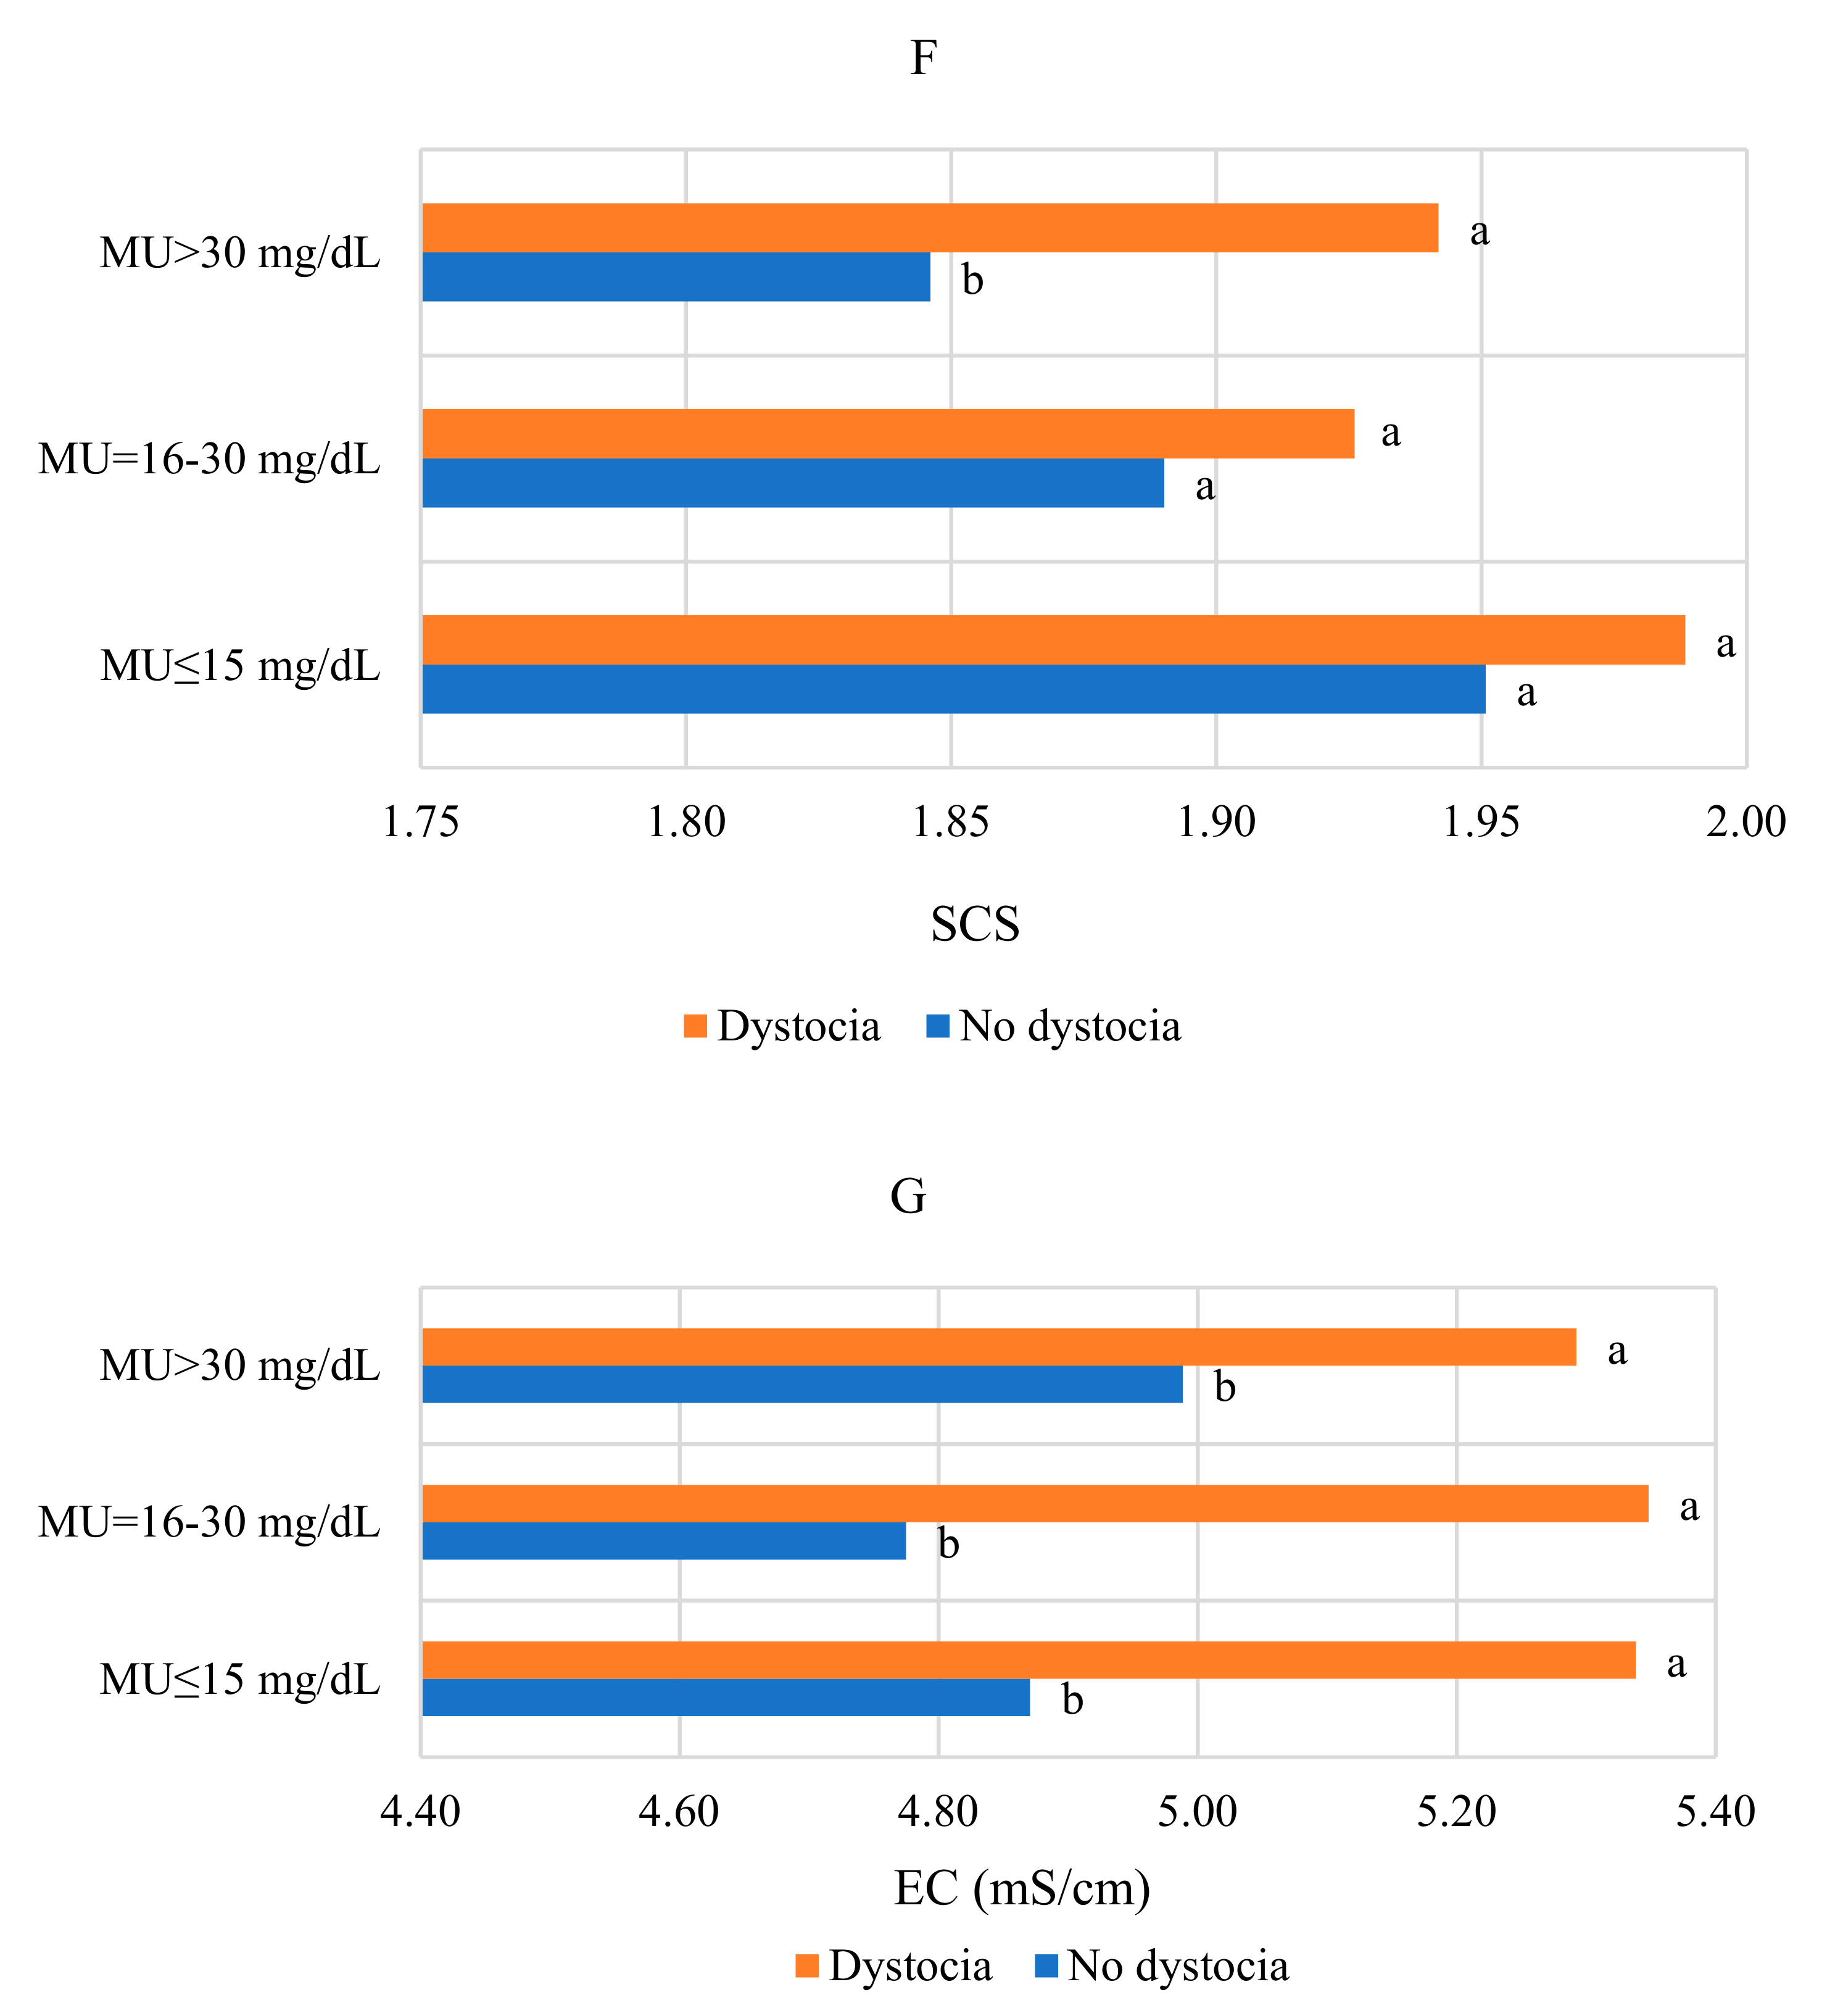
3.3. Milk Characteristics of Fresh Dairy Cows Depending on Calving Score and Milk Urea Level

In all groups of cows, according to the level of urea in milk (Figure 2A–G), the productivity (Figure 2A) of cows without dystocia at calving was higher (2.50–5.51 kg) as well as milk protein % (0.13–0.21%; Figure 2C) and milk lactose % (0.07–0.19%; Figure 2E) (p< 0.05). Fewer somatic cells (Figure 2F) were found in the milk of these cows, and the mean values of milk electrical conductivity (Figure 2G) were also lower compared with cows diagnosed with dystocia at calving (p < 0.05). The average milk fat to protein ratio (Figure 2B) was higher in cows with prior dystocia (0.11–0.15), as was the average milk fat (0.22–0.24%; Figure 2B) (p < 0.05).
Multivariable logistic regression analysis showed an increased risk of decreased milk yield in cows due to dystocia at calving (OR = 2.823; 95% CI = 2.433–3.275, p < 0.001), as well as due to the fact that the level of urea in milk 30 days after calving does not correspond to the recommended rate (OR = 1.273; 95% CI = 1.129–1.436, p < 0.001). Dystocia increased the risk of somatic cell growth in cow’s milk above the herd average (OR = 1.364; 95% CI = 1.184–1.571, p < 0.001), and normal urea in milk reduced this risk (OR = 0.749; 95% CI = 0.642–0.869, p = 0.05).
Evaluation of the influence of fixed factors of calving ease and the level of urea in milk on the properties of cow’s milk showed that the scoring of calving and the level of urea in the milk of fresh dairy cows affect all the studied properties of milk. The interaction of these factors has a statistically significant effect on the ratio of milk fat to protein, the number of somatic cells in milk and especially milk yield, and the percentage of lactose in milk. The analysis results are presented in the Table 3.

4. Discussion

The carried out research showed the highest incidence of dystocia was determined by the lowest mean value of milk urea concentration. The increase in the levels of MU was found to negatively relate to the reproductivity of dairy cows. Based on the results of the previous study, the CE score correlation with MU (p = 0.006; [8]) was found as negative. The prevention of postpartum reproductive disorders essentially depends on properly designed nutrition and appropriate management during the transition period. Numerous challenges related to the reproduction and health of cows are a result of the current development of dairy cows [38].
According to this study, the cow conception rate has been positively influenced by a protein-energy ratio. Therefore, it is evident that the conception rates in turn shall be improved due to good nutritional management, which leads to a positive energy balance [39]. The tested cows that had high concentrations of MUN (> 16 mg/dL) from 0 up to 30 days before the first service and those which were bred during the period of summer season posed a higher risk of not conceiving compared with cows with a low level of MU and which were bred in the winter months [39].
The cow Group 2 with MU of 16–30 mg/dL featured the highest of milk lactose, the lowest mean value of milk electrical conductivity, and the lowest value of milk SCC compared with the other groups. Based on the latest research findings, the cows who had no difficulties in the calving process had a higher concentration of milk lactose as well [8]. According Antanaitis et al. [8], cows that had calving difficulties had higher electrical conductivity of milk and higher amounts of SCC, and the results of this study confirm our results. The basal membrane of mammary epithelial cells absorbs a synthesized substance in the udder from blood glucose, and that is how lactose is formed [40]. The potential of an effective indicator of health in cows is indicated namely by lactose count [41]. According to the study of Cinar et al. [42], a highly significant influence of the SCC count was identified and measured not only in milk yield, milk protein, milk lactose, and all solid concentrations in milk, but also in milk urea. Miglior et al. [43] noted that the yield of lactose strongly correlated with the yield of milk (0.979). Even though MU and the percentage of lactose did not have a genetic correlation with milk yield, however, a lactose percentage correlated with somatic cell score (−0.202) significantly enough. Simultaneously, the measure of MU was correlated with the percentage of both milk fat (0.425) and milk protein (0.20).
Similar results were obtained in [44], which found a lower correlation between lactose content and MUN. In a previous study by Miglior et al. [45], it was found that both traits (MU and lactose) were statistically related to the health and fertility status of cows. The correlation between MUN and fertility is based on an MUN increase in the amount in the body, and Elrod and Butler [46] found that early embryonic loss occurred in cows fed a high-protein diet due to decreased uterine pH during the luteal phase, which may affect fertility. Larson et al. [47] argued that high concentrations of MUN may be associated with very early embryo loss prior to maternal recognition of pregnancy. The relationship between milk lactose content and cow health and fertility is based on the mechanism of lactose production and milk content. The amount of lactose synthesized by the mammary gland is responsible for the uptake of water from the cytosol, which means the amount of milk. Milk lactose synthesis in the udder consumes about 60–85 percent [48] of circulating blood glucose. With high milk production, the need for glucose for milk synthesis increases, which is associated with a negative energy balance (ketosis). At the beginning of lactation, most of the circulating glucose is directed to the mammary gland, and in the case of a negative energy balance due to impaired intestinal glucose uptake [49], lactose yield can drop by up to 15 percent [50]; other studies have shown that the percentage of lactose in milk is negatively correlated with BHB [51]. Costa et al. [42] showed that even if low glucose in the blood of high-productivity cows may not reduce lactose and milk, it may affect other physiological processes associated with fertility, such as ovulation.
In this study, the analysis of milk urea indicated a slightly positive correlation with MY, fat, and protein, and a negative correlation with SCC.
Hojman et al. [30] reported that a positive interaction between the MU concentration and milk yield and milk fat percentage was highly significant, whereas the MU and milk total protein percentage and somatic cell count correlated negatively. Additionally, a positive correlation of MUN with milk yield and a negative one with milk protein was also previously described by Arunvipas et al. [52]. Other researchers studying and examining the relationship between milk yield and MU level have found no significant correlation between these two parameters [53]. In addition, similar scientific findings, such as milk fat correlation with milk urea, obtained observing the cowherds of a high-productivity, have been reported by Godden et al. [54] and Rajala-Schultz and Saville [55]. Such an association could have possible reasoning in the increased amounts of NDFf, which may determine an increase in milk fat content and simultaneously raise the MU levels because of a high degradability of its protein [30]. According to Arunvipas et al. [52], MUN was reported as the lowest in the first month of lactation but increased rapidly during the further two months of lactation and was followed by a gradual increase over the next two months. The correlation described above was expressed by a quadratic relationship formed between the percentage of milk fat and MU concentration along with the increased count values of MU that occurred in the mid-ranged percentages of milk fat.
The largest number of cows that had MF/MP = 1.2 was evaluated in the Group 2 cows (with MU 16–30 mg/dL) and it was 2.15–2.41% more than in the remaining groups. This group of cows also had the lowest number of cows with the least values of MF/MP (6.68% and 11.64% less than in Group 3 and Group 1, respectively). Siachos et al. [56] reported that the ratio of milk fat content and milk fat/protein had a negative relation to MU because the cows featuring a higher protein content count had decreased MU values. This confirms the statements described above, i.e., that cows with higher protein content in their milk will have lower MU content.

5. Conclusions

The present research aimed to identify the relationship of calving ease and level of in-line milk urea (MU) and the milk components such as MY, MF, MP, MF/MP, ML, EC, and SCC in dairy cows, and it was found that the most frequent possible cases of dystocia were related to the lowest mean value of milk urea. In all groups of cows, according to the level of urea in milk, the productivity and milk lactose concentration of cows without dystocia at calving was higher, and lower somatic cells count and electrical conductivity values were found in the milk of compared with cows diagnosed with dystocia at calving. The cows of Group 2 with MU 16–30 mg/dL had the biggest milk lactose concentration in comparison with the other groups observed. A slight positive correlation of MU with MY was also identified.
On the practical side, we can state that dystocia has a negative effect on milk urea concentration and can increase the risk of mastitis.

Author Contributions

Methodology, M.T. and V.J.; software, A.P.; formal analysis, M.T., D.M.; investigation, D.M., M.U.; data curation, V.J.; writing—original draft preparation, M.T.; writing—review and editing, R.A. and W.B.; supervision, R.A. and W.B.; project administration, M.T. All authors have read and agreed to the published version of the manuscript.

Funding

No external funding was received for this research.

Institutional Review Board Statement

The study was conducted in accordance with the Declaration of Helsinki, and the protocol was approved by the Ethics Committee of PK016965 Approval date: 6 June 2017.

Informed Consent Statement

Informed consent was obtained from all subjects involved in the study.

Data Availability Statement

The data presented in this study are available within the article.

Conflicts of Interest

The authors declare no conflict of interest. The funders had no role in the design of the study; in the collection, analyses, or interpretation of data; in the writing of the manuscript, or in the decision to publish the results.

References

  1. Rajala, P.J.; Gröhn, Y.T. Effects of dystocia, retained placenta, and metritis on milk yield in dairy cows. J. Dairy Sci. 1998, 81, 3172–3181. [Google Scholar] [CrossRef]
  2. McGuirk, B.J.; Forsyth, R.; Dobson, H. Economic cost of difficult calving in the United Kingdom dairy herd. Vet. Rec. 2007, 161, 685–687. [Google Scholar] [CrossRef] [PubMed]
  3. Juozaitienė, V.; Juozaitis, A.; Kardisauskas, A.; Zymantiene, J.; Zilaitis, V.; Antanaitis, R.; Ruzauskas, M. Relationship between dystocia and the lactation number, stillbirth and mastitis prevalence in dairy cows. Acta Vet. Brno 2018, 86, 345–352. [Google Scholar] [CrossRef] [Green Version]
  4. McArt, J.A.A.; Nydam, D.V.; Oetzel, G.R. Dry period and parturient predictors of early lactation hyperketonemia in dairy cattle. J. Dairy Sci. 2013, 96, 198–209. [Google Scholar] [CrossRef] [PubMed] [Green Version]
  5. Correa, M.T.; Erb, H.; Scarlett, J. Path analysis for seven postpartum disorders of Holstein cows. J. Dairy Sci. 1993, 76, 1305–1312. [Google Scholar] [CrossRef]
  6. Dematawena, C.M.B.; Berger, P.J. Effect of dystocia on yield, fertility, and cow losses and an economic evaluation of dystocia scores for Holsteins. J. Dairy Sci. 1997, 80, 754–761. [Google Scholar] [CrossRef]
  7. National Center for Biotechnology Information. PubChem Compound Summary for CID 5988, Sucrose PubChem. Available online: https://pubchem.ncbi.nlm.nih.gov/compound/Sucrose (accessed on 3 November 2021).
  8. Antanaitis, R.; Juozaitienė, V.; Malašauskienė, D.; Televičius, M.; Urbutis, M.; Baumgartner, W. Influence of calving ease on in-line milk lactose and other milk components. Animals 2021, 11, 842. [Google Scholar] [CrossRef]
  9. Berry, D.P.; Lee, J.M.; Macdonald, K.A.; Roche, J.R. Body condition score and body weight effects on dystocia and stillbirths and consequent effects on post-calving performance. J. Dairy Sci. 2007, 90, 4201–4211. [Google Scholar] [CrossRef]
  10. Meyer, C.L.; Berger, P.J.; Koehler, K.J. Interactions among factors affecting stillbirths in Holstein cattle in the United States. J. Dairy Sci. 2000, 83, 2657–2663. [Google Scholar] [CrossRef]
  11. Tenhagen, B.A.; Helmbold, A.; Heuwieser, W. Effect of various degrees of dystocia in dairy cattle on calf viability, milk production, fertility and culling. J. Vet. Med. A 2007, 54, 98–102. [Google Scholar] [CrossRef]
  12. Goff, J.P.; Horst, R.L. Physiological changes at parturition and their relationship to metabolic disorders. J. Dairy Sci. 1997, 80, 1260–1268. [Google Scholar] [CrossRef]
  13. Hohnholz, T.; Volkmann, N.; Gillandt, K.; Waßmuth, R.; Kemper, N. Risk factors for dystocia and perinatal mortality in extensively kept angus suckler cows in Germany. Agriculture 2019, 9, 85. [Google Scholar] [CrossRef] [Green Version]
  14. Johanson, J.M.; Berger, P.J. Birth weight as a predictor of calving ease and perinatal mortality in Holstein cattle. J. Dairy Sci. 2003, 86, 3745–3755. [Google Scholar] [CrossRef] [Green Version]
  15. Mee, J.F.; Berry, D.P.; Cromie, A.R. Risk factors for calving assistance and dystocia in pasture-based Holstein–Friesian heifers and cows in Ireland. Vet. J. 2011, 187, 189–194. [Google Scholar] [CrossRef]
  16. Noakes, D.; Parkinson, T.; England, G. Dystocia and Other Disorders Associated with Parturition. Vet. Reprod. Obstet. 2009, 9, 207–305. [Google Scholar]
  17. Zaborski, D.; Grzesiak, W.; Szatkowska, I.; Dybus, A.; Muszynska, M.; Jedrzejczak, M. Factors affecting dystocia in cattle. Reprod. Domest. Anim. 2009, 44, 540–551. [Google Scholar] [CrossRef]
  18. Fourichon, C.; Seegers, H.; Malher, X. Effect of disease on reproduction in the dairy cow: A meta-analysis. Theriogenology 2000, 53, 1729–1759. [Google Scholar] [CrossRef]
  19. Rajala-Schultz, P.J.; Saville, W.J.A.; Frazer, G.S.; Wittum, T.E. Association between milk urea nitrogen and fertility in Ohio dairy cows. J. Dairy Sci. 2001, 84, 482–489. [Google Scholar] [CrossRef]
  20. National Center for Biotechnology Information. PubChem Compound Summary for CID 1176, Urea PubChem. Available online: https://pubchem.ncbi.nlm.nih.gov/compound/Urea (accessed on 3 November 2021).
  21. Burbank, M.B.; Weaver, T.J.; Williams, B.C.; Crawford, R.L. Urease activity of ureolytic bacteria isolated from six soils in which calcite was precipitated by indigenous bacteria. Geomicrobiol. J. 2012, 29, 389–395. [Google Scholar] [CrossRef]
  22. Weeks, D.L.; Sachs, G. Sites of pH regulation of the urea channel of Helicobacter pylori. Mol. Microbiol. 2001, 40, 1249–1259. [Google Scholar] [CrossRef]
  23. Patra, A.K.; Aschenbach, J.R. Ureases in the gastrointestinal tracts of ruminant and monogastric animals and their implication in urea-N/ammonia metabolism: A review. J. Adv. Res. 2018, 26, 39–50. [Google Scholar] [CrossRef]
  24. Bendelja, D.; Prpic, Z.; Mikulec, N.; Ivkic, Z.; Havranek, J.; Antunac, N. Milk urea concentration in Holstein and Simmental cows. Mljekarstvo 2011, 61, 45–55. Available online: https://hrcak.srce.hr/65204 (accessed on 10 September 2021).
  25. Eicher, R.; Bouchard, E.; Bigras-Poulin, M. Factors affecting milk urea nitrogen and protein concentrations in Quebec dairy cows. Prev. Vet. Med. 1999, 39, 53–63. [Google Scholar] [CrossRef]
  26. Rodriguez, L.A.; Stallings, C.C.; Herbein, J.H.; McGilliard, M.L. Effect of degradability of dietary protein and fat on ruminal, blood, and milk components of Jersey and Holstein cows. J. Dairy Sci. 1997, 80, 353–363. [Google Scholar] [CrossRef]
  27. Broderick, G.A.; Clayton, M.K. A statistical evaluation of animal and nutritional factors influencing concentrations of milk urea nitrogen. J. Dairy Sci. 1997, 80, 2964–2971. [Google Scholar] [CrossRef]
  28. Kohn, R.A.; Kalscheur, K.F.; Russek-Cohen, E. Evaluation of models to estimate urinary nitrogen and expected milk urea nitrogen. J. Dairy Sci. 2002, 85, 227–233. [Google Scholar] [CrossRef]
  29. Roy, B.; Brahma, B.; Ghosh, S.; Pankaj, P.K.; Mandal, G. Evaluation of milk urea concentration as useful indicator for dairy herd management: A review. Asian. J. Anim. Vet. Adv. 2011, 6, 1–19. [Google Scholar] [CrossRef] [Green Version]
  30. Hojman, D.; Kroll, O.; Adin, G.; Gips, M.; Hanochi, B.; Ezra, E. Relationships between milk urea and production, nutrition, and fertility traits in Israeli dairy herds. J. Dairy Sci. 2004, 87, 1001–1011. [Google Scholar] [CrossRef] [Green Version]
  31. Carlsson, J.; Pehrson, B. The relationships between seasonal variations in the concentration of urea in bulk milk and the production and fertility of dairy herds. J. Am. Vet. Med. Assoc. 1993, 40, 205–212. [Google Scholar] [CrossRef]
  32. National Research Council. Nutrient Requirements of Dairy Cattle: 2001; National Academies Press: Washington, DC, USA, 2001; p. 319. [Google Scholar]
  33. Jensen, M.B. Behavior around the time of calving in dairy cows. Appl. Anim. Behav. Sci. 2012, 139, 195–202. [Google Scholar] [CrossRef]
  34. Saint-Dizier, M.; Chastant-Maillard, S. Methods and on-farm devices to predict calving time in cattle. Vet. J. 2015, 205, 349–356. [Google Scholar] [CrossRef] [PubMed]
  35. Televičius, M.; Juozaitiene, V.; Malašauskienė, D.; Antanaitis, R.; Rutkauskas, A.; Urbutis, M.; Baumgartner, W. Inline milk lactose concentration as biomarker of the health status and reproductive success in dairy cows. Agriculture 2021, 11, 38. [Google Scholar] [CrossRef]
  36. Ali, A.K.A.; Shook, G.E. An optimum transformation for somatic cell concentration in milk. J. Dairy Sci. 1980, 63, 487. [Google Scholar] [CrossRef]
  37. Overman, O.R.; Gaines, W.L. Milk-energy formulas for various breeds of cattle. J. Agric. Res. 1933, 46, 1109–1120. [Google Scholar]
  38. Cargile, B.; Tracy, D. Interaction of Nutrition and Reproduction in the Dairy Cow. In Bovine Reproduction, 2nd ed.; Richard, M., Hopper, D.V.M., Diplomat, A.C.T., Eds.; John Wiley & Sons, Inc.: Hoboken, NJ, USA, 2021; pp. 389–398. [Google Scholar]
  39. Kananub, S.; Pechkerd, P.; VanLeeuwen, J.; Stryhn, H.; Arunvipas, P. Evaluation of influence of milk urea nitrogen on reproductive performance in smallholder dairy farms. Aust. Vet. J. 2020, 98, 375–379. [Google Scholar] [CrossRef] [PubMed]
  40. Melendez, P.; Donovan, A.; Hernandez, J. Milk urea nitrogen and infertility in Florida Holstein cows. J. Dairy Sci. 2000, 83, 459–463. [Google Scholar] [CrossRef]
  41. Pyörälä, S. Indicators of inflammation in the diagnosis of mastitis. Vet. Res. 2003, 34, 565–578. [Google Scholar] [CrossRef] [Green Version]
  42. Larsen, T.; Moyes, K.M. Are free glucose and glucose-6-phosphate in milk indicators of specific physiological states in the cow? Animals 2015, 9, 86–93. [Google Scholar] [CrossRef] [Green Version]
  43. Cinar, M.; Serbester, U.; Ceyhan, A.; Gorgulu, M. Effect of somatic cell count on milk yield and composition of first and second lactation dairy cows. Ital. J. Anim. Sci. 2015, 14, 3646. [Google Scholar] [CrossRef] [Green Version]
  44. Miglior, F.; Sewalem, A.; Jamrozik, J.; Bohmanova, J.; Lefebvre, D.M.; Moore, R.K. Genetic analysis of milk urea nitrogen and lactose and their relationships with other production traits in Canadian Holstein cattle. J. Dairy Sci. 2007, 90, 2468–2479. [Google Scholar] [CrossRef]
  45. Stoop, W.M.; Bovenhuis, H.; van Arendonk, J.A.M. Genetic Parameters of Milk Urea and Milk Production Traits. In Proceedings of the 8th World Congress Genetics Applied to Livestock Production, Belo Horizonte, MG, Brazil, 13–18 August 2006; pp. 271–386. [Google Scholar]
  46. Miglior, F.; Sewalem, A.; Jamrozik, J.; Lefebvre, D.M.; Moore, R.K. Analysis of milk urea nitrogen and lactose and their effect on longevity in Canadian dairy cattle. J. Dairy Sci. 2006, 89, 4886–4894. [Google Scholar] [CrossRef]
  47. Elrod, C.C.; Butler, W.R. Reduction of fertility and alteration of uterine pH in heifers fed excess ruminally d gradable protein. J. Anim. Sci. 1993, 71, 694–701. [Google Scholar] [CrossRef] [PubMed] [Green Version]
  48. Larson, S.F.; Butler, W.R.; Currie, W.B. Reduced fertility associated with low progesterone postbreeding and increased milk urea nitrogen in lactating cows. J. Dairy Sci. 1997, 80, 1288–1295. [Google Scholar] [CrossRef]
  49. Zhao, F.Q. Biology of glucose transport in the mammary gland. J. Mammary Gland. Biol. Neoplasia 2014, 19, 3–17. [Google Scholar] [CrossRef]
  50. Aschenbach, J.R.; Kristensen, N.B.; Donkin, S.S.; Hammon, H.M.; Penner, G.B. Gluconeogenesis in dairy cows: The secret of making sweet milk from sour dough. IUBMB Life 2010, 62, 869–877. [Google Scholar] [CrossRef]
  51. Beerda, B.; Ouweltjes, W.; Šebek, L.B.J.; Windig, J.J.; Veerkamp, R.F. Effects of genotype by environment interactions on milk yield, energy balance, and protein balance. J. Dairy Sci. 2007, 90, 219–228. [Google Scholar] [CrossRef]
  52. Costa, A.; Egger-Danner, C.; Mészáros, G.; Fuerst, C.; Penasa, M.; Sölkner, J.; Fuerst-Waltl, B. Genetic associations of lactose and its ratios to other milk solids with health traits in Austrian Fleckvieh cows. J. Dairy Sci. 2019, 102, 4238–4248. [Google Scholar] [CrossRef]
  53. Arunvipas, P.; Dohoo, I.R.; Vanleeuwen, J.A.; Keefe, G.P. The effect of non-nutritional factors on milk urea nitrogen levels in dairy cows in Prince Edward Island, Canada. Prev. Vet. Med. 2003, 59, 83–93. [Google Scholar] [CrossRef]
  54. Godden, S.M.; Lissemore, K.D.; Kelton, D.F.; Leslie, K.E.; Walton, J.S.; Lumsden, J.H. Relationships between milk urea concentrations and nutritional management, production, and economic variables in Ontario dairy herds. J. Dairy Sci. 2001, 84, 1128–1139. [Google Scholar] [CrossRef]
  55. Rajala-Schultz, P.J.; Saville, W.J.A. Sources of variation in milk urea nitrogen in Ohio dairy herds. J. Dairy Sci. 2003, 86, 1653–1661. [Google Scholar] [CrossRef] [Green Version]
  56. Siachos, N.; Panousis, N.; Arsenos, G.; Valergakis, G.E. Investigation of milk urea nitrogen concentration and factors affecting its variation in Greek Holstein herds. Hell. Vet. Med. Soc. 2017, 68, 423–432. [Google Scholar] [CrossRef]
Figure 1. Distribution of fresh dairy cows with dystocia at calving (CE = 3–4) by the level of urea in milk.
Agriculture 11 01159 g001
Figure 2. (AG). Milk characteristics of cows in relation to dystocia at calving and milk urea level. a,b —The statistically significant differences (p < 0.05) between the mean values of the groups (cows with established dystocia or cows without dystocia at calving) are labeled with different letters. MU—milk urea level, MY—milk yield MF—milk fat, MP—milk protein, MF/MP—milk fat to protein ratio, ML—milk lactose, EC—electical conductivity of milk, SCC—somatic cell count (thousand/mL), SCS = (log2 (SCC/100)) + 3 [36].
Agriculture 11 01159 g002aAgriculture 11 01159 g002bAgriculture 11 01159 g002c
Table 1. Distribution of the number of cows (classified differently according to the ease of calving) by the level of urea in milk.
CE ScoreCows by MU Level (Number/Percent)Cows by MU Level (Number/Percent)Cows by MU Level (Number/Percent)
1Group 1Group 2Group 3
2198/33.171501/50.99565/47.80
3264/44.22874/29.69341/28.85
465/10.89279/9.48146/12.35
χ2 = 78.589, df = 6, p < 0.001
MU—milk urea level (Group 1 ≤ 15 mg/dL, Group 2 = 16–30 mg/dL, Group 3 > 30 mg/dL), CE—calving ease score. χ2—chi-square test. df—degree of freedom, p—probability (less than 0.05 was considered as being significant, p < 0.05).
Table 2. Milk traits in cows by MU level.
IndicatorGroup by MU LevelM ± SEMSignificance of the Group Effect (p)
MY (kg)127.455 ± 0.328 a<0.001
227.760 ± 0.148 a
329.960 ± 0.233 b
MF (%)14.048 ± 0.034 a0.028
24.052 ± 0.015 a
34.154 ± 0.024 b
SMY (kg)127.331 ± 0.334 a<0.001
227.778 ± 0.150 a
330.434 ± 0.237 b
MP (%)13.390 ± 0.016 a<0.001
23.502 ± 0.007 a
33.463 ± 0.011 a
MF/MP11.200 ± 0.010 a0.006
21.163 ± 0.004 b
31.207 ± 0.007 a
ML (%)14.635 ± 0.010 a<0.001
24.673 ± 0.005 b
34.606 ± 0.007 a
EC (mS/cm)14.976 ± 0.023 a0.002
24.886 ± 0.010 b
35.060 ± 0.017 c
SCS11.959 ± 0.019 a0.050
21.868 ± 0.014 b
31.897 ± 0.009 b
a,b,c—The statistically significant differences between the mean values of the groups are labeled with different letters. p—probability (less than 0.05 was considered as being significant, p < 0.05). M—mean, SEM—standard error of the mean. MU—milk urea level (Group 1 ≤ 15 mg/dL, Group 2 = 16–30 mg/dL, Group 3 > 30 mg/dL), MY—milk yield MF—milk fat, MP—milk protein, MF/MP—milk fat to protein ratio, SMY—standard milk yield (0.4 × MY + 15*MF × MY)[37], ML—milk lactose, EC—electical conductivity of milk, SCC—somatic cell count (thousand/mL), SCS = (log2 (SCC/100)) + 3 [36].
Table 3. The effect of calving ease, milk urea, and their interactions on the milk properties of cows.
IndicatorsSignificance of EffectsModel
CE ScoreMU LevelInteraction between CE and MU LevelsR2 p
MY (kg)<0.001<0.0010.0330.934<0.001
MF (%)<0.0010.0280.0730.960<0.001
SMY (kg)<0.001<0.0010.0040.935<0.001
MP (%)<0.001<0.0010.2070.989<0.001
MF (%)/MP (%)<0.0010.0060.0090.963<0.001
ML (%)<0.001<0.001<0.0010.997<0.001
SCS<0.0010.0500.0040.941<0.001
EC (mS/cm)<0.0010.002<0.0010.989<0.001
MU—milk urea level (Group 1 ≤ 15 mg/dL, Group 2 = 16–30 mg/dL, Group 3 > 30 mg/dL), CE—calving ease score, MY—milk yield, MF—milk fat, MP—milk protein, SMY—standard milk yield (0.4 × MY + 15*MF × MY), MF/MP—milk fat to protein ratio, ML—milk lactose [37], EC—electrical conductivity of milk, SCC—somatic cell count (thousand/mL), SCS = (log2 (SCC/100)) + 3 [36]. p—the significance of the influence of the effects (MU, CE, and their interaction) or the model (1). R2 is the coefficient of determination of the model for the properties of milk.
Publisher’s Note: MDPI stays neutral with regard to jurisdictional claims in published maps and institutional affiliations.

