Article

Evapotranspiration Partition and Dual Crop Coefficients in Apple Orchard with Dwarf Stocks and Dense Planting in Arid Region, Aksu Oasis, Southern Xinjiang

1
College of Water Conservancy and Architecture Engineering, Tarim University, Alar 843300, China
2
Institute of Farmland Irrigation, Chinese Academy of Agricultural Sciences, Xinxiang 453002, China
*
Authors to whom correspondence should be addressed.
Submission received: 15 October 2021 / Revised: 13 November 2021 / Accepted: 17 November 2021 / Published: 19 November 2021
(This article belongs to the Special Issue Precision Water Management in Dryland Agriculture)

Abstract

:
Crop coefficients are critical to developing irrigation scheduling and improving agricultural water management in farmland ecosystems. Interest in dwarf cultivation with high density (DCHD) for apple production increases in Aksu oasis, southern Xinjiang. The lack of micro-irrigation scheduling limits apple yield and water productivity of the DCHD-cultivated orchard. A two-year experiment with the DCHD-cultivated apple (Malus × domestica ‘Royal Gala’) orchard was conducted to determine crop coefficients and evapotranspiration (ETa) with the SIMDualKc model, and to investigate apple yield and water productivity (WP) in response to different irrigation scheduling. The five levels of irrigation rate were designed as W1 of 13.5 mm, W2 of 18.0 mm, W3 of 22.5 mm, W4 of 27.0 mm, and W5 of 31.5 mm. The mean value of basal crop coefficient (Kcb) at the initial-, mid-, and late-season was 1.00, 1.30, and 0.89, respectively. The Kc-local (ETa/ET0) range for apple orchard with DCHD was 1.11–1.20, 1.33–1.43, and 1.09–1.22 at the initial, middle, and late season, respectively. ETa of apple orchard in this study ranged between 415.55–989.71 mm, and soil evaporation accounted for 13.85–29.97% of ETa. Relationships between total irrigation amount and apple yield and WP were developed, and W3 was suggested as an optimum irrigation schedule with an average apple yield of 30,540.8 kg/ha and WP of 4.45 kg/m3 in 2019–2020. The results have implications in developing irrigation schedules and improving water management for apple production in arid regions.

1. Introduction

Southern Xinjiang (Figure 1a), an extremely arid area, has abundant light and heat resources. The particular climatic conditions of oases in southern Xinjiang are favorable for producing high-quality fruits. Aksu oasis, one of the large oases in southern Xinjiang, has an apple cultivation area of 2.6 × 10⁴ hm2 [1]. Arborized apple trees accounted for about 80% of an apple orchard (Figure 1b), with a long growth period and late harvesting time. Moreover, the large canopy of arborized apple trees resulted in low light transmittance then reduced fruit quality. In recent years, the dwarf cultivation with high density (DCHD, Figure 1c) gradually increased up to 10% apple area in Aksu oasis [2], because of its incomparable advantages with the conventional cultivation at a high mechanization level, early harvesting time, high fruit yield, and quality [3].
In the extremely arid oasis in southern Xinjiang, e.g., Aksu oasis with annual precipitation of 50 mm, agricultural production is seriously restricted by local water resources scarcity [4]. Irrigation for agricultural practices in this region utilizes more than 92% of the local freshwater, while the utilization efficiency of irrigation water is only approximately 0.43 [5]. Nowadays, most arborized orchards in Aksu oasis are still irrigated by flood irrigation or water storage pit irrigation [6], resulting in low irrigation water efficiency. Although the DCHD orchards with drip irrigation have a low proportion of regional apple orchards, their potential for increasing yield and water productivity has attracted more attention. Whereas, achieving the potential benefits of drip-irrigated DCHD orchards requires proper irrigation scheduling and good irrigation management. Determination of crop coefficients and actual crop evapotranspiration (ETa) is the fundamental requirement of irrigation scheduling and irrigation efficiency [7,8].
Direct measurement methods in the field can obtain ETa, such as water balance method [9,10], lysimeters [8], sap flow measurements [11,12,13] and eddy covariance [10,14,15,16], and by crop evapotranspiration modelling, e.g., SIMDualKc [7,14,15,17,18], HYDRUS [19], CropSyst [8], and remote sensing information [20,21]. The FAO crop coefficient procedure, classified as single coefficient and dual coefficients, is one of the most common methods for determining ETa [22]. Soil evaporation and plant transpiration could be separately considered by using the soil evaporation coefficient (Ke) and the basal crop coefficient (Kcb) in the dual crop coefficient approach [22]. Under environmental stress conditions, Ks, a stress coefficient, should be considered, that is, the actual basal crop coefficient Kcb act = Ks Kcb.
As crop coefficients change across places and seasons, the site-specific value of crop coefficients is required for local conditions. Measurements of soil evaporation and plant transpiration are essential to adjust crop coefficients, while it is more difficult for fruit trees than herbaceous crops [23]. Rainfall interception plays an important role in plant evapotranspiration, especially in arid regions. It refers to the process that the total rainfall falling on the plant surface is captured, retained, and finally evaporated from the leaves, stems, and branches of the plant. Studies have shown that the canopy interception of fruit trees was about 26 mm [24]. Meanwhile, the rainfall intercepted by plant canopy accounts for 20 ± 8% of the total global rainfall [25]. Crop coefficients of woody plants in different regions have been reported by researchers, such as olives in Portugal [12,15,18,20,23], apples in Spain [8], Italy [16], Chile [21], North China [6,24,26,27,28] and South Africa [13,29], pears in Portugal [14,17,30], citrus in India [10], and pecan in southwestern USA [31]. Although several apple crop coefficient results were reported, the dual crop coefficients and evapotranspiration components of the DCHD orchards are limited, especially for the DCHD apple orchards in extremely arid regions.
Compared with the traditional apple orchards in Aksu oasis, the DCHD apple trees have smaller canopy volumes, which changes crop coefficients pattern by impacting radiation interception and transpiration (Figure 1b,c). As the determination of crop coefficients and evapotranspiration components in the DCHD apple orchards are scare, objectives of this study were (i) to determine Kc for the DCHD apple trees in Aksu oasis with soil balance method, (ii) to calibrate and validate the SIMDualKc model, (iii) to develop the curve of Kcb and Ke from the calibrated SIMDualKc model, (iv) to estimate ETa and its components using the dual crop coefficient approach.

2. Materials and Methods

2.1. Study Site

Field experiments were conducted at a 600-ha apple orchard (40°39′ N, 81°16′ E, altitude 1011 m.a.s.l) with dwarf stocks and dense planting, located in Alar City, 1st Division of the Xinjiang Production and Construction Corps (Figure 1a), from April to August in 2019 and 2020. The experimental site is situated in a warm temperature zone, characterized as an extreme continental arid desert climate. The study site has an annual average precipitation of 50 mm, annual average temperature of 11 °C, annual pan evaporation of 2100 mm, annual sunshine duration of 2900 h, and a frost-free period of over 200 days. The seasonal precipitation in the apple growing season of 2019 and 2020 was 56.2 and 17 mm, respectively (Figure 2). The soil type is sandy loam with an average bulk density of 1.51 g/cm3 and field capacity of 0.185 cm3/cm3 at 0–120 cm soil depth. Table 1 shows the specific physical parameters of the soil. The bulk density was measured by the core method with a solid ring, the field capacity was obtained by the plot irrigation method, and the wilting point was obtained by measuring the soil moisture content under 15 bar by using the pressure membrane meter method. On average of the two growing seasons, soil available N, P, and K contents of the cultivated horizon (0–30 cm) were 10.0, 3.2, and 33 mg/kg, and soil organic matter content was 11.05 g/kg, pH was 8.71, and electrical conductivity was 154.6 μs/cm. Groundwater is located at >3.0 m below the soil surface.

2.2. Experimental Design

The experiment followed a one-factor completely random block design. The apple variety is Royal Gala (Malus × domestica ‘Royal Gala’), planted in 2016 with a plant spacing of 1 m and row spacing of 3.5 m (Figure 1c). The average height, diameter at breast height, and crown diameter of apple trees were 3.3 m, 39.6 mm, and 1.75 m, respectively. During the apple growing season, the ground coverage and leaf area index ranged from 0.39–0.52, and from 1.17–2.93, respectively. There were five irrigation rates with three replicas, i.e., W1 of 13.5 mm, W2 of 18 mm, W3 of 22.5 mm, W4 of 27 mm, and W5 of 31.5 mm. In the arid oasis of Aksu, southern Xinjiang, the irrigation rate of 31.5 mm was primarily scheduled for apple trees. In order to optimize irrigation scheduling of apple orchards, the ±20% and ±40% changes in irrigation rate of 22.5 mm were designed in this study. Each plot has an area of 35 m2. The apple trees were irrigated with drip irrigation, and the drip lines were fixed at the height of 50 cm (Figure 1d). The drip line diameter was 16 mm, and the emitters with a flow rate of 4 L/h were placed 30 cm apart in the line. Irrigation scheduling was on the difference between reference evapotranspiration (ET0) and precipitation (P). Irrigation was carried out whenever ET0−P reached 22.5 mm, and all treatments were irrigated on the same day. There were 28 irrigation events in each season; the total irrigation amounts for W1, W2, W3, and W4 were 378, 504, 630, 756, and 882 mm, respectively (Table 2). The distinct difference in rainfall distribution (Figure 2) caused the two seasons to have the same irrigation events. The amount of N, P2O5, and K2O was 75.90, 87.37, and 153.39 kg/ha, respectively (Table 2). Pests were controlled using standard management practices by application of and pesticides.

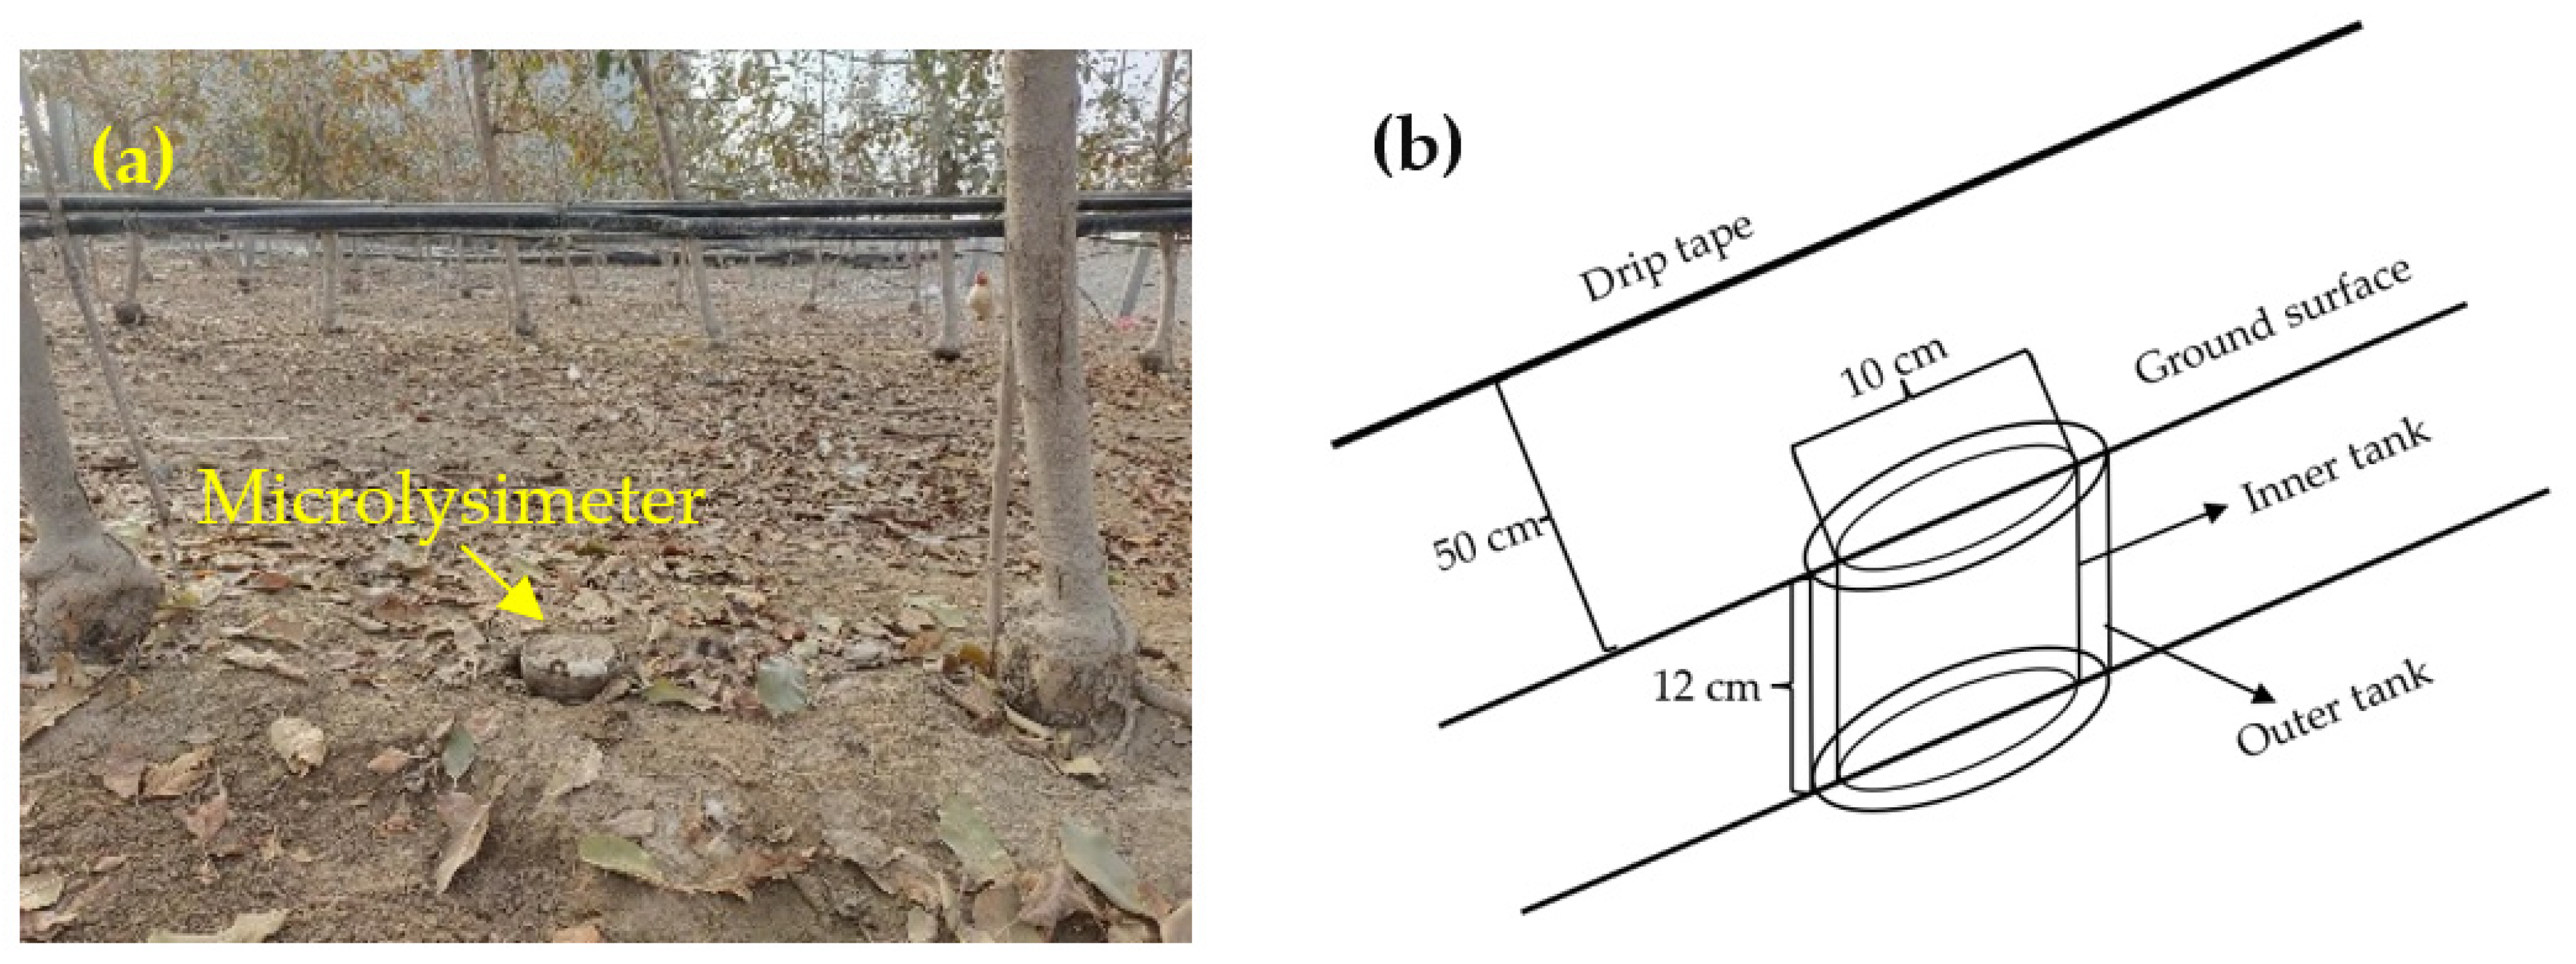
2.3. Measurement Set-Up

2.3.1. ETa−w Calculated with Water Balance Model

ETa−w is determined by the soil water balance equation as follows [32]:
ETa−w = P + I + U − R − Dw − ∆S
where P is precipitation (mm), I, irrigation (mm), U, the upward capillary flow into the root zone (mm), R, runoff (mm), Dw, the downward drainage out the root zone, ΔS, variation of soil water storage (mm). Darcy’s law was used to estimate R and Dw, indicating that both R and Dw were negligible as low irrigation rate, the hydraulic properties of sandy loam soil, and groundwater table [7,32]. Under the condition of a low amount of irrigation water and rainfall as well as flat topography, R was negligible. In situ, soil water content was measured by the S-SMC-005 soil moisture sensors, which were buried at the depth of 20, 40, 60, 80, 100, and 120 cm, with a measurement range of 0–0.55 m3 /m3 and a measurement accuracy of ±0.031 m3/m3 (HOBO, Onset, MA, USA). Under the drip lines, auger a 7 cm hole to the depth at which the sensor was to be installed, insert the sensor into the undisturbed soil by a PCV pipe with a notch cut in the end, then remove the PVC pipe and backfill the hole. The soil moisture data were recorded with the HOBO-U30 data logger every 1 h. Soil water content at sowing and harvesting were measured gravimetrically at the interval of 20 cm from soil surface to 120 cm depth.

2.3.2. Evapotranspiration Simulation

The dual crop coefficient procedure [22] was used to estimate evapotranspiration:
(i) Under standard condition,
ET C = ( K cb + K e ) ET 0
(ii) Under stress condition,
ET a F = ( K s K cb + K e ) ET 0
where Kcb is the basal crop coefficient for transpiration, Ke is the evaporation coefficient, Ks is the stress coefficient, ET0 is the reference evapotranspiration (mm/d). The development stages for DCHD-cultivated apple trees are shown in Table 2. ET0 is calculated with the Penman–Monteith Equation as described in [22]:
ET 0 = 0.408 Δ ( R n G ) γ 900 T + 273 u 2 ( e s e a ) Δ + γ ( 1 + 0.34 u 2 )
where Δ is the slope of the saturation vapor pressure curve (kPa/°C), Rn the net radiation (MJ/(m2d), G the soil heat flux density (MJ/(m2d), γ the psychrometric constant (kPa/°C), T the mean daily air temperature at 2 m height (°C), u 2 the wind speed at 2 m height (m/s), e s the saturation vapor pressure (kPa), e a the actual vapor pressure (kPa). Daily weather data used for estimating ET0 were measured with a HOBO weather station (U30-NRC), which has a HOBO U30 USB data collector, an air pressure sensor of S-BPB-CM50, a rain sensor of S-RGB-M002, an air temperature/relative humidity sensor of S-THB-M002, a wind speed sensor of S-WSB-M003, and a pyranometer of S-LIB-M003. The automatic weather station was installed in an open field inside the orchard, about 100 m to the experimental plots.

2.3.3. Calibration and Validation of SIMDualKc Model

In this study, the dual crop coefficient approach was performed using the SIMDualKc model [33]. Adopting the trial-and-error procedure, the SIMDualKc model was calibrated by adjusting parameters of crop (Kcb; p, the depletion fraction) and soil (TEW, the total evaporable water; REW, the readily evaporable water; Ze, the depth of soil surface layer). Calibration was performed with the data in the treatment of W5 in the two seasons, and the calibrated parameters of the SIMDualKc model are shown in Table 3. Validation was carried out using independent data over the two seasons.
Plant height was measured with a steel ruler once every 2 months. The ground coverage was calculated by using UAV aerial photos and Photoshop2018 (Adobe, CA, USA) [34]. Soil evaporation was measured with microlysimeters, which were installed between apple trees (Figure 3a). The microlysimeter was made of stainless steel and consisted of an inner and outer tank. The diameter of the inner and outer tank was 10.0 and 12.0 cm, respectively (Figure 3b). The outer tank was fixed in the soil with its top edge leveling with the soil surface. To fill soil into each inner tank with an intact soil core, the inner tank was forced into the soil under drip line with the top leveling with the soil surface, then pull out and sealed the base with a plastic film. The microlysimeters were weighted at 10:00 a.m. The procedure of soil evaporation measurement by using microlysimeters was similar to the experiment of Gao et al. [35].

2.3.4. Evaluation of Evapotranspiration Simulation

Model performance was evaluated by the root mean square error (RMSE), the average absolute error (AAE), and the Nash–Sutcliffe efficiency index (NSE).
RMSE = 1 n i = 1 n ( S i O i ) 2
AAE = 1 n i = 1 n | S i O i |
NSE = 1 1 i ( O i S i ) 2 1 i ( O i O   ¯ ) 2
where Si and Oi are the simulated and observed values, respectively; n the number of the paired set data; S i = S i O ¯ , O i = O i O ¯ , O   ¯ is the measured mean [36]. The perfect model has NSE = 1.0 and AAE = RMSE = 0.

2.3.5. Yield and Water Productivity

Apple was harvested on 10 August 2019, and 12 August 2020, respectively. Yield (Y, kg/ha) was determined with nine replicas in each treatment. Water productivity (WP, kg/m3) is calculated as follows:
WP = Y 10 ET a

2.4. Statistical Analyses

ETa, Y, and WP were subjected to an ANOVA using DPS 16.05 [37], and the Duncan test was applied at α = 0.05.

3. Results and Discussion

3.1. SIMDualKc Model Parameterization and Calibration

The initial value for Kc-ini, Kc-mid, and Kc-end in W5 was 1.00, 1.33, and 1.09, and the calibrated value was correspondingly 1.00, 1.30, and 0.89, respectively (Table 3). The initial Ze, TEW, and REW was 0.15 m, 30 mm, and 10 mm, respectively, and the calibrated value was 0.10 m, 21 mm, and 8 mm (Table 3), which is similar to the results of Paço et al. [15] and Santos [38]. For the soil of sandy loam in the south in the Mediterranean region, Paço et al. [15] showed the value of Ze, TEW, and REW was 0.10 m, 18 mm, and 9 mm, respectively. Santos [38] reported that the value of Ze, TEW, and REW in sandy loam was 0.10 m, 22 mm, and 8 mm, respectively.
The calibrated SIMDualKc model accurately predicted evapotranspiration in the apple orchard, with R2 of 0.97–0.99, NSE of 0.97, RMSE of 0.34–0.35 mm day-1, and AAE of 0.27–0.28 mm day−1 over the two seasons (Table 4). Comparison between simulated and measured ETa is shown in Figure 4. The calibrated model slightly underestimated ETa with R2 of 0.99, RMSE of 21.65 mm, and d of 0.99. The differences in simulated and measured ETa may be a result of the uncertainty of soil moisture measurements due to spatial variability of soil [7].
For the DCHD-cultivated apple orchard with drip irrigation, the values of Kcb in the initial period, midseason period, and the end of the season were calibrated as 1.00, 1.30, and 0.89, which were correspondingly greater than the tabulated values in FAO-56, i.e., Kcb-ini = 0.3, Kcb-mid = 1.15, Kcb-end = 0.8 [22]. The difference was mainly from the distinct cultivation patterns, growing environments, and apple tree varieties. The apple orchard with DCHD has a lower value of canopy cover in comparison with the orchard with arborized trees, and the orchards with sandy loam soil in the Alar region usually suffered wind with a rate of 0.74–1.40 m/s in April and May, which resulted in a high value of ET a and Kcb-ini. However, for the apple trees in California, Mhawej reported that Kcb in April and May was 1.18 and 1.11 [39], which was similar to the Kcb value of the present study in the same period. After harvesting of Royal Gala in mid-August, the orchard still has a high value of canopy cover and high ambient temperature, resulting in high ETa (Figure 2) and relatively high Kcb-end [40].

3.2. Crop Coefficient-Kc-Local

The seasonal variation of ETa/ET0, namely Kc-local, with Julian day and growing degree days are shown in Figure 5. For the DCHD-cultivated apple orchard in this study, the Kc-local range was 1.11–1.20, 1.33–1.43, and 1.09–1.22 at the initial, middle, and late season, respectively. Marsal suggested that it is complicated to determine site-specific values concerning plant characteristics and management as many factors can influence crop coefficients in different ways across a season [8]. Kc-local of DCHD-cultivated apple trees increased first and then decreased with the time course (Figure 5a) and GDD (Figure 5b). The relationship between Kc-local and Julian day and GDD could be fitted with the quadratic function, the determination coefficients (R2) were greater than 0.63 for each season, while R2 was just higher than 0.53 over the two seasons (Figure 5). Munitz et al. also indicated a quadratic function between Kc-local and Julian day and GDD for a vineyard [41]. In addition, Martínez-Cruz et al. [42] and Marcial-Pablo et al. [43] also suggested similar results for sorghum and maize.

3.3. Dual Crop Coefficients

The dynamics of Ks in the treatments of W1–W5 during the two seasons are shown in Figure 6. The apple trees in different treatments experienced different levels of water stress during the two seasons. The Aksu oasis belongs to an extremely arid region, with severe water scarcity in spring [44]. Therefore, apple trees in all treatments suffered water stress in the early growing stage as restricted by irrigation water supply. From the development stage to harvesting, irrigations did not compensate for soil water loss and caused water stress of apple trees, Ks was negatively associated with irrigation rate. After harvesting, soil water stress increased (low value of Ks) as low irrigation frequency.
With the calibrated parameters of the SIMDual_Kc model as shown in Table 3, the time course of Kcb, KsKcb + Ke, and Kc-local in the treatments of W1-W4 were determined with the SIMDual_Kc model (Figure 7). Seasonal variation of Ke in the treatments was similar and was negatively related to irrigation rate. During the two seasons, the maximum Ke in all treatments was measured at the initial growing period of apple trees, as the early growing stage had low canopy cover and high soil evaporation [45]. Fruit tree canopies are not uniform, and their shape depends on how they are trained [8]. When entering the rapid growth period of fruit trees, the ground coverage increased due to the complete expansion of leaves, which induced the decrease in Ke. While Ke increased during the late season of apple trees, mainly resulting from a low value of irrigation frequency and canopy cover [46]. The orchards in an arid region, e.g., Alar, received a high frequency of irrigation during the growing season, which markedly increased soil evaporation and Ke [47].
KsKcb + Ke, which could be denoted as Kc-adj, significantly increased after irrigation and rainfall (Figure 7). Crop coefficients reflect the effects of biological characteristics of plants, soil water and nutrients status, and agronomic measures [48]. The curves of Kc-adj fluctuated markedly during the apple tree growing seasons and differed among the five treatments (Table 5). The differences in apple tree growth and irrigation rate were attributed to the variations of Kc-adj among treatments.

3.4. ETa and WP

Apple yield, ETa, and WP in the five irrigation treatments over the two consecutive seasons are shown in Table 6. Apple yield increased first and then decreased with the increase in irrigation rate. In the two seasons, the maximum yield was obtained in W4, 26,960 kg/ha in 2019, and 35,328 kg/ha in 2020, respectively, while there was no significant difference in yield between W4 and W3 (p < 0.05). Apple yield in W4 and W3 was significantly greater than that in other treatments. The W3 and W4 treatments provided a suitable water supply for apple trees, limiting vegetative growth, improving fruit enlargement, and reducing fruit drop [49]. The highest yield in the present experiment was lower than the apple yield of Red Fuji in southern Xinjiang [50] and the results of Küçükyumu et al. [51], which may be related to the different types of fruit trees and rootstocks.
ETa of the apple orchard in this study ranged between 415.55–989.71 mm, and increased with the increase of irrigation rate, which was similar to the results of Hou et al. [52]. The maximum and minimum value of ETa was measured in W5 and W1, respectively. Moreover, there was a significant difference in ETa among treatments (p < 0.05). The water consumption in this experiment is higher than the results of Zeng [53] and Zhong et al. [54]. Both natural environments (high temperature and solar radiation) and dwarf cultivation with high density were attributed to high ETa in southern Xinjiang.
Soil evaporation (E) and plant transpiration (T) in the apple orchard simulated with SIMDualKc in the two years are shown in Table 7. It could be found that in each growth stage, E decreased with the increase of irrigation rate, and decreased with the advance of the growth period, which was similar to the results of Wu et al. [55]. At the flowering and fruit setting stage, soil evaporation was high as the low value of canopy cover, accounting for 32.74–45.61% of ETa. With increased canopy cover, soil evaporation reduced [56], while plant transpiration increased. In the 2019 and 2020 seasons, soil evaporation accounted for 13.85–29.97% of ETa.
Over the two seasons, the minimum WP (2.68–2.86 kg/m3) was measured in W5, which was significantly lower than that in other treatments (p < 0.05). In the 2019 season, there was no significant difference in WP among W1–W4, the maximum of 3.97 kg/m3 was obtained in W3 and W1. However, there was a significant difference in WP among W1–W4 in 2020, the maximum of 4.92 kg/m3 was measured in W3. The results indicated that an appropriate irrigation schedule was a benefit to improve water productivity. It may be that under appropriate irrigation scheduling, the vegetative growth of fruit trees was limited, more assimilates were distributed to fruits, and then yield and water productivity were improved. In general, WP increased and then decreased with the increase in irrigation rate, which was different from the results of Liao et al. [57]. The reason may be the differences in apple tree variety, natural environments, and irrigation and fertilization management.
Relationships between apple yield and ETa and WP are shown in Figure 8. For the maximum value of apple yield and WP, the corresponding value of the total irrigation amount was 7351.89 m3/ha and 5152.25 m3/ha, respectively. In addition, the irrigation amount corresponding to the intersection of the two curves was approximately 6870 m3/ha, which was within the range between W3 (6300 m3/ha) and W4 (7560 m3/ha). For the purpose of high yield and WP, it could be suggested that W3 was an optimum irrigation management for DCHD-cultivated apple orchard in southern Xinjiang.

4. Conclusions

Crop coefficients, evapotranspiration (ETa), yield, and water productivity (WP) of the DCHD-cultivated apple orchard were investigated with a two-year field experiment. The dual crop coefficient curve of the DCHD-cultivated apple orchard was determined with the SIMDualKc model. The mean value of Kcb at the initial-, mid- and late-season over the two seasons was 1.0, 1.3, and 0.89, respectively. Soil evaporation and plant transpiration were contributed 13.85–29.97% and 70.03–86.15% to ETa, respectively. Based on the relationship between irrigation amount and yield and WP, the irrigation scheduling with optimum yield and WP was developed, i.e., irrigation rate of 22.5 mm and irrigation amount of 630 mm. The optimal yield and WP were 30,540.8 kg/ha and 4.45 kg/m3 over the two seasons, respectively. In this study, irrigation was controlled with the difference between ET0 and P, which could be used as a threshold for the automatic irrigation system. The results could provide irrigation guidance for large-scale orchards with DCHD in arid regions in southern Xinjiang. Moreover, the method for determining crop coefficients and optimizing irrigation scheduling could be adopted to develop irrigation management for orchards in arid and semi-arid regions. To improve fruit yields and WP of orchards, knowledge of plant healthy growing water demand needs to be revealed to improve irrigation management in the future.

Author Contributions

Conceptualization, X.W.; methodology, Y.G.; software, Y.L.; formal analysis, H.C.; investigation, H.C. and H.W.; data curation, H.C. and N.Z.; writing—original draft preparation, H.C.; writing—review and editing, Y.G. and A.K.M.H.; funding acquisition, X.W. and Y.G. All authors have read and agreed to the published version of the manuscript.

Funding

This research was funded by the National Natural Science Foundation of China (51879267), and the Agricultural Science and Technology Innovation Program (ASTIP).

Institutional Review Board Statement

Not applicable.

Informed Consent Statement

Not applicable.

Data Availability Statement

The data that support the findings of this study are available from the corresponding authors upon reasonable request.

Conflicts of Interest

The authors declare that they have no known competing financial interests or personal relationships that could have appeared to influence the work reported in this paper.

References

  1. Dang, Y. Investigation of the Current Status of Dwarf Apple Cultivation in Aksu; Tarim University: Xinjiang, China, 2018. [Google Scholar]
  2. Li, X.; Li, Y.; Jiang, Z. Present situation and development prospect of apple production in Aksu area of Xinjiang. Apple Prod. Yantai 2020, 3, 10–12. [Google Scholar]
  3. Cao, H. Water Consumption Characteristics and Irrigation Schedule Optimization of Dwarf Apple Orchard with Drip Irrigation in Southern Xinjiang; Tarim University: Xinjiang, China, 2021. [Google Scholar]
  4. Li, Z.; Chen, Y.; Shen, Y. Analysis of changing pan evaporation in the arid region of northwest China. Water Resour. Res. 2013, 49, 2205–2212. [Google Scholar] [CrossRef]
  5. Zhou, H.; Zhang, M.; Zhou, Q.; Sun, Z.; Chen, J. Analysis of agricultural irrigation water-use coefficient in Xinjiang arid region. Trans. Chin. Soc. Agric. Eng. 2013, 29, 100–107. [Google Scholar]
  6. Li, B.; Guo, X.; Sun, X.; Ma, J. Study on water consumption characteristics and crop coefficients of young apple trees at different lower limit of irrigation under water storage pit irrigation conditions. Water Sav. Irrig. 2016, 6, 10–15. [Google Scholar]
  7. Gao, Y.; Yang, L.; Shen, X.; Li, X.; Sun, J.; Duan, A.; Wu, L. Winter wheat with subsurface drip irrigation (SDI): Crop coefficients, water-use estimates, and effect of SDI on grain yield and water use efficiency. Agric. Water Manag. 2014, 146, 1–10. [Google Scholar] [CrossRef]
  8. Marsal, J.; Girona, J.; Casadesus, J.; Lope, G.; Stöckle, C.O. Crop coefficient (Kc) for apple: Comparison between measurements by a weighing lysimeter and prediction by CropSyst. Irrig. Sci. 2013, 31, 455–463. [Google Scholar] [CrossRef]
  9. Gao, Y.; Duan, A.; Sun, J.; Li, F.; Liu, Z.; Liu, H.; Liu, Z. Crop coefficient and water-use efficiency of winter wheat/spring maize strip intercropping. Field. Crop. Res. 2009, 111, 65–73. [Google Scholar] [CrossRef]
  10. Peddinti, S.R.; Kambhammettu, B.P. Dynamics of crop coefficients for citrus orchards of central Indian using water balance and eddy covariance flux partition techniques. Agric. Water Manag. 2019, 212, 68–77. [Google Scholar] [CrossRef]
  11. Dragoni, D.; Lakso, A.N.; Piccioni, R.M. Transpiration of apple trees in a humid climate using heat pulse sap flow gauges calibrated with whole-canopy gas exchange chambers. Agric. Forest Meteorol. 2005, 130, 85–94. [Google Scholar] [CrossRef]
  12. Santos, F.L.; Valverde, P.C.; Reis, J.L.; Ramos, A.F.; Castanheira, N.L. Sap flow scaling and crop coefficient of dry-farmed olive orchards converted to irrigation. Acta Hortic. 2012, 949, 231–236. [Google Scholar] [CrossRef] [Green Version]
  13. Mobe, N.T.; Dzikiti, S.; Zirebwa, S.F.; Midgley, S.J.E.; von Loeper, W.; Mazvimavi, D.; Ntshidi, Z.; Jovanovic, N.Z. Estimating crop coefficients for apple orchards with varying canopy cover using measured data from twelve orchards in the Western Cape Province, South Africa. Agric. Water Manag. 2020, 233, 106103. [Google Scholar] [CrossRef]
  14. Paço, T.A.; Ferreira, M.I.; Rosa, R.D.; Paredes, P.; Rodrigues, G.C.; Conceição, N.; Pacheco, C.A.; Pereira, L.S. The dual crop coeficiente approach using a density fator to simulate the evapotranspiration of a peach orchard: SIMDualKc model versus eddy covariance measurements. Irrig. Sci. 2012, 30, 115–126. [Google Scholar] [CrossRef]
  15. Paço, T.A.; Pôças, I.; Cunha, M.; Silvestre, J.C.; Santos, F.; Paredes, P.; Pereira, L. Evapotranspiration and crop coefficients for a super intensive live orchard. An application of SIMDualKc and METRIC models using ground and satellite observations. J. Hydrol. 2014, 519, 2067–2080. [Google Scholar]
  16. Zanotelli, D.; Montagnani, L.; Andreotti, C.; Tagliavini, M. Evapotranspiration and crop coefficient patterns of an apple orchard in a sub-humid environment. Agric. Water Manag. 2019, 226, 105756. [Google Scholar] [CrossRef]
  17. Paço, T.A.; Rosa, R.D.; Paredes, P.; Rodrigues, G.C.; Conceição, N.; Ferreira, M.I.; Pereira, L.S. The dual crop coeficiente approach: Testing the SIMDualKc model with peach orchard evapotranspiration eddy covariance measurements. Acta Hortic. 2011, 889, 181–188. [Google Scholar] [CrossRef]
  18. Paço, T.A.; Paredes, P.; Pereira, L.S.; Silvestre, J.; Santos, F.L. Crop coefficients and transpiration of a super intensive arbequina olive orchard using the Dual Kc approach and the Kcb computation with the fraction of ground cover and height. Water 2019, 11, 383. [Google Scholar] [CrossRef] [Green Version]
  19. Autovino, D.; Rallo, G.; Provenzano, G. Predicting soil and plant water status dynamic in olive orchards under different irrigation systems with Hydrus-2D: Model performance and scenario analysis. Agric. Water Manag. 2018, 203, 225–235. [Google Scholar] [CrossRef]
  20. Cammalleri, C.; Ciraolo, G.; Minacapilli, M.; Rallo, G. Evapotranspiration from an olive orchard using remote sensing-based Dual Coefficient Approach. Water Resour. Manag. 2013, 27, 4877–4895. [Google Scholar] [CrossRef]
  21. Odi-Lara, M.; Campos, I.; Neale, C.M.U.; Ortega-Farías, S.O.; Poblete-Echeverría, C.; Balbontín, C.; Calera, A. Estimating evapotranspiration of an apple orchard using a remote sensing-based soil water balance. Remote Sens. 2016, 8, 253. [Google Scholar] [CrossRef] [Green Version]
  22. Allen, R.G.; Pereira, L.S.; Rase, D.; Smith, M. Crop evapotranspiration: Guidelines for computing crop requirements. United Nations FAO Irrigation and Drainage Paper No.56. FAO Rome 1998, 300, D05109. [Google Scholar]
  23. Conceição, N.; Tezza, L.; Häusler, M.; Lourenço, S.; Pacheco, C.A.; Ferreira, M.I. Three Years of monitoring evapotranspiration components and crop and stress coefficients in a deficit irrigated intensive olive orchard. Agric. Water Manag. 2017, 191, 138–152. [Google Scholar] [CrossRef]
  24. Li, X.; Shi, P.; Yang, X.; He, L.; Kang, S. Water consumption variation and growth of apple trees under drip irrigation in Shiyanghe river basin of Gansu Province. J. Water Resour. Water Eng. 2005, 16, 19–23. [Google Scholar]
  25. Good, S.P.; Noone, D.; Bowen, G. Hydrologic connectivity constrains partitioning of global terrestrial water fluxes. Science 2015, 349, 175–177. [Google Scholar] [CrossRef] [PubMed] [Green Version]
  26. Meng, Q. Soil Moisture Consumption Pattern and Growth Response of Apple Orchard in the Loess Plateau; Northwest A&F University: Yangling, China, 2011. [Google Scholar]
  27. Jia, G.; Yang, L.; Li, C.; An, D.; Wang, R.; Gao, X. Characteristics and Water Suitability of Apple at the Eastern Foot of Taihang Mountains in Central-south Region of Hebei Province. Meteorol. Environ. Sci. 2020, 43, 109–114. [Google Scholar]
  28. Liang, Z. Effect of Water and Fertilizer on Apple Growth and Evapotranspiration Estimation in Weibei Plateau; Northwest A&F University: Yangling, China, 2020. [Google Scholar]
  29. Volschenk, T. Evapotranspiration and crop coefficients of Golden Delicious/M793 apple trees in the Koue Bokkeveld. Agric. Water Manag. 2017, 194, 184–191. [Google Scholar] [CrossRef]
  30. Conceição, N.; Paço, T.A.; Silva, A.L.; Ferreira, M.I. Crop coefficients for a pear orchard (Pyrus communis L.) obtained using eddy covariance. Acta Hortic. 2008, 792, 707. [Google Scholar] [CrossRef]
  31. Wang, J.; Sammis, T.W.; Andales, A.A.; Simmons, L.J.; Gutschick, V.P.; Miller, D.R. Crop coefficients of open-canopy pecan orchards. Agric. Water Manag. 2007, 88, 253–262. [Google Scholar] [CrossRef]
  32. Hillel, D. Environmental Soil Physics, 1st ed.; Academics Press: London, UK, 1998. [Google Scholar]
  33. Rosa, R.D.; Paredes, P.; Rodrigues, G.C.; Alves, I.; Fernando, R.M.; Pereira, L.S.; Allen, R.G. Implementing the dual crop coefficient approach in interactive software. 1. Background and computational strategy. Agric. Water Manag. 2012, 103, 8–24. [Google Scholar] [CrossRef]
  34. Li, B.; Liu, R.; Liu, S.; Liu, Q.; Liu, F.; Zhou, G. Monitoring vegetation coverage variation of winter wheat by low-altitude UAV remote sensing system. Trans. Chin. Soc. Agric. Eng. 2012, 28, 160–165. [Google Scholar]
  35. Gao, Y.; Duan, A.; Qiu, X.; Li, X.; Pauline, U.; Sun, J.; Wang, H. Modeling evapotranspiration in maize/soybean strip intercropping system with the evaporation and radiation interception by neighboring species model. Agric. Water Manag. 2013, 128, 110–119. [Google Scholar] [CrossRef]
  36. Willmott, C.J. Some comments on the evaluation of model performance. Bull. Am. Meteorol. Soc. 1982, 63, 1309–1313. [Google Scholar] [CrossRef] [Green Version]
  37. Tang, Q.; Zhang, C. Data processing system (DPS) software with experimental design, statistical analysis and data mining developed for use in entomological research. Insect Sci. 2013, 20, 254–260. [Google Scholar] [CrossRef] [PubMed]
  38. Santos, F.L. Assessing olive evapotranspiration partitioning from soil water balance and radiometric soil and canopy temperatures. Agronomy 2018, 8, 43. [Google Scholar] [CrossRef] [Green Version]
  39. Mhawej, M.; Nasrallah, A.; Abunnasr, Y.; Fadel, A.; Faour, G. Better irrigation management using the satellite-based adjusted single crop coefficient (Kc) for over sixty crop types in California, USA. Agric. Water Manag. 2018, 256, 107059. [Google Scholar] [CrossRef]
  40. Abrisquta, I.; Abrisqueta, J.M.; Tapia, L.M.; Munguíad, J.P.; Conejeroa, W.; Vera, J.; Ruiz-Sánchez, M.C. Basal crop coefficients for early-season peach trees. Agric. Water Manag. 2013, 121, 158–163. [Google Scholar] [CrossRef]
  41. Munitz, S.; Schwartz, A.; Netzer, Y. Water consumption, crop coefficient and leaf area relations of a Vitis vinifera cv. ’Cabernet Sauvignon’ vineyard. Agric. Water Manag. 2019, 219, 86–94. [Google Scholar] [CrossRef]
  42. Martínez-Cruz, T.E.; Slack, D.C.; Ogden, K.L.; Ottman, M. The water use of sweet sorghum and development of crop coefficients. Irrig. Drain. 2015, 64, 93–104. [Google Scholar] [CrossRef]
  43. Marcial-Pablo, M.D.J.; Ontiveros-Capurata, R.E.; Jiménez-Jiménez, S.I.; Ojeda-Bustamante, W. Maize Crop Coefficient Estimation Based on Spectral Vegetation Indices and Vegetation Cover Fraction Derived from UAV-Based Multispectral Images. Agronomy 2021, 11, 668. [Google Scholar] [CrossRef]
  44. Zhang, J.; Duan, J. Analyses on Springtime Runoff Variance of Aksu River and Its Climate Causes. Plateau. Meteorol. 2009, 28, 465–473. [Google Scholar]
  45. Li, R.; Zhao, J.; Shi, H.; Wang, N.; Qi, Y.; Feng, Y.; Jia, Q. Simulation of evapotranspiration of corn under mulched drip irrigation based on SIMDual_Kc model in Tongliao area of Inner Mongolia. Trans. Chin. Soc. Agric. Eng. 2018, 34, 127–134. [Google Scholar]
  46. Wang, Z.; Cai, H.; Yu, L.; Wang, X.; Shi, X. Estimation of evapotranspiration and soil evaporation of winter wheat in arid region of Northwest China based on SIMDualKc model. Trans. Chin. Soc. Agric. Eng. 2016, 32, 126–136. [Google Scholar]
  47. Miao, Q.; Rosa, R.D.; Shi, H.; Paredes, P.; Zhu, L.; Dai, J.; Gonçalves, J.M.; Pereira, L.S. Modeling water use, transpiration and soil evaporation of spring wheat–maize and spring wheat–sunflower relay intercropping using the dual crop coefficient approach. Agric. Water Manag. 2016, 165, 211–229. [Google Scholar] [CrossRef]
  48. Zhao, N.; Liu, Y.; Cai, J. Calculation of crop coefficient and water consumption of summer maize. J. Hydraul. Eng. 2010, 41, 953–959. [Google Scholar]
  49. Cui, N. Efficient Water Use Mechanism and Application Patterns of Optimized Regulated Deficit Irrigation of Pear-Jujube Tree in the Semi Arid Region of Northwest China; Northwest A&F University: Yangling, China, 2009. [Google Scholar]
  50. Sun, X.; Chai, Z.; Jiang, P. Effects on the Yields of the Red Fuji Apple with Water and Nitrogen Coupling in the South of Xinjiang. North Hortic. 2011, 2, 19–21. [Google Scholar]
  51. Küçükyumuk, C.; Kacal, E.; Yildiz, H. Effects of Different Deficit Irrigation Strategies on Yield, Fruit Quality and Some Parameters: ‘Braeburn’ Apple Cultivar. Not. Bot. Horti. Agrobo. 2013, 41, 510–517. [Google Scholar] [CrossRef] [Green Version]
  52. Hou, Y.; Wang, Z.; Li, W.; Dou, Y.; Zhang, J.; Wen, Y. Effect of Water and Fertilizer Coupling on Water Consumption and Crop Coefficient of Drip Irrigated Grape in Extreme Arid Area. J. Soil. Water Conserv. 2019, 33, 279–286. [Google Scholar]
  53. Zeng, J. Water Consumption Characteristics and Irrigation Schedule of Mountain Apple Tres of Surge-Root Irrigation in Loess Hilly-Gullied Area of Northern Shananxi; Xi’an University of Technology: Xi’an, China, 2018. [Google Scholar]
  54. Zhong, Y.; Fei, L.; Zeng, J.; Fu, Y.; Dai, Z. Effects of root-zone water deficit on yield, quality and water use efficiency of young apple trees under surge-root irrigation. Trans. Chin. Soc. Agric. Mach. 2019, 35, 78–87. [Google Scholar]
  55. Wu, N.; Yang, C.; Luo, Y.; Sun, L. Estimating Evapotranspiration and Its Components in Cotton Fields under Deficit Irrigation Conditions. Pol. J. Environ. Stud. 2018, 28, 393–405. [Google Scholar] [CrossRef] [Green Version]
  56. Martins, J.D.; Rodrigues, G.C.; Paredes, P.; Carlesso, R.; Oliveira, Z.B.; Kniesa, A.E.; Petrya, M.T.; Pereirab, L.S. Dual crop coefficients for maize in southern Brazil: Model testing for sprinkler and drip irrigation and mulched soil. Biosyst. Eng. 2013, 115, 291–310. [Google Scholar] [CrossRef]
  57. Liao, Y.; Cao, H.; Liu, X.; Xue, W. The effects of mulching and deficit irrigation on growth, evapotranspiration and yield of mountain apple trees. Agric. Res. Arid. Areas 2020, 38, 47–56. [Google Scholar]
Figure 1. (a) Location of the experimental site; (b) an orchard of dwarf cultivation with high density of apple trees; (c) an orchard of arborized apple trees; (d) layout of experimental plots.
Agriculture 11 01167 g001
Figure 2. Meteorological data in (a) 2019 and (b) 2020.
Agriculture 11 01167 g002
Figure 3. Microlysimeter used for soil evaporation measurement. (a) Location of microlysimeter; (b) diagram of microlysimeter.
Agriculture 11 01167 g003
Figure 4. Comparison between measured and simulated values of water consumption during apple growing season in 2019 and 2020.
Agriculture 11 01167 g004
Figure 5. Variation of crop coefficient, Kc-local, with (a) Julian day and (b) GDD (growing degree days) in 2019 and 2020.
Agriculture 11 01167 g005
Figure 6. Seasonal changes in soil water stress coefficient (Ks) in the DCHD-cultivated apple orchard with drip irrigation in (a) 2019 and (b) 2020.
Agriculture 11 01167 g006
Figure 7. Variation of Kcb, KsKcb + Ke, Ke, and Kc-local of different treatments in 2019 (left column) and 2020 (right column).
Agriculture 11 01167 g007
Figure 8. Relationships between total irrigation amount and apple yield and water productivity (WP) in 2019 and 2020.
Agriculture 11 01167 g008
Table 1. Soil physical parameters in experimental site.
Depth (cm)Bulk Density (g/cm3)Filed Capacity (m3/m3)Wilting Point (m3/m3)Clay (%)Silt
(%)
Sand (%)
0–201.410.120.060.774.2494.99
20–401.520.130.071.086.3392.59
40–601.570.140.070.673.1596.17
60–801.540.140.070.733.7395.54
80–1001.500.230.121.288.4290.3
100–1201.510.350.184.4111.7586.84
Table 2. Irrigation and fertilizer amount of five irrigation treatments in each month of apple trees in 2019 and 2020.
YearStageIrrigation Amount (mm)Fertilizer (kg/ha)
W1W2W3W4W5NitrogenK2OP2O5
20194.23–5.5 (Flowering and fruit period)273645546313.759.8615.13
5.6–7.20 (Fruit expansion period)21628836043250445.1140.8977.06
7.21–8.10 (Fruit maturity)40.55467.58194.55.9914.0329.15
8.11–10.26 (Deciduous period)94.5126157.5189220.510.9522.4631.84
Total378.0504.0630.0756.0882.075.8187.25153.18
20204.22–5.7 (Flowering and fruit period)273645546313.759.8615.13
5.8–7.21 (Fruit expansion period)21628836043250445.1140.8977.06
7.22–8.12 (Fruit maturity)40.55467.58194.55.9914.0329.15
8.13–10.26 (Deciduous period)94.5126157.5189220.510.9522.4631.84
Total378.0504.0630.0756.0882.075.8187.25153.18
Table 3. Initial and calibrated values of crop and soil parameters in SIMDualKc.
ParameterInitial ValuesCalibrated Values
Crop coefficients
Kcb-ini1.101.00
Kcb-mid1.331.30
Kcb-end1.090.89
p0.550.50
Soil evaporation
Depth of the surface soil layer, Ze (m)0.150.10
Total evaporable water, TEW (mm)3021
Readily evaporable water, REW (mm)108
Table 4. Performance of the SIMDualKc model for predicting evapotranspiration in the DCHD-cultivated apple orchard in 2019 and 2020.
YearbR2AAE (mm/day)RMSE (mm/day)NSEPerformance Rating
20190.970.970.280.340.97Pretty good
20201.10.990.270.350.97Pretty good
Table 5. Kc-adj at different growing stages of apple orchard in different treatments in 2019 and 2020.
YearTreatmentIni-Kc-adjMid-Kc-adjLate-Kc-adjAverage
2019W10.710.550.600.62
W20.790.730.750.76
W30.860.910.890.90
W40.931.091.031.04
W51.001.291.171.18
2020W10.530.530.450.53
W20.590.690.580.66
W30.640.860.710.80
W40.701.030.850.93
W50.751.270.991.08
Table 6. Apple yield, crop evapotranspiration (ETa) and water productivity (WP) of the five irrigation treatments in 2019 and 2020.
YearTreatmentYield (kg/ha)ETa (mm)WP (kg/m3)
2019W116,480.00 d415.55 e3.97 a
W218,384.00 c539.69 d3.41 a
W326,377.60 a665.21 c3.97 a
W426,960.00 a794.76 b3.39 a
W524,659.20 b919.12 a2.68 b
2020W120,856.00 c443.04 e4.71 b
W222,152.00 c587.34 d3.77 d
W334,704.00 a706.03 c4.92 a
W435,328.00 a831.06 b4.25 c
W528,272.00 b989.71 a2.86 e
Note: Different letters in the same column indicate that means are significantly different at p < 0.05.
Table 7. Soil evaporation and crop transpiration in different growing periods in 2019 and 2020.
Growing Stage 20192020
W1W2W3W4W5W1W2W3W4W5
Flowering and fruit periodE/%44.0041.1238.5735.6432.7445.6143.8842.4341.2039.64
T/%56.0058.8861.4364.3667.2654.3956.1257.5758.8060.36
ETc/mm36.0539.8943.6547.3050.7934.4438.0541.7545.4649.05
Fruit expansion periodE/%29.7427.5325.0320.4513.4131.1628.6625.3920.2011.93
T/%70.2672.4774.9779.5586.5968.8471.3474.6179.8088.07
ETc/mm221.73285.81349.81412.90470.12214.17283.04350.45417.27473.53
Fruit maturityE/%27.5025.9023.4019.8213.8725.3323.2722.0419.4711.39
T/%72.5074.1076.6080.1812.2074.6776.7377.9680.5388.61
ETc/mm53.6571.4289.13107.05126.7555.5772.8591.45110.55137.28
Deciduous periodE/%27.3725.4722.8618.5712.2024.3122.9021.2018.2413.76
T/%72.6374.5377.1481.4387.8075.6977.1078.8081.7686.24
ETc/mm124.57155.37186.25217.20246.4894.84123.50152.20180.94211.98
Whole growth periodE/%29.9727.7225.0920.7614.2429.9727.6525.0320.8913.85
T/%70.0372.2874.9179.2485.7670.0372.3574.9779.1186.15
ETc/mm436.00552.49668.83784.45894.13399.02517.44635.85754.22871.84
Publisher’s Note: MDPI stays neutral with regard to jurisdictional claims in published maps and institutional affiliations.

