1. Introduction
Oil palm trees are one of Thailand’s most essential economic crops considering it has the highest oil production when compared to other oil-producing plants such as soybean, peanut, sunflower, and rapeseed. Palm oil can be processed into various products such as cooking oil, soap, margarine, and sweetened condensed milk. In addition, it is also used as a raw material in the manufacturing of biodiesel and pulp. Oil palm trees grow well in tropical climates, which are often found in countries situated in equatorial regions. Thus, the oil palm is a crop that is widely cultivated by farmers in Southern Thailand.
Precision agriculture requires reliable data on the current situation at the right time. Therefore, the automated detection of oil palm trees and health disorder recognition is an alternative method for farmers to manage their resources using technology instead of a manual approach. The method also provides information on plant growth and health, which is especially useful to track the age and survival rate of plants that will contribute to the oil palm tree production in the future. Oil palm tree detection and enumeration are mostly performed using high-resolution imagery. For instance, many researchers have used high-resolution satellite images [
1] and unmanned aerial vehicle (UAV) images [
2]. UAVs have played a vital role in remote sensing in recent years as they can provide high-resolution images when there is no cloud cover. Users can set the altitude and time to fly. Aliero et al. used UAVs for automated counting of oil palm trees based on crown properties and the plants’ response to radiation. Moreover, spatial analysis and morphological analysis were also used in their study [
3]. Daliman et al. used Haar-based rectangular windows and support vector machines (SVMs) to detect oil palm trees on the WorldView-2 satellite imagery dataset [
4]. Manandhar et al. presented a methodology for object detection with aerial imagery by applying shape feature characteristics for oil palm tree detection and counting. They used circular autocorrelation of the polar shape matrix to represent images as the shape feature and used a linear SVM to standardize and reduce the feature dimensions. Finally, they used local maximum detection on the spatial distribution of standardized features for oil palm tree detection [
5].
Deep learning is one of the various machine learning procedures with a mechanism similar to that of the human brain. In addition, it is commonly applied to analyze visual imagery. Recently, much attention has been paid to this method and it has been applied in many fields, such as image recognition [
6], handwriting recognition [
7], medical, and healthcare [
8]. Moreover, deep learning has also been applied to agricultural management to reduce production costs resulting in more effective agricultural production. For example, our method was used to detect and enumerate agricultural populations, including the classification of diseased plants. Cheang et al. proposed a system for the counting and positioning oil palm trees using a convolutional neural network (CNN) to classify the oil palm dataset on a high-resolution satellite image with a sliding window technique [
9]. Li et al. proposed using deep learning to detect plants instead of manual detection methods. They used data from a manual count to train and improve the performance of the CNN system. Then, all samples were predicted on images using the sliding window technique [
10]. Sladojevic et al. studied the development of plant disease patterns from leaf images using deep convolutional networks. The results of their study demonstrated the ability to distinguish diseased plants from healthy plants [
11]. Mubin et al. used a geographic information system (GIS) and CNN named LeNet on WorldView-3 images for young and mature oil palm detection [
12]. They used a training dataset with a mini-batch of size 20 and used GIS software to display and create maps of oil palm tree prediction.
There are various popular deep learning algorithms, such as recurrent neural networks (RNNs), long short-term memory networks (LSTMs), and CNNs. RNNs and LSTMs have similar capabilities and are widely used in time series problems/forecasting, but LSTM can be trained for tasks that require long-term memory. CNN is the deep neural network most commonly used in computer vision and object detection [
13]. Many CNN models are available in the public repository. VGG-16 [
14] and Resnet-50 [
15] are examples of the CNN models commonly used for image classification. In recent years, a selective search based on regions was introduced to improve the speed and performance of a detector. The most common models include R-CNN, Fast R-CNN [
16], and Faster R-CNN [
17]. Faster R-CNN performed best among those three in terms of accuracy and detection speed.
The use of remote sensing in conjunction with these deep-learning techniques is common in the agricultural industry in many countries. Most research on oil palm tree detection uses satellite imagery and focuses solely on detection and counting. For example, Zheng et al. used Faster-RCNN, one of the most popular networks for object detection, to detect tree crowns from satellite images [
18]. In contrast, in this study, high-resolution images from UAVs are used instead. Due to this approach, data surveys can be performed without time restrictions and under any cloud conditions. Our study focuses on oil palm health classification (healthy or unhealthy) rather than just detection and automatic counting as other research. Therefore, it is useful for modern precision agriculture, which focuses on reducing farmer work processes and unnecessary production costs.
This study proposes a technique to automatically detect and count oil palm trees and recognize oil palm health from high-resolution images using CNN with Faster-RCNN structure. The training data included over 4000 images of individual oil palm trees with healthy and unhealthy classes. We evaluated the model by conducting model training evaluation and comparing prediction results with visual and ground inspections. The model was also tested with images taken at different altitudes.
3. Results and Discussion
3.1. Physical Characteristics and Data Preparation
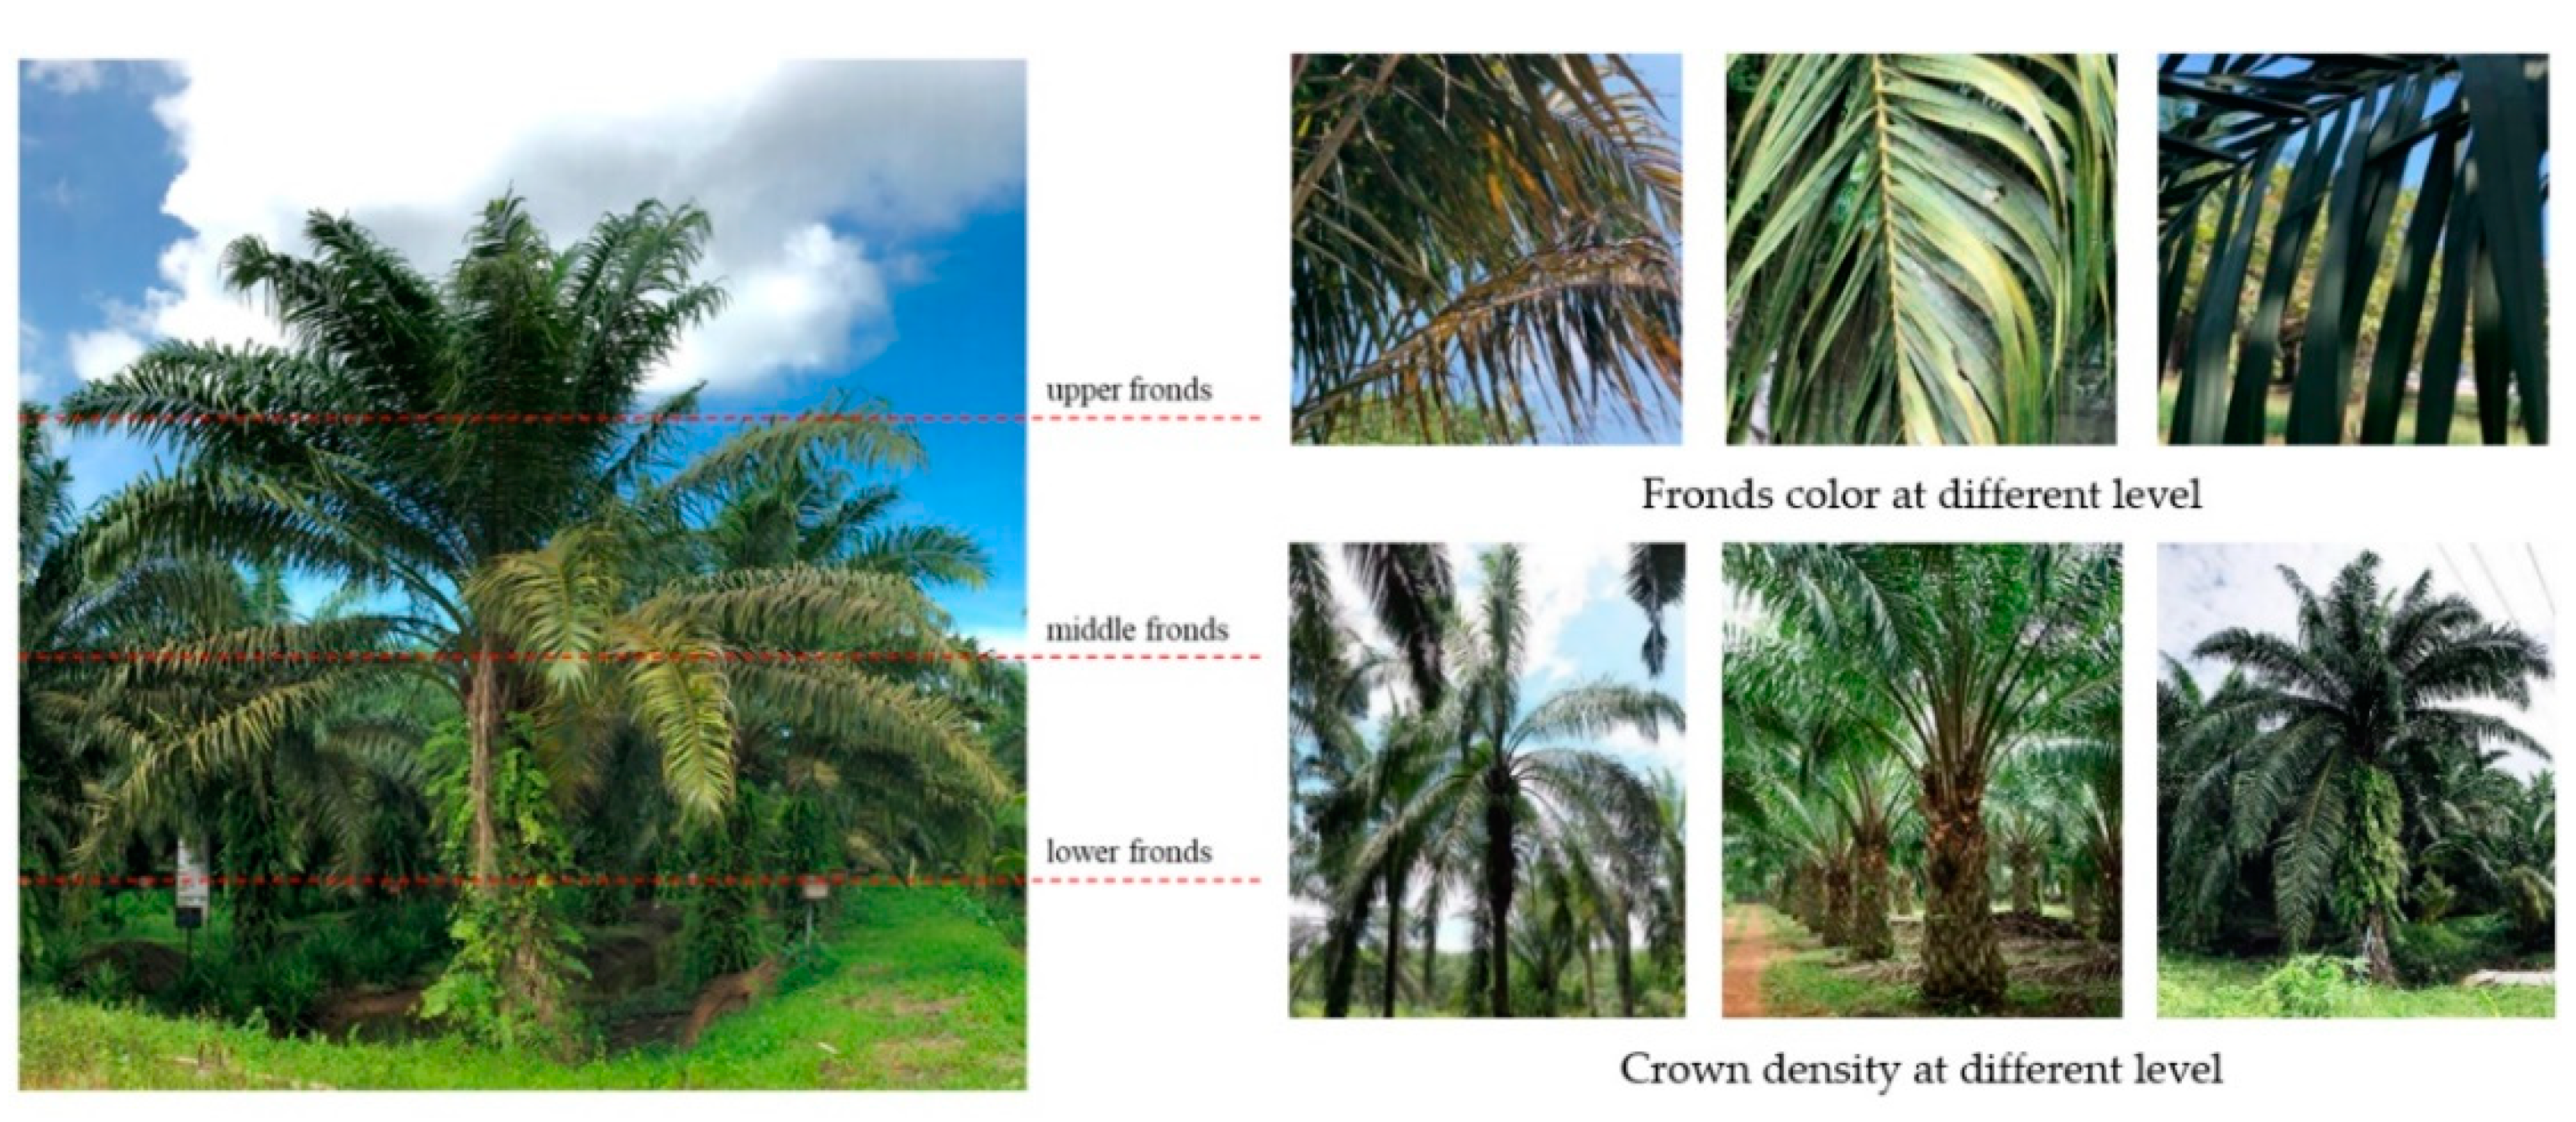
The physical characteristics of oil palm trees are essential, as they indicate good or bad health. The health of oil palm trees on high-resolution imagery at vertical angles can be observed using three crucial characteristics: crown size, crown color, and crown density. The crown size relates to the age of the oil palm tree. Young oil palms (less than eight years) have a small crown size, becoming larger as they grow, and reaching full size at about eight years. Aside from the oil palm’s age, the canopy’s size can also be affected by exposure to
Ganoderma disease. Concerning color, most healthy oil palm trees have a green canopy. In contrast, unhealthy oil palms tend to have different colored canopies ranging from yellowish green to brown, resulting from water or essential nutrient deficiency. Additionally, crown density is another important physical feature as the number of fronds can inform whether the oil palm tree is healthy or not. Specifically, healthy oil palm trees have very dense fronds and when viewed from a vertical angle it is almost impossible to see the ground below. However, problematic oil palm trees have fewer fronds; therefore, it is possible to see the ground below.
Figure 8 presents a few examples of the important physical characteristics indicative of oil palm health.
The general characteristics of healthy, mature oil palm trees are usually dark green leaves, about 18–25 fronds, and a diameter of approximately 7.5 m [
20]. Nutritional deficiencies are most often the cause for the deterioration of oil palm health. Nutrients that play an essential role in changing the physical characteristics of oil palms are nitrogen, phosphorus, potassium, magnesium, and boron. The epidemic disease in the oil palms, called
Ganoderma, is also a significant problem that stunts growth and reduces production.
In this study, observing the physical characteristics on the UAV images and surveying oil palms on plots suggested that most of the oil palm trees were healthy. The healthy palm trees in the images appeared with large crown sizes, had a dark green color, and a higher frond density than unhealthy oil palms. However, the classification of health according to significant external features was determined by all the characteristics mentioned above. For example, a young oil palm with a small crown size and low density could be a healthy oil palm. On the contrary, oil palms with large crown sizes and low density were classified as unhealthy.
Furthermore, the images oil palm trees that had differences in color, crown density, and crown size when compared to healthy oil palm trees were investigated further. The survey found that images showing a yellow canopy indicated an oil palm with nitrogen deficiency. Similarly, canopies with a greenish orange color indicated a palm with potassium deficiency. It was also found that most of the deficient palm trees were not only lacking in one nutrient but often lacked multiple nutrients. In the case of trees with severe nutritional deficiencies, reductions in crown density and size were noted. Additionally, some oil palm trees presented on the images with tiny crown sizes, low frond density, and colors of light green and yellow. When surveying and investigating these oil palm trees in the field, it was discovered that this resulted from the palm trees being affected by an advanced stage of Ganoderma. This disease causes leaves to dry out and to eventually drop down against the trunk, resulting in reduced crown size and density.
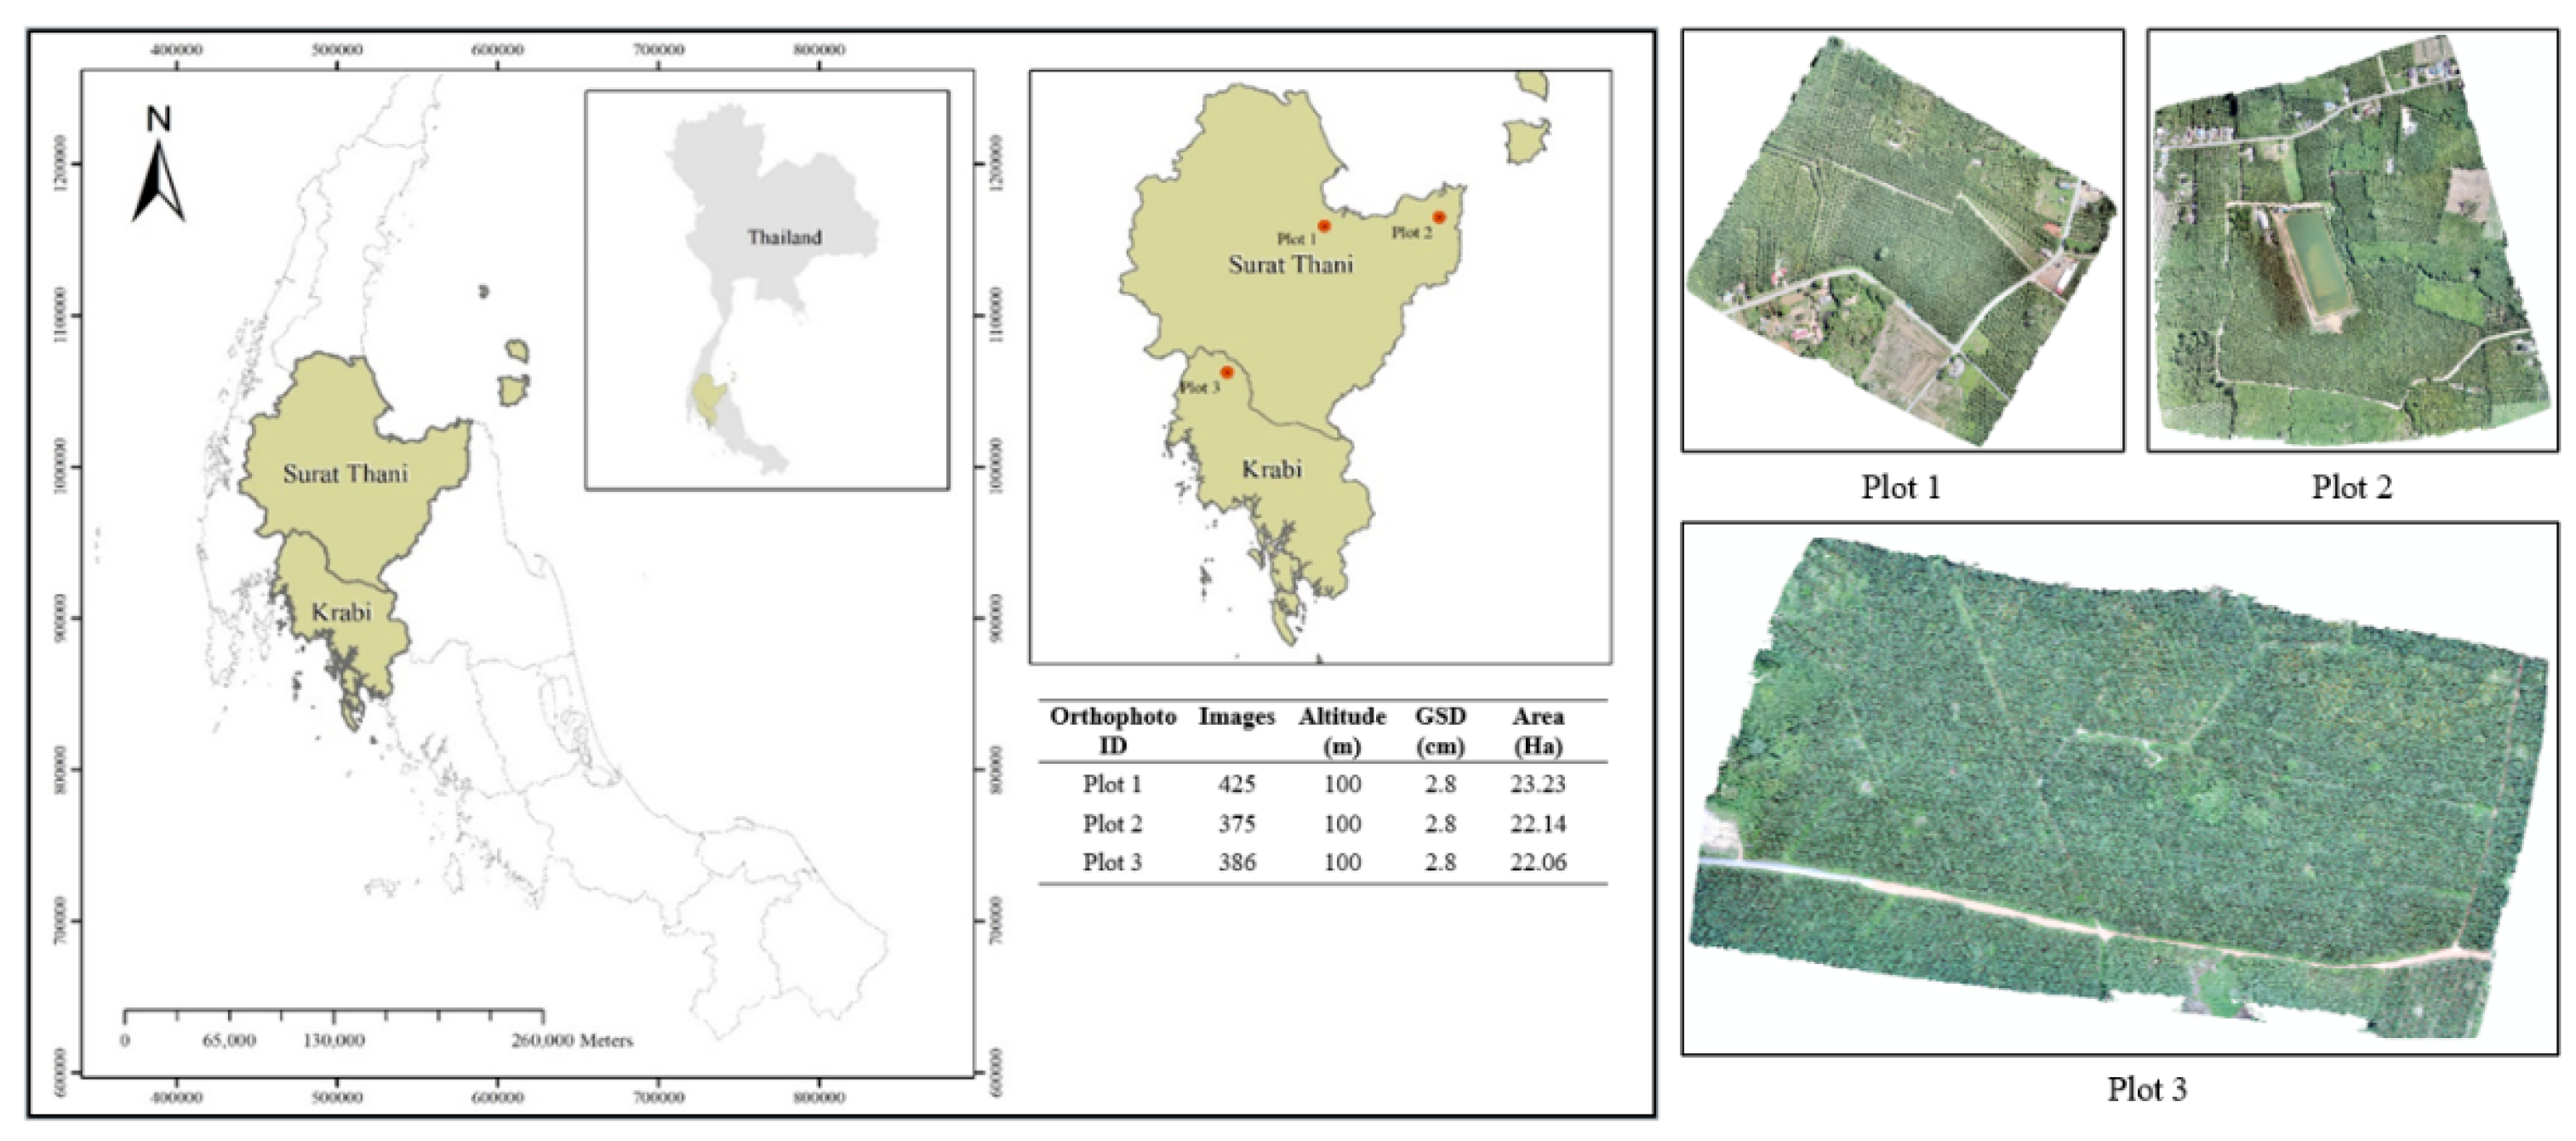
A dataset of high-resolution images from UAVs with visible bands (RGB) was used for training and testing on a deep learning model. The images used were images taken in May 2019 at an altitude of 100 m with a spatial resolution of approximately 2.8 cm. The images of each study area were converted into .JPG format before splitting them into equally sized images of 2000 pixels × 2000 pixels each. This was determined to be the optimal size to maximize memory usage and processing performance. The dataset comprised 133 images total, 116 were assigned to the training set and 17 to the test set.
3.2. Training Data Development and Model for Oil Palm Tree Classification
The training dataset contained the position of each oil palm tree, known as bounding boxes. From the 116 images in the training dataset, 3780 bounding boxes were created and used for training. The dataset comprised 3035 healthy oil palms and 745 unhealthy oil palms. The testing dataset contained 392 bounding boxes, with 325 healthy oil palms and 67 unhealthy oil palms sourced from 17 images.
Table 1 shows a breakdown of the 4172 bounding boxes used in this study. Data augmentation was used to reduce the impact of the imbalanced data.
This study used the same dataset to train and test two different base models, namely Resnet-50 and VGG-16, both of which were based on the Faster-RCNN structure. The training and testing results were compared to assess the ability and efficiency of the model. Additionally, we conducted experiments to test the ability of automatic oil palm tree detection at different flying altitudes and settings. We flew the UAV at low altitudes of 50 m, 80 m, and 90 m. Image mosaicking was an issue because palm trees have a similar pattern, and lower attitude images mostly contained palm trees. This resulted in unmosaicking in many areas. The overlap and sidelap parameters were adjusted, but this did not solve the issue. In addition to the flights at these altitudes, we performed flights using different color profiles and at different times to determine the best lighting. The experimental results demonstrated that flying with a D-log color profile before 3:00 PM was a suitable scenario.
The experiment was performed using UAV images taken at altitudes of 100, 120, 140, 160, 180, and 200 m. The results are shown in
Figure 9, and
Table 2 summarizes the experimental results.
Accuracy was evaluated by comparing the results with actual data derived from the visual interpretation of high-resolution images. Thus, this assessment emphasizes counting the number of oil palms.
Table 2 indicates that oil palm trees are best detected on UAV images taken at a 100 m altitude, with accuracy measuring at 99.53%. Therefore, images taken at a height of 100 m were used in this study to detect and classify oil palm tree health. After the training, the results were tested using the test dataset that were prepared to be approximately 10% of the training set. The Resnet-50 network model predicted 331 healthy palms, and only 51 oil palm trees were predicted as unhealthy. Therefore, this model detected a total of 382 oil palm trees on 17 images. The VGG-16 network model predicted 268 healthy palms, and 103 oil palm trees were predicted as unhealthy. In summary, this model detected a total of 371 oil palm trees on 17 images. The prediction results of each image for the two models used are shown in
Table 3. Example images of prediction results from Resnet-50 and VGG-16 are shown in
Figure 10.
Table 4 shows the comparison of the actual counts and each model’s predictions. The results show that both models were useful in terms of oil palm tree detection (healthy and unhealthy) as the number of predicted palm trees is very close to the actual count, with the Resnet-50 model performing slightly better. When comparing health classification, the number of healthy and unhealthy oil palms detected by the Resnet-50 model was more accurate than those of the VGG-16 network. Further, the accuracy and precision ratios were calculated and will be discussed in the section evaluating model performance.
The initial assessment results also indicated that errors occurred because the oil palm trees were obstructed by other tree canopies. Coconut and other trees with similar physical characteristics to those of oil palm trees were another cause of errors. The number of detectable and undetectable oil palm trees was affected by palms located on the edges of an image, where some parts of the crown area extended across two images. Moreover, the crown size, especially in young oil palms with small crown sizes, was another cause of detection error. This was due to the small number of young oil palm samples with small crowns, as the study focused on large number of mature oil palms that appear in the study area. However, the errors related to crown size could be addressed to improve performance by increasing the number of young oil palms in the training data.
Figure 11 illustrates examples of misclassification cases.
3.3. Oil Palm Tree Classification Model Performance Evaluation
The model’s performance was evaluated in three main sections that evaluated the accuracy of data training, comparing the prediction results with visual interpretation and field surveys by using precision, recall, and F1-score as measures.
3.3.1. Model Training Inspection
Figure 12 shows the evaluation of the model performance focusing on accuracy and loss. The results indicate that the Resnet-50 network achieved higher performance than the VGG-16 network in all aspects. However, both models’ values increase or decrease similarly. Therefore, evaluating model performance with multiple indicators is advised to assist in choosing an appropriate model.
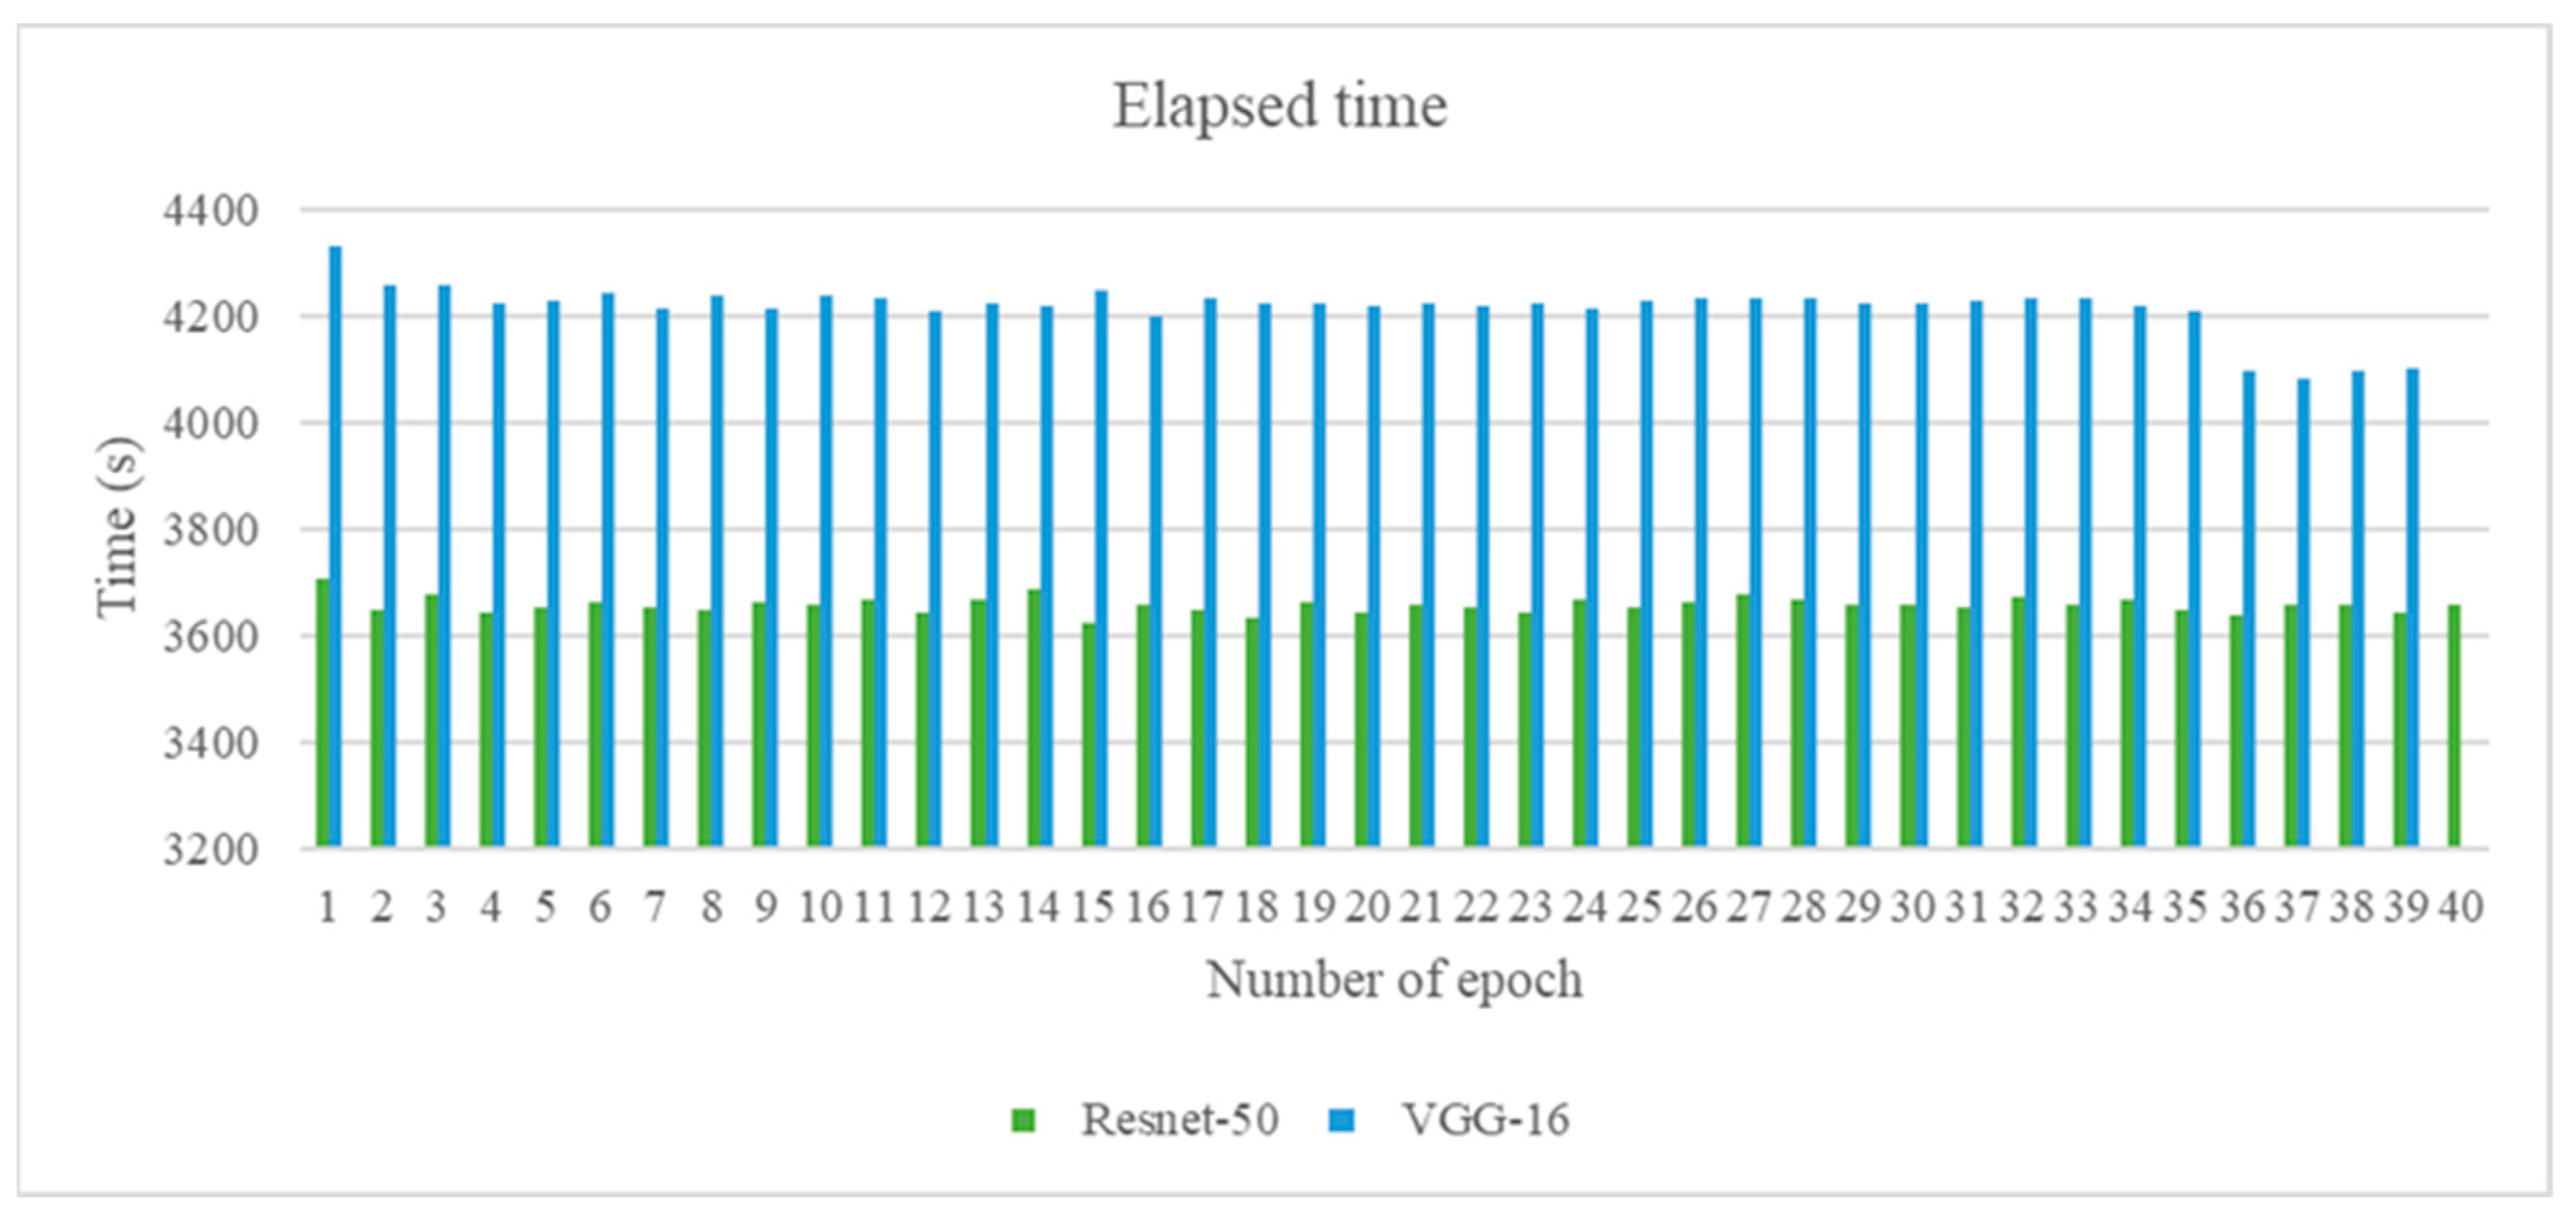
Apart from accuracy and loss, the time used to train the model is another indicator that can assess a model’s ability.
Figure 13 illustrates the comparison of the time spent on each epoch for the models used. From the graph, it can be observed that Resnet-50 used approximately 10 min less time to process than VGG-16. Thus, the total processing time between the two-model differed with about 5 h, with Resnet-50 using approximately 40 h, while VGG-16 took approximately 45 h.
3.3.2. Visual Inspection
In this section we discussed the model performance when evaluated by comparing the results of both models with actual data derived from visual interpretation of high-resolution images in another area. As mentioned before, the effectiveness was measured using precision, recall, and F1-scores, as shown in
Figure 14 below.
Each model’s performance was evaluated by dividing the prediction results into three classes: oil palm tree detection, healthy, and unhealthy. Overall, the Resnet-50 network showed superior performance when comparing F1-scores. However, the Resnet-50 model had lower precision than VGG-16, when identifying healthy oil palms. Resnet-50 achieved 91.24%, while VGG-16 had a high value of 98.13%.
3.3.3. Ground Inspection
This evaluation was performed by using the results of the model showing the performance, i.e., Resnet-50. The results were compared with the field survey’s sampling data to verify the predicted results from the model. In addition, this evaluation method determined the pattern of physical characteristics and their associated symptoms that the model can detect and classify. A total of 251 samples of oil palm trees were obtained from field survey sampling. Among these, 236 were healthy palm trees and 15 were unhealthy palm trees. The prediction results obtained from the Resnet-50 model comprised 223 healthy palm trees and 6 unhealthy palm trees. The performance evaluation was performed by calculating precision, recall, and F1-score.
Figure 15 illustrates the performance of Resnet-50. The precision of the predicted results was 100% for both the oil palm tree and unhealthy oil palm tree classes, while precision for the healthy oil palm tree class was 96.54%. For recall, the model achieved the highest percentage in the oil palm class, at 95.62%, with the healthy and unhealthy palm tree classes achieving 94.09% and 40.00%, respectively. For the F1-score, the class of oil palm tree had the highest performance, at 97.76%. Then followed the healthy and unhealthy oil palm tree classes with percentages of 95.30 and 57.14, respectively.
Evaluating the model’s predictive performance demonstrated that the model was best used for oil palm tree detection. The model showed predictive errors for health classification, especially in unhealthy oil palm. However, this model can be used for preliminary detection of health issues, since it is effective in identifying significant physical symptoms in palm trees.
According to the survey of 15 unhealthy oil palms on the plot, there were six oil palms with nitrogen deficiency, 12 oil palms with potassium deficiency, and seven oil palms with boron deficiency. Moreover, there were also two oil palms suffering from magnesium deficiency and two oil palms with Ganoderma disease. Of the six palms that were predicted to be unhealthy, two were lacking nitrogen, four were lacking potassium, two had boron deficiency, one had boron deficiency, and the last had Ganoderma disease. From the results, it can be concluded that the most common problem of unhealthy oil palm trees is a lack of nitrogen. However, the abnormality of the oil palm is usually not caused by the lack of one nutrient, but several. In addition, Ganoderma is another significant factor affecting the health classification since it always shows apparent physical symptoms. Based on the evaluation, the model can accurately predict up to 50% of all the oil palm trees that face this problem.
4. Conclusions
Since oil palms are one of the most important economic plants in Thailand, developing technology that can help to manage and maintain them is important. It can be a tool for farmers to become more efficient and increase their income. Currently, UAVs are widely used in agriculture as it can take many images with high spatial resolution in a short time, while traditional methods such as field surveying take longer. This research studied the detection and health classification of oil palms by using high-resolution imagery in conjunction with deep learning. Our study used Faster RCNN for object detection and evaluated the Resnet-50 and VGG-16 models.
The research used three important physical characteristics for detection and health classification: crown size, crown color, and crown density. These characteristics could indicate the age of the oil palm, nutrient deficiencies, and the presence of an epidemic disease, named Ganoderma.
In evaluating model performance, the accuracy from model training indicated that the Resnet-50 model was more accurate than VGG-16, and had fewer errors. Moreover, training on Resnet-50 was approximately 5 h faster than on VGG-16. The evaluation of the test prediction results was done by comparing them with both visual interpretations and field survey results. Next, precision, recall, and F1-score were calculated and evaluated.
Based on the study results and performance assessments, it can be concluded that the Resnet-50 network performed better in detection and health classification than the VGG-16 network. Further, the analysis of results highlighted that primarily the unhealthy palm trees faced potassium deficiencies and infection with Ganoderma. Additionally, the results showed that the model was often unable to detect young palm trees due to their smaller crown sizes.
In conclusion, our study showed that our proposed method could be used in the effective management of oil palm trees in Thailand. By tracking the number and health of oil palm trees this method can reduce fieldwork and the number of laborers. In addition, it can help to reduce the cost of production as treatments and fertilizer can only be applied in areas where it is needed. This will be beneficial to both farmers and organizations.
For the recommendation, the short processing time is an advantage of the Faster-RCNN structure, but it requires a large amount of varied training datasets. Therefore, we recommend that future studies increase the amount and variety of datasets, including varied image sizes, as this will improve model performance. Our study found errors in oil palm tree detection often occurred at the edge of the image. Consequently, increasing the overlap between images will result in a reduction of prediction errors. Our study focused on only three significant physical characteristics for oil palm tree health classification, all of which can be detected in RGB images. Thus, only preliminary classification of the health of oil palm trees can be done. For future studies, a multispectral camera could be used to enhance health classification.


 ,
, 


