
Mapping Priority Areas for Apiculture Development with the Use of Geographical Information Systems

 , ,
, ,
Abstract
:
1. Introduction
2. Materials and Methods
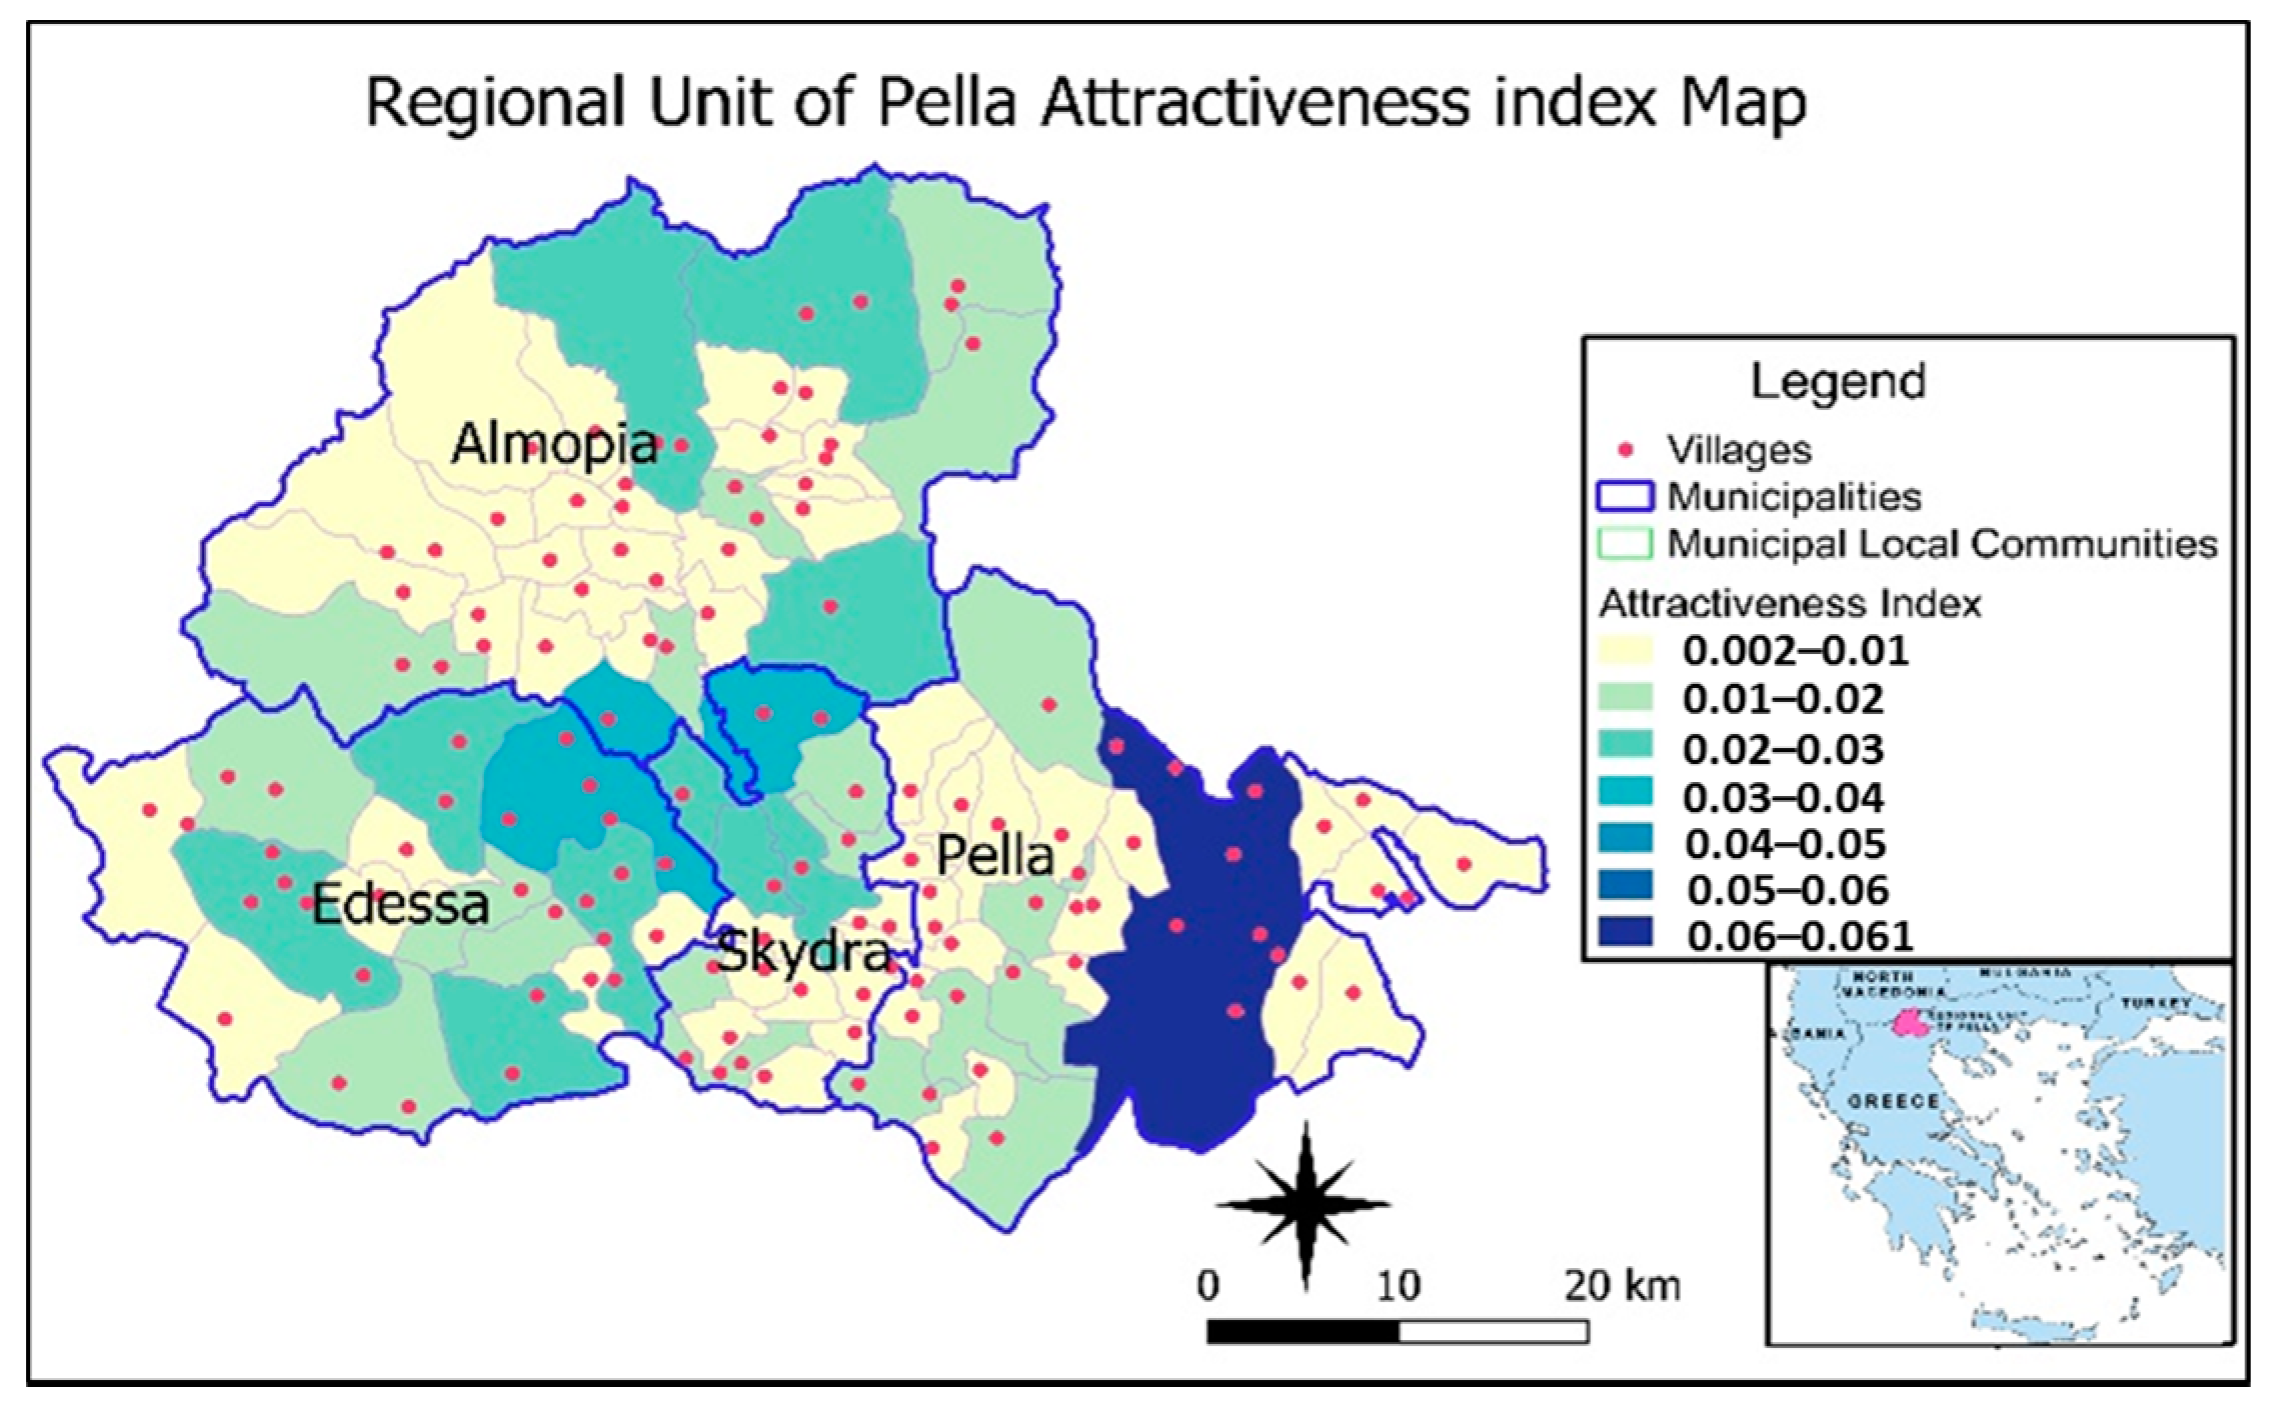
2.1. Research Area
2.2. Methodological Steps
- Collect, process, and analyze spatial information and numerical data concerning the cultivated and forest areas.
- Collect published data mainly from the documents issued by the USDA Agricultural Research Service [26], focusing on the attractiveness (supply of pollen and/or nectar) of agricultural crops to pollinating bees from the various plant species growing in the research area.
- Collect data concerning the dependence of plant species on pollinators and, in particular, on honeybees for main crop production, not for breeding and seed production if seeds are not the main consumer product.
- Determinate numerical indicators on a scale from 0 to 1, for the comparative evaluation of the predefined areas.
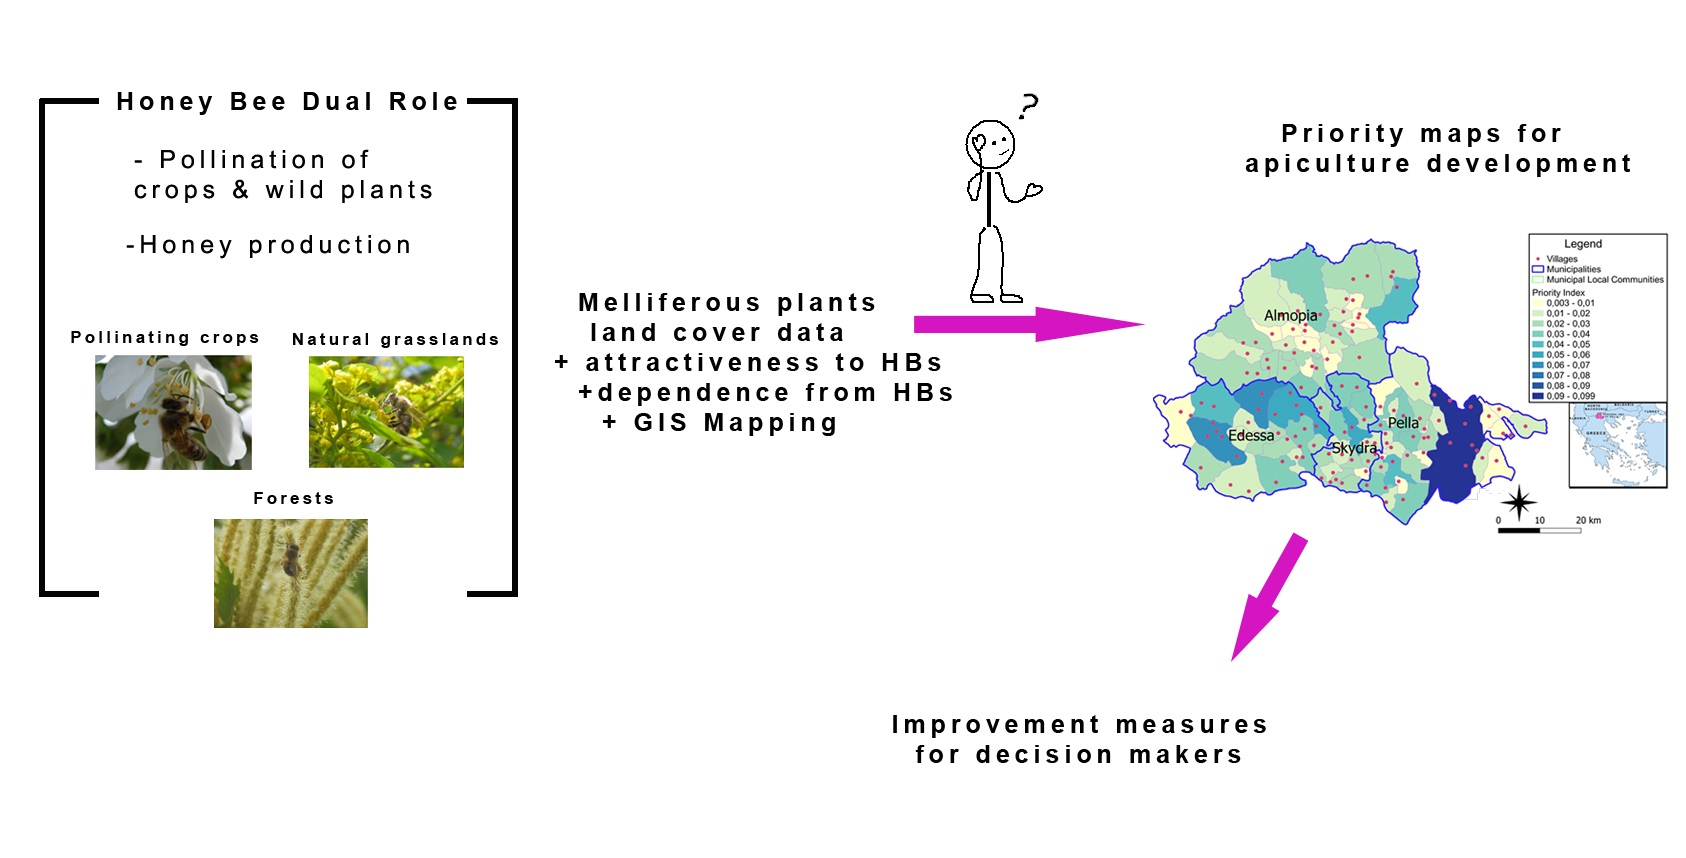
- Create thematic maps to be considered prior to undertaking apiculture development interventions.
- -
- Deciduous bushes (Paliurus): HB Pollen: +2, HB Nectar: +2
- -
- Oak: HB Pollen: 0, HB Nectar: +1
- -
- Chestnut: HB Pollen: +2, HB Nectar: +1
- -
- Pine: HB Pollen: 0, HB Nectar: +2
3. Results
3.1. Vegetation
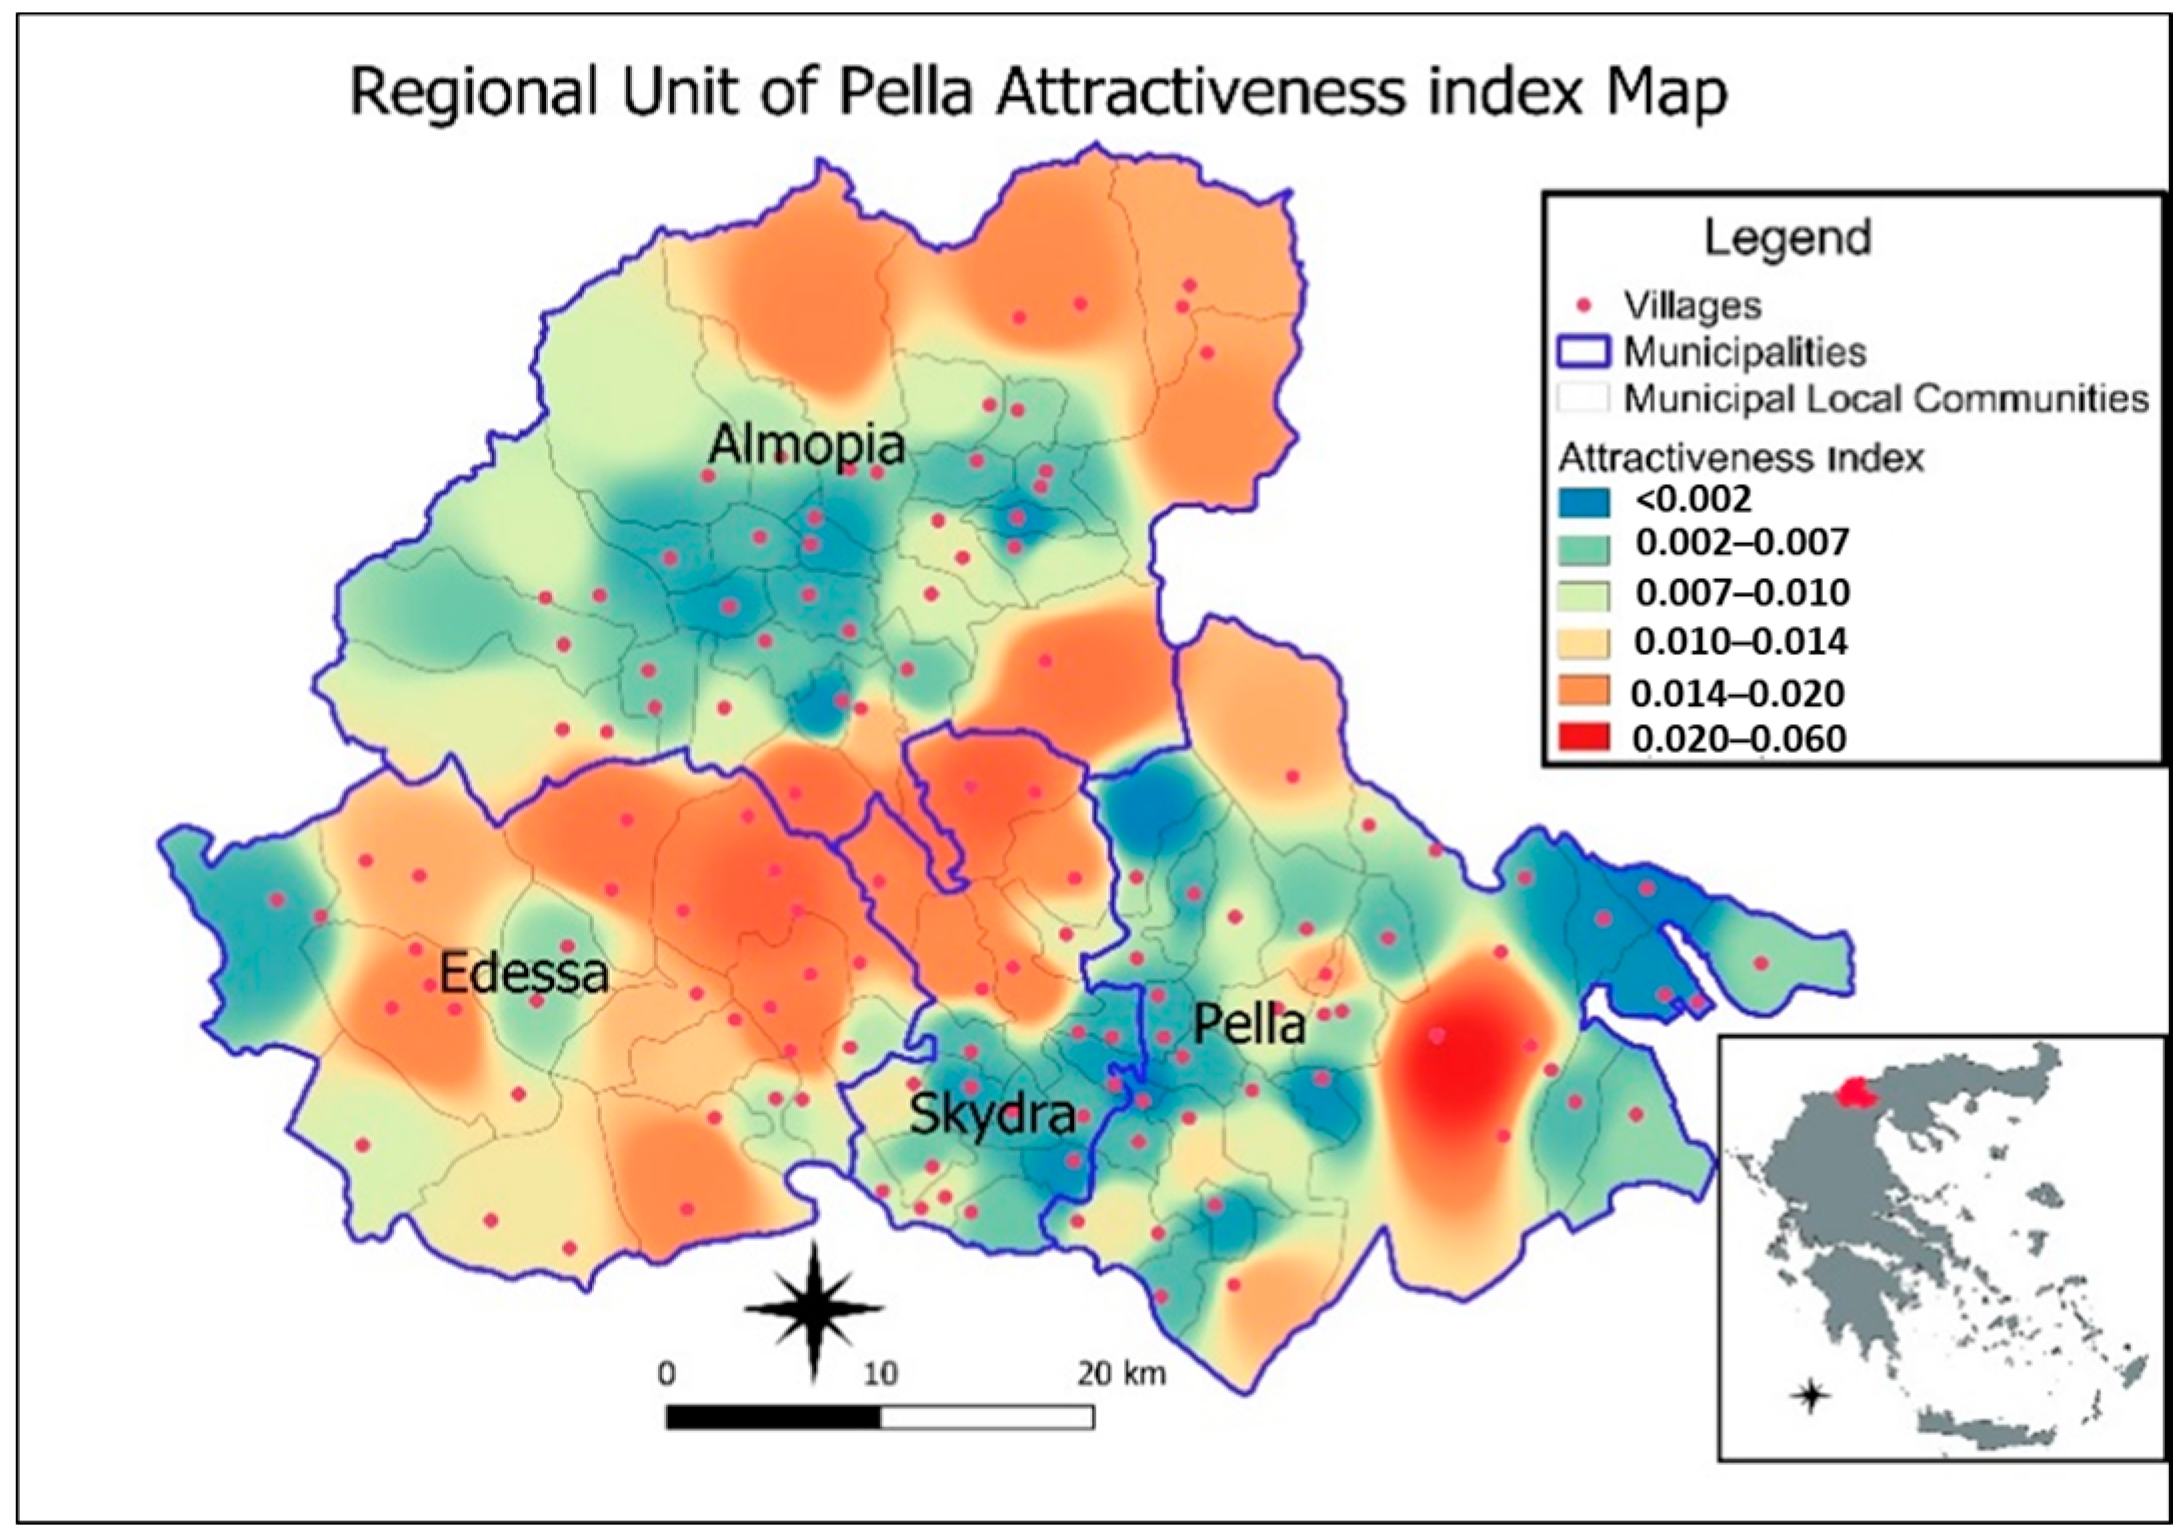
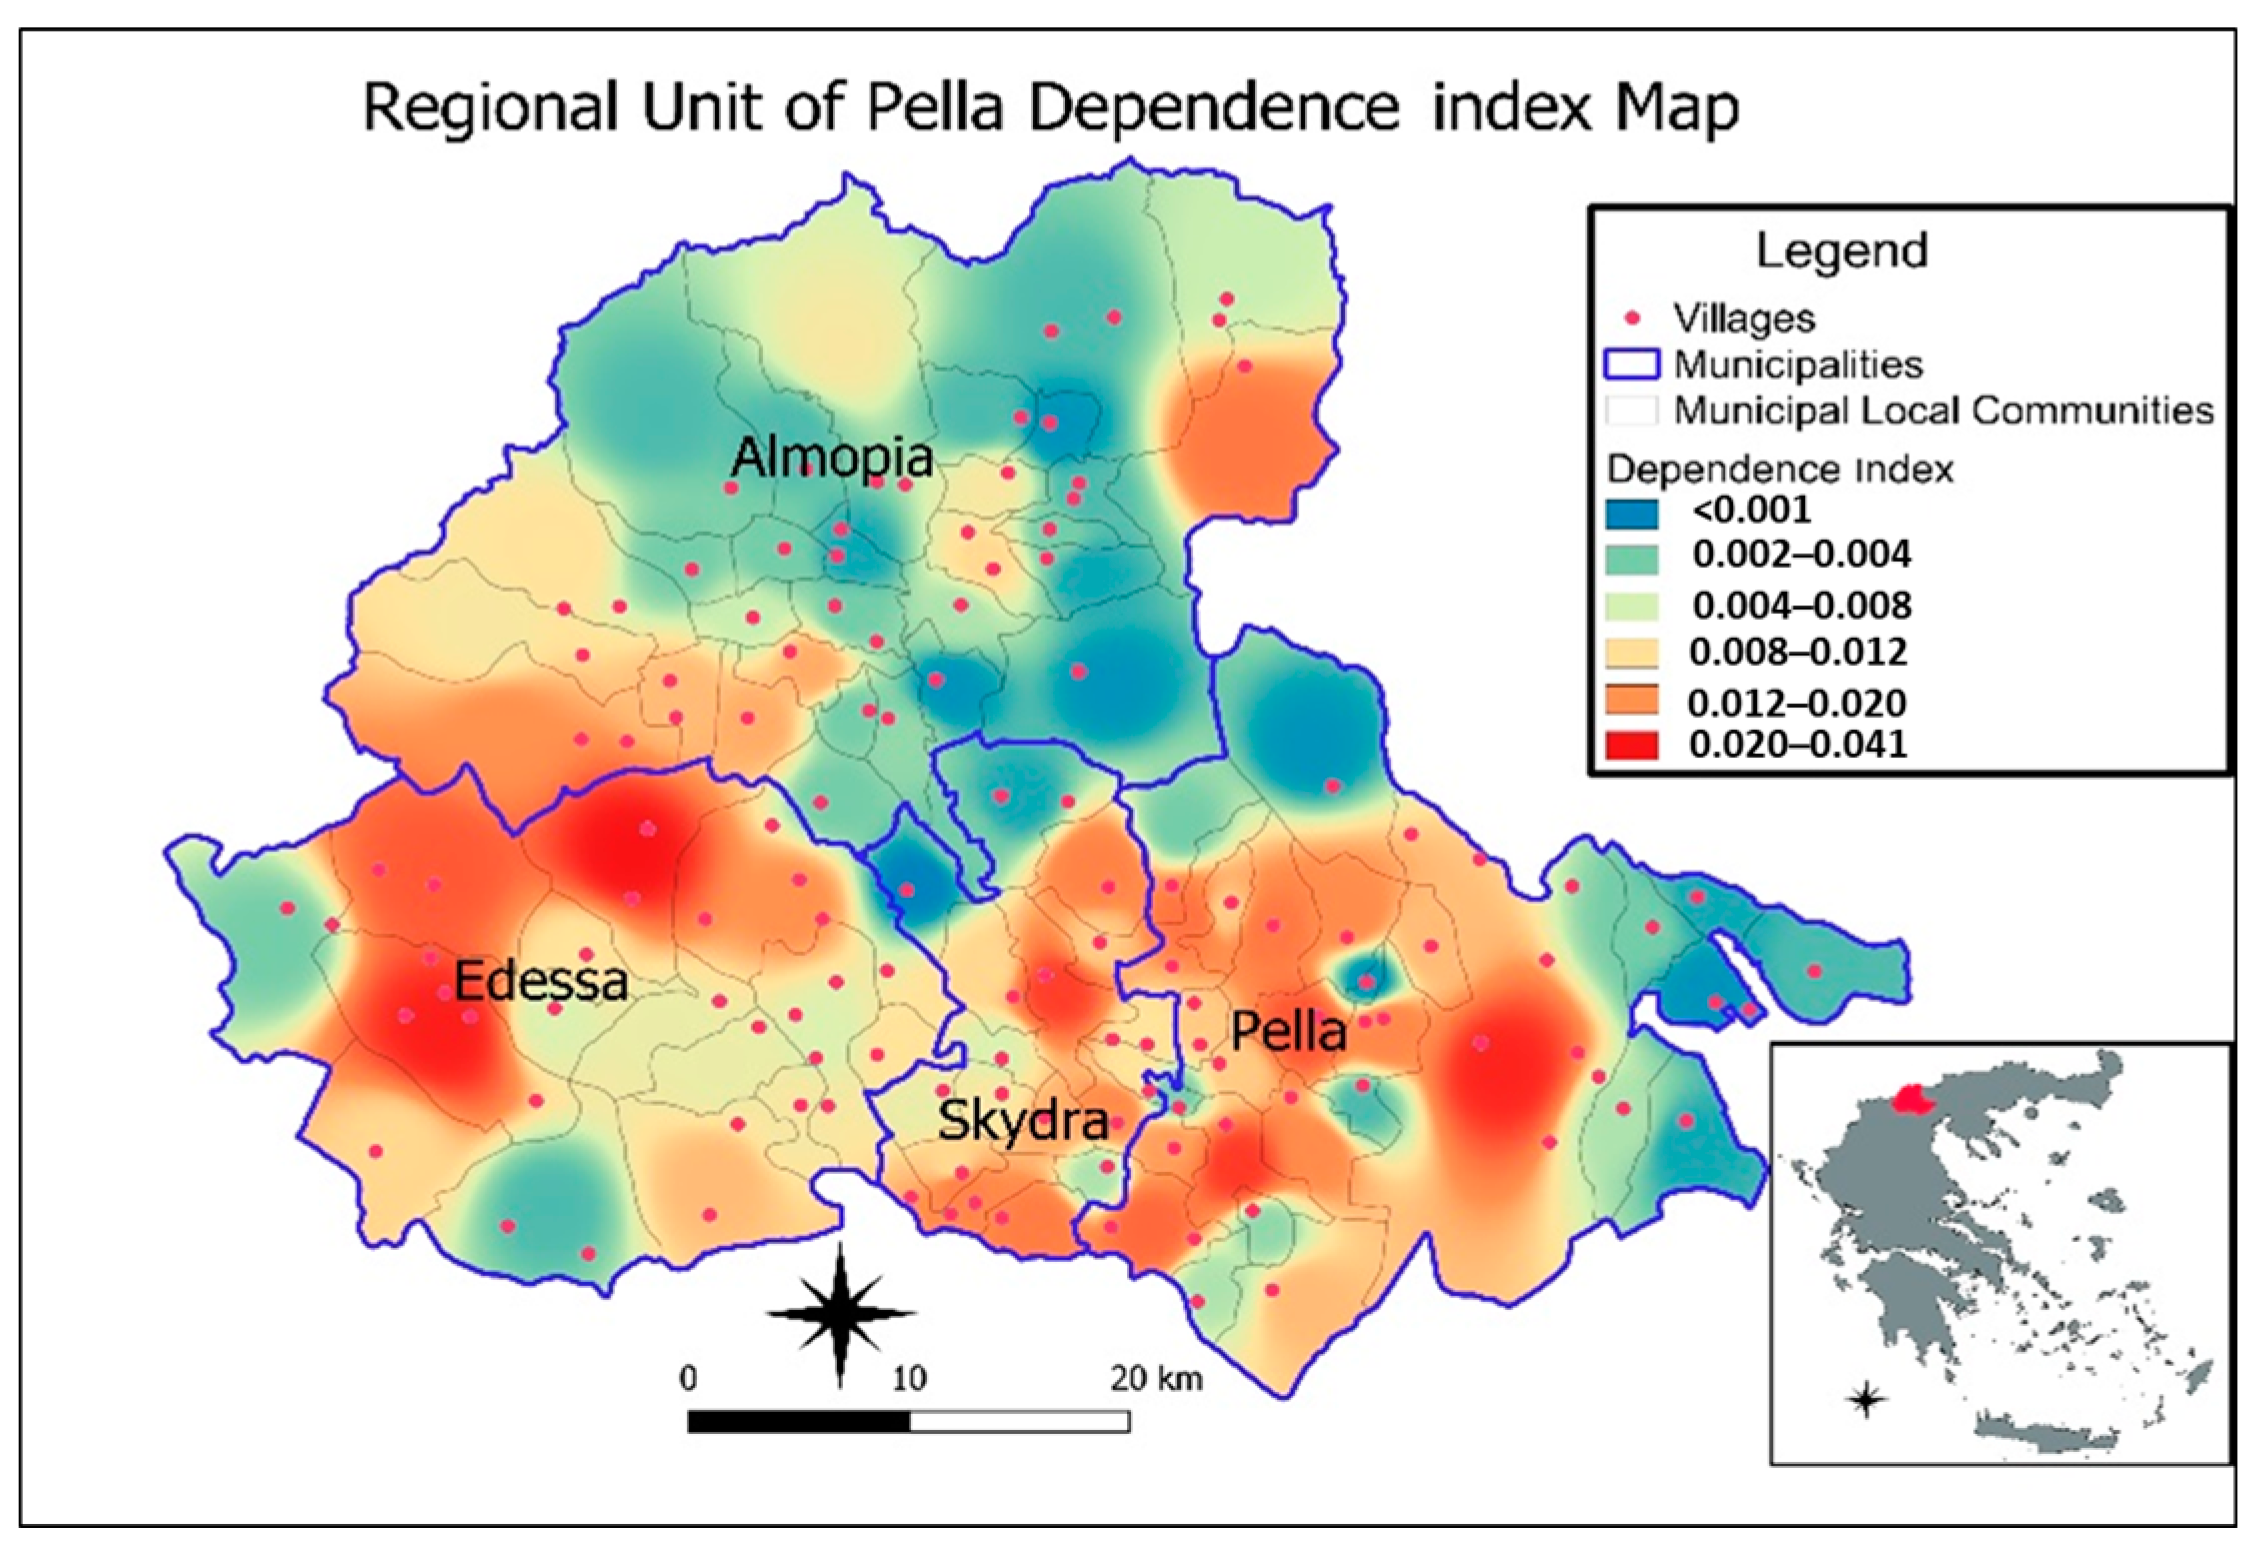
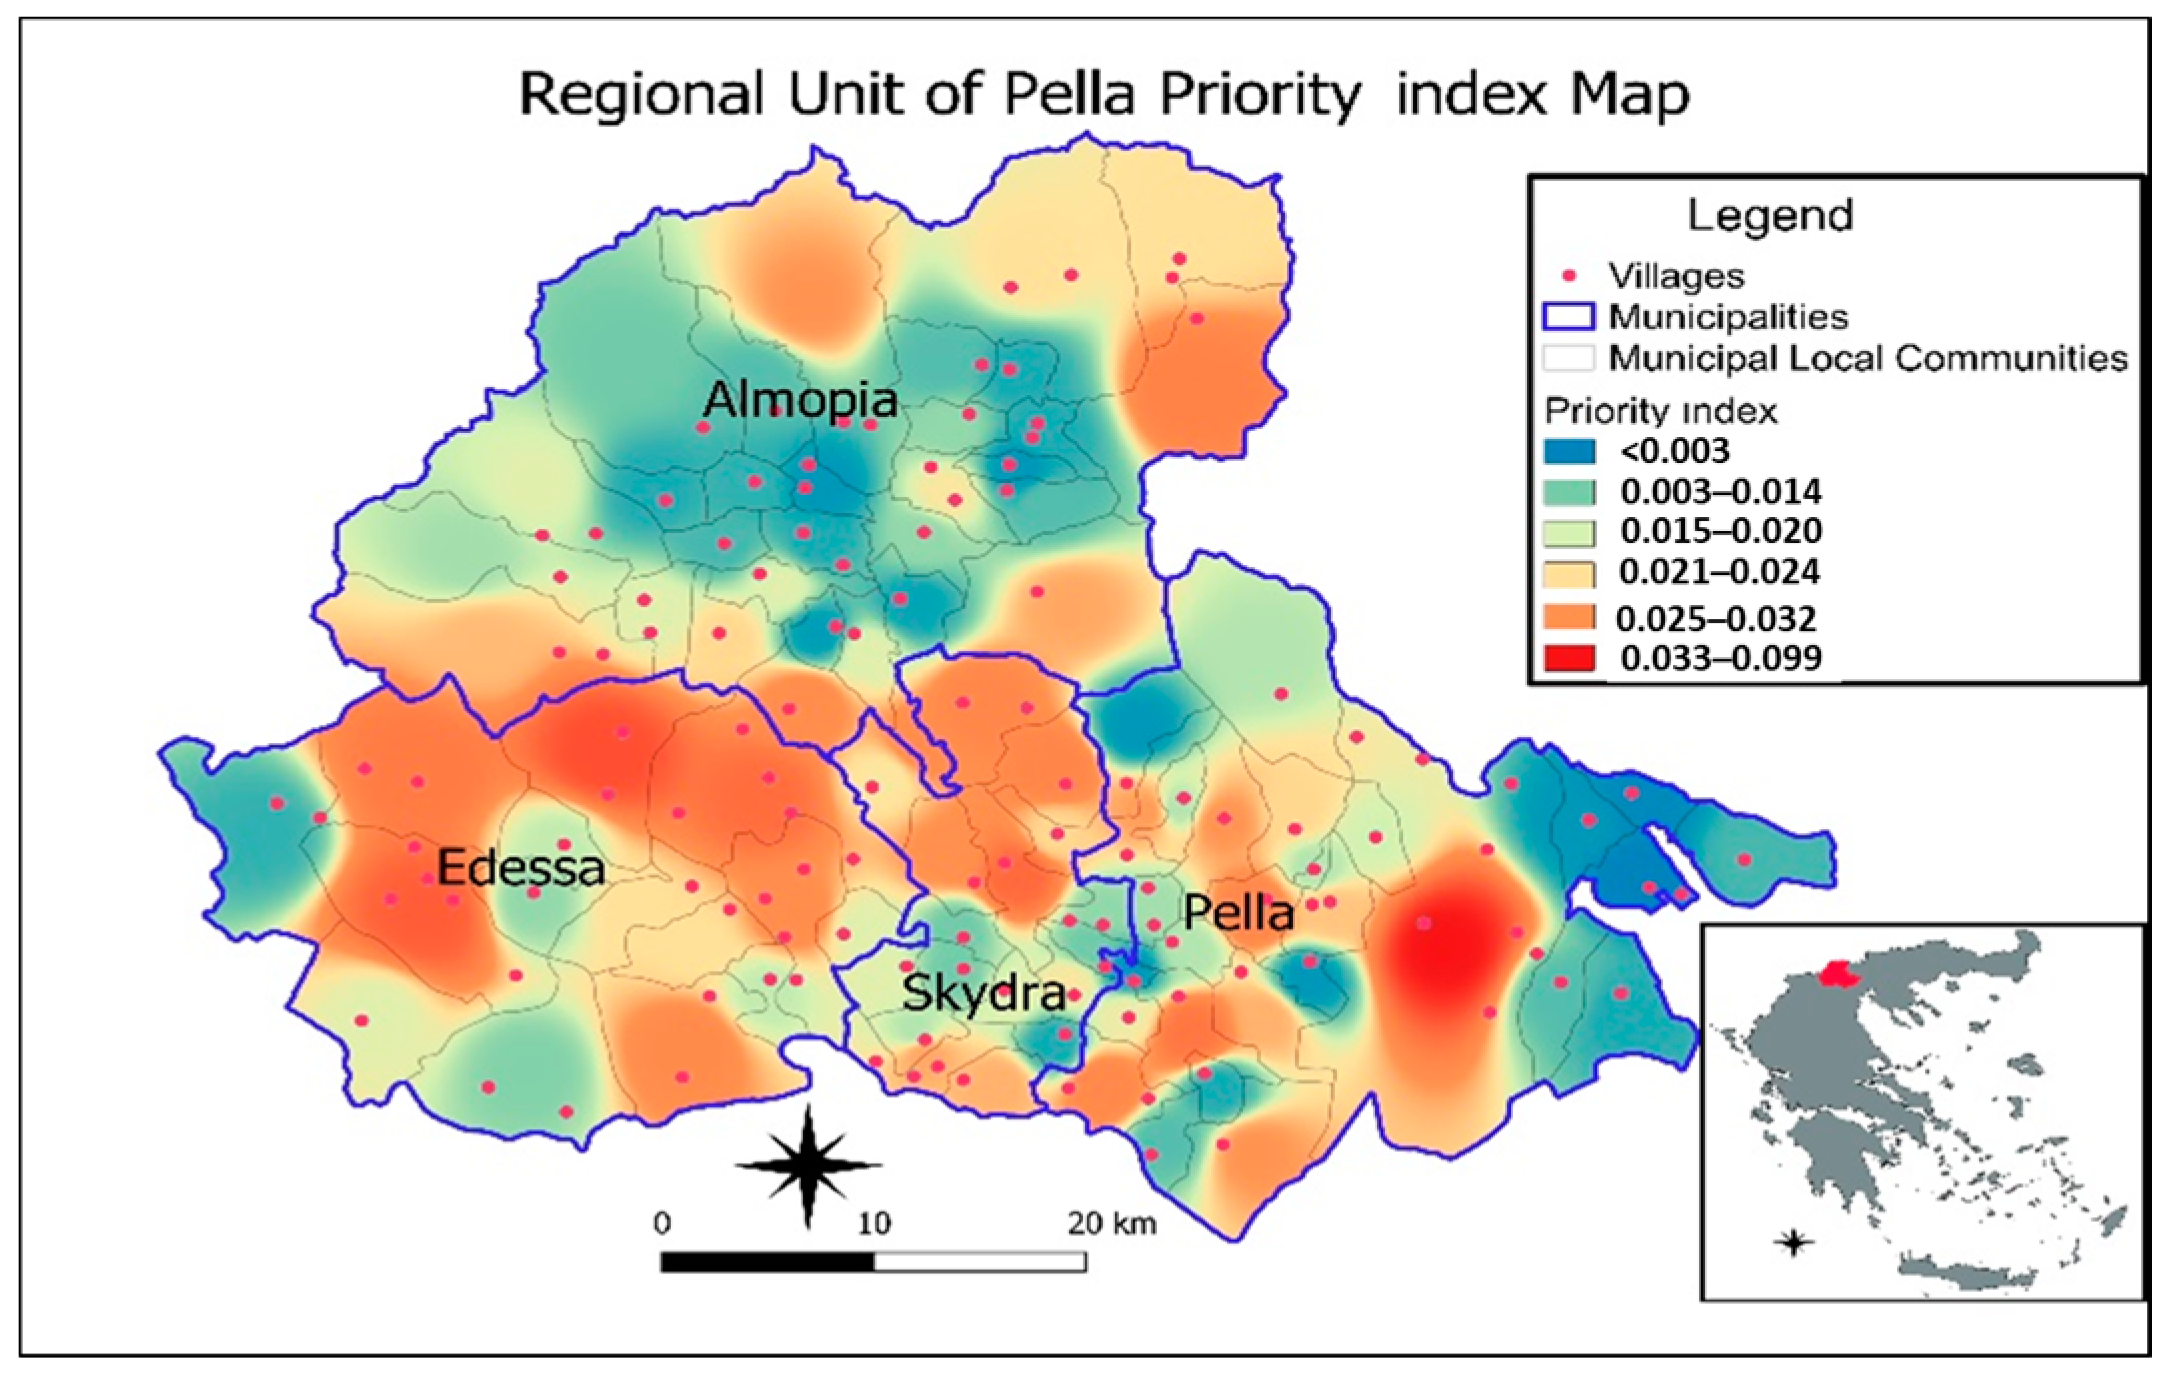
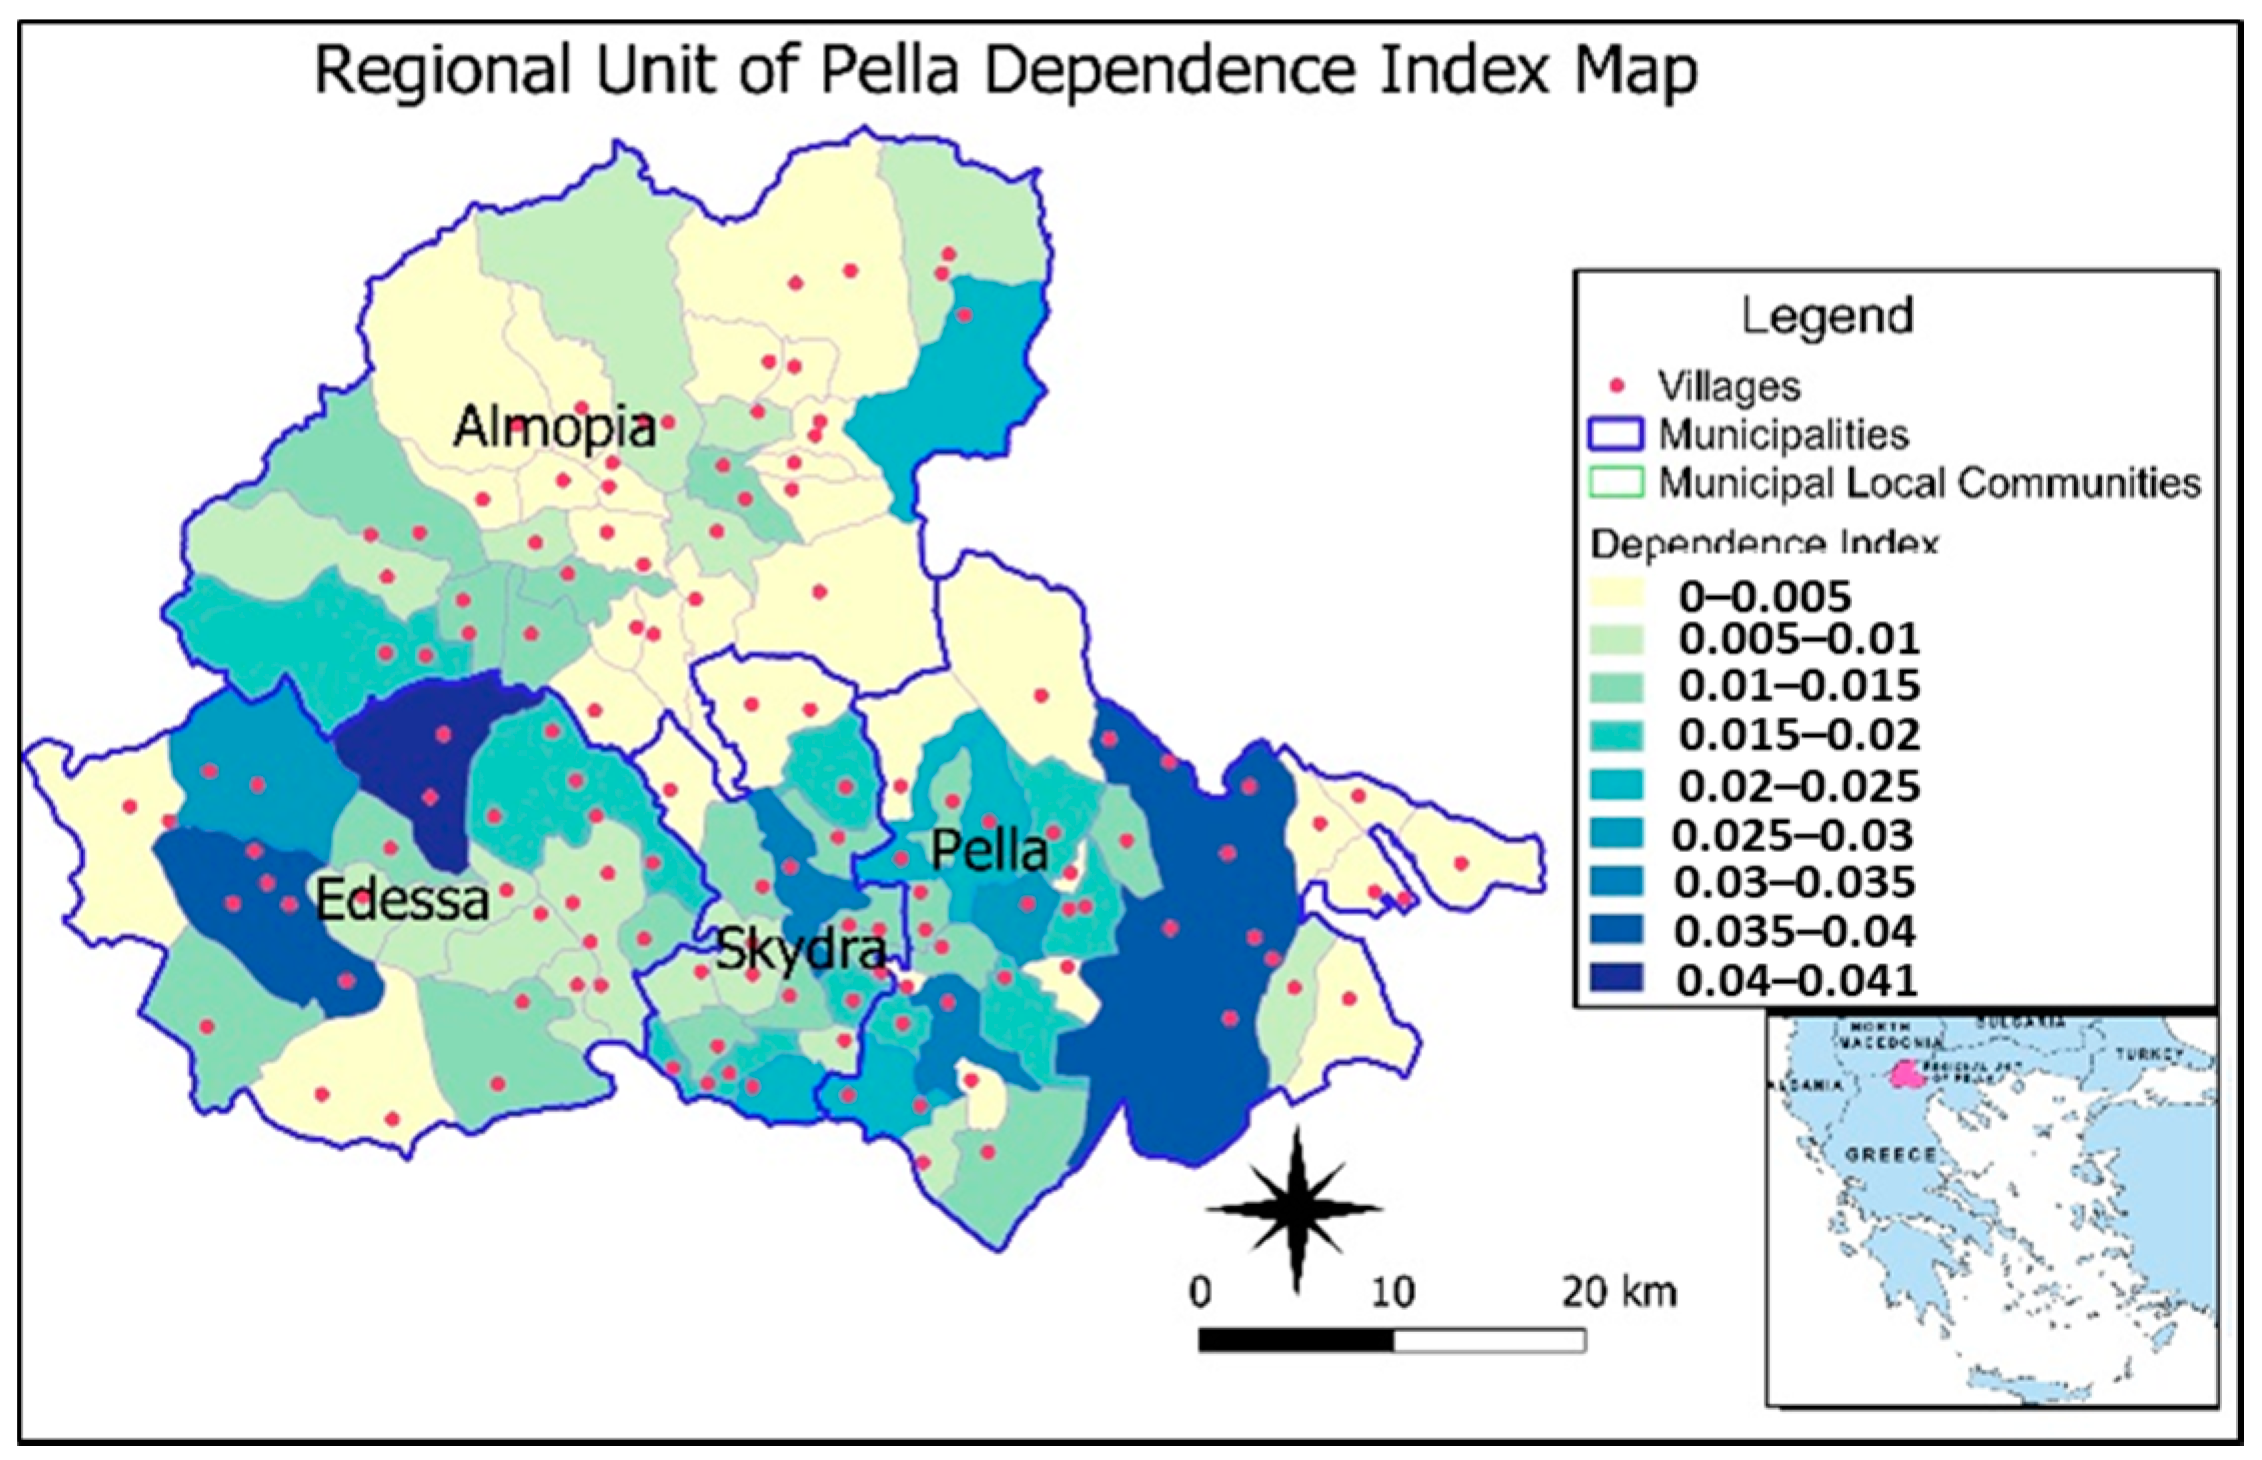
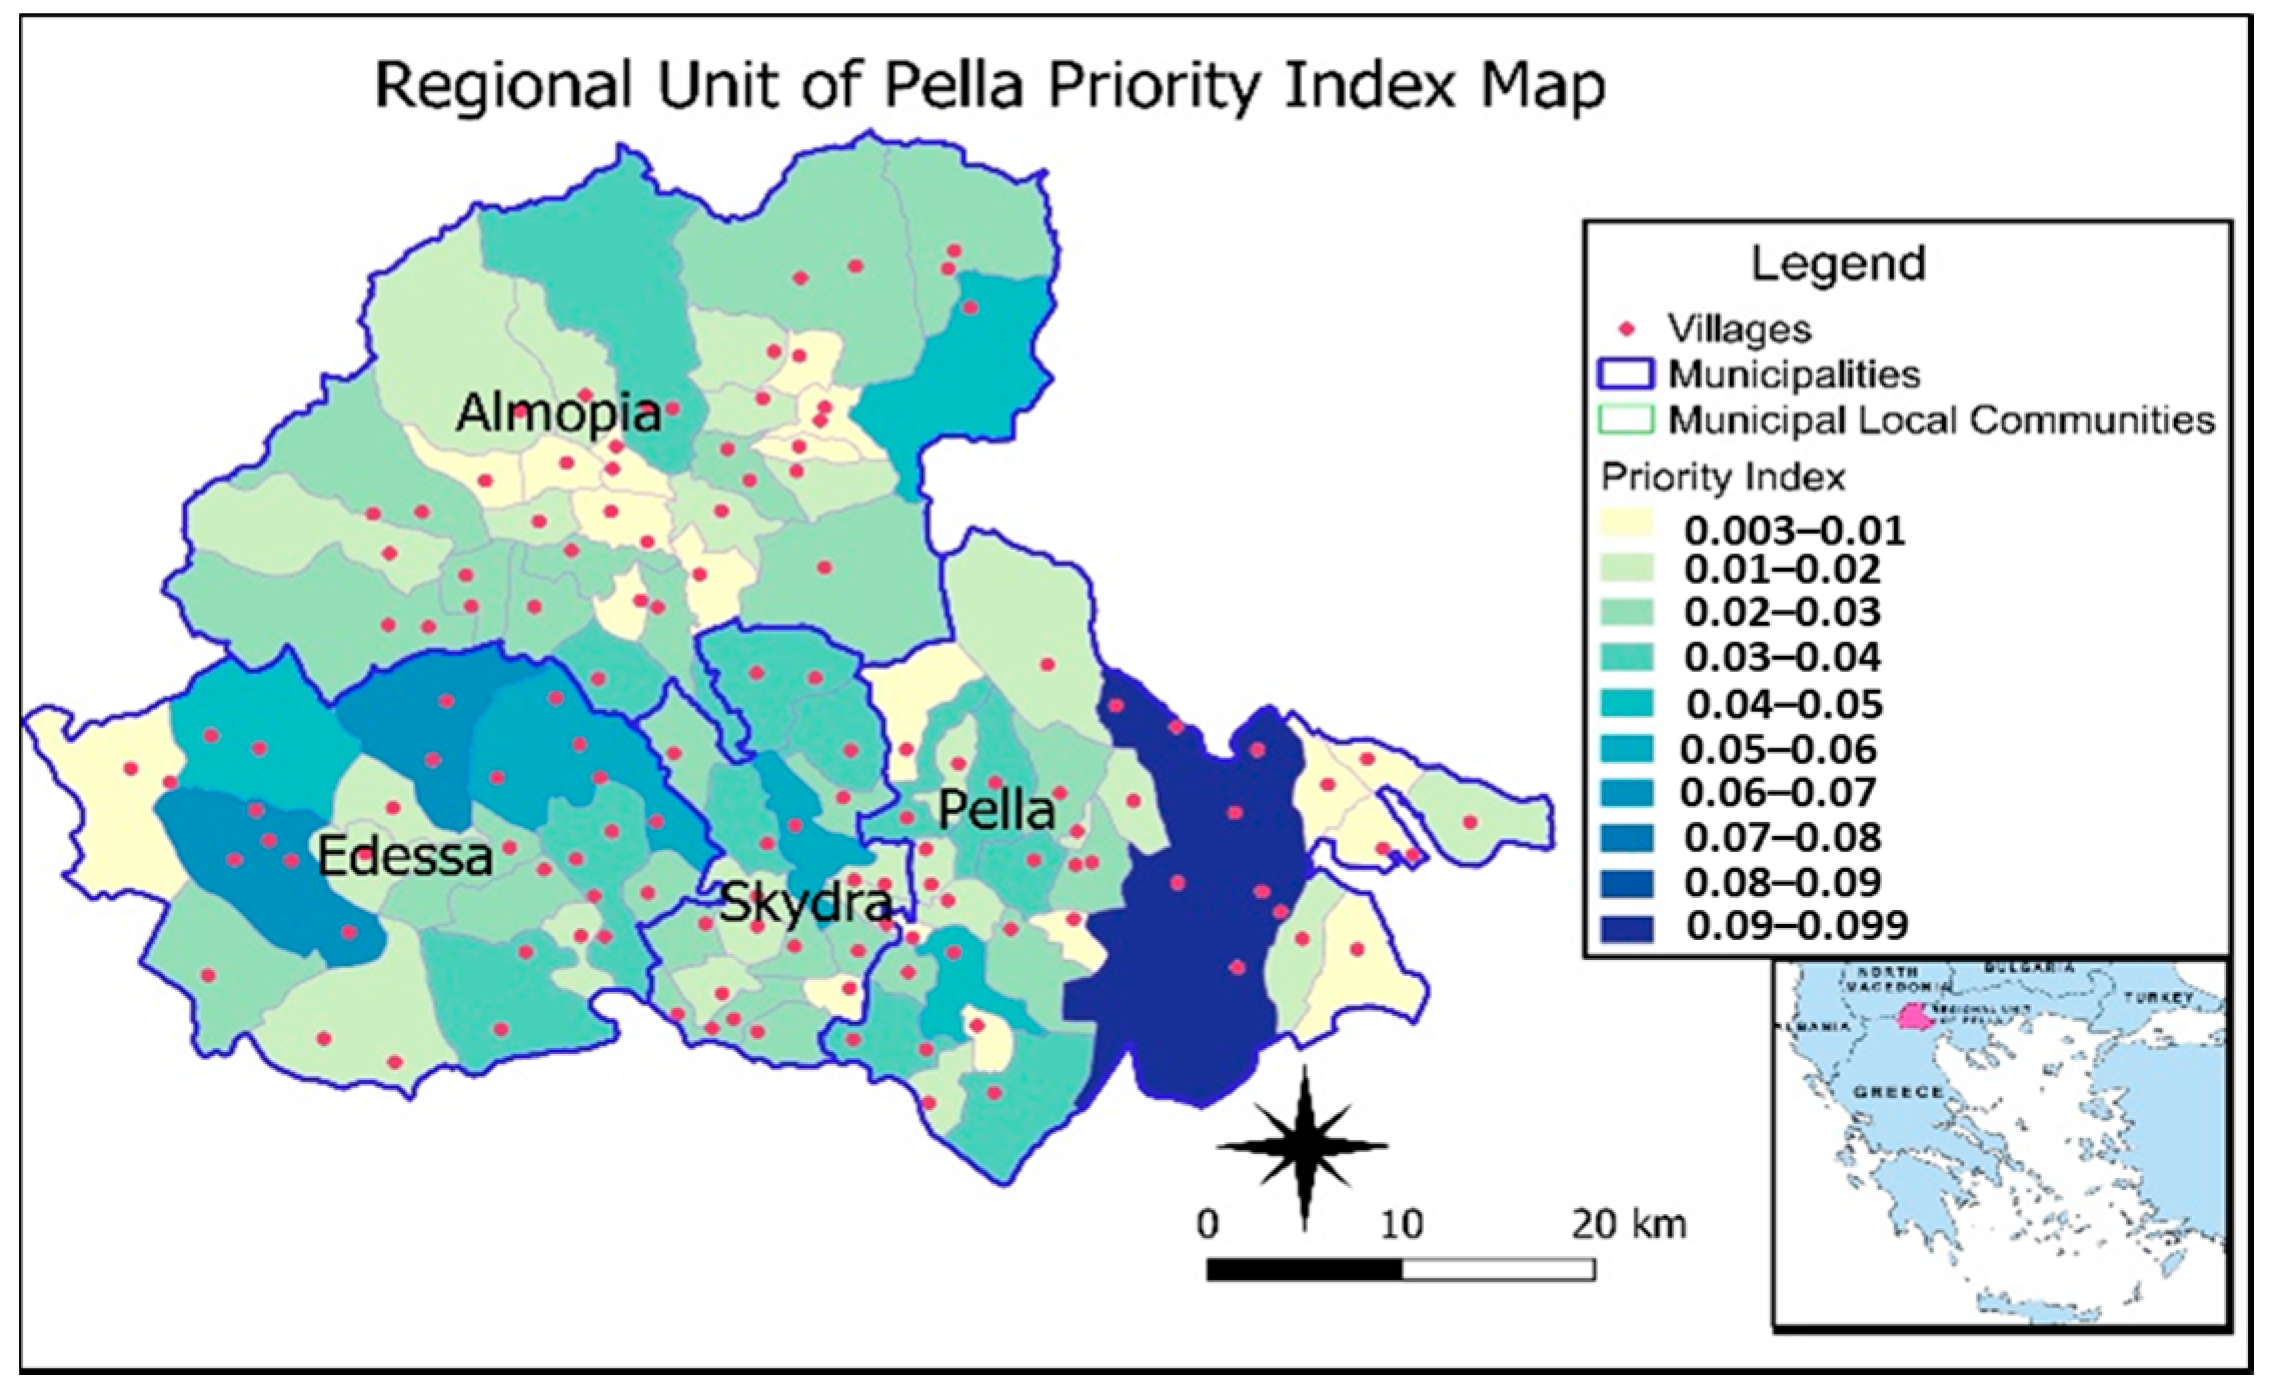
3.2. RPIA, RAIT, and RDIT Values and Heat Maps for the Research Area
4. Discussion
5. Conclusions
Author Contributions
Funding
Institutional Review Board Statement
Informed Consent Statement
Data Availability Statement
Conflicts of Interest
Appendix A


References
- Millennium Ecosystem Assessment. Ecosystems and Human Wellbeing: Biodiversity Synthesis; Millennium Ecosystem Assessment: Washington, DC, USA, 2005; Available online: www.millenniumassessment.org/documents/document.354.aspx.pdf (accessed on 26 January 2021).
- Galbraith, S.M.; Hall, T.E.; Tavárez, H.S.; Kooistra, C.M.; Ordoñez, J.C.; Bosque-Pérez, N.A. Local ecological knowledge reveals effects of policy-driven land use and cover change on beekeepers in Costa Rica. Land Use Policy 2017, 69, 112–122. [Google Scholar] [CrossRef]
- Brown, J.C. Responding to deforestation: Productive conservation, the World Bank, and beekeeping in Rondonia, Brazil. Prof. Geogr. 2001, 53, 106–118. [Google Scholar] [CrossRef]
- Brown, M.J.F.; Paxton, R.J. The conservation of bees: A global perspective. Apidologie 2009, 40, 410–416. [Google Scholar] [CrossRef] [Green Version]
- Ingram, V.; Njikeu, J. Sweet, sticky, and sustainable social business. Ecol. Soc. 2011, 16, 1–18. Available online: www.ecologyandsociety.org/vol16/iss1/art37/ES-2010-3930.pdf (accessed on 1 January 2021). [CrossRef]
- Potts, S.G.; Imperatriz-Fonseca, V.; Ngo, H.; Biesmeijer, J.C.; Breeze, T.; Dicks, L.; Garibaldi, L.; Settele, J.; Vanbergen, A.J.; Aizen, M.A.; et al. Summary for Policymakers of the Assessment Report of the Intergovernmental Science-Policy Platform on Biodiversity and Ecosystem Services on Pollinators, Pollination and Food Production; Secretariat of the Intergovernmental Science-Policy Platform on Biodiversity and Ecosystem Services: Bonn, Germany, 2016; p. 36. Available online: https://ipbes.net/sites/default/files/downloads/pdf/ipbes_4_19_annex_ii_spm_pollination_en.pdf (accessed on 1 January 2021).
- Food and Agriculture Organization of the United Nations (FAO). Regulating Services. Available online: http://www.fao.org/ecosystem-services-biodiversity/background/regulating-services/en/ (accessed on 2 January 2021).
- U.S. Food and Drug Administration (FDA). Helping Agriculture’s Helpful Honey Bees. Available online: https://www.fda.gov/animal-veterinary/animal-health-literacy/helping-agricultures-helpful-honey-bees#Biology (accessed on 2 January 2021).
- Gounari, S. The Practice of Beekeeping in the Forest. Hellenic Institute of Mediterranean Forest Ecosystems and Forest Products Technology: Abstract Book of the workshop on “Bee & Environment, Beekeeping & Forest Ecosystems”; Hellenic Institute of Mediterranean Forest Ecosystems and Forest Products Technology: Athens, Greece, 2018; pp. 23–24. Available online: www.minagric.gr/images/stories/ekdhlwseis/programma_melisokomia190518.pdf (accessed on 1 January 2021).
- European Commission. Honey Bees. Available online: https://ec.europa.eu/food/animals/live_animals/bees_en (accessed on 2 January 2021).
- European Commission Agriculture & Rural Development. Honey Market Presentation. Autumn 2020. Available online: https://ec.europa.eu/info/sites/info/files/food-farming-fisheries/animals_and_animal_products/documents/market-presentation-honey_autumn2020_en.pdf (accessed on 27 January 2021).
- Breeze, T.D.; Vaissière, B.E.; Bommarco, R.; Petanidou, T.; Seraphides, N.; Kozák, L.; Scheper, J.; Biesmeijer, J.C.; Kleijn, D.; Gyldenkærne, S. Agricultural policies exacerbate honeybee pollination service supply-demand mismatches across Europe. PLoS ONE 2014, 9, e82996. [Google Scholar] [CrossRef] [PubMed] [Green Version]
- Garibaldi, L.A.; Carvalheiro, L.G.; Vaissière, B.E.; Gemmill-Herren, B.; Hipólito, J.; Freitas, B.M.; Ngo, H.T.; Azzu, N.; Sáez, A.; Åström, J.; et al. Mutually beneficial pollinator diversity and crop yield outcomes in small and large farms. Science 2016, 351, 388–391. [Google Scholar] [CrossRef] [PubMed] [Green Version]
- Food and Agriculture Organization of the United Nations (FAO). Declining Bee Populations Pose Threat to Global Food Security and Nutrition. Available online: www.fao.org/news/story/en/item/1194910/icode/ (accessed on 1 January 2021).
- Steinhauer, N.; Kulhanek, K.; Antúnez, K.; Human, H.; Chantawannakul, P.; Chauzat, M.-P.; Vanengelsdorp, D. Drivers of colony losses. Curr. Opin. Insect Sci. 2018, 26, 142–148. [Google Scholar] [CrossRef]
- Branchiccela, B.; Castelli, L.; Corona, M.; Díaz-Cetti, S.; Invernizzi, C.; de La Escalera, G.M.; Mendoza, Y.; Santos, E.; Silva, C.; Zunino, P. Impact of nutritional stress on the honeybee colony health. Sci. Rep. 2019, 9, 1–11. [Google Scholar] [CrossRef]
- Jacques, A.; Laurent, M.; Ribière-Chabert, M.; Saussac, M.; Bougeard, S.; Budge, G.E.; Hendrikx, P.; Chauzat, M.-P. A pan-European epidemiological study reveals honey bee colony survival depends on beekeeper education and disease control. PLoS ONE 2017, 12, e0172591. [Google Scholar] [CrossRef] [Green Version]
- Brodschneider, R.; Gray, A.; Adjlane, N.; Ballis, A.; Brusbardis, V.; Charrière, J.-D.; Chlebo, R.; Coffey, M.F.; Dahle, B.; de Graaf, D.C. Multi-country loss rates of honey bee colonies during winter 2016/2017 from the COLOSS survey. J. Apic. Res. 2018, 57, 452–457. [Google Scholar] [CrossRef] [Green Version]
- Brodschneider, R.; Gray, A.; Van Der Zee, R.; Adjlane, N.; Brusbardis, V.; Charrière, J.-D.; Chlebo, R.; Coffey, M.F.; Crailsheim, K.; Dahle, B.; et al. Preliminary analysis of loss rates of honey bee colonies during winter 2015/16 from the COLOSS survey. J. Apic. Res. 2016, 55, 375–378. [Google Scholar] [CrossRef] [Green Version]
- Gray, A.; Brodschneider, R.; Adjlane, N.; Ballis, A.; Brusbardis, V.; Charrière, J.-D.; Chlebo, R.; Coffey, M.F.; Cornelissen, B.; Da Costa, C.A.; et al. Loss rates of honey bee colonies during winter 2017/18 in 36 countries participating in the COLOSS survey, including effects of forage sources. J. Apic. Res. 2019, 58, 479–485. [Google Scholar] [CrossRef] [Green Version]
- Alaux, C.; Allier, F.; Decourtye, A.; Odoux, J.-F.; Tamic, T.; Chabirand, M.; Delestra, E.; Decugis, F.; Le Conte, Y.; Henry, M. A ‘Landscape physiology’ approach for assessing bee health highlights the benefits of floral landscape enrichment and semi-natural habitats. Sci. Rep. 2017, 7, 1–10. [Google Scholar] [CrossRef]
- Amiri, F.; Shariff, A.R.B.M. Application of geographic information systems in land use suitability evaluation for beekeeping: A case study of Vahregan watershed (Iran). Afr. J. Agric. Res. 2012, 7, 89–97. [Google Scholar] [CrossRef]
- Zoccali, P.; Malacrinò, A.; Campolo, O.; Laudani, F.; Algeri, G.M.; Giunti, G.; Strano, C.P.; Benelli, G.; Palmeri, V. A novel GIS-based approach to assess beekeeping suitability of Mediterranean lands. Saudi J. Biol. Sci. 2017, 24, 1045–1050. [Google Scholar] [CrossRef]
- Samuelson, A.E.; Leadbeater, E. A land classification protocol for pollinator ecology research: An urbanization case study. Ecol. Evol. 2018, 8, 5598–5610. [Google Scholar] [CrossRef] [PubMed] [Green Version]
- Ausseil, A.-G.E.; Dymond, J.R.; Newstrom, L. Mapping floral resources for honey bees in New Zealand at the catchment scale. Ecol. Appl. 2018, 28, 1182–1196. [Google Scholar] [CrossRef] [PubMed]
- United States Department of Agriculture (USDA)-REE. Attractiveness of Agricultural Crops to Pollinating Bees for the Collection of Nectar and/or Pollen; USDA-Agricultural Research Service Publication: Washington, DC, USA, 2017. Available online: www.ars.usda.gov/ARSUserFiles/OPMP/Attractiveness%20of%20Agriculture%20Crops%20to%20Pollinating%20Bees%20Report-FINAL_Web%20Version_Jan%203_2018.pdf (accessed on 2 January 2021).
- Hasilidis, P.; Grigoriadis, N.; Tsagouridou, D.; Grigoriadis, S. The Paliurus Spina-Christi Livelihoods Grazing on Mountain “Paiko”. Their Importance and Management Capabilities Based on the Principles of Multiple Use of Forests. In Proceedings of the 15th Panhellenic Forestry Conference, Kastoria, Greece, 30 September–2 October 2011; Available online: www.wfdt.teilar.gr/15_th_Panhellenic_Forestry_CONFERENCE/Presentations/Xasilidis.pdf (accessed on 1 January 2021).
- Morse, R.; Calderone, N. The Value of Honey Bees as Pollinators of U.S. Crops in 2000; Bee Culture: Medina, OH, USA, 2000; Volume 128, pp. 1–15. Available online: http://citeseerx.ist.psu.edu/viewdoc/download?doi=10.1.1.472.4894&rep=rep1&type=pdf (accessed on 1 January 2021).
- Allsopp, M.H.; de Lange, W.J.; Veldtman, R. Valuing insect pollination services with cost of replacement. PLoS ONE 2008, 3, e3128. [Google Scholar] [CrossRef] [PubMed]
- Food and Agriculture Organization of the United Nations. A Contribution to the International Initiative for the Conservation and Sustainable Use of Pollinators: Rapid Assessment of Pollinators’ Status; United Nations Food and Agricultural Organization: Rome, Italy, 2008; Available online: https://www.cbd.int/doc/case-studies/agr/cs-agr-fao.pdf (accessed on 27 January 2021).
- Gordon, J.; Davis, L. Valuing Honeybee Pollination: A Report for the Rural Industries Research and Development Corporation, 1st ed.; Rural Industries Research & Development Corporation: Kingston, Australia, 2003. Available online: www.agrifutures.com.au/wp-content/uploads/publications/03-077.pdf (accessed on 27 January 2021).
- Stephen, W.P. Maintaining Alkali Bees for Alfalfa Seed Production; Agricultural Experiment Station, Oregon State College of Agricultural Sciences: Corvallis, FL, USA, 1959; Available online: https://ir.library.oregonstate.edu/downloads/np1939606 (accessed on 2 January 2021).
- Keogh, C.R.; Robinson, P.W.A.; Mullins, J.I. Pollination Aware, the Real Value of Pollination in Australia, Appendix 1, Pollination Aware Case Study: Almonds; Rural Industries Research and Development Corporation: Kingston, Australia, 2010; ISBN 978-1-74254-078-8. Available online: www.agrifutures.com.au/wp-content/uploads/publications/10-108.pdf (accessed on 1 January 2021).
- McGregor, S.E. Insect Pollination of Cultivated Crop Plants. USDA: The First and Only Virtual Beekeeping Book Updated Continously; Additions Listed by Crop and Date; Agricultural Research Service, US Department of Agriculture: Washington, DC, USA, 1976. Available online: www.ars.usda.gov/ARSUserFiles/20220500/OnlinePollinationHandbook.pdf (accessed on 1 January 2021).
- Papadakis, I.; Kanelakis, D.; Lionakis, S.; Sotiropoulos, T.H.; Therrios, I.; Stylianidis, D. The needs to pollinate stone fruits. Agric. Crop Anim. Husb. J. 2008, 2, 24–31. [Google Scholar]
- Garratt, M.P.D.; Breeze, T.D.; Jenner, Ν.; Polce, C.; Biesmeijer, J.C.; Potts, S.G. Avoiding a bad apple: Insect pollination enhances fruit quality andeconomic value. Agric. Ecosyst. Environ. 2014, 184, 34–40. [Google Scholar] [CrossRef] [Green Version]
- Keogh, C.R.; Robinson, P.W.A.; Mullins, J.I. Pollination Aware, the Real Value of Pollination in Australia, Appendix 1, Pollination Aware Case Study: Apples; Rural Industries Research and Development Corporation: Kingston, Australia, 2010; ISBN 978-1-74254-079-5. Available online: www.agrifutures.com.au/wp-content/uploads/publications/10-109.pdf (accessed on 1 January 2021).
- Pardo, A.; Borges, P.A.V. Worldwide importance of insect pollination in apple orchards: A review. Agric. Ecosyst. Environ. 2020, 293, 106839. [Google Scholar] [CrossRef]
- Keogh, C.R.; Robinson, P.W.A.; Mullins, J.I. Pollination Aware, the Real Value of Pollination in Australia, Appendix 1, Pollination Aware Case Study: Apricots; Rural Industries Research and Development Corporation: Kingston, Australia, 2010; ISBN 978-1-74254-080-1. Available online: www.agrifutures.com.au/wp-content/uploads/publications/10-110.pdf (accessed on 1 January 2021).
- BeeAware. Grains. Available online: https://beeaware.org.au/pollination/pollinator-reliant-crops/grains/ (accessed on 2 January 2021).
- Douka, C.; Fohouo, F.H.T. Foraging and pollination behavior of Apis mellifera adansonii L. (Hymenoptera, Apidae) on Phaseolus vulgaris (Fabaceae) flowers at Maroua (Cameroon). Int. Res. J. Plant Sci. 2013, 4, 45–54. Available online: https://pdfs.semanticscholar.org/6ba3/5fa0b588676362e37be7a5ed8327d79ff903.pdf (accessed on 1 January 2021).
- Klein, A.-M.; Vaissiere, B.E.; Cane, J.H.; Steffan-Dewenter, I.; Cunningham, S.A.; Kremen, C.; Tscharntke, T. Importance of pollinators in changing landscapes for world crops. Proc. R. Soc. B Biol. Sci. 2007, 274, 303–313. [Google Scholar] [CrossRef] [Green Version]
- Sarwar, G.; Aslam, M.; Munawar, M.S.; Raja, S.; Mahmood, R. Effect of honeybee (Apis Mellifera L.) pollination on fruit setting and yield of cucumber (Cucumis Sativus L.). Pak. Entomol. 2008, 30, 185–192. [Google Scholar]
- Karapanos, I.C.; Mahmood, S.; Thanopoulos, C. Fruit set in solanaceous vegetable crops as affected by floral and environmental factors. Eur. J. Plant Sci. Biotechnol. 2008, 2, 88–105. Available online: www.globalsciencebooks.info/Online/GSBOnline/images/0812/EJPSB_2(SI1)/EJPSB_2(SI1)88-105o.pdf (accessed on 1 January 2021).
- McKay, K.; Schatz, B.G.; Endres, G. Field Pea Production; North Dakota State University: Fargo, ND, USA, 2003; Available online: http://agresearch.montana.edu/wtarc/producerinfo/agronomy-nutrient-management/Pulses/NDSUFactSheet.pdf (accessed on 1 January 2021).
- Olsen, J.; Mehlenbacher, S.; Azarenko, A. Hazelnut pollination. HortTechnology 2000, 10, 113–115. [Google Scholar] [CrossRef] [Green Version]
- Hatjina, F. The pollination of kiwi fruit. Agric. Crop Anim. Husb. J. 1998, 3, 21–24. [Google Scholar]
- Sáez, A.; Negri, P.; Viel, M.; Aizen, M.A. Pollination efficiency of artificial and bee pollination practices in kiwifruit. Sci. Hortic. 2019, 246, 1017–1021. [Google Scholar] [CrossRef]
- Ribeiro, M.D.F.; da Silva, E.M.S.; Lima Júnior, I.D.O.; Kiill, L.H.P. Honey bees (Apis mellifera) visiting flowers of yellow melon (Cucumis melo) using different number of hives. Ciênc. Rural 2015, 45, 1768–1773. [Google Scholar] [CrossRef] [Green Version]
- Hamon, S.; Koechlin, J. The reproductive biology of okra. 2. Self-fertilization kinetics in the cultivated okra (Abelmoschus esculentus), and consequences for breeding. Euphytica 1991, 53, 49–55. [Google Scholar] [CrossRef]
- Nyéki, J.; Szabó, Z.; Benedek, P.; Szalayw, L. Nectar Production, Honeybee Visitation and Fruit Set of Peach Flowers; International Society for Horticultural Science (ISHS): Leuven, Belgium, 2002; pp. 537–541. [Google Scholar] [CrossRef]
- Vasilakakis, M. General and Specialized Pomology Cultivation, 2nd ed.; Gartaganis Publications: Thessaloniki, Greece, 2004; pp. 313–399. ISBN 960-7013-27-1. [Google Scholar]
- Zhang, H.; Huang, J.; Williams, P.H.; Vaissière, B.E.; Zhou, Z.; Gai, Q.; Dong, J.; An, J. Managed bumblebees outperform honeybees in increasing peach fruit set in China: Different limiting processes with different pollinators. PLoS ONE 2015, 10, e0121143. [Google Scholar] [CrossRef] [Green Version]
- Calzoni, G.L.; Speranza, A. Pear and Plum pollination: Honeybees, Bumblebees or both? Acta Hortic. 1996, 423, 83–90. [Google Scholar] [CrossRef]
- Keogh, C.R.; Robinson, P.W.A.; Mullins, J.I. Pollination Aware, the Real Value of Pollination in Australia, Appendix 1, Pollination Aware Case Study: Pear and Nashi; Rural Industries Research and Development Corporation: Kingston, Australia, 2010; ISBN 978-1-74254-103-7. Available online: https://agrifutures.com.au/wp-content/uploads/publications/10-133.pdf (accessed on 1 January 2021).
- Pastopoulos, S.; Kazantzis, K.; Marnasidis, S. The cultivation of persimmons in the Giannitsa region. Agric. Crop Anim. Husb. J. 2017, 10, 41–47. Available online: https://pomologyinstitute.gr/rodia-kidonia-lotos/ (accessed on 2 January 2021).
- Nicodemo, D.; Couto, R.H.N.; Malheiros, E.B.; de Jong, D. Honey bee as an effective pollinating agent of pumpkin. Sci. Agric. 2009, 66, 476–480. [Google Scholar] [CrossRef] [Green Version]
- Benedek, P.; Szabó, T.; Nyéki, J. New results on the bee pollination of Quince. Acta Hortic. 2000, 561, 243–248. [Google Scholar] [CrossRef]
- Perrot, T.; Gaba, S.; Roncoroni, M.; Gautier, J.-L.; Bretagnolle, V. Bees increase oilseed rape yield under real field conditions. Agric. Ecosyst. Environ. 2018, 266, 39–48. [Google Scholar] [CrossRef]
- Hatjina, F.; Pollination of cultivated plants. National Hellenic Beekeeping Network. 2007. Available online: www.hellenic-beeresearch.gr/wp-content/uploads/2015/01/POLLINATION_EPIKONIASI-II-2007.pdf (accessed on 1 January 2021).
- Kamel, S.M.; Blal, A.H.; Mahfouz, H.M.; Said, M. The most common insect pollinator species on sesame crop (Sesamum indicum L.) in Ismailia Governorate, Egypt. Arthropods 2013, 2, 66–74. Available online: www.iaees.org/publications/journals/arthropods/articles/2013-2(2)/most-common-insect-pollinator-species-on-sesame-crop.pdf (accessed on 1 January 2021).
- Keogh, C.R.; Robinson, P.W.A.; Mullins, J.I. Pollination Aware, the Real Value of Pollination in Australia, Appendix 1, Pollination Aware Case Study: Soybean; Rural Industries Research and Development Corporation: Kingston, Australia, 2010; ISBN 978-1-74254-108-2. Available online: https://www.agrifutures.com.au/wp-content/uploads/publications/10-138.pdf (accessed on 1 January 2021).
- Bänsch, S.; Tscharntke, T.; Ratnieks, F.L.; Härtel, S.; Westphal, C. Foraging of honey bees in agricultural landscapes with changing patterns of flower resources. Agric. Ecosyst. Environ. 2020, 291, 106792. [Google Scholar] [CrossRef]
- Klatt, B.K.; Holzschuh, A.; Westphal, C.; Clough, Y.; Smit, I.; Pawelzik, E.; Tscharntke, T. Bee pollination improves crop quality, shelf life and commercial value. Proc. R. Soc. B Biol. Sci. 2014, 281, 20132440. [Google Scholar] [CrossRef]
- Perrot, T.; Gaba, S.; Roncoroni, M.; Gautier, J.-L.; Saintilan, A.; Bretagnolle, V. Experimental quantification of insect pollination on sunflower yield, reconciling plant and field scale estimates. Basic Appl. Ecol. 2019, 34, 75–84. [Google Scholar] [CrossRef]
- Eeraerts, M.; Smagghe, G.; Meeus, I. Pollinator diversity, floral resources and semi-natural habitat, instead of honey bees and intensive agriculture, enhance pollination service to sweet cherry. Agric. Ecosyst. Environ. 2019, 284, 106586. [Google Scholar] [CrossRef]
- Eeraerts, M.; Smagghe, G.; Meeus, I. Bumble bee abundance and richness improves honey bee pollination behaviour in sweet cherry. Basic Appl. Ecol. 2020, 43, 27–33. [Google Scholar] [CrossRef]
- Eeraerts, M.; Vanderhaegen, R.; Smagghe, G.; Meeus, I. Pollination efficiency and foraging behaviour of honey bees and non-Apis bees to sweet cherry. Agric. For. Entomol. 2020, 22, 75–82. [Google Scholar] [CrossRef]
- Chatziharisis, J.; Kazantzis, K. Sweet Cherry and Its Cultivation, 1st ed.; Agrotypos SA: Athens, Greece, 2014; Volume 518, pp. 218–220. ISBN 978-960-7667-48-9. [Google Scholar]
- Holzschuh, A.; Dudenhöffer, J.-H.; Tscharntke, T. Landscapes with wild bee habitats enhance pollination, fruit set and yield of sweet cherry. Biol. Conserv. 2012, 153, 101–107. [Google Scholar] [CrossRef]
- Giovanetti, M.; Aronne, G. Honey bee interest in flowers with anemophilous characteristics: First notes on handling time and routine on Fraxinus ornus and Castanea sativa. Bull. Insectol. 2011, 64, 77–82. Available online: www.bulletinofinsectology.org/pdfarticles/vol64-2011-077-082giovanetti.pdf (accessed on 1 January 2021).
- Manino, A.; Patetta, A.; Marletto, F. Investigations on Chestnut Pollination. In Acta Horticulturae; International Society for Horticultural Science (ISHS): Leuven, Belgium, 1991; pp. 335–339. [Google Scholar] [CrossRef]
- Bashir, M.A.; Alvi, A.M.; Khan, K.A.; Rehmani, M.I.A.; Ansari, M.J.; Atta, S.; Ghramh, H.A.; Batool, T.; Tariq, M. Role of pollination in yield and physicochemical properties of tomatoes (Lycopersicon esculentum). Saudi J. Biol. Sci. 2018, 25, 1291–1297. [Google Scholar] [CrossRef]
- Sanford, M.T.; Ellis, J. Beekeeping: Watermelon Pollination; U.S. Department of Agriculture, UF/IFAS Extension Service, University of Florida: Gainesville, FL, USA, 2019; Available online: http://edis.ifas.ufl.edu/pdffiles/AA/AA09100.pdf (accessed on 2 January 2021).
- Taha, E.-K.A.; Bayoumi, Y.A. The value of honey bees (Apis mellifera, L.) as pollinators of summer seed watermelon (Citrullus lanatus colothynthoides L.) in Egypt. Acta Biol. Szeged. 2009, 53, 33–37. Available online: http://abs.bibl.u-szeged.hu/index.php/abs/article/view/2665/2657 (accessed on 2 January 2021).
- Gallai, N.; Vaissière, B. Guidelines for the Economic Valuation of Pollination Services at a National Scale; Food and Agriculture Organization of the United Nations: Rome, Italy, 2009; Available online: www.fao.org/3/a-at523e.pdf (accessed on 1 January 2021).
- Abou-Shaara, H.F.; Al-Ghamdi, A.A.; Mohamed, A.A. Suitability map for keeping honey bees under harsh environmental conditions using geographical information system. World Appl. Sci. J. 2013, 22, 1099–1105. [Google Scholar] [CrossRef]
- Palo, T.; Lagercrantz, K.; Bramryd, T.; Johansson, M.; Beery, T.; Jönsson, K.; Wamsler, C.; Brink, E.; Schubert, P.; Ekelund, N. Priority areas in municipality planning: Ecosystem services, environmental impact assessments and research areas. One Ecosyst. 2016, 1, e9869. [Google Scholar] [CrossRef] [Green Version]
- Liakos, V. National design forest policy for beekeeping. Beekeep. Insp. J. 2016, 246, 93. Available online: www.melissokomikiepitheorisi.gr/wp-content/uploads/2017/03/ME_MarApr2016_ForNet.pdf (accessed on 1 January 2021).
- European Parliament. European Parliament Resolution of 18 December 2019 on the EU Pollinators Initiative (2019/2803(RSP). Available online: https://www.europarl.europa.eu/doceo/document/TA-9-2019-0104_EN.pdf (accessed on 1 January 2021).
- Leventon, J.; Schaal, T.; Velten, S.; Dänhardt, J.; Fischer, J.; Abson, J.D.; Newig, J. Collaboration or fragmentation? Biodiversity management through the common agricultural policy. Land Use Policy 2017, 64, 1–12. [Google Scholar] [CrossRef]
- Agriculture Victoria. Public Land Apiary (Bee) Sites. Available online: https://agriculture.vic.gov.au/livestock-and-animals/honey-bees/compliance/public-land-apiary-bee-sites (accessed on 2 January 2021).
- Melathopoulos, A.P.; Cutler, G.C.; Tyedmers, P. Where is the value in valuing pollination ecosystem services to agriculture? Ecol. Econ. 2015, 109, 59–70. [Google Scholar] [CrossRef]


| Criterion | Unit |
| Agricultural areas | Crop species. Cultivated forest species (Robinia pseudoacacia, Paulownia tomentosa, and Castanea sativa). |
| Natural grasslands | Deciduous shrubs (sparse or dense Paliurus spina christi and Quercus coccifera clusters located in grassland and pasture areas) combined with melliferous flora such as Asphodelus ramosus, Trifolium repens, Cistus incanus, etc. |
| Forest areas | Oak, chestnut forests, and Pinus brutia saplings. |
| Analysis of covered area in terms of agricultural plant species and forest species | Land cover (ha). |
| Attractiveness to honeybees | Pollen supply (values range from 0 to 2). |
| Nectar supply (values range from 0 to 2). | |
| Honeybee pollination dependence | Honeybee dependence (values range from 0 to 1). |
| Crop | Mean Dependence Ratio (D) 1 | Potential Proportion of Honeybees into Pollination Process (PHB) 2 | References/Notes |
|---|---|---|---|
| Alfalfa (Medicago sativa) | 0 | 0 | [32] |
| Almonds (Prunus dulcis, Prunus amygdalus, and Amygdalus communis) | 0.65 | 0.7 | [28,33,34,35] |
| Apples (Malus domestica) | 0.65 | 0.7 | [34,36,37,38] |
| Apricots (Prunus armeniaca) | 0.65 | 0.7 | [34,35,39] |
| Barley (Hordeum vulgare L.) | 0 | 0 | [26,40] |
| Beans (Phaseolus spp.) | 0.05 | 0 | [26,41,42] |
| Chick peas (Cicer arietinum) | 0 | 0 | [26] |
| Common wheat (Triticum aestivum) | 0 | 0 | [40] |
| Corn (Zea mays) | 0 | 0 | [26] |
| Cotton (Gossypium hirsutum, G. barbadense, G. arboreum, and G. herbaceum) | 0.25 | 0 | [34] |
| Cucumbers and Gherkins (Cucumis sativus) | 0.65 | 0.9 | [34,43] |
| Durum Wheat (Triticum durum) | 0 | 0 | [40] |
| Eggplants (Solanum melongena) | 0.25 | 0.5 | [44] |
| Garden pea and field pea (Pisum sativum and P. arvense) | 0 | 0 | [45] |
| Grapes (Vitis vinifera) | 0 | 0 | [26,42] |
| Hazelnuts (Corylus avellana L.) | 0 | 0 | [42,46] |
| Kiwifruit (Actinidia deliciosa) | 0.95 | 0.7 | [34,47,48] |
| Lentils (Lens esculenta and Lens culinaris) | 0 | 0 | [42] |
| Melon seed (Cucumis melo) | 0.95 | 0.5 | [49] |
| Oat (Avena sativa) | 0 | 0 | [40] |
| Okra (Abelmoschus esculentus) | 0.25 | 0 (*NA) | [50] |
| Olive (Olea europaea) | 0 | 0 | [42] |
| Peaches and nectarines (Prunus persica and Persica laevis) | 0.65 | 0.5 | [34,51,52,53] |
| Pears (Pyrus communis) | 0.65 | 0.7 | [34,42,52,54,55] |
| Persimmons (Diospyros kaki; D. virginiana) | 0.05 | 0 | [56] |
| Plums (Prunus domestica and P. spinosa) | 0.65 | 0.7 | [34,35,54] |
| Pumpkin, squash, and gourds, (Cucurbita maxima, C. mixta, C. moschata, C. pepo) | 0.95 | 0.7 | [34,57] |
| Quinces | 0.65 | 0.7 | [58] |
| Rapeseed including canola (Brassica napus) | 0.25 | 0.5 | [59] |
| Chilies and peppers (Capsicum annuum) | 0.05 | 0 | [26,44,60] |
| Rye (Secale cereale) | 0 | 0 | [26,40] |
| Sesame (Sesamum indicum) | 0.25 | 0.7 | [61] |
| Soybeans (Glycine max and G. soja) | 0.25 | 0.7 | [62] |
| Spinach (Spinacia oleracea) | 0 | 0 | ** |
| Strawberries (Fragaria spp.) | 0.25 | 0.5 | [63,64] |
| Sunflower (Helianthus annuus) | 0.25 | 0.7 | [65] |
| Sweet cherries (Prunus avium) | 0.65 | 0.5 | [66,67,68,69,70] |
| Sweet chestnuts (Castanea sativa) | 0.25 | 0.2 | [34,71,72] |
| Tomatoes (Lycopersicon esculentum) | 0.05 | 0 | [73] |
| Walnut and English walnut (Juglans regia) | 0 | 0 | [26] |
| Watermelons | 0.95 | 0.5 | [74,75] |
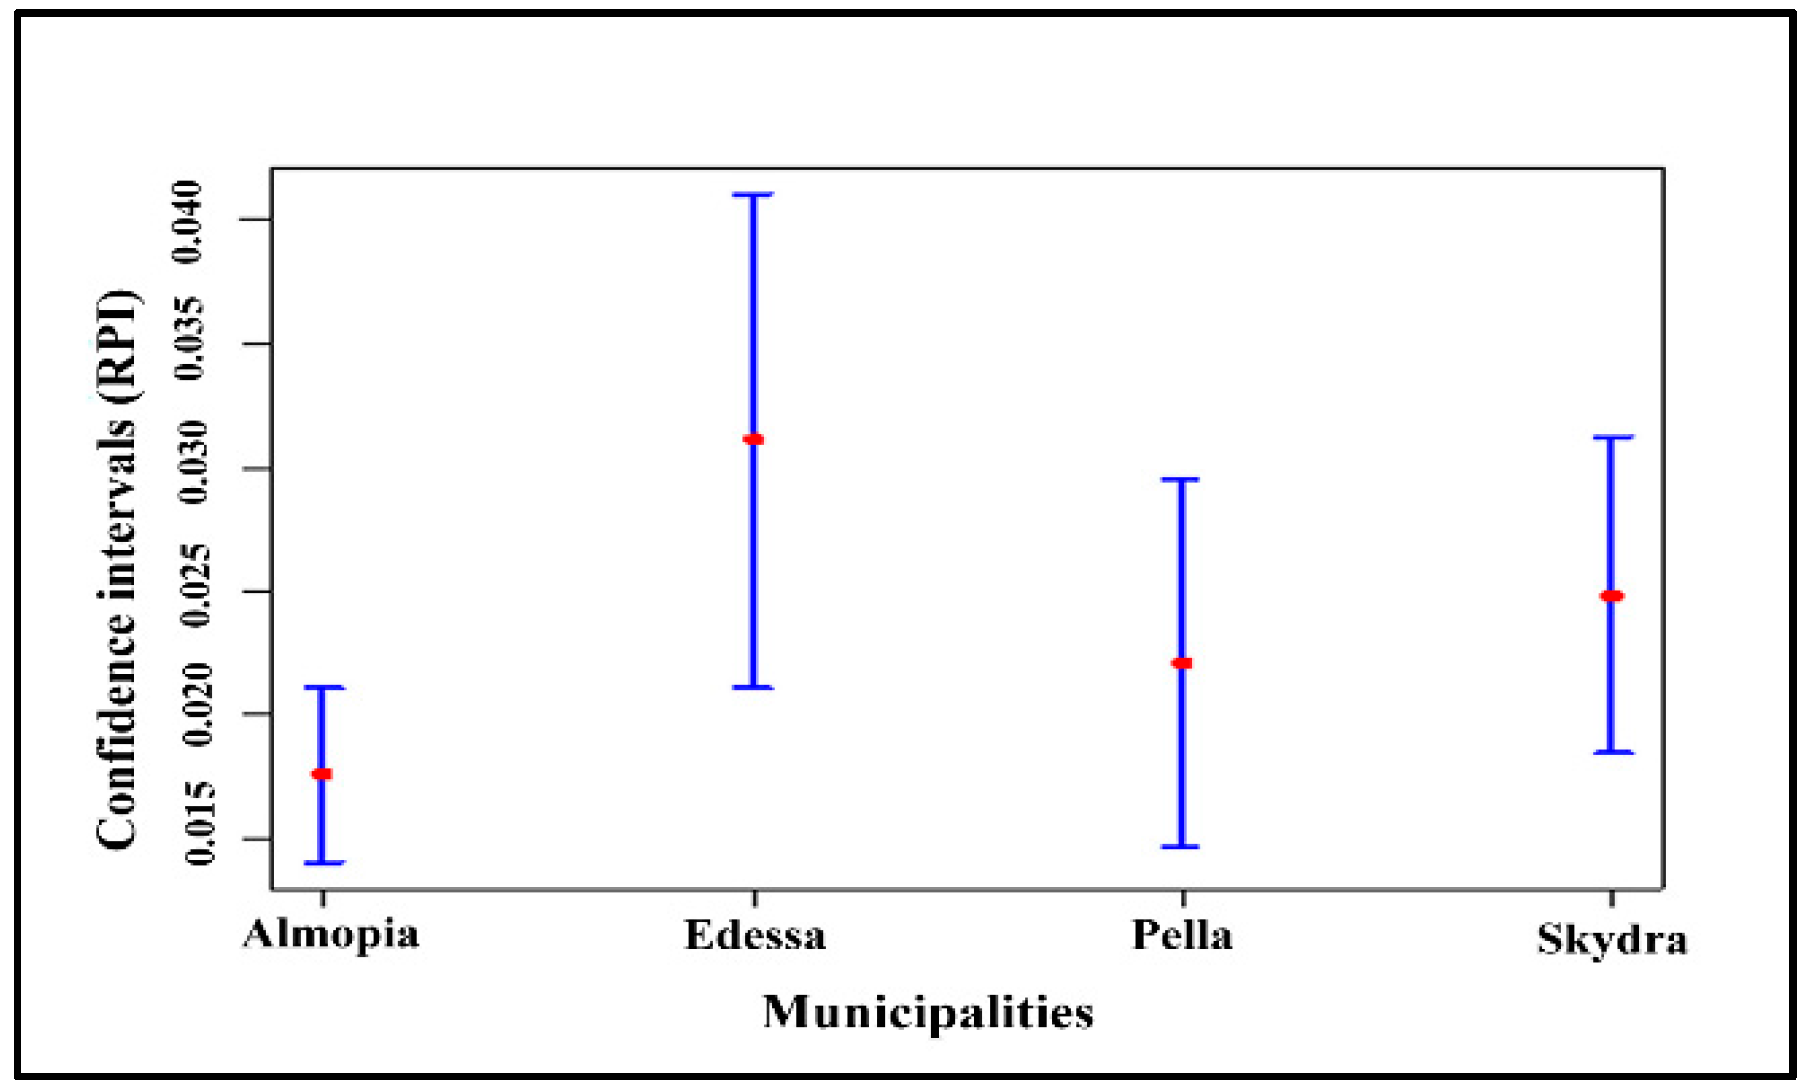
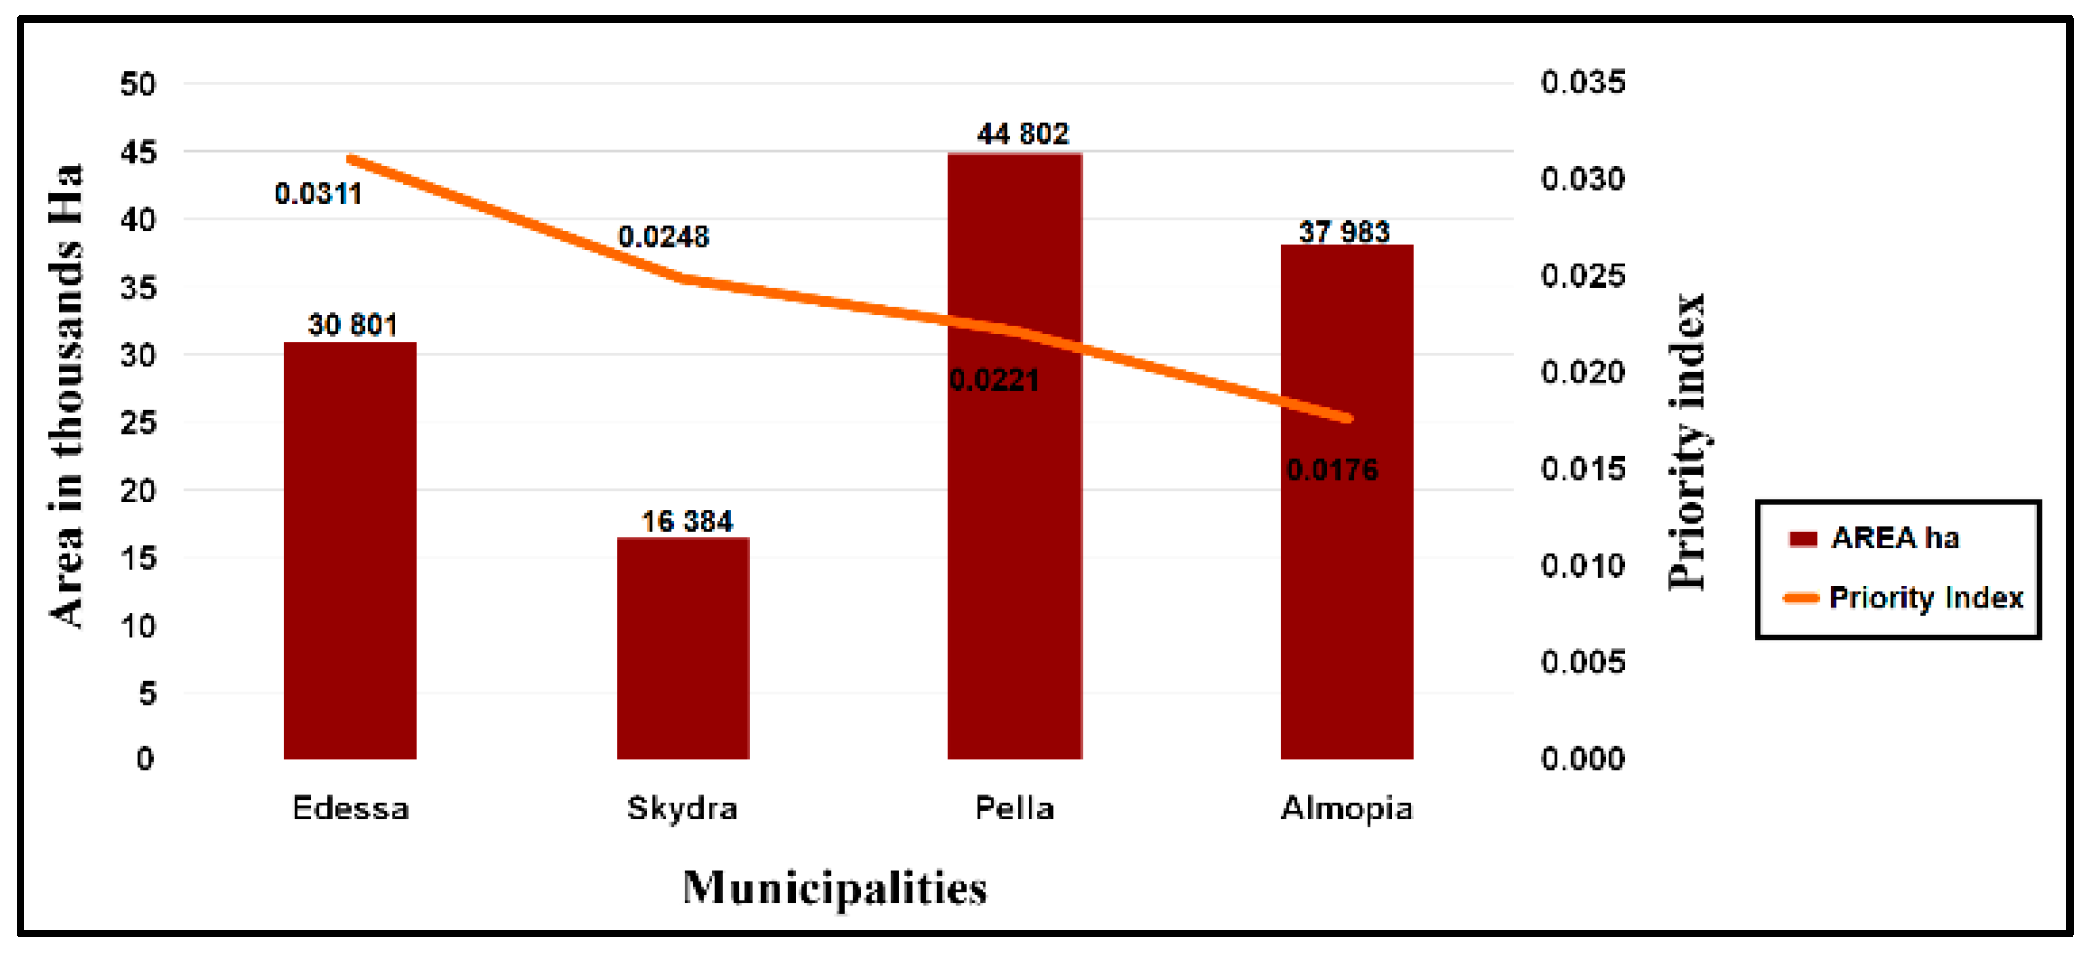
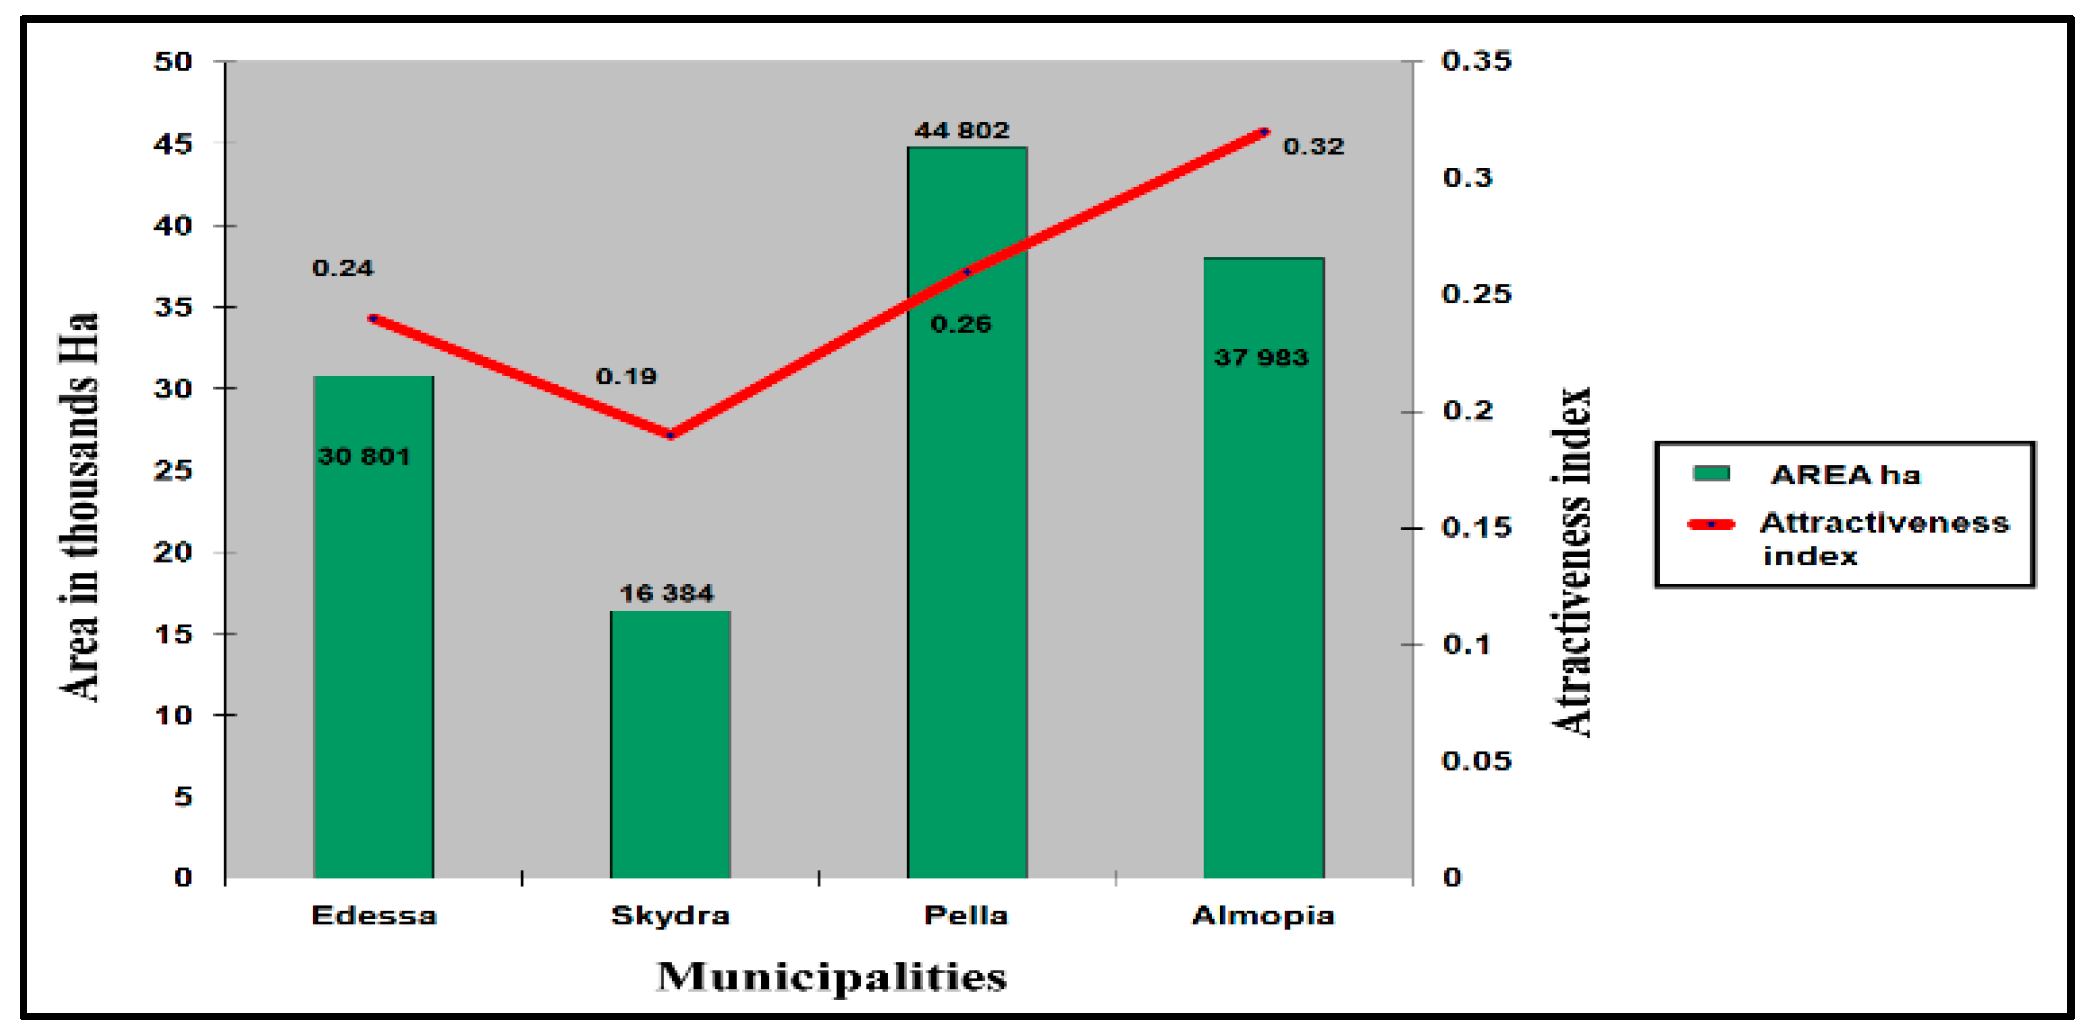
| Municipality | RPIA | RAIT | RDIT |
|---|---|---|---|
| Edessa | 0.0311 | 0.24 | 0.22 |
| Skydra | 0.0248 | 0.19 | 0.21 |
| Pella | 0.0221 | 0.26 | 0.36 |
| Almopia | 0.0176 | 0.32 | 0.21 |
Publisher’s Note: MDPI stays neutral with regard to jurisdictional claims in published maps and institutional affiliations. |
© 2021 by the authors. Licensee MDPI, Basel, Switzerland. This article is an open access article distributed under the terms and conditions of the Creative Commons Attribution (CC BY) license (http://creativecommons.org/licenses/by/4.0/).
Share and Cite
Marnasidis, S.; Kantartzis, A.; Malesios, C.; Hatjina, F.; Arabatzis, G.; Verikouki, E. Mapping Priority Areas for Apiculture Development with the Use of Geographical Information Systems. Agriculture 2021, 11, 182. https://0-doi-org.brum.beds.ac.uk/10.3390/agriculture11020182
Marnasidis S, Kantartzis A, Malesios C, Hatjina F, Arabatzis G, Verikouki E. Mapping Priority Areas for Apiculture Development with the Use of Geographical Information Systems. Agriculture. 2021; 11(2):182. https://0-doi-org.brum.beds.ac.uk/10.3390/agriculture11020182
Chicago/Turabian StyleMarnasidis, Simeon, Apostolos Kantartzis, Chrisovalantis Malesios, Fani Hatjina, Garyfallos Arabatzis, and Efstathia Verikouki. 2021. "Mapping Priority Areas for Apiculture Development with the Use of Geographical Information Systems" Agriculture 11, no. 2: 182. https://0-doi-org.brum.beds.ac.uk/10.3390/agriculture11020182