
The Potential for Innovative and Smart Rural Development in the Peripheral Regions of Eastern Poland


Faculty of Economic Sciences, Pope John Paul II State School of Higher Education, Sidorska 95/97, 21–500 Biała Podlaska, Poland
Agriculture 2021, 11(3), 188; https://0-doi-org.brum.beds.ac.uk/10.3390/agriculture11030188
Submission received: 12 January 2021
/
Revised: 18 February 2021
/
Accepted: 19 February 2021
/
Published: 25 February 2021
(This article belongs to the Special Issue Contemporary Challenges of Agriculture and Rural Areas in the Context of Sustainable Development)
Abstract
:Peripheral regions exist in most European countries, and in the countries of the European Union they have been supported for many years by the Community’s Cohesion Policy, which aims at reducing development disparities between the Member States and regions within individual countries. In Poland, five out of sixteen voivodeships in the country are considered to be peripheral regions. They are located on Poland’s eastern border, which is also the eastern border of the European Union. Support programmes for these regions have attained the status of separate operational programmes, focusing on generating convergence effects, which can be achieved by increasing the level of innovation and implementing intelligent ways of operating the economy. The aim of this paper is to demonstrate the essence of peripherality and the innovative-development potential of peripheral regions in Poland, as well as the potential of smart rural development. The paper is based on an analysis of research results drawn from the literature on the subject, as well as from official information and statistics. Own research on the smart village concept in three regions of Eastern Poland was also used. This research showed a reduction in disproportions in the development of regions in Poland, and a link between the level of innovation and the economic growth of the regions, which occurred with a certain lag in relation to the transfer of innovation.
1. Introduction
The socio-economic development of a country is not uniform throughout its territory. Individual parts and regions differ in terms of their location, geographical and natural conditions, the state of their economic development, and the way in which the community of the area is organised and operates, etc., [1,2]. Extreme differences in the development of regions can delay the overall development of a country, and justify a regional policy that eliminates disproportionate development differences, or prevents their further deepening. Such a policy has been independently pursued in Europe by some countries, but a regional policy has been particularly developed as part of European integration. Some Member States of the European Union have overseas and geographically remote territories requiring special treatment in any integration processes. The regional-development policy for the European Union’s core territory has introduced, on a convergence basis, a policy for supporting the development of less-developed countries from Community funds, and, within individual countries, an inter- and intra-regional development policy supported by European and national funds [3,4,5].
In the polarised sphere of individual countries, support has been given to regions whose development is lagging behind, and which often also have a peripheral location. Peripherality has been the subject of the analysis by economists and geographers with an interest in the regional disparities and the location of the economic activity [6,7,8,9]. In the present era of globalisation and economic integration, debates focus on the geographic distribution of the economic activity [10], on the methods of strengthening the economic and social cohesion [11], as well as on the enhancing potentiality of development through the new opportunities created by innovations, new smart digital technologies and institutional changes [12,13]. The peripheral regions are characterised by the outflow of resources, a narrow sectoral structure and price-taking firms in a dependent relationship with external customers [11]. However, some peripheral areas have advantages both in terms of natural resources and also in their capacity to attract some people and develop new possibilities for producing specific goods, e.g., bioenergy and services, e.g., tourism. These regions, which are commonly border regions, are generally located in geographically and spatially disadvantaged areas, often distant from major economic centres and large urban agglomerations, and have difficult transport accessibility and considerable transport costs due to the underdevelopment of their technical infrastructure [14]. These regions are characterised by low socio-economic development indicators and poor development prospects. Stagnation or low growth rates lead to unfavourable demographic and social phenomena, which ultimately result in the depopulation of these areas. Such regions are also defined as problematic, marginal, depressive or underdeveloped [6,8,15]. In Poland, such regions include four voivodeships located at the eastern and northern land border of Poland (Warmińsko-Mazurskie, Podlaskie, Lubelskie, and Podkarpackie) and one, the Świętokrzyskie Voivodeship, located on the left bank of the Vistula, but similar in its development level and nature to the other four. At the time of Poland’s accession to the European Union, the level of GDP per capita generated in these regions was about 30% of the EU average. After Poland’s accession to the European Union, these regions, grouped in a macro-region called Eastern Poland, received significant financial support for development purposes in the funding programme called The Development of Eastern Poland for 2007–2013. In the years 2014–2020, this programme was continued under the name “Eastern Poland”. Several publications describe in detail the situation of the regions in Eastern Poland [16,17,18,19].
The support provided to the eastern peripheral regions in Poland was directed mainly towards the use of so-called “smart” instruments in urban centres and transport infrastructures. However, the economic structure of these regions was dominated by primary sectors, especially agriculture, which benefitted from standard support under the Common Agricultural Policy. The predominantly rural nature of these areas also illustrated the need to activate the development of these regions’ rural areas. Rural-development programmes financed under the second pillar of the Common Agricultural Policy were also an important source of external support for the development of these areas, which was carried out in accordance with the principles of sustainable development. An opportunity for the faster sustainable development of rural areas may be found in strengthening overall innovation and the innovative potential of the region and in the implementation of the concept of “smart specialisation” or “smart village” in rural areas. These concepts have been the focus of the researchers’ attention for several years and have brought to light a great number of publications in different countries. This work refers to the selection of these publications [20,21,22,23,24,25,26,27,28,29,30].
In the paper, research was undertaken into the innovativeness of regions, and into the innovative development potential of peripheral regions in Poland, as well as smart rural development, and its structure within regional arrangements, especially peripheral regions. With such a research objective, a theoretical framework is required for the very essence of peripherality, its conditions, factors, and ways of overcoming it, the definition of regions’ development potential, the essence and ways of perceiving regional innovation, and smart concepts for launching and implementing rural-development processes in peripheral regions. The peripherality and innovation of the regions are presented on the basis of statistics and literature on the subject. Three groups of literature sources create the research materials of the study. Firstly, the publications that constitute a general theoretical base for peripherality and development of peripheral areas. The second basic sources are common research works conducted at the Pope John Paul II State School of Higher Education in Biała Podlaska and published jointly by the author with Magdalena Zwolińska-Ligaj and Danuta Guzal-Dec [20,21,25,31,32]. These publications include the main concepts and empirical evidence. The third group of research material constitutes the empirical models and empirical analysis related to the regional development in Poland, published in different scientific journals [30,33,34,35,36]. Detailed research on smart-village development within the local territorial unit arrangements of Eastern Poland was carried out in 30 communes in three voivodeships of Eastern Poland (Lubelskie, Podkarpackie, and Warmińsko-Mazurskie), each representing half of the communes with the highest and lowest potential for smart development. The obtained results were assessed especially in terms of the mutual interaction of the potential for smart rural development, and the achieved dynamics of the social and economic development of the regions. The author of this paper appreciates the possibility to use all above mentioned scientific works and thanks all authors for their contribution in writing this broad summary.
Using the literature on the subject and the results of various research projects on regional development in Poland and rural development in the regions of Eastern Poland, an attempt was made in this paper to:
- define the essence of peripherality in regional development;
- identify the innovative-development potential of Polish regions, including peripheral regions;
- assess the potential for smart rural development in peripheral regions;
- define the role of European funds in achieving convergence in the regional development of Poland.
2. The Peripherality of Regions
Peripherality in the general sense can be defined as a state of a territory’s lagging behind more developed regions—central areas, in a negative sense, something different from the centres. This term was popularised in the literature in the 1960s with the spread of John Friedmann’s theory of polarised development [16]. Currently, it is an important research issue in many countries and the subject of interest of development policies in Poland and other European Union countries. One of the main areas of interest includes the search for a source to mobilise activity and development. Some focus on the use by regions of their internal (endogenous) development potential, others on the possibilities and ways of using external (exogenous) sources of development, especially through the inflow of innovation and various forms of capital, and the use of modern information and communication technologies. The concept of peripherality is therefore diverse and multidimensional. In traditional terms, the characteristic defining the peripherality of an area was its specific geographical location, which had a decisive impact on the limited possibilities for further development [20]. Nowadays, in the era of globalisation, the importance of the spatial-location factor has diminished, and the non-geographical aspects of peripherality are becoming increasingly important. The industrial, transport, telecommunications, and IT revolutions have meant that physical distance has ceased to be a significant barrier to transactions, and to the movement of factors of production and goods, as before [37], and the changes in the perception of space, involving the perception of its immanent characteristics which distinguish it as a territory, have made it possible to use some of them as endogenous development factors.
Peripherality in the geographical and spatial sense always involves a relative reference to something else, another point in space, another geographical area, or another centre of concentration of economic and social life, centre, or core of development. The concept of core and periphery is the result of the combined impact on a given space of agglomeration trends, the spatial specificity of innovation processes, the process of the spatial dispersion of production, and the repetitive reactions of these forces to the geography of institutional capacity [20]. As a result, economic growth drivers reveal tendencies to agglomerate, concentrating growth in core regions, while peripheral areas exhibit developmental problems, the causes of which are endogenous, and are associated with the inability to generate agglomeration effects, as well as with the limitations to institutional capacity [4]. Areas located in the centres show a higher rate of innovation activity compared to peripheral districts, which are characterised by limitations in the capacity to invest in R&D, social conditions unfavourable to innovation, and less exposure to the innovation generated outside the peripheral region [5,38,39].
Geographical and spatial peripherality is always accompanied by economic, socio-demographic, and cultural, as well as political and administrative, peripherality. In general, the geographical peripherality of regions is correlated with socio-economic weaknesses. Eight rates characterising peripheral regions have been adopted in the European Union [9,15]. These are (1) the regional-accessibility rate, (2) population density ≤25 per km2, (3) GDP per capita in PPS ≤ 75% of the EU average, (4) the low disposable income of households, (5) the unemployment rate ≥10%, (6) employment in the primary sector ≥10%, (7) R&D spending ≤0.5% of GDP, and (8) poor Internet use ≤60%. Using these rates, the European Union Member States were divided into four groups: (a) countries not affected by the consequences of peripherality (Denmark, the Netherlands, Luxembourg); (b) countries with relatively high rates in only 1–2 aspects, e.g., in unemployment (Belgium, Germany, France), accessibility and population density (Sweden), employment in the primary sector (Austria), the low disposable income of households (Slovenia), low R&D expenditure (UK), and poor Internet use (Malta); (c) countries with relatively high values for 3–5 rates (the Czech Republic and most other Western European countries), and (d) other Central and Eastern European countries and Portugal, where most of these rates apply. Geographical peripherality applies particularly to countries such as Lithuania, Romania, Bulgaria, Latvia, Poland, Hungary, Portugal, and Slovakia. Not all national regional policies give priority to the problem of peripheral regions. Special importance has been attached to the development of peripheral regions in Poland and Finland. Sweden, Austria, France and Germany create a group of countries where peripheral regions are important but are not treated with special attention. In other countries (Italy, UK), problems of peripheral regions are important only in some specific areas [9,15].
The diversity of the level of the social and economic development of Polish regions has been addressed by many authors, including S. Korenik [40], A. Malina [33], D. Strahl [41], A. Szewczuk [42], D. Michoń [43] and others. The research was based on various investigative methods, e.g., descriptive, comparative and taxonomic. The key issue in this research is always selecting the appropriate variables (rates) to describe socio-economic development, and then carrying out a proper analysis aimed at comparing and classifying the regions in terms of the adopted features describing the research problem [33]. The analysis takes into account the various features which characterise development, or its specific aspects. These features are intended to characterise the level of production and the effects of management, the level of income, provision of infrastructure, the development of economic sectors—educational, health, cultural and other services. The main tool for comparing the level of development of regions is to construct, on the basis of a selected set of diagnostic variables, a single synthetic indicator, the aggregated value of which makes it possible to order and establish a ranking of the examined units and facilitate their comparative assessment in multidimensional spaces. The construction of a synthetic indicator involves making a number of decisions, often subjective, related to the determination of the nature of the measure, the selection of diagnostic variables, the method of data standardisation, or the criteria of unit classification. Apart from comparative methods based on the synthetic indicator of development, taxonomic analysis methods are also used, facilitating the classification of regions, analysed using specific sets of variables, into typological groups (sets) created on the basis of similarity in terms of the level of development or changes taking place over the period under assessment.
Socio-economic development in regions depends on a broad spectrum of conditions and factors, as well as on facts and processes. There is a direct link between innovativeness and the level of socio-economic development of the region. The complexity of the socio-economic development process means that there is no single, recognised, universal, method of measuring the level of this development. Measurement methods are generally designed to fit the purpose and scope of studies. One example of a study in which a uniform method was used to examine the level of development of regions in the three years: 2005, 2010 and 2017 was that carried out by A. Malina [33] on the basis of data from the Statistics Poland’s Local Data Bank, published in 2018. Initially, 29 potential diagnostic variables, representing eight categories, were used to construct a synthetic indicator. After the verification of the variables, the studies were finally carried out using only 8 diagnostic features, comprising 6 stimulants and 2 destimulants (Table 1). These variables influence first of all the level of living in the regions, however, they are linked and interrelated with the level of innovativeness.
The final set of variables analysed for all regions in Poland with the use of the Hellwig method [44] enabled a list of regions to be created and grouped according to the synthetic measure of development. In Table 2, all regions were classified into four groups in three analysed years. Regions of Eastern Poland were located mostly in groups III and IV, which illustrate their low level of development compare to other regions and prove their peripheral position in Poland. We can observe, however, an interesting flow of eastern regions between different groups between 2005 and 2017 (Table 2).
Supporting the development of peripheral regions is a matter of interest for the Cohesion Policy of the European Union and the regional policies of individual Member States. Economic peripherality according to the Cohesion Policy in the European Union is determined by the level of economic development measured in terms of GDP per capita. The areas of economic peripherality include those regions at the NUTS (NUTS—Nomenclature of Territorial Units for Statistics is a classification used by EUROSTAT in the European Union. NUTS 2016 classification, valid from January 2018, lists 104 regions at NUTS 1, 281 regions at NUTS 2 and 1348 regions at NUTS 3 level. Since January 2021, the number of regions at NUTS 2 level has increased to 283. These are basic regions for the application of regional policies in the EU countries) 2 level, in which GDP per capita does not exceed 75% of the EU average. In these regions, so-called “convergence” objectives, i.e., the attempt to catch up with the more developed regions, are being pursued. In the years 2007–2013, the convergence regions included all the countries of Central and Eastern Europe which became members in 2004 and 2007, as well as some regions of Greece, Portugal, Spain, the UK, France, southern Italy, and eastern Germany. Regions with a GDP level of more than 75% of the EU average pursued policies aimed at “competitiveness and employment”. The scope and type of aid provided to these regions depended on the level of GDP and decreased as the level of GDP increased. For the implementation of the convergence principle in the period 2007–2013, 81.5% of all funds available for the Cohesion Policy were used, and 16% of these funds were deployed for the purpose of strengthening competitiveness and employment. Approximately 2.5% of the available funds were allocated to “European territorial cooperation”. The biggest beneficiary of the Cohesion Policy in this period was Poland, which received EUR 67.2 billion [45,46].
3. The Innovative Potential of Regions
The innovative potential may be defined as the ability of a region to create, absorb and disseminate innovations. This potential is difficult to define and to measure precisely. This difficulty is linked with the complexity of terms: innovation and innovativeness. The last categories are closely interrelated with the level of socio-economic development of regions.
Innovation is generally considered to be the introduction of new products, processes, and organisational solutions, and ways of linking to the market by enterprises, as well as institutional and social changes in economic sectors and territorial arrangements (national, regional and local). According to the comprehensive definition proposed by J. Baruk [47], innovation is a deliberate human-originated change involving products, manufacturing methods, new work and production organisation and management methods, applied for the first time in a given entity or community to achieve specific socio-economic benefits, and meet specific technical, economic, and social criteria. It may be considered beneficial if it does not contravene accepted standards and environmental-management principles.
The concept of innovativeness, associated with innovation, can be applied to individuals, organisational units (enterprises), local and regional communities, or even the whole of society, the national economy, or the national territory. Innovativeness entails the ability to introduce changes, to create, implement and absorb innovation, i.e., to effectively launch innovation processes. Changes can relate to the ways in which people act, economic and social structures, techniques, production technologies and processes, and the organisation and functioning of economic entities and local government organisations. Innovativeness can therefore also be applied to regions. The innovativeness of the economy can be defined as the motivation of the participants in economic processes to constantly search for new results, new concepts and ideas, to produce improved equipment, materials, and services directed to the market [48]. The innovativeness of a region is apparent primarily in the economic sphere, which means both the ability and motivation of economic entities to constantly seek and put into practice new knowledge, new ideas and concepts, and new means necessary for their application.
The innovative potential inherent in the economy can be strengthened or better utilised by creating a local or regional innovative environment. An environment becomes innovative when it uses unique local knowledge and skills, when it interacts with its surroundings, and when it is open to cooperation which facilitates mutual learning and the implementation of new solutions. The cooperation of entities alone is often insufficient for the region to absorb knowledge and generate innovation, so there is a need for cooperation between the public element (national or regional authorities), the scientific and research community, or specialised intermediary institutions involved in the transfer and absorption of innovation.
Building the innovative potential of the region enables and improves the course of innovation processes. Innovation processes include the development of scientific and technological knowledge and the transformation of knowledge into activities and products which meet market and consumer requirements. Innovation processes include all decisions, actions, and effects arising from the recognition of needs, or the identification of problems for which the manufacturer will be responsible, through the use of research, development, and the commercialisation of the innovation, and its dissemination and implementation by users to achieve the intended effects and benefits [49].
The region, through its specific resources, which include knowledge and other factors of production, learning ability, organisational culture, infrastructure, and many other unique characteristics, has innovative potential which affects the competitiveness of its enterprises and their innovative activity and performance [36,50]. This paper uses the results of research on the level of innovation of regions [36] and research describing the innovative environment in regions [34]. The research on the level of innovation of Polish regions for 2005 and 2008 was carried out using the Hellwig method [44], which is based on an abstract Po object, called a development pattern, to which data from individual regions are compared from four areas which characterise partial indicators of innovation output in the region: business activity, funding and support, human capital, and industrial property protection. The partial data made it possible to establish a hierarchy of regions according to a synthetic indicator of innovation output. In the study on the innovative environment of Polish regions, the authors [34] drew attention to two interrelated concepts—regional innovativeness and competitiveness. Regional competitiveness can be defined as a region’s sustainable capacity to ensure sustainable economic growth and development, including the ability to attract and use productive capital and implement innovation. The competitiveness of regions, which is a combination of natural and capital resources, manufacturing processes, and the internationalisation of economic activity, is often equated with regional innovativeness. Regional innovativeness can also be defined as the ability and motivation of the economy (enterprises) to continuously seek and put into practice scientific research and new concepts, ideas, and inventions [51].
Regional innovativeness can be strengthened by building an innovative environment. An innovative environment is defined as a set of territorially oriented factors in which interactions between economic entities, as a result of multilateral transactions, foster learning and innovation processes. As a result, they influence the emergence of externalities specific to innovation processes, allowing more and more excellent forms of collective learning and the management of the available resources [52]. In the study on the innovative environment conducted by J. Kot and E. Kraska [34], five categories of factors were distinguished: 1. innovative enterprises, 2. innovative and R&D activities of enterprises, 3. public-sector support, 4. human capital, and 5. intellectual property protection. Each category was assigned a 20% weight, and between 2 and 4 diagnostic variables were distinguished in individual categories (Table 3). To determine the quality of the innovative environment in the regions, a synthetic indicator and sub-indices in the selected categories are used.
The standardisation of the diagnostic variables adopted for the study made it possible to create a matrix of standardised variables, which was used to calculate sub-indices in five distinct categories which made up the synthetic indicator of innovative environment quality in the regions. Based on the value of that indicator, Polish regions were divided into four categories: (1) innovation leaders (an indicator value greater than 1.4 times the average for all regions), (2) moderate innovators (an indicator value less than 1.4 times the average for all regions, but higher or equal to the average), (3) catching-up regions with a moderate degree of innovation (an innovation indicator below the average for all regions), (4) modest innovators and regions with a low level of innovation (a synthetic indicator lower than half the average calculated for all regions). In order to determine the impact of the innovative environment on economic entities, the values of the synthetic indicator of innovative environment quality were linked in the subsequent stages of the study to entrepreneurship-development indicators and the level of GDP per capita [34]. Interesting results on the link between innovation growth and economic development were obtained by U. Wich in the studies of 16 Polish regions in 2013, using the taxonomic method [35]. The studies used 19 indicators (features), including 12 to determine the level of innovation of regions, and seven describing the level of economic development (Table 4).
The level of innovation of the regions was examined by means of two groups of indicators defining innovative capacity (5 indicators) and innovative position (7 indicators).
4. The Smart Village–the Concept of Strengthening the Innovative Rural Development of Peripheral Regions
The economies of peripheral regions are often dominated by primary sectors (agriculture, forestry, fisheries), and poorly urbanised space is agricultural in nature. Their development opportunities are largely linked to the activation and multifunctional development of rural areas. For the delimitation of rural areas, criteria are adopted which vary from country to country. In Poland, using the administrative criterion, all areas outside urban borders are included in rural areas. They currently account for 93% of the entire territory of Poland, but, due to the increase in the number of cities, they are gradually diminishing. In addition to the proper delimitation of rural areas, their great heterogeneity should be noted, which may cause difficulties for both the theory and practice of rural development. Rural areas include many different forms of the use of space: agricultural land, forest areas, water, communication areas, areas not used for economic purposes, valuable natural areas, rural settlements inhabited by farmers and non-agricultural residents, but also more and more often the buildings and facilities of public institutions, and industrial and service companies located there. These areas often include parts of small towns, especially those which are the seats of urban-rural communes [21]. Therefore, the nature and functions of rural areas are changing. The weakening of agricultural functions is being accompanied by the strengthening of new production, service, and consumption functions. The development of non-agricultural functions and the increase in agricultural productivity are changing the socio-professional structure of the rural population, and the way rural space is used. This space is becoming an asset that is increasingly being used by urban dwellers, entrepreneurs, and tourists. Rural space is thus becoming more of a public asset [20,22,53,54].
Interest in rural development in the European Union became more apparent from the MacSharry reform at the beginning of the 1990s; then it was reinforced by the reform caused by Agenda 2000, and strengthened by another, the so-called Luxembourg CAP reform of 2003. The new CAP, shaped in the first decade of the 21st century, covered Poland and all the other countries in the so-called fifth enlargement of the European Union, in 2004–2005. It paid attention not only to the development of sustainable agriculture and the production of high-quality food, but also to animal welfare and the preservation of the biological and cultural potential of the countryside, and other natural and material elements in the identity and material heritage of rural areas [21,31]. EU policy on rural areas implemented in the period 2007–2013 maintained the continuity of previously implemented programmes, and the 2014–2020 Rural Development Programme was integrated into the overall development-policy system outlined in the strategy entitled Europe 2020: A strategy for smart, sustainable and inclusive growth. The arrangements for the future in the UN document entitled Agenda 2030 point to recommended mechanisms that should be developed to ensure the sustainable development of rural areas at the international, national, regional, and local levels. This document, indicating the strong diversity of rural areas in the world, lists 17 general, sustainable development objectives for these districts, and 169 specific tasks which can be applied within the conditions of various countries and regions, which should make it possible to address contemporary challenges such as food security, poverty, climate change, environmental pollution, ensuring safety and social justice, and others [55].
Although the concept of sustainable development is widely accepted as the basis for rural development, its practical application is often postulative and encounters a number of difficulties and barriers [22,56]. New attempts at operationalisation, detailing, and full or partial implementation, are constantly appearing. Additionally, new, enriched theoretical concepts of sustainable and balanced rural development are emerging. One of these, called “the smart village”, which seems to be useful for peripheral regions, will be outlined.
The origins of smart development in relation to territorial unit arrangements can be found in various theories and concepts of socio-economic and territorial development, including theories of clusters and local production systems, territorial competitiveness, the theory of the diffusion of innovation, and the innovative environment, building human and social capital, the theory of territorial rootedness, learning regions, and others [23,57]. These concepts were used to shape regional-development policies, especially those aimed at mobilising the endogenous development potential of regions, strengthening intra-regional cooperation, and local and regional innovation systems. Smart growth was one of the three priorities of the Europe 2020 strategy, which includes the pursuit of strengthening the economy based on knowledge and innovation through the shrewd use of education and digitisation. The European Commission and the Parliament have defined smart village development as a type of economic progress achieved through innovative, educational, and research activities in rural areas [58]. The model of smart development proposed for rural areas considers the countryside to be a separate sustainable space in terms of resources and market relations, which needs, through cooperation, to make up for the development gap between rural and urban areas. As part of the concept of smart village development, building territorial economic, social, environmental, and cultural capital should be important tasks [12].
There is a widespread belief that rural development should be implemented according to the principles of sustainable development. This concept, although outlined in theory, remains only a collection of hardly useful postulates and wishes when it comes to proceeding with its implementation [56]. Therefore, new approaches are constantly being sought, and new solutions are being proposed for the implementation of the sustainable development of villages or rural areas. One such proposal is the concept of smart growth and development, which is to be presented [21]. This concept reveals a desire to combine two development objectives—sustainability and the balance of development with competitiveness, mainly by activating cooperation and strengthening innovation [23]. The concept of smart villages relates to rural areas and rural communities which undertake the construction of development strategies based on the available resources and potentials, and the creation of new opportunities inherent in new information technologies, cooperation networks, and services supporting better use of knowledge and innovative solutions for residents, businesses, and local communities. The implementation of such a development concept might be essential for the development of peripheral regions where the development potential in rural areas is still untapped. This is crucial because these areas can receive significant support for the development and implementation of smart development strategies under Community programmes and policies: the Common Agricultural Policy, the Cohesion Policy, and the Rural Development Policy [24,58].
In order to make better use of the opportunities afforded by European rural-development policies in the regions of Eastern Poland, it is necessary to identify the potential for smart development which exists in these areas. The study of this potential was conducted at the Department of Economics and Management of the State School of Higher Education in Biała Podlaska [21,22,25,31]. The measurement of the potential for smart rural development in the regions of Eastern Poland was based on the original concept of synthetic indicators of the potential for smart rural development in the regions of Poland, developed as part of a collaboration of several authors. The studies were conducted at the regional and local levels, which made it possible to determine the internal diversity of regions and use it to form intra-regional policies. It was assumed that for the concept of smart development, both the material and technical elements of the infrastructure were important, especially the modern elements of IT infrastructure, enabling the creation of cooperation networks, as well as soft-infrastructure elements involving the spheres of education and healthcare, and facilitating the activity and participation of enterprises, local governments, and other forms of rural-community organisations. Based on the experience of the operationalisation of the smart city concept [23,26,59,60], six dimensions were identified: management, the quality of life, the economy, society, the environment, and mobility, which were assigned specific weights (10, 20 or 30), and for which a set of 24 indicators describing the specific nature of the area were adopted [20,25]. The set of areas, indicators and adopted weights are presented in Table 5.
The dimension of potential rural development to which the greatest importance was attached was the economy, for which a weight of 30 was set, and which was described using four indicators relating in particular to the labour market and non-agricultural activities. The social dimension, described using 6 indicators, was assigned a weight of 20, as was the mobility dimension, for which 4 indicators were adopted. The other three dimensions of a smart village were assigned a weight of 10% each, which was broken down into 3 or 4 indicators.
5. The Peripheral Regions of Eastern Poland
The border regions are usually defined as geographically and economically peripheral regions. Four peripheral voivodeships, at the eastern and north-eastern borders of the country, also assumed Community peripherality on the accession of Poland to the European Union (Figure 1). These four voivodeships: Warmińsko-Mazurskie, Podlaskie, Lubelskie, and Podkarpackie, including the Świętokrzyskie Voivodeship, located on the left bank of the Vistula River but having similar structural features, after Poland’s accession to the European Union, were included in the Joint Operational Programme (OP) The Development of Eastern Poland (DEP), financed from EU and national funds, which provided development support under the Cohesion Policy in the 2007–2013 financial framework. In the years 2014–2020, the support was continued under the OP Eastern Poland (EP). Work is currently underway to prepare another programme for the years 2021–2027.
These areas of Eastern Poland have become peripheral for a number of reasons, including the course of centuries-old historical processes, the cultural characteristics of communities, the specific and diverse conditions of the natural environment, and finally, as a result of the border location following the formation of new State borders after World War II. However, the regions of Eastern Poland vary in terms of natural conditions and socio-economic, spatial, and cultural features. They represent a whole range of landscapes, from the lakeland areas of the Warmińsko-Mazurskie Voivodeship, the poor, agroforestry environments of Podlasie, and the abundant and richly shaped areas of the agricultural environment of the Lublin region, to the rural areas of the Świętokrzyskie Mountains, varied in terms of landscape, culturally rich, but backward and fragmented, and the most peripheral, densely populated with industrial enclaves, sub-mountainous and mountainous region of Podkarpacie. The diversity of the socio-economic and spatial structure of the regions of Eastern Poland results to a large extent from their long-term functioning within the structures of the three partitioning States: Prussia (Warmińsko-Mazurskie), Russia (Podlaskie, Lubelskie, Świętokrzyskie), and Austria (Podkarpackie). On the European scale, the voivodeships of Eastern Poland are classified as problem areas, namely those “whose development is permanently so structurally disordered by social and economic factors which means these regions will not be able to overcome these disorders without external assistance” [16] (Table 6).
At the time of Poland’s accession to the European Union, the areas of the Eastern Poland macro-region were one of the poorest, least-developed regions of all the 25 members of the Community at that time. The value of GDP per capita was just over one-third of the European Union average. These regions met all the criteria of a peripheral area, in which their location, as a result of the considerable distance from the main centres of social and economic activity, and the lack and poor quality of the transport infrastructure, have resulted in, for the enterprises of the region, increased transport costs, reduced business contacts, and difficulties in achieving returns to scale. This, moreover, has led to an increase in the cost of service provision, limited influence by local authorities on the decisions of central authorities beneficial to the region, and a low contribution of knowledge, science, and innovation in improving the region’s economy. These regions were also characterised by relatively low population density, a low urbanisation rate, weak external links, difficult access to innovation, a limited labour market, and a high level of agrarianisation in the economy (Table 7). This resulted in a low standard of living and a tendency for migration, not only from the countryside but also from small and medium-sized towns. These regions covered a total of 31.7% of the country’s area, but they were inhabited by only 21.5% of the Polish population, and in 2018, created only 12.7% of the country’s total GDP. The figures for GDP per capita in all regions were comparatively low—between 67.6% of the average country-level in Lubelskie and 72.2% in Świętokrzyskie [63]. Table 6 contains basic information about the region compared to the national averages.
The OP DEP was one of the regional-policy instruments which also included such regional operational programmes as Innovative Economy, Infrastructure and Environment, Human Capital, Technical Assistance, and European Cross-border Cooperation Programmes. These instruments were incorporated into the National Strategic Reference Framework integrating national regional policy with the then-renewed Lisbon Strategy of the European Union. The intention of the OP DEP was “to impede stagnation trends, determining the marginalisation and peripheral nature of voivodeships of Eastern Poland” and “to use existing potentials to stimulate its development” [64]. Supporting activities were undertaken in accordance with the principle of sustainable development and in compliance with the assumptions of the national environmental policy. A total of EUR 2.7 billion was spent on the programme, of which EUR 2.4 billion came from European Union funds. The aid was targeted at the development of science and innovation, the construction of broadband Internet networks, urban development, the construction of roads and ring roads, and tourist infrastructure. The main beneficiaries included universities and research institutes, research and development units, local government units, non-governmental organisations, business environment and innovation institutions, the General Directorate for National Roads and Motorways, and others. The programme identified six priority axes: the modern economy, the information-society infrastructure, voivodeship growth centres, the transport infrastructure, the sustainable development of tourism potential based on natural conditions and technical assistance.
The present Operational Programme Eastern Poland 2014–2020, with a budget of around EUR 2 billion, has been directed at the following three priority areas with a view to economic growth and improving the competitive position of the regions and the entire macro-region [18]
- Increasing the level of innovation of the macro-regional economy, based on endogenous leading economic specialisations
- Activating labour resources and improving the quality of human and social capital
- Building intensive socio-economic links with a better-developed ecosystem, for which the integrated and effective infrastructure of external and internal communication links, and a developed and modernised electricity infrastructure, are essential conditions.
In both Programmes implemented in the regions of Eastern Poland, particular attention was paid to the important role of endogenous factors, which, constituting the internal-development potential of voivodeships in combination with external capital supply, accelerate the development processes, transformation, and convergence of those less developed, peripheral, regions [19]. However, in view of the extent of the external funds allocated to these programmes, and their channelling into the main regional centres (regional capitals) to infrastructure and non-agricultural activities, exogenous factors should be considered as the main source of development for the regions concerned. However, external aid was intended to strengthen the endogenous human and social capital. The development of this capital makes it possible to move from a strategy of adaptation and survival to a development strategy aimed at improving the living conditions and well-being of citizens. A high level of social capital is a key condition for introducing the concept of a knowledge-based economy and ensuring the overall sustainability of the economy and society. It is also essential for the rational management of natural resources. This aspect is particularly important for agricultural and rural development. In the agriculture of Eastern Poland, the endogenous-development potential of the regions, which determines their competitiveness, is focused more strongly than in other regions of Poland, and the non-agricultural functions of rural areas can increase their attractiveness and create a basis for the development of service functions.
6. The Potential for the Innovative Development of the Regions of Eastern Poland
In the study of the disparities between voivodeships in Poland in terms of the level of innovation [36], four components were identified: business activity, funding and support for R&D activity, human capital, and industrial property protection. The activities of enterprises in the period between 2005 and 2008 increased in most voivodeships, with the exception of four of them (Lubuskie, Pomorskie, Podlaskie, and Warmińsko-Mazurskie), and the highest level of innovation in this area in the whole period was observed in the Śląskie and Mazowieckie Voivodeships. The indicator of business activity was quite favourable in the Lubelskie, Podlaskie, Podkarpackie, and Świętokrzyskie regions, while it was unfavourable in the Warmińsko-Mazurskie region, where the transformations in the sector of former State-owned agricultural enterprises were felt in the long term. Funding and support through expenditure on R&D activities were at a similar level in 2005 and 2008. The most advantageous indicators in this respect were recorded in the Mazowieckie and Małopolskie Voivodeships, while the majority of the voivodeships of Eastern Poland were classified below the national average, and the Podlaskie Voivodeship completed the whole list of regions. In the field of human capital, the position of these voivodeships, with the exception of the Świętokrzyskie Voivodeship, which was ranked last, was slightly more favourable. The weakest positions were held by the regions of Eastern Poland, perhaps with the exception of Lubelskie and Podkarpackie, in the sphere of industrial property protection.
The analysis of partial indicators of the innovation output of voivodeships indicates that the regions of Eastern Poland do not belong entirely to the group of the least innovative regions; some of them are ranked above the national average, and some have improved their position in the ranking over the period under study. This is confirmed by synthetic data included in Table 8. In 2005, three voivodeships: Lubelskie, Podlaskie, and Podkarpackie, were ranked quite high, from 7 to 9, while the other two, Warmińsko-Mazurskie and Świętokrzyskie were ranked 12 and 13. In 2008, the Lubelskie, Podkarpackie, and Świętokrzyskie Voivodeships improved their positions in the ranking, while the Podlaskie and Warmińsko-Mazurskie regions’ rankings significantly declined.
Table 8 shows that the level of innovation in the analysed period did not change in the five regions, including the three with the highest level of innovation, and the two at the bottom of the ranking. In seven regions, the level of innovation in 2008 was higher than in 2005, while in four it decreased. Among the regions of Eastern Poland, an improvement in innovation was observed in three regions (Lubelskie, Podkarpackie, Świętokrzyskie), while in two regions (Podlaskie and Warmińsko-Mazurskie) there was a decrease in innovation.
The research by J. Kot and E. Kraska [34] on the innovative environment of Polish regions in 2008 and 2015 confirmed to a large extent the aforementioned results of the research by N. Gust-Bardon [36]. The analysis of the quality of the innovative environment, according to the synthetic indicator, made it possible to include, in both 2008 and 2015, most of the regions of Eastern Poland in the category of catching-up regions with a moderate level of innovation (the synthetic indicator being below the national average), with the exception of the Warmińsko-Mazurskie region, which was placed in the category of regions with a low level of innovation. When considering the partial categories describing the innovative environment, greater diversity in the examined regions can be observed. In the category of innovative enterprises, the Podkarpackie Voivodeship stands out positively, which in both years was included in the group of moderate innovators. This group also included the Podkarpackie region in 2008 and the Podlaskie region in 2015, in terms of innovative and R&D activity. In this respect, the Świętokrzyskie region in 2008 and the Warmińsko-Mazurskie region in 2015 were classified as regions with a low level of innovation. As regards public-sector support, the Lubelskie Voivodeship stood out positively in 2008, and in terms of human capital, Podlaskie, Podkarpackie, and Świętokrzyskie in 2015. Human capital in both years placed the Warmińsko-Mazurskie Voivodeship in the lowest innovation category. The protection of intellectual property was rated low in 2008 in three voivodeships: Warmińsko-Mazurskie, Podlaskie, and Podkarpackie, and quite high in Lubelskie and Świętokrzyskie.
The synthetic indicators for 16 regions of Poland, described in Table 3 by Urszula Wich [35], after being standardised, made it possible to create a ranking of voivodeships in terms of the level of innovation in the regions (Zjy) and the level of economic development (Zjx). The decreasing values of the relative indicators presented in Table 9 show increasingly weaker positions of the regions in the ranking.
The data in Table 9 show that the first two positions in both classifications are held by the Mazowieckie and Dolnośląskie Voivodeships. A similar convergence exists, but at the much-lower 14th position, in the Świętokrzyskie Voivodeship. The remaining regions are divided into two groups, the first one (6 regions) has an advantage of the level of innovation over the level of economic development, and the second one (7 regions), where the economy has an advantage in the level of development over the level of innovation. The group of regions with a predominance of innovation over economic development comprises the least developed regions of the country, including the Lubelskie, Podlaskie, and Podkarpackie Voivodeships, belonging to the macro-region of Eastern Poland. The latter region is characterised by the greatest discrepancy between the level of innovation (4th in the ranking) and the level of economic development (16th place). The comparison of the results of the research carried out in 2013 with the research carried out earlier [65] shows that the strength of correlation between the level of innovation and the level of economic development weakens with time. This means that economically underdeveloped regions have made significant progress in terms of innovation faster than in raising the general level of economic development. This phenomenon has occurred in most regions of Eastern Poland. This has happened, in particular, as a result of the use of support from European funds. For the less developed regions, the relatively high level of innovation and the relatively rapid progress in this regard, in the short term, can be regarded as a sign of acceleration in the development of their economies in the future.
7. The Potential for Smart Village Development in the Regions of Eastern Poland
The economic effects and structure of the economy of the regions of Eastern Poland, in the initial period of Poland’s membership in the European Union, showed signs of underdevelopment and backwardness. In the year of Poland’s accession to the European Union, the macro-region’s average GDP per capita ratio was only 74% of the national average. The proportion of agriculture in the production of gross value added in the regions exceeded the national average, except for the Podlaskie region. Agriculture was the place of employment for a significant part of labour resources. Agriculture had an indicator of 17.4%, equal to the national average, only in the Warmińsko-Mazurskie Voivodeship, and in the remaining regions, the indicator was between 25% in the Podkarpackie region and 37.4% in the Lubelskie region (Table 6 and Table 7). The population making a living from agriculture constituted a percentage similar to the national average in the Warmińsko-Mazurskie and Podlaskie Voivodeships, while in the remaining regions this indicator was about twice as high. Rural areas were inhabited by 40–41% of the population in the Warmińsko-Mazurskie and Podlaskie Voivodeships, 53–55% in the Lubelskie and Świętokrzyskie Voivodeships, and almost 60% in the Podkarpackie Voivodeship. The regions concerned differ significantly in terms of forest cover: the Lubelskie region has low forest cover and the Podkarpackie region has high forest cover (Table 10).
According to the concept of smart villages, social activation and technological progress effectively integrated with other development initiatives can create new opportunities to increase income, improve product ranges, and lead to the overall strengthening of the local community and improvements in the quality and conditions of rural life. In the production sphere, a smart village can mean investing in infrastructure, efficient management, digitisation, the implementation of new technologies and smart specialisations adapted to local production conditions and markets. According to Marcin Wójcik [27], the most important aspects of smart village development include developed public services, efficient commune management, local-community creativity, technological innovations for entrepreneurship, modern forms of social communication, and new forms of using and protecting natural potential. The concept of smart village development emphasises the role of grassroots activities undertaken by local leaders in cooperation with local governments, and the need to transfer innovation to rural areas from outside the local system, including from neighbouring towns. The Internet and other digital-communication technologies can play an important role in creating cooperation networks and preventing the social exclusion of members of various marginalised groups in rural communities [28]. The implementation of the concept of smart local development should contribute to, and manifest itself in, the emergence of local innovation systems developed on the basis of strengthening the cooperation networks of companies and institutions in specific sectors. Industries that can provide a platform for smart village development include tourism services, healthcare, leisure services, organic production, precision farming, traditional food production, and handicrafts and cultural services [29]. These are often market niches that need to be discovered and developed within local arrangements [56]. In conclusion, it can be stated that the smart village, treated as an innovative local arrangement, means a territory that activates endogenous resources and intangible capital in the innovative processes of production, exchange, and consumption, using endogenous potential and the external determinants of development through the use of modern communication technologies, internal partnerships, and cooperation networks with urban centres.
Monika Stanny, using the synthetic measure of the socio-economic development of rural and urban-rural communes in Poland, divided all the analysed communes into three categories of equal sizes—communes with high, medium, and low development levels, 724 communes each [66]. Most of the communes with a low level of development were located in the voivodeships of Eastern Poland. These types of commune dominate the whole area of these regions, with the exception of the communes surrounding voivodeship capital cities. The low level of rural development in the regions of Eastern Poland does not mean that they are homogenous in each of them. A similar level of development often means varied socio-economic structures, as well as different problems and challenges in rural development [66]. Deficiencies in the internal socio-economic structures of rural areas in peripheral regions manifest themselves in the fact that decent living conditions in the population are not ensured, and there are various other unfavourable demographic phenomena, difficulties in the local labour market, mono-functionality and traditionalism in the rural economy, poor social activity among the residents, difficult access to services, and others. Taking into account 11 components of the socio-economic structure of rural and urban-rural communes, the Institute of Rural and Agricultural Development of the Polish Academy of Sciences has been conducting “The monitoring of rural development” since 2012 (covering 2172 communes), where the following seven types of these areas are distinguished [67]:
- Areas with a predominance of traditional agriculture (474 communes)
- Areas with a predominance of large-scale agriculture (381 communes)
- Areas with a predominantly agricultural function, intermediate (449 communes)
- Areas with multi-profitable, fragmented, agriculture (161 communes)
- Multifunctional areas–balanced distribution of the sectors (433 communes)
- Urbanised areas, with a reduced agricultural function (227 communes)
- Highly urbanised areas (48 communes).
Two out of five regions of Eastern Poland—the Podlaskie and Lubelskie Voivodeships—are characterised by the predominance of traditional agriculture (type 1), with a significant proportion of communes containing villages with a predominantly agricultural function (type 3). In the Podkarpackie Voivodeship, there is a predominance of intermediate villages with a mainly agricultural function (type 3) and of multi-profitable villages, with fragmented agriculture (type 4). In the Świętokrzyskie region, with a large proportion of type-1 and type-3 villages, there are also often multi-profitable villages (type 4). On the other hand, the Warmińsko-Mazurskie Voivodeship is an area predominated by large-scale agriculture, with rare multifunctional communes and traditional agricultural communes. In the Lublin region, Podkarpacie, and Podlasie, there are urbanised villages with a reduced agricultural function around the regional capital cities, and also multifunctional villages around the capital cities of the Warmińsko-Mazurskie, Lubelskie, and Podlaskie regions.
Despite the fact that the Polish economy is characterised by the clear phenomenon of de-agrarianisation, agriculture still remains an important sector of the economy in many regions. This is particularly true of the regions of Eastern Poland. The sustainable development of agriculture, supported by the implementation of innovation, can become an important source of overall development for these regions. One of the important ways of strengthening innovation can be the concept of smart villages. This notion inspired research into the potential for smart rural development within the regional arrangement of Poland.
Such research was carried out on the basis of data for 2014–2016 in all the regions of Poland [20]. More detailed research at the level of local territorial unit arrangements (communes) was carried out in the regions of Eastern Poland considered to be peripheral. The calculations were based on statistical data for the years 2014–2016 taken from the Local Data Bank, Statistics Poland, the Office of Electronic Communications, and the Register of Vehicles and Drivers. The obtained research results for all regions in Poland are presented in Table 11.
If the voivodeships of Poland are divided into three groups according to the potential for smart rural development, then the group with high potential (indicator 0.51 and higher) includes four voivodeships: Wielkopolskie, Dolnośląskie, Opolskie, and Śląskie; the group with medium potential (indicator 0.36–0.50) includes seven voivodeships, and the group with low potential (indicator up to 0.35) includes five voivodeships: Mazowieckie, Łódzkie, Podlaskie, Lubelskie, and Świętokrzyskie. Three regions of Eastern Poland—Świętokrzyskie, Lubelskie, and Podlaskie—are in the group with the lowest potential, and two of them, Podkarpackie and Warmińsko-Mazurskie, with a fairly low total indicator of 0.37, are ranked at the bottom of the middle group.
The group of voivodeships with the highest potential for smart rural development includes the Wielkopolskie, Dolnośląskie, Opolskie, and Śląskie Voivodeships, which have highly productive agriculture, a well-developed business environment, and an infrastructure ensuring good mobility, and, in the case of the Dolnośląskie and Wielkopolskie Voivodeships, active local communities. All the regions of Eastern Poland display potential below the Polish average, with Świętokrzyskie, Lubelskie, and Podlaskie completing the voivodeship ranking in the final three positions, and Podkarpackie and Warmińsko-Mazurskie being ranked 9–10 (Table 10). Podkarpackie is characterised by relatively favourable indicators in terms of the environment, society, and mobility, and Warmińsko-Mazurskie in economic and social terms. In the Lubelskie Voivodeship, the low potential in terms of the quality of life, the environment and management, is accompanied by a relatively favourable indicator concerning society, while in the Świętokrzyskie Voivodeship, the indicators of the potential for smart development in all aspects were at a low level, except for the economy. The regions of Eastern Poland were most similar in the social and mobility aspects, and the most diverse in terms of the natural environment.
8. Discussion
Measuring the development gap in economic terms results in the issues of peripherality’s usually being analysed in a multi-faceted way, and the peripheral areas are characterised by considerable diversity, which makes it necessary to include it in the development policy [66,68]. The complexity of the phenomenon of peripherality is further reinforced by its dynamic nature and relativity, whereas another territorial unit, or the adopted criterion of peripherality, might be the reference point [69]. Referring to the various aspects of peripherality, Andrzej Miszczuk [14], in geographical terms, stresses the importance of limited transport accessibility and the high costs of covering the distance to the centres of political, administrative, and socio-economic life. In economic terms, he points out such features as the low economic potential and the inefficient economic structure of the peripheral regions. With regard to the socio-demographic aspect, he takes into account low population density, ongoing depopulation processes, the low quality of social capital linked to the low level of social trust, and interaction and cultural peripherality, which has its origin in the low sense of territorial identity. The low level of the political and administrative aspect, and the related low strategic importance of the area on the national and international scales, are manifested by the small representation of the region within the central authorities, or the small extent of the powers effectively exercised by the interregional authorities. Peripherality is also associated with historical, geopolitical, and cultural aspects. Different aspects of peripherality involve different links and feedback with different intensities. The development policy of peripheral regions should weaken the impact of negative feedback and strengthen positive relationships and links. The most important links in regional and local arrangements include those between innovation and economic development.
The fact of identifying peripheral areas in the spatial division arrangements makes it possible to see the asymmetry of relations and disparities when compared to central or more developed territorial units. Peripherality means the more frequent occurrence of negative or less favourable features in comparison with central or core areas [70]. Peripherality is associated with distance, disparity, and dependence on external aid. Peripheral regions have limited opportunities, in terms of endogenous potential, to automatically trigger development involving overcoming peripherality and economic problems, and most often do not have sufficient capability to attract these factors from outside on market terms. In order to build up a critical mass to trigger development processes, public-authority influence and assistance are needed, covering simultaneously the modernisation of existing endogenous potential and regional expansion, diversification, and specialisation in the innovative and technological economies [71]. Therefore, development processes could be triggered by the use of exogenous factors. This mainly involves the innovative industrial and service sectors located in urban centres. The development of primary sectors, including mainly agriculture but also non-agricultural forms of the rural economy, can be based on endogenous resources, and on the strengthening of the knowledge-based economy, and the creation of local innovation systems. Despite the development of information technologies and the improvement in transport and communications, reducing the impact of distance and geographical proximity, the economic weakness of the peripheral regions and the lack of internal factors stimulating innovation and economic growth in the peripheral regions requires an appropriate policy of external support and supply, mainly at the national and EU levels [72,73].
The data compiled in Table 12 show that the parameters of the socio-economic development of the regions of Eastern Poland after ten years of Poland’s membership of the European Union still place this macro-region below the national average, and indicate that the development gap in relation to the more developed regions has not been bridged.
According to some authors, a substantial development gap, determined mainly by the location and historical past [30,66] results mainly from unsatisfactory progress in building the innovative potential of the regions, in expanding the technical infrastructure, and in strengthening the potential for the knowledge and creativity of human resources and local communities. The data in Table 12 only partially support this opinion.
GDP per capita in the regions of Eastern Poland continued to be around 70% of the national average, and the unemployment rate in 2016 was higher than the national average. High unemployment was particularly evident in the Warmińsko-Mazurskie Voivodeship, which was a consequence of the collapse of the State-owned farming sector during the transformation period. It is comforting to note that, although expenditure on scientific and research activity was lower in the regions under study, the majority of these regions were experiencing the development of cooperation initiatives in clusters of small and medium-sized enterprises, and the use of the electronic exchange of information in supply chains, which might have been evidence of strengthening innovation. The regions of Eastern Poland are not inferior to other regions of the country in the field of health services and have a more protected environment, as evidenced by the generally high proportion of legally-protected areas.
In the regions under study, after Poland became a Member of the European Union, both progress and regression can be observed in the social and economic fields. The analysis of the spatial differentiation and socio-economic level of the voivodeships of Poland in the years 2005–2017 [33] shows that in 2005, in an orderly ranking of 16 voivodeships in Poland, the Lubelskie Voivodeship was ranked last, and the group of six closing the list also included the Świętokrzyskie (14th place), Podkarpackie (12th place), and Podlaskie Voivodeships (11th place). In that year, the Warmińsko-Mazurskie Voivodeship was ranked high, at sixth place. This high position was due to the voivodeship’s then functioning State-owned agriculture sector, while State-owned farms at that time were also developing, in addition to agricultural production, agricultural processing and food distribution, and provided appropriate wage levels and social support for a significant number of employees (e.g., staff housing) in State Agricultural Enterprises (Table 12). After the State sector of the economy was subjected to systemic transformations, in 2010 the Warmińsko-Mazurskie Voivodeship fell to thirteenth position in the ranking, and in 2017 to the fifteenth, i.e., the penultimate, position. Since Poland became a Member of the EU, it has been possible to observe the progression of the Lubelskie Voivodeship, which was the weakest at the beginning, to ninth position in the ranking, as well as the improved position of the Świętokrzyskie Voivodeship. The places of the Podlaskie and Podkarpackie Voivodeships showed an extreme change from 11th to 16th positions (Table 13).
The data included in Table 13 above indicate a large spatial differentiation in the levels of socio-economic development in the regions of Poland and a shift of voivodeships in the rankings prepared for subsequent years. In 2005, the voivodeships of Eastern Poland were ranked in varied, and even good positions, with the exception of the Lubelskie and Świętokrzyskie Voivodeships. In 2010, the Lubelskie and Świętokrzyskie regions significantly climbed in the ranking, while the remaining three dropped, especially the Podlaskie region from 11th to 16th position, and the Warmińsko-Mazurskie region from 6th to 13th place. In 2017, the Lubelskie Voivodeship maintained its high position (9) and the Podlaskie Voivodeship improved its position (from 16th to 10th). The remaining three voivodeships were ranked in the final four on the ranking list of regions ordered according to the synthetic indicator of development adopted as a measure of the socio-economic development of regions in Poland.
According to the concept of smart villages, social activation and technological progress effectively integrated with other development initiatives can create new opportunities to increase income, improve product ranges, and lead to the overall strengthening of the local community and improvements in the quality and conditions of rural life. In the production sphere, a smart village can mean investing in infrastructure, efficient management, digitisation, the implementation of new technologies and smart specialisations adapted to local production conditions and markets. According to Marcin Wójcik [27], the most important aspects of smart village development include developed public services, efficient commune management, local-community creativity, technological innovations for entrepreneurship, modern forms of social communication, and new forms of using and protecting natural potential. The concept of smart village development emphasises the role of grassroots activities undertaken by local leaders in cooperation with local governments, and the need to transfer innovation to rural areas from outside the local system, including from neighbouring towns. The Internet and other digital-communication technologies can play an important role in creating cooperation networks and preventing the social exclusion of members of various marginalised groups in rural communities [28]. The implementation of the concept of smart local development should contribute to and manifest itself in the emergence of local innovation systems developing on the basis of strengthening the cooperation networks of companies and institutions in specific sectors. Industries that can provide a platform for smart village development include tourism services, healthcare, leisure services, organic production, precision farming, traditional food production, and handicrafts and cultural services [29]. These are often market niches that need to be discovered and developed within local arrangements [22]. In conclusion, it can be stated that the smart village, treated as an innovative local arrangement, means a territory that activates endogenous resources and intangible capital in the innovative processes of production, exchange, and consumption, using endogenous potential and the external determinants of development through the use of modern communication technologies, internal partnerships, and cooperation networks with urban centres.
The period since becoming a Member of the European Union has brought a large inflow of EU funds supporting agriculture and rural areas under the Common Agricultural Policy and the Cohesion Policy. These funds have been channelled to all regions but with greater concentration in less developed countries and peripheral regions. The European Union has adopted a policy aimed at maintaining the high speed of entire territorial arrangements and reducing the existing disparities within these territorial unit arrangements [74]. The reduction in development disparities, referred to as convergence, has driven various sectoral policies in the European Union, including regional policy, agricultural policy, and rural development policy.
The regions of Eastern Poland have received aid from the European Funds for the development of agriculture and rural areas after accession to the European Union equal to or even exceeding the average indicators for the country (Table 14). The Lubelskie, Podlaskie, and Świętokrzyskie Voivodeships had all indicators higher than the national average for the whole period 2004–2014. These indicators were weaker in the Podkarpackie Voivodeship, where a significant part of the region is mountainous, and rural areas are densely populated. If we also take into account the natural features of the region (large areas of lakes) and the nature of the agrarian structure (a high percentage of large farms), it can be concluded that the Warmińsko-Mazurskie Voivodeship also benefitted intensively from European Union financial support. In this situation, the question arises as to whether the funds obtained from EU funds contributed to the acceleration of the development of the regions of Eastern Poland and whether they were an effective tool for achieving convergence.
The acceleration of the rate of economAic growth in the countries of Central and Eastern Europe participating in the fifth enlargement of the European Union in 2004, bringing their level of economic development closer to the EU average, is evening out disparities within the Union. It has been noted, however, that the observed external convergences in the form of catching up with the level of development of the EU-15 countries by the new, less developed EU-10 Member States, has not been accompanied by such a clear process of internal convergence involving the reduction of disparities in the development of individual regions within the group of new Member States [74]. What’s more, during the initial period of membership, an increase in the phenomenon of polarisation and internal differentiation was observed, as the more developed regions were better prepared to efficiently absorb the funds made available to the regions under Community policies. The sectoral structure of the economy was also important. Boldrin and Canova [3] noted that the high proportion of agriculture in the region’s economy could have hindered the occurrence of the phenomenon of convergence, and might even have been the cause of the opposite phenomenon, i.e., divergence. Subsequent studies [75,76] showed that the biggest tendency towards convergence was observed in the services sector, while there was a lack of convergence, or even divergence, in the industrial and agricultural sectors. This interpretation might explain the situation which has arisen in the regions of Eastern Poland, which are characterised by a large proportion of the primary sectors—agriculture and forestry—in the economy, dispersed elements of the industrial sector, and a rather low level of service development. From the theoretical point of view, convergence in these regions might occur due to the accumulation of capital for the transfer of new technologies and the diffusion of innovation. If the required critical mass in this area is not reached, convergence might be delayed.
The question arises as to whether the policy of support for the development of the regions of Eastern Poland is ineffective if it has not produced visible results, and the phenomenon of expected convergence has not become apparent. However, a positive answer to this question would be too simplistic. An important approach might be to inhibit the deepening of development gaps, the justified phenomenon of delaying the effects of investments in relation to the time of incurring the expenditures, and the observed phenomenon of strengthening development potentials in certain elements/aspects of the identified areas of smart development.
9. Conclusions
- Peripherality is an inherent feature of larger territories and countries. It is the result of varied, unfavourable, geographical locations in relation to growth poles, different environmental conditions, the historical background, the state of socio-economic development, and other elements. Economic and social peripherality is not a feature permanently assigned to a particular area and can be limited, and its effects mitigated by appropriate regional and local policies. A false policy of restructuring and privatisation in state-owned agriculture practiced in Poland during transition resulted in declining the development potential of some regions. The evidence for this is moving the Warmińsko-Mazurskie Voivodeship from II (high) to IV (low) group in the classification of Polish regions during the first decade of the XXI century.
- The mitigation of the extent and effects of peripherality can be achieved in a number of ways, among which important roles can be played by the better use of material and intellectual resources, the transfer of innovation, the development of internal and external cooperation, the building of intellectual capital and knowledge, and the strengthening of territorial identity, which, taken altogether, make up the region’s development potential, which can be defined by synthetic indicators. Socio-economic development can be achieved either by internal mobilisation and the activation of local economic entities, or by obtaining external support, or by combining both.
- The sectoral arrangements of peripheral regions are characterised by the predominance of the primary sectors—agriculture and forestry—the weakness of the industrial sector, and the underdevelopment of services. These areas lack developed metropolitan areas, with the predominance of rural areas having underdeveloped urban centres. An underdeveloped labour market results in the phenomenon of migration and a decrease in the population growth rate. Sustainable rural development can be achieved by strengthening the innovative potential of economic entities operating in the region, especially those operating in rural areas.
- Rural development requires external support, the mobilisation of endogenous resources, and an appropriately adapted development strategy. Rural areas focused on strengthening multifunctionality and innovativeness should base their growth strategies on the principles of sustainable and balanced development. One of the forms of implementing sustainable rural development and strengthening their innovativeness is the concept of smart villages.
- The innovative concept of the smart village seems to be a prospective approach to increase the innovative potential for rural development in peripheral regions. The policy of supporting this idea should be strengthened and transformed into practical strategies and development programmes at the national, regional and local levels. The success of such strategies and programmes depends on introducing smart and innovative methods of technological development, conducting reasonable structural changes and non-destructing transformation, as well as on effective support from national and EU sources.
- The policy of support for the peripheral regions in Eastern Poland over the last fifteen years has had the effect of mitigating interregional disparities and increasing the level of innovation in the peripheral regions. Research indicates that the rate of innovation implementation might be ahead of the economic growth rate. The increase in the level of innovation can be regarded as a symptom of the acceleration of socio-economic development in the future. The correlations between the development of innovation and the rate of economic growth in the peripheral regions require further detailed research.
The author, in presenting this paper to an international audience, considers this piece of work, which is a mixture of literature review and his personal experience and opinions learnt from the analysis of the specific peripheral regions of Eastern Poland, as a limited guideline for the policy-makers and researchers dealing with peripherality in different countries. In any case, research programmes and policy actions must be adequately adjusted to the specific country and regional conditions.
Author Contributions
Conceptualization, M.A.; methodology, M.A.; formal analysis, M.A.; investigation, M.A.; resources, M.A.; data curation, M.A.; writing—original draft preparation, M.A.; writing—review and editing, M.A.; visualization, M.A.; supervision, M.A.; project administration, M.A.; funding acquisition, M.A. All authors have read and agreed to the published version of the manuscript.
Funding
This research was supported by the Research Development Found of Pope John Paul II State School of Higher Education in Biała Podlaska, Poland.
Institutional Review Board Statement
Not applicable.
Informed Consent Statement
Not applicable.
Data Availability Statement
No new data were created or analysed in this study. Data sharing is not applicable to this article.
Acknowledgments
The author would like to thank Magdalena Zwolińska-Ligaj for the scientific cooperation and enabling the use of some joint research results in this work. He also thanks Anna Maksymiuk for the technical support.
Conflicts of Interest
The author declares no conflict of interest.
References
- Copus, A. A New Peripherality Index for the NUTS III Regions of the European Union, Report to the Commission, DG Regional Policy; Rural Policy Group, Management Division: Aberdeen, UK, 1999. [Google Scholar]
- Brezzi, M.; Dijkstra, L.; Ruiz, V. OECD Extended Regional Typology: The Economic Performance of Remote Rural Regions, OECD Regional Development Working Papers; OECD: Paris, France, 2011. [Google Scholar]
- Boldrin, M.; Canova, F. Inequality and convergence in Europe’s regions: Reconsidering European regional policies. Econ. Policy 2001, 32, 206–253. [Google Scholar] [CrossRef]
- Farole, T.; Rodriguez-Pose, A.; Storper, M. Cohesion policy in the European Union: Growth, geography, institutions. J. Common. Mark. Stud. 2011, 49, 1089–1111. [Google Scholar] [CrossRef] [Green Version]
- McCann, P.; Ortega-Argile’s, R. Modern regional innovation policy. Camb. J. Reg. Econ. Soc. 2013, 6, 187–216. [Google Scholar] [CrossRef]
- Keeble, D.; Ownes, P.; Thompson, C. Regional accessibility and economic potential in the European Community. Reg. Stud. 1982, 16, 419–432. [Google Scholar] [CrossRef]
- Puga, D. The rise and fall of regional inequalities. Eur. Econ. Rev. 1999, 43, 303–334. [Google Scholar] [CrossRef] [Green Version]
- Langendijk, A.; Lorentzen, A. Proximity, knowledge and innovation in peripheral regions. Eur. Plan. Stud. 2007, 15, 457–466. [Google Scholar] [CrossRef]
- Davies, S.; Michie, R. Peripheral Regions: A Marginal Concern? EoRPA Paper 11/6; University of Strathclyde: Glasgow, UK, 2011. [Google Scholar]
- Fujita, M.; Krugman, P.; Vanables, A. The Spatial Economy: Cities, Regions and International Trade; MIT Press: Cambridge, MA, USA, 2001. [Google Scholar]
- Young, N. Globalization from the edge: A framework for understanding how small and medium sized firms in the periphery “go global”. Environ. Plan. 2010, 42, 838–855. [Google Scholar] [CrossRef]
- Bryden, J.; Dawe, S.P. Development strategies for remote rural regions: What we do so far. In OECD International Conference on Remote Rural Areas: Developing through Natural and Cultural Assets, Albarracin; OECD: Albarracin, Spain, 1998; pp. 1–16. [Google Scholar]
- Adamowicz, M. Direct foreign investment in peripheral areas: A case study of the Lublin Voivodeship. Econ. Reg. Stud. 2019, 3, 223–241. [Google Scholar]
- Miszczuk, A. Uwarunkowania Peryferyjności Regionu Przygranicznego; Wydawnictwo Norbertinum: Lublin, Poland, 2013. (In Polish) [Google Scholar]
- Proniewski, M. Polityka rozwoju regionów peryferyjnych. Optim. Stud. Ekon. 2014, 72, 79–90. (In Polish) [Google Scholar] [CrossRef] [Green Version]
- Wesołowska, M.; Jakubowski, A. Konsekwencje procesów ludnościowych na obszarach wiejskich województw Polski Wschodniej w ujęciu przestrzennym. Stud. Reg. Lok. 2018, 73, 118–146. (In Polish) [Google Scholar]
- Płoszaj, A. Diagnoza Sytuacji Społeczno–Gospodarczej Wraz z Analizą SWOT dla Programu Operacyjnego Polska Wschodnia. Ekspertyza na zlecenie Ministerstwa Rozwoju Regionalnego; Ministerstwo Rozwoju Regionalnego: Warszawa, Poland, 2013; p. 7. (In Polish) [Google Scholar]
- Program Operacyjny Polska Wschodnia 2014–2020. Available online: https://www.funduszeeuropejskie.gov.pl/media/56702/POPW_26042018_wersja_jednolita.pdf (accessed on 21 August 2020). (In Polish)
- Szabela-Pasierbińska, E. Ocena Programu Operacyjnego Rozwój Polski Wschodniej 2007–2013. Społecz. Ekon. Soc. Econ. 2018, 10, 39–51. (In Polish) [Google Scholar] [CrossRef]
- Zwolińska-Ligaj, M.A. Kształtowanie Lokalnych Systemów Innowacji Jako Sposób Realizacji Koncepcji Inteligentnego Rozwoju na Przykładzie Regionów Peryferyjnych, Monografie i Rozprawy nr 9; Wydawnictwo PSW JPII: Biała, Podlaska, 2018. (In Polish) [Google Scholar]
- Adamowicz, M.; Zwolińska-Ligaj, M. The “Smart Village” as a way to achieve sustainable development in rural areas of Poland. Sustainability 2020, 12, 6503. [Google Scholar] [CrossRef]
- Guzal-Dec, D. Intelligent development of the countryside—The concept of smart village: Assumption, possibilities and implementation limitations. Econ. Reg. Stud. 2018, 11, 32–49. [Google Scholar] [CrossRef] [Green Version]
- Szczech-Pietkiewicz, E. Smart City—Próba definicji i pomiaru. Prace Nauk. Uni. Ekon. Wrocław. 2015, 391, 7–82. (In Polish) [Google Scholar] [CrossRef] [Green Version]
- European Commission. EU Action for Smart Villages, 12 April 2017. Available online: http://enrd.ec.europa.eu/news-events/news/eu-action-smart-villages_en (accessed on 30 May 2018).
- Zwolińska-Ligaj, M.; Guzal-Dec, D.; Adamowicz, M. Koncepcja inteligentnego rozwoju lokalnych jednostek terytorialnych na obszarach wiejskich regionu peryferyjnego na przykładzie województwa lubelskiego. Wieś Roln. 2018, 179, 247–280. (In Polish) [Google Scholar]
- Hajduk, S. The concept of smart city in urban management. Bus. Manag. Edu. 2016, 14, 34–49. [Google Scholar] [CrossRef]
- Wójcik, M. Wprowadzenie. In Inteligentny Rozwój Obszarów Wiejskich (Smart Rural Development): Koncepcja, Wymiary, Metody; Wójcik, M., Ed.; Global Point: Łódź, Poland, 2018. (In Polish) [Google Scholar]
- Vaishar, A.; Stastna, M. Smart Village and Sustainability. Southern Moravia Case Study. Eur. Countrys. 2019, 11, 651–660. [Google Scholar] [CrossRef] [Green Version]
- Naldi, L.; Nilsson, P.; Westlund, H.; Wixe, S. What is smart rural development? J. Rural. Stud. 2015, 40, 90–101. [Google Scholar] [CrossRef]
- Komorowski, Ł.; Stanny, M. Smart villages: Where can they happen? Land 2020, 9, 51. [Google Scholar] [CrossRef]
- Adamowicz, M.; Zwolińska-Ligaj, M. New concepts for rural development in the strategies and policies of the European Union. Econ. Reg. Stud. 2018, 11, 7–31. [Google Scholar] [CrossRef]
- Adamowicz, M.; Ligaj, M.Z. The role of local government in the creation of innovation in regional peripheral economies (A case study of the Lublin Region, Poland). Olszt. Econ. J. 2018, 2, 123–140. [Google Scholar] [CrossRef]
- Malina, A. Analiza przestrzennego zróżnicowania poziomu rozwoju społeczno-gospodarczego województw Polski w latach 2005-2017. Nierówn. Społ. Wzrost Gospod. 2020, 61, 138–155. (In Polish) [Google Scholar] [CrossRef]
- Kot, J.; Karska, E. Środowisko innowacyjne polskich regionów i jego wpływ na procesy rozwoju gospodarczego. Stud. Ekon. Zesz. Nauk. Uni. Ekon. Katow. 2018, 362, 128–140. (In Polish) [Google Scholar]
- Wich, U. Innowacyjność Polski w ocenie Unii Europejskiej i z perspektywy regionów. Ann. Univ. Curie-Skłodowska Lub. Pol. 2017, LI, 101. (In Polish) [Google Scholar] [CrossRef] [Green Version]
- Gust-Bardon, M.J. Innowacyjność w aspekcie regionalnym. Nierówn. Społ. Wzrost Gospod. 2011, 23, 50–62. (In Polish) [Google Scholar]
- Wilkin, J. Peryferyjność i marginalizacja w świetle nowych teorii rozwoju (nowa geografia ekonomiczna, teoria wzrostu endogennego, instytucjonalizm). In Regiony Peryferyjne w Perspektywie Polityki Strukturalnej Unii Europejskiej; Bołtromiuk, A., Ed.; Wydawnictwo Uniwersytetu w Białymstoku: Białystok, Poland, 2003. (In Polish) [Google Scholar]
- Copus, A.; Skuras, D.; Tsegedini, K. Innovation and peripherality: An empirical comparative study of SMEs in six European Union member countries. Econ. Geogr. 2008, 84, 51–82. [Google Scholar] [CrossRef]
- Rodriguez-Pose, A.; Crescenzi, R. Research and development, spillovers, innovation systems, and the genesis of regional growth in Europe. Reg. Stud. 2008, 42, 51–67. [Google Scholar] [CrossRef]
- Korenik, S. Dysproporcje w Rozwoju Regionów Polski—Wybrane Aspekty; Wydawnictwo Akademii Ekonomicznej: Wrocław, Poland, 2003. (In Polish) [Google Scholar]
- Strahl, D. (Ed.) Metody Oceny Rozwoju Regionalnego; Wydawnictwo Akademii Ekonomicznej: Wrocław, Poland, 2006. (In Polish) [Google Scholar]
- Szewczuk, A. Rozwój Lokalny i Regionalny. Teoria i Praktyka; Wydawnictwo C.H. Beck: Warszawa, Poland, 2011. (In Polish) [Google Scholar]
- Michoń, D. Zróżnicowanie rozwoju społeczno-gospodarczego województw ze względu na realizację polityki spójności. Wiad. Stat. 2017, 10, 68–78. (In Polish) [Google Scholar]
- Hellwig, Z. Zastosowanie metody taksonomicznej do typologicznego podziału krajów ze względu na poziom ich rozwoju oraz zasoby i strukturę kwalifikowanych kadr. Przeg. Stat. 1968, 15, 307–326. (In Polish) [Google Scholar]
- Unia Europejska. Polityka Spójności 2007–2013. Teksty i Komentarze Oficjalne; Urząd Oficjalnych Publikacji Wspólnot Europejskich: Luxembourg, 2007. (In Polish) [Google Scholar]
- Europejska, K.; ds Generalna, D.; Regionalnej, P. Polityka Spójności 2014–2020. Inwestycje w Rozwój Gospodarczy i Wzrost Zatrudnienia; Urząd Publikacji Unii Europejskiej: Luxembourg, 2011. (In Polish) [Google Scholar]
- Baruk, J. Istota innowacji. Podatność społeczeństw na innowacje. Market. Ryn. 2009, 3, 102–103. (In Polish) [Google Scholar]
- Okoń-Horodyńska, E. Narodowy System Innowacji w Polsce; Akademia Ekonomiczna w Katowicach: Katowice, Poland, 1998. (In Polish) [Google Scholar]
- Rogers, E.M. Diffusion of Innovations; The Free Press: New York, NY, USA, 1995. [Google Scholar]
- Porter, M.E. The economic performance of regions. Reg. Stud. 2003, 37, 549–578. [Google Scholar] [CrossRef]
- Kot, J. Konkurencyjność i innowacyjność w rozwoju regionalnym. In Analiza Strukturalna Gospodarki Regionu Świętokrzyskiego i jej Wykorzystanie Pod Kątem Podnoszenia Konkurencyjności i Innowacyjności Region; Kot, J., Ed.; Akademia Świętokrzyska: Kielce, Poland, 2007; pp. 10–11. (In Polish) [Google Scholar]
- Nowakowska, A. Terytorium—Źródło procesów innowacyjności. In Zrozumieć Terytorium. Idea i Praktyka; Nowakowska, A., Ed.; Wydawnictwo Uniwersytetu Łódzkiego: Łódź, Poland, 2016. (In Polish) [Google Scholar]
- Adamowicz, M. Kształtowanie rozwoju lokalnego. In Strategie Rozwoju Lokalnego, Aspekty Instrumentalne; Adamowicz, M., Ed.; Wydawnictwo SGGW: Warszawa, Poland, 2003; Volume 2. (In Polish) [Google Scholar] [CrossRef]
- Czyżewski, A.; Stępień, S. Wspólna Polityka Rolna Unii Europejskiej po 2013 r. a interesy polskiego rolnictwa. Ekonomista 2011, 2011, 9–36. (In Polish) [Google Scholar]
- Mihai, F.C.; Iatu, C. Sustainable rural development under Agenda 2030. In Sustainability Assessment of the 21st Century; Bastante-Ceca, M.J., Fuentes-Bargues, J.F., Hufnagel, L., Mihai, F.C., Iatu, C., Eds.; IntechOpen: London, UK, 2020. [Google Scholar] [CrossRef] [Green Version]
- Dacko, A.; Dacko, M. Studia nad rozwojem obszarów wiejskich-od paradygmatu wzrostu do rezyliencji. Wieś Roln. 2018, 179, 49–64. (In Polish) [Google Scholar]
- Dudek, M. Opportunities and barriers of smart rural development in the light of field studies. Econ. Reg. Stud. 2018, 11, 57–68. [Google Scholar] [CrossRef] [Green Version]
- European Parliament and European Commission. Bled Declaration for a Smarter Future of Rural Areas in EU; European Parliament and European Commission: Brussels, Belgium, 2018. [Google Scholar]
- Fazlagić, J. Smart City+: Jak Wykorzystać Koncepcję Smart Cities oraz Pokrewną Smart Specialization do Wsparcia Rozwoju Mniejszych miast w Polsce. Ekspertyzy NIST; Narodowy Instytut Samorządu Terytorialnego: Łódź, Poland, 2015. (In Polish) [Google Scholar]
- Obrępalski, M. Specjalizacja i inteligentne miasta—Identyfikacja, pomiar, ocena. In Specjalizacja Regionalna—Współczesne Podejścia; Klasik, A., Kuźnik, F., Eds.; KPZK PAN: Warszawa, Poland, 2016. (In Polish) [Google Scholar]
- Central Statistical Office. Statistical Yearbook of the Republic of Poland; Central Statistical Office: Warsaw, Poland, 2008. (In Polish) [Google Scholar]
- Central Statistical Office. Statistical Yearbook of Agriculture; Central Statistical Office: Warsaw, Poland, 2018. (In Polish) [Google Scholar]
- Central Statistical Office. Statistical Yearbook of Regions—Poland; Central Statistical Office: Warsaw, Poland, 2008. (In Polish) [Google Scholar]
- Ministerstwo Rozwoju Regionalnego; Europejski Fundusz Rozwoju Regionalnego. Program. Operacyjny Rozwój Polski Wschodniej 2007–2013. Narodowe Strategiczne Ramy Odniesienia 2007–2013. Szczegółowy opis osi Priorytetowych; Ministerstwo Rozwoju Regionalnego: Warszawa, Poland, 2012. (In Polish) [Google Scholar]
- Koźlak, A. Ocena zróżnicowania innowacyjności regionów w Polsce i jego wpływ na poziom rozwoju gospodarczego. Prace Nauk. Univ. Ekon. Wroc. 2009, 2009, 93–104. (In Polish) [Google Scholar]
- Stanny, M. Typologia wiejskich obszarów peryferyjnych pod względem anatomii struktury społeczno-gospodarczej. Wieś Roln. 2011, 151, 59–75. (In Polish) [Google Scholar]
- Rosner, A.; Stanny, M. Monitoring Rozwoju Obszarów Wiejskich. Etap II. Fundacja Europejski Fundusz Rozwoju Wsi Polskiej; IRWiR PAN: Warszawa, Poland, 2016; p. 299. (In Polish) [Google Scholar]
- Isaksen, A.; Karlsen, J. Innovation in peripheral regions. In Handbook of the Geographies of Innovation; Shearmur, R., Carrincazeaux, C., Doloreux, D., Eds.; Edward Elgar Publishing: Cheltenham, UK, 2016. [Google Scholar]
- Idczak, P. Wielowymiarowa Koncepcja Peryferyjności Regionalnej. Identyfikacja Regionów Peryferyjnych w Polsce; Difin: Warszawa, Poland, 2013. (In Polish) [Google Scholar]
- Olechnicka, A. Regiony Peryferyjne w Gospodarce Informacyjnej; Wydawnictwo Naukowe Scholar: Warszawa, Poland, 2004. (In Polish) [Google Scholar]
- Grosse, T.G. Wybrane koncepcje teoretyczne i doświadczenia praktyczne dotyczące rozwoju regionów peryferyjnych. Stud. Reg. Lok. 2007, 27, 27–49. (In Polish) [Google Scholar]
- Świadek, A. Endogeniczne i egzogeniczne uwarunkowania innowacji na poziomie regionalnym w zachodniej Polsce. Stud. Ekon. 2014, 81, 264–288. (In Polish) [Google Scholar]
- Smętkowski, M.; Olechnicka, A.; Płoszaj, A. Współpraca naukowa jako element potencjału innowacyjnego regionów europejskich. Stud. Reg. Lok. 2017, 67, 5–25. (In Polish) [Google Scholar]
- Adamowicz, M.; Szepeluk, A. Regional convergence of labour productivity in rural sectors in the context of funds obtained for agriculture from the European Union. Probl. Agric. Econ. 2018, 356, 3–21. [Google Scholar] [CrossRef]
- Gorzelak, G. Fakty i mity rozwoju regionalnego. Stud. Reg. Lok. 2009, 36, 5–27. (In Polish) [Google Scholar]
- Le Gallo, J.; Dall’erba, S. Spatial and sectoral productivity convergence between European regions, 1975–2000. Pap. Reg. Sci. 2008, 87, 505–525. [Google Scholar] [CrossRef] [Green Version]
Figure 1.
Changes in the Population Numbers in districts of Eastern Poland Regions During 2002–2012 in % [17].
Figure 1.
Changes in the Population Numbers in districts of Eastern Poland Regions During 2002–2012 in % [17].


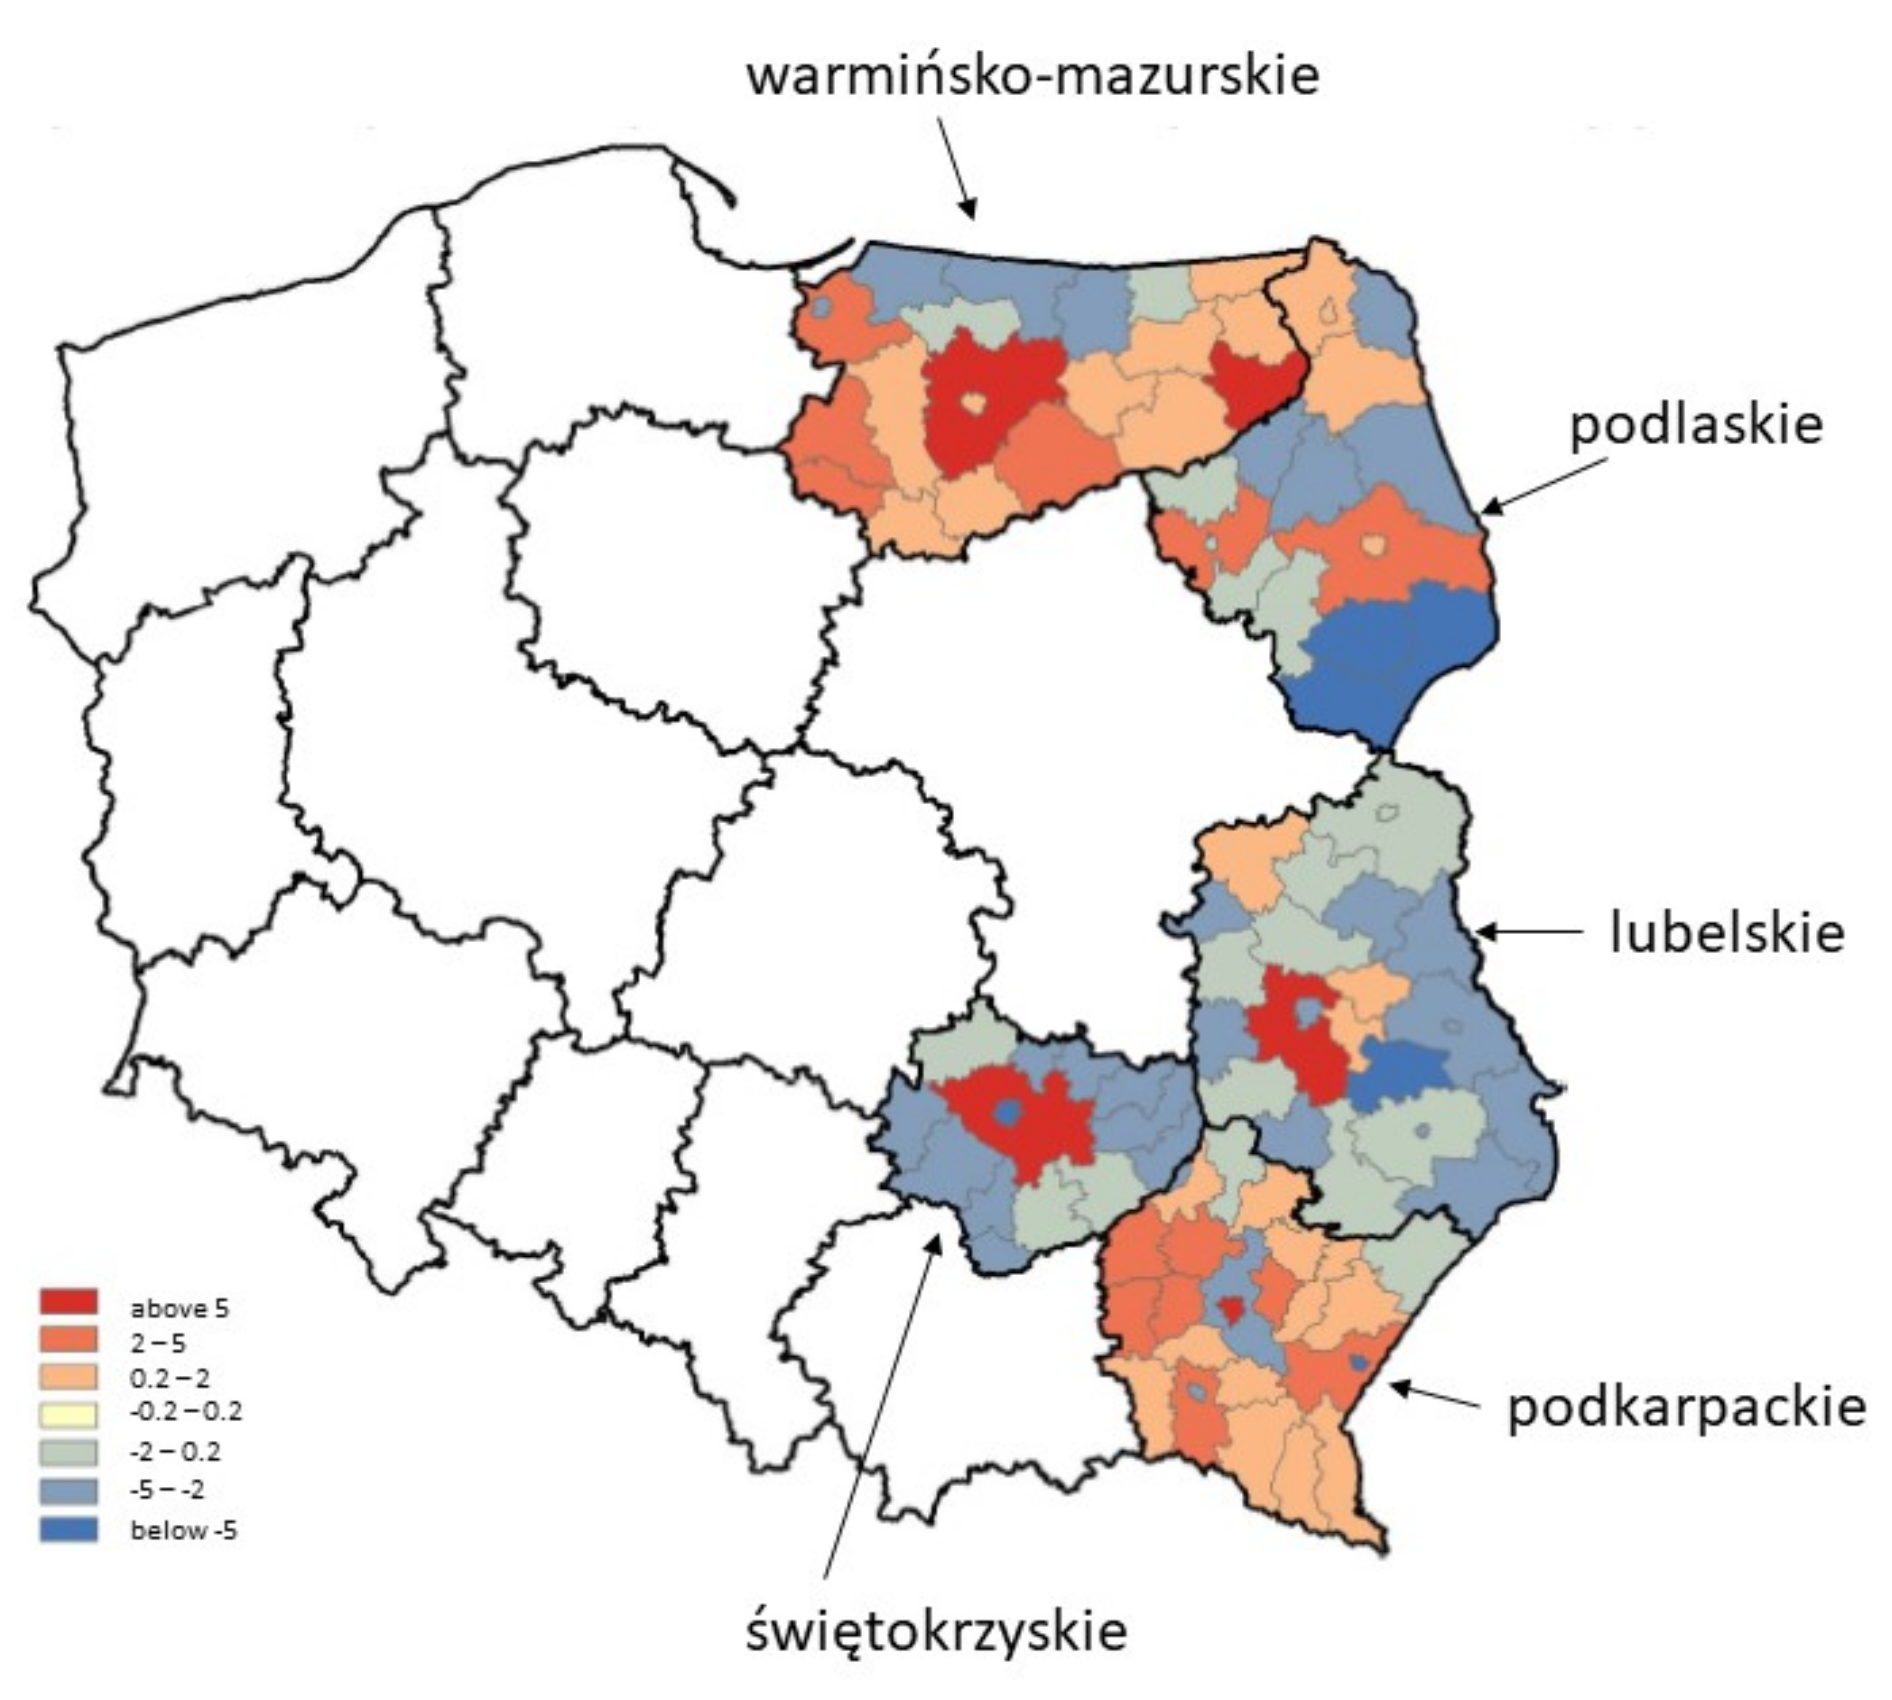
Table 1.
The Final Set of Diagnostic Variables Used in the Study [33].
Table 1.
The Final Set of Diagnostic Variables Used in the Study [33].
| Category | Variable Name | Variable Nature | Coefficient of Variation |
|---|---|---|---|
| Income of the population | Average gross monthly salary in PLN | Stimulant | 11.07 |
| Labour market | Unemployment rate (%) | Destimulant | 28.97 |
| Healthcare | Number of doctors per 10,000 population | Stimulant | 21.90 |
| Education | Number of university students per 10,000 population | Stimulant | 33.12 |
| Culture | Population per theatre | Destimulant | 73.76 |
| Infrastructure and transport | Number of passenger cars per 1000 population | Stimulant | 12.47 |
| Tourism | Number of tourists having overnight stays per 1000 population | Stimulant | 46.64 |
| Economic potential | Economic operators registered per 10,000 population | Stimulant | 18.45 |
Table 2.
Classification of Regions in Poland on Groups According to the Level of Socio-Economic Development in 2005, 2010 and 2017 [33].
Table 2.
Classification of Regions in Poland on Groups According to the Level of Socio-Economic Development in 2005, 2010 and 2017 [33].
| Level of Development Group | 2005 | 2010 | 2017 |
|---|---|---|---|
| I. Very High | łódzkie, wielkopolskie, mazowieckie | śląskie, mazowieckie, łódzkie | mazowieckie, dolno-śląskie, małopolskie |
| II. High | śląskie, dolnośląskie, kujawsko-pomorskie, opolskie, warmińsko—mazurskie | dolnośląskie, małopolskie, wielkopolskie, opolskie, zachodniopomorskie | wielkopolskie, śląskie, pomorskie, łódzkie, zachodnio-pomorskie |
| III. Average | małopolskie, zachodnio-pomorskie, podlaskie, pomorskie, podkarpac-kie, świętokrzyskie | lubelskie, świętokrzyskie, podkarpackie, pomorskie, warmińsko-mazurskie, kujawsko-pomorskie | lubelskie, opolskie, podlaskie, kujawsko--pomorskie, święto-krzyskie, lubuskie |
| IV. Low | lubuskie, lubelskie | lubuskie, podlaskie | warmińsko-mazurskie, podkarpackie |
Table 3.
The Variables Describing the Innovative Environment in Regions [34].
Table 3.
The Variables Describing the Innovative Environment in Regions [34].
| Main Category | Weight | Diagnostic Variable Name | Weight |
|---|---|---|---|
| Innovative enterprises | 20.00% | Research-intensive units in the enterprise sector | 25.00% |
| The average share of innovative enterprises in the total number of enterprises | 25.00% | ||
| Industrial and service-sector enterprises which have incurred expenditure on innovative activity | 25.00% | ||
| Industrial and service-sector enterprises which have introduced innovation | 25.00% | ||
| Σ | 100.00% | ||
| Innovative and R&D activities of enterprises | 20.00% | Expenditure on innovative activities by enterprises within the national expenditure | 25.00% |
| Expenditure on innovative activities by service-sector enterprises from own resources within total expenditure | 25.00% | ||
| Expenditure on innovative activities by industrial enterprises from own resources within total expenditure | 25.00% | ||
| Expenditure incurred by the enterprise sector within total expenditure on R&D activity | 25.00% | ||
| Σ | 100.00% | ||
| Public sector support | 20.00% | Research-intensive units in the public sector per 100,000 national-economy entities | 50.00% |
| Industrial enterprises in the public sector which have incurred expenditure on innovative activities | 50.00% | ||
| Σ | 100.00% | ||
| Human capital | 20.00% | Persons employed on R&D activities within total employment | 33.33% |
| Academic staff in technical colleges | 33.33% | ||
| Graduates from technical colleges | 33.33% | ||
| Σ | 100.00% | ||
| Intellectual property protection | 20.00% | Patents and utility models applied for per 1 million inhabitants | 50.00% |
| Patent rights and protection granted per 1 million inhabitants | 50.00% | ||
| Σ | 100.00% | ||
| Σ | 100.00% | ||
Table 4.
The Indicators Used to Describe the Level of Innovation in Regional Development [35].
Table 4.
The Indicators Used to Describe the Level of Innovation in Regional Development [35].
| Innovation-Capacity Indicators | |
|---|---|
| X1 | R&D expenditure as a % of GDP in 2011–2013 (annual average) |
| X2 | R&D expenditure by enterprises in 2011–2013 in PLN million (annual average) |
| X3 | Research & development staff working in R&D per 1000 professionally active people in 2013 |
| X4 | Population with higher education as a % of the population aged 25–64 (according to the 2011 Census) |
| X5 | University graduates per 1000 population in 2013 |
| Innovative-Position Indicators | |
| X6 | Innovative industrial enterprises in the period 2011–2013 as a % of their total number |
| X7 | Innovative service-sector enterprises in the period 2011–2013 as a % of their total number |
| X8 | Proportion of industrial enterprises’ revenues from the sale of new or substantially improved products in total sales revenues in 2013, as a % |
| X9 | Proportion of service-sector enterprises’ revenues from the sale of new or substantially improved products in total sales revenues in 2013, as a % |
| X10 | High- and medium-high-tech industrial enterprises as a % of their total number in 2013 |
| X11 | Number of patents according to the European Patent Office (EPO) per 1 million of workforce in 2010 * |
| X12 | Number of national patents per 1 million population in 2013 |
| Indicators of the Level of Development | |
| Y1 | GDP per capita in PLN thousand in 2013 |
| Y2 | Gross value of fixed assets per person in PLN thousand in 2013 |
| Y3 | Number of registered economic entities per 10,000 residents in 2013 |
| Y4 | Proportion of companies with foreign capital within the total number of entities as a % in 2013 |
| Y5 | Unemployment rate in 2013 as a % |
| Y6 | Share of employees in services as a % in 2013 |
| Y7 | Average salary in the region in PLN in 2013 * |
* The average for the country in 2012 was 12 per 1 million of workforce (no data for voivodeships).
Table 5.
The Dimensions and Variables Describing the Potential of "Smart Village” in Communities and Regions [21].
Table 5.
The Dimensions and Variables Describing the Potential of "Smart Village” in Communities and Regions [21].
| The Dimensions of the Smart Village Cconcept and Their Weights * | Variable Number | Name and Time Span of Variables | Weight of a Variable in a Dimension ** |
|---|---|---|---|
| Management (10) | X1 | The percentage of councillors representing the occupational group of specialists in the general number of councillors (2016) | 33 |
| X2 | The total value of eligible expenditure in the completed projects co-financed by the EU funds within the framework of Innovative Economy, Human Capital, Infrastructure and Environment, Regional Operational Program per 1 resident (2015) | 33 | |
| X3 | The percentage of commune area included in the existing local plans for spatial planning in the total area of the commune (2016) | 33 | |
| Life quality (10) | X4 | The number of economic agents of Q *** section per 100 residents (2016) | 30 |
| X5 | The number of economic agents of R *** section per 100 km2 (2016) | 30 | |
| X6 | The number of specialist labs per 10,000 residents (2016) | 20 | |
| X7 | The number of apartments released for use per 1000 residents (2014–2016)) | 20 | |
| Economy (30) | X8 | The percentage of the newly registered operators from the food industry sector as to the newly registered operators in total (2016, rural communes). | 30 |
| X9 | The percentage of operators from sections J, K, L, M *** as to the total number of operators (2016) | 30 | |
| X10 | The percentage of the newly registered operators from the creative sector as to the newly registered operators in total (2016, rural communes). | 20 | |
| X11 | The percentage of registered unemployed in the total number of population in the productive age. (2016, rural areas) | 20 | |
| Society (20) | X12 | The number of foundations, associations and social organizations per 1000 residents (2016, rural communes) | 35 |
| X13 | The number of participants in mass events from commune institutions per 1000 residents (2014–2016) | 20 | |
| X14 | The number of public library loans per 1000 residents (2014–2016) | 15 | |
| X15 | The percentage of students additionally learning foreign languages in primary schools (2014–2016) | 10 | |
| X16 | The number of IT thematic clubs per 1000 residents (2016) | 10 | |
| X17 | The number of U3A members per 1000 residents (2016) | 10 | |
| Natural environment (10) | X18 | The percentage of the population using the water treatment plant (2016) | 33 |
| X19 | The length of sewage line as per the length of water supply network (the percentage, 2016, rural communes) | 33 | |
| X20 | The percentage of protected areas (landscapes and national parks, as well as nature reserves) in the commune area in total (2016) | 33 | |
| Mobility (20) | X21 | The percentage of housing units in commune within the reach of Internet NGA in the total number of housing units in a commune (2016) | 40(W)/50(G) |
| X22 | Non-urban improved hard surface roads per 100 km2 (2016) (W) ****/The number of vehicles registered in the commune per 1000 residents (2016) (G) **** | 30(W)/20(G) | |
| X23 | The percentage of budget expenditure on transport and communication in commune expenditures in total (2014–2016) | 20 | |
| X24 | Bicycle lanes length per 10,000 km2 (km, 2016) | 10 |
* The meters have been constructed for rural and urban-rural areas, apart from X8, X10–X12, X19 meters, where data for the rural communities were taken into account while performing the regional calculations. ** The sum of weights of all dimensions and the sum of weights of variables in dimension = 100. *** Section J–information and communication, K–finance and insurance, L–real estate market activity, M–occupational, technical and scientific activity, Q–healthcare and social welfare assistance, R–culture, entertainment and recreation (http://www.klasyfikacje.gofin.pL/pkd/4,0.htmL). **** W–used in the research in the regional sense, G–used in the research on rural and urban-rural communes.
Table 6.
The Employment and Gross-Value-Added Structure in the Regions of Eastern Poland in 2018 [16,61,62].
| Economy Sectors | Lubelskie | Podkarpackie | Podlaskie | Świętokrzyskie | Warmińsko-Mazurskie | Poland |
|---|---|---|---|---|---|---|
| Employment as a % | ||||||
| Agriculture, fishery and forestry | 36.0 | 30.0 | 28.8 | 30.8 | 17.4 | 15.3 |
| Industry and construction | 18.1 | 25.8 | 21.7 | 22.8 | 28.5 | 26.8 |
| Trade and repair services | 18.6 | 18.1 | 20.4 | 19.2 | 33.1 | 25.3 |
| Finance and other services | 27.3 | 26.1 | 29.1 | 27.2 | 21.0 | 32.6 |
| Gross Value Added as a % | ||||||
| Agriculture, fishery and forestry | 5.2 | 1.5 | 6.4 | 4.1 | 5.5 | |
| Industry and construction | 28.3 | 38.8 | 30.5 | 35.7 | 33.9 | |
| Trade and repair services | 28.9 | 27.2 | 28.3 | 28.0 | 25.2 | |
| Finance and other services | 37.6 | 32.5 | 34.8 | 32.2 | 35.4 | |
| Specification | Poland | Eastern Poland | The Voivodeships of Eastern Poland | ||||
|---|---|---|---|---|---|---|---|
| Lubelskie | Podkarpackie | Podlaskie | Świętokrzyskie | Warmińsko-Mazurskie | |||
| Area (km2) | 312,685 | 99,045 | 25,121 | 17,844 | 20,187 | 11,708 | 24,192 |
| Population (thousand) | 38,157.1 | 8,191.2 | 2,179.6 | 2,098.3 | 1,199.7 | 1,285.0 | 1,428.6 |
| Population density (persons per 1 km2) | 122 | 83 | 87 | 118 | 59.4 | 110 | 59.1 |
| Urban population (% of total population) | 61.4 | 49.1 | 46.7 | 40.4 | 59.2 | 45.4 | 60.1 |
| Protected areas (% of area) | 32.5 | 38.5 | 22.8 | 47.7 | 32.0 | 61.9 | 46.2 |
| Nominal income of households (PLN per person) (2003) | 16,382 | 13,651 | 13,410 | 12,510 | 14,067 | 14,290 | 13,981 |
| Gross monthly salary (PLN) | 2,360 | 2,043 | 2,076 | 2,001 | 2,085 | 2,042 | 2,015 |
| Employment per 1000 population | 330 | 316 | 335 | 305 | 323 | 338 | 278 |
| Employment in agriculture (% of total employment) | 17.0 | 30.2 | 38.2 | 24.8 | 35.9 | 33.1 | 16.8 |
| Registered unemployment rate (%) | 17.6 | 19.5 | 17.0 | 18.5 | 15.6 | 20.6 | 27.2 |
| GDP (PLN per capita) (2004) | 241,181 | 17,842 | 16,777 | 16,886 | 18,056 | 18,714 | 18,778 |
| Gross value added (PLN per 1 employee) (2004) | 63,561 | 49,611 | 44,456 | 45,309 | 49,750 | 48,182 | 60,359 |
| Enterprises registered in REGON per 10,000 inhabitants | 948 | 722 | 684 | 663 | 741 | 812 | 771 |
| Capital expenditure in PLN per capita | 146 | 54 | 84 | 53 | 51 | 15 | 46 |
| Tourists making overnight stay per 1000 inhabitants | 435 | 310 | 249 | 261 | 332 | 230 | 531 |
| Revenue from commune budgets (PLN per capita) | 1,201 | 1,354 | 1,249 | 1,459 | 1,123 | 1,430 | 1,486 |
| Paved public roads (km per 100 km2) | 81.2 | 68.3 | 72.3 | 78.6 | 54.6 | 103.2 | 51.1 |
| Railway lines in operation (km per 100 km2) | 6.5 | 4.6 | 4.1 | 5.3 | 3.3 | 6 | 5 |
| Expenditure on R&D activities (PLN per capita) | 135 | 48.6 | 77 | 50 | 43 | 14 | 39 |
| Research and development staff per 1,000 professionally active people | 3.6 | 1.8 | 2.7 | 1.2 | 2.4 | 1.1 | 1.7 |
| Students per 10,000 residents | 512 | 437 | 495 | 374 | 437 | 448 | 430 |
Table 8.
The Synthetic Indicator of Innovation Output in the Regions of Poland in 2005 and 2008 [36].
Table 8.
The Synthetic Indicator of Innovation Output in the Regions of Poland in 2005 and 2008 [36].
| 2005 | 2008 | ||
|---|---|---|---|
| Mazowieckie | 0.88 | Mazowieckie | 0.97 |
| Śląskie | 0.60 | Śląskie | 0.62 |
| Małopolskie | 0.53 | Małopolskie | 0.61 |
| Wielkopolskie | 0.45 | Dolnośląskie | 0.49 |
| Dolnośląskie | 0.42 | Wielkopolskie | 0.49 |
| Pomorskie | 0.41 | Lubelskie | 0.46 |
| Lubelskie | 0.40 | Podkarpackie | 0.42 |
| Podlaskie | 0.38 | Łódzkie | 0.38 |
| Podkarpackie | 0.37 | Pomorskie | 0.37 |
| Łódzkie | 0.35 | Kujawsko-pomorskie | 0.36 |
| Kujawsko-pomorskie | 0.35 | Świętokrzyskie | 0.33 |
| Warmińsko-mazurskie | 0.31 | Podlaskie | 0.30 |
| Świętokrzyskie | 0.28 | Zachodniopomorskie | 0.29 |
| Opolskie | 0.25 | Opolskie | 0.29 |
| Zachodniopomorskie | 0.24 | Warmińsko-mazurskie | 0.28 |
| Lubuskie | 0.22 | Lubuskie | 0.16 |
Table 9.
The Ranking of the Regions of Poland According to the Level of Innovation (Zjy) and the Level of Economic Development (Zjx) Achieved [35].
Table 9.
The Ranking of the Regions of Poland According to the Level of Innovation (Zjy) and the Level of Economic Development (Zjx) Achieved [35].
| Regions | Zjx | Position | Zjy | Position |
|---|---|---|---|---|
| Dolnośląskie | 0.76 | 2 | 0.77 | 2 |
| Kujawsko-pomorskie | −0.63 | 15 | −0.59 | 11 |
| Lubelskie | −0.36 | 11 | −0.81 | 13 |
| Lubuskie | −0.49 | 13 | 0.13 | 7 |
| Łódzkie | −0.13 | 8 | −0.13 | 9 |
| Małopolskie | 0.61 | 3 | 0.05 | 8 |
| Mazowieckie | 1.78 | 1 | 2.54 | 1 |
| Opolskie | −0.36 | 12 | −0.16 | 10 |
| Podkarpackie | 0.27 | 5 | −1.00 | 16 |
| Podlaskie | −0.25 | 9 | −0.70 | 12 |
| Pomorskie | 0.25 | 4 | 0.44 | 5 |
| Śląskie | 0.08 | 7 | 0.50 | 4 |
| Świętokrzyskie | −0.59 | 14 | −0.90 | 14 |
| Warmińsko-mazurskie | −0.77 | 16 | −0.96 | 15 |
| Wielkopolskie | 0.11 | 6 | 0.56 | 3 |
| Zachodniopomorskie | −0.33 | 10 | 0.25 | 6 |
| Specification | Lubelskie | Podkarpackie | Podlaskie | Świętokrzyskie | Warmińsko-Mazurskie | Poland |
|---|---|---|---|---|---|---|
| Rural population (%) | 53.8 | 58.7 | 39.5 | 55.4 | 40.8 | 39.7 |
| Population making a living from agriculture (%), (2008) | 15.3 | 6.4 | 16.0 | 12.1 | 6.5 | 6.8 |
| Agricultural area within total area (%) | 70.5 | 54.1 | 60.4 | 64.6 | 54.4 | 60.0 |
| Forests within total area (%) | 23.7 | 39.0 | 31.6 | 29.0 | 32.7 | 30.5 |
| Production space valuation ratio (point) | 63.7 | 54.9 | 60.0 | 75.4 | 85.0 | 71.1 |
| Number of rural settlement | 4042 | 1666 | 3759 | 2486 | 3875 | 52512 |
| Population per settlement | 282 | 752 | 124 | 278 | 152 | 292 |
Table 11.
Synthetic Indicators of the Potential for Smart Rural Development in the Regions of Poland in 2014–2016 [20,21].
| Voivodeship | Total | Mobility | Natural Environment | Society | Economy | Quality of Life | Management |
|---|---|---|---|---|---|---|---|
| Wielkopolskie | 0.67 | 0.13 | 0.03 | 0.12 | 0.18 | 0.05 | 0.04 |
| Dolnośląskie | 0.65 | 0.10 | 0.05 | 0.16 | 0.20 | 0.06 | 0.08 |
| Śląskie | 0.56 | 0.14 | 0.07 | 0.07 | 0.16 | 0.05 | 0.07 |
| Opolskie | 0.56 | 0.11 | 0.05 | 0.09 | 0.21 | 0.04 | 0.06 |
| Zachodniopomorskie | 0.49 | 0.09 | 0.05 | 0.15 | 0.09 | 0.06 | 0.05 |
| Małopolskie | 0.48 | 0.12 | 0.05 | 0.08 | 0.12 | 0.05 | 0.06 |
| Lubuskie | 0.48 | 0.08 | 0.04 | 0.14 | 0.14 | 0.04 | 0.04 |
| Pomorskie | 0.42 | 0.09 | 0.05 | 0.09 | 0.09 | 0.06 | 0.04 |
| Warmińsko-Mazurskie | 0.37 | 0.04 | 0.03 | 0.11 | 0.09 | 0.04 | 0.06 |
| Podkarpackie | 0.37 | 0.07 | 0.09 | 0.09 | 0.06 | 0.03 | 0.03 |
| Kujawsko-Pomorskie | 0.36 | 0.11 | 0.03 | 0.07 | 0.09 | 0.04 | 0.02 |
| Mazowieckie | 0.34 | 0.07 | 0.01 | 0.06 | 0.14 | 0.04 | 0.02 |
| Łódzkie | 0.34 | 0.08 | 0.00 | 0.08 | 0.13 | 0.02 | 0.03 |
| Podlaskie | 0.33 | 0.06 | 0.01 | 0.09 | 0.13 | 0.03 | 0.01 |
| Lubelskie | 0.28 | 0.05 | 0.01 | 0.10 | 0.07 | 0.01 | 0.04 |
| Świętokrzyskie | 0.27 | 0.06 | 0.03 | 0.08 | 0.04 | 0.02 | 0.04 |
Table 12.
Selected Elements Determining the Socio-Economic Development of the Regions of Eastern Poland in 2015–2017 [20].
Table 12.
Selected Elements Determining the Socio-Economic Development of the Regions of Eastern Poland in 2015–2017 [20].
| Aspect of the Assessment | Indicators | Indicator Values by Territorial Unit Arrangement | |||||
|---|---|---|---|---|---|---|---|
| Poland | The Regions of Eastern Poland | ||||||
| LUB | PODK | W-MAZ | PODL | ŚW | |||
| economy | Gross Domestic Product Per Capita (2015) | 46,814 | 32,074 | 33,176 | 33,179 | 33,272 | 33,841 |
| Registered unemployment rate (2016) | 8.20 | 10.30 | 11.50 | 14.20 | 10.30 | 10.80 | |
| Employment/1000 population (2016) | 240.03 | 179.54 | 206.95 | 196.23 | 186.03 | 187.63 | |
| Proportion of employment in agriculture, forestry, hunting and fishing (2016) | 15.98 | 37.16 | 31.26 | 15.97 | 30.11 | 31.58 | |
| Gross value added per worker in agriculture, forestry, hunting, and fishing, in PLN thousand (2015) | 17.66 | 10.44 | 4.35 | 32.78 | 17.87 | 9.95 | |
| Entities entered in the REGON register/10,000 population (2016) | 1,102.62 | 816.20 | 788.42 | 865.29 | 842.36 | 886.97 | |
| Proportion of entities from rural areas in total entities entered in the REGON register (2016) | 27.15 | 37.14 | 43.05 | 29.04 | 26.58 | 39.07 | |
| EU funding for programmes and projects per capita (2016) | 28.10 | 28.45 | 40.76 | 27.56 | 25.70 | 31.36 | |
| innovativeness | Internal expenditure on R&D per capita (2016) | 466.9 | 292.60 | 358.70 | 115.00 | 149.50 | 106.90 |
| Average proportion of innovative enterprises within the total number of enterprises (2016) | 16.1 | 22.9 | 18.0 | 9.1 | 11.5 | 10.4 | |
| Proportion of expenditure on innovative activity in enterprises within national expenditure (2016) | 100.0 | 1.6 | 4.4 | 0.6 | 1.1 | 0.8 | |
| Expenditure on innovative activity in enterprises per 1 professionally active person (2016) | 2,260.19 | 669.66 | 1,885.20 | 387.55 | 829.55 | 532.17 | |
| Industrial enterprises cooperating in innovative activity as a % of total enterprises (2016) | 6.70 | 7.21 | 9.64 | 4.99 | 6.33 | 4.74 | |
| Industrial enterprises with 10–249 employees working as part of a cluster initiative, or other formalised cooperation, as a % of innovation-active enterprises (2016) | 10.08 | 18.87 | 24.29 | 5.22 | 11.11 | 12.26 | |
| Enterprises electronically exchanging supply-chain-management information with suppliers or customers as a % (2017) | 21.2 | 23 | 21.2 | 20.1 | 19.9 | 19.5 | |
| society | Average monthly disposable income per person (2016) | 1,474.56 | 1,299.14 | 1,134.10 | 1,371.79 | 1,419.83 | 1,305.96 |
| Average gross monthly salary (2016) | 4,290.52 | 3,815.95 | 3,653.67 | 3,619.16 | 3,767.20 | 3,669.57 | |
| Percentage of people in the household below the minimum subsistence limit (2016) | 4.90 | 7.80 | 8.80 | 9.00 | 4.20 | 7.50 | |
| Persons aged 16 to 74 using public-administration services via the Internet in the last 12 months (2016) | 30.22 | 28.52 | 25.46 | 24.99 | 27.94 | 22.59 | |
| Beds in general hospitals/10,000 population (2016) | 48.55 | 52.76 | 48.61 | 47.04 | 50.77 | 50.38 | |
| Natural population change/1000 population by place of residence (2016) | −0.10 | −1.23 | 0.54 | −0.44 | 0.76 | −2.66 | |
| Pre-working-age population/100 working age people (2016) | 29.01 | 28.79 | 29.21 | 29.15 | 27.69 | 27.08 | |
| University graduates/10,000 population (2016) | 94.81 | 96.83 | 84.68 | 63.95 | 79.44 | 63.91 | |
| Net inter-voivodeship migration for permanent residence/1000 inhabitants (2016) | - | −2.09 | −0.96 | −1.88 | −1.32 | −1.57 | |
| Net foreign migration for permanent residence/1000 inhabitants (2016) | 0.04 | 0.18 | 0.19 | -0.19 | 0.23 | 0.18 | |
| space | Population/1 km2 (2016) | 123.00 | 84.92 | 119.22 | 59.42 | 58.78 | 106.99 |
| Hard-surfaced roads/100 km2 (2016) | 94.10 | 87.40 | 93.30 | 55.30 | 65.10 | 122.10 | |
| Passenger cars/1000 population (2016) | 563.98 | 541.92 | 507.45 | 505.81 | 485.19 | 524.94 | |
| Proportion of legally protected areas within the total area (2016) | 32.52 | 22.75 | 44.90 | 46.72 | 31.65 | 64.63 | |
Table 13.
The Ranking of Voivodeships According to Hellwig’s Synthetic Indicator of Development in 2005, 2010, and 2017 [33].
Table 13.
The Ranking of Voivodeships According to Hellwig’s Synthetic Indicator of Development in 2005, 2010, and 2017 [33].
| No. | 2005 | 2010 | 2017 | |||
|---|---|---|---|---|---|---|
| Voivodeship | Measure | Voivodeship | Measure | Voivodeship | Measure | |
| 1 | łódzkie | 0.638 | śląskie | 0.687 | mazowieckie | 0.718 |
| 2 | wielkopolskie | 0.541 | mazowieckie | 0.582 | małopolskie | 0.595 |
| 3 | mazowieckie | 0.512 | łódzkie | 0.533 | dolnośląskie | 0.584 |
| 4 | kujawsko-pomorskie | 0.459 | dolnośląskie | 0.484 | wielkopolskie | 0.522 |
| 5 | opolskie | 0.430 | małopolskie | 0.482 | śląskie | 0.467 |
| 6 | warmińsko-mazurskie | 0.364 | wielkopolskie | 0.397 | pomorskie | 0.417 |
| 7 | śląskie | 0.358 | opolskie | 0.387 | łódzkie | 0.393 |
| 8 | dolnośląskie | 0.355 | zachodnio-pomorskie | 0.356 | zachodnio-pomorskie | 0.378 |
| 9 | małopolskie | 0.251 | lubelskie | 0.278 | lubelskie | 0.273 |
| 10 | zachodniopomorskie | 0.238 | świętokrzyskie | 0.272 | opolskie | 0.256 |
| 11 | podlaskie | 0.233 | podkarpackie | 0.241 | podlaskie | 0.243 |
| 12 | podkarpackie | 0.223 | pomorskie | 0.236 | kujawsko-pomorskie | 0.241 |
| 13 | pomorskie | 0.199 | warmińsko-mazurskie | 0.232 | świętokrzyskie | 0.221 |
| 14 | świętokrzyskie | 0.177 | kujawsko-pomorskie | 0.169 | lubuskie | 0.195 |
| 15 | lubuskie | 0.103 | lubuskie | 0.116 | warmińsko-mazurskie | 0.121 |
| 16 | lubelskie | 0.044 | podlaskie | 0.054 | podkarpackie | 0.076 |
| Voivodeship | Total Funds Raised in PLN Milion | The Value of Funds Raised in PLN | ||
|---|---|---|---|---|
| Per km2 | Per ha of Agricultural Land | Per Capita | ||
| lubelskie | 19085.40 | 759.7 | 1387.3 | 8964 |
| podkarpackie | 7843.1 | 439.5 | 1342.8 | 3686 |
| podlaskie | 14313.4 | 685.8 | 132.6 | 12079 |
| świętokrzyskie | 7879.1 | 672.7 | 1577.5 | 6102 |
| warmińsko-mazurskie | 11072.6 | 458.1 | 1084.4 | 7716 |
| dolnośląskie | 10847.2 | 543.8 | 1175.3 | 3738 |
| kujawsko-pomorskie | 15095.5 | 839.9 | 1434.5 | 7247 |
| lubuskie | 5320.4 | 380.4 | 1304.3 | 5231 |
| łódzkie | 12445.6 | 683.1 | 2579.4 | 5018 |
| małopolskie | 6158.4 | 405.6 | 1102.9 | 1819 |
| mazowieckie | 28949.0 | 814.1 | 1522.1 | 5388 |
| opolskie | 5961.4 | 633.4 | 1139.6 | 6016 |
| pomorskie | 11075.6 | 605.2 | 1500.1 | 4784 |
| śląskie | 5204.4 | 422.0 | 1360.2 | 1143 |
| wielkopolskie | 24198.4 | 811.3 | 1384.2 | 6944 |
| zachodnio-pomorskie | 11095.0 | 486.7 | 1325.9 | 6500 |
| Poland | 196543.1 | 628.6 | 1345.3 | 5715 |
Publisher’s Note: MDPI stays neutral with regard to jurisdictional claims in published maps and institutional affiliations. |
© 2021 by the author. Licensee MDPI, Basel, Switzerland. This article is an open access article distributed under the terms and conditions of the Creative Commons Attribution (CC BY) license (http://creativecommons.org/licenses/by/4.0/).
Share and Cite
MDPI and ACS Style
Adamowicz, M. The Potential for Innovative and Smart Rural Development in the Peripheral Regions of Eastern Poland. Agriculture 2021, 11, 188. https://0-doi-org.brum.beds.ac.uk/10.3390/agriculture11030188
AMA Style
Adamowicz M. The Potential for Innovative and Smart Rural Development in the Peripheral Regions of Eastern Poland. Agriculture. 2021; 11(3):188. https://0-doi-org.brum.beds.ac.uk/10.3390/agriculture11030188
Chicago/Turabian StyleAdamowicz, Mieczysław. 2021. "The Potential for Innovative and Smart Rural Development in the Peripheral Regions of Eastern Poland" Agriculture 11, no. 3: 188. https://0-doi-org.brum.beds.ac.uk/10.3390/agriculture11030188
Note that from the first issue of 2016, this journal uses article numbers instead of page numbers. See further details here.