
Regional Differences in Benefits from the EU Common Agricultural Policy in Poland and Their Policy Implications


Faculty of Economics, Poznan University of Life Sciences, Wojska Polskiego 28, 60-637 Poznań, Poland
*
Author to whom correspondence should be addressed.
Agriculture 2021, 11(4), 288; https://0-doi-org.brum.beds.ac.uk/10.3390/agriculture11040288
Submission received: 23 February 2021
/
Revised: 16 March 2021
/
Accepted: 23 March 2021
/
Published: 27 March 2021
(This article belongs to the Special Issue Agricultural Policy and Farmer Behavior)
Abstract
:Although the beneficial impact of Common Agricultural Policy (CAP) on the stabilization on farming income is undisputable, the distribution of benefits derived from the CAP between operators and regions gives rise to some controversy. The objective of this paper was to estimate regional differences in the benefits derived from the Common Agricultural Policy in Poland based on the partial equilibrium model of the European Union (EU) agricultural sector with simulated interventions. The expectations of farmers from different regions of Poland were represented as a non-cooperative game to define vectors of change in the agricultural policy. The theory of moves was applied to set the game between different groups of farmers. Our results demonstrate that both the 1st and the 2nd pillars of the CAP were more profitable to farmers from regions with a more advantageous agrarian structure and a higher agricultural potential compared to their peers from the regions with a fragmented agriculture. However, considering long-term development objectives of the Polish agriculture, the theory of moves outcome argues against compensating for these differences by increasing redistributive payments to farmers in less favorable regions. To prevent widening of regional differences and ensure the social and economic development of rural areas in regions with less favorable agrarian structures where agriculture is currently unable to compete, it would be critical to enhance conditions for alternative types of economic activities.
1. Introduction
Supporting the incomes of agricultural producers is among the key goals of the European Union’s (EU) Common Agricultural Policy (CAP). Support is provided under what is referred to as the two pillars of the Policy—the first pillar comprises direct payments for farmers and market intervention whereas the second pillar supports financing for projects that contribute to rural development in broad terms. Today, market intervention measures taken under the first pillar are of minor importance. In practice, they boil down to what is referred to as the safety net, which means that they are put in place only in emergency situations or if the market is severely affected by a disturbance. Conversely, direct payments, which account for an average of nearly 60% of incomes, are the main instrument that supports farmers’ incomes under the first pillar. In the agricultural support system, they play a key role implied by the goals they are supposed to fulfill, including supporting the incomes of agricultural producers; offsetting the costs incurred in complying with environmental requirements; and maintaining land in good agricultural condition. In order to ensure effective support for farmers in a way aligned with national conditions, member states can combine different schemes of direct payments. Some of these schemes are mandatory while others are optional. In every EU country, mandatory schemes include the basic payment (which can take the form of the basic payment scheme or the single area payment scheme), the greening payment and the payment for young farmers. In turn, voluntary schemes are chosen by member states and include support for areas facing natural constraints, production-related support and the redistributive payment. In each EU country, the types and structure of these additional payments depend on strategic plans for agricultural development, and their choice is often guided by political motives. In the Polish agriculture, the average farm area is 10.3 ha and more than half of farms (52.3%) have an area below 5 ha; this confers particular importance on the redistributive payment (Detailed description of Polish agriculture, including: its productivity, factors of productions and regional differentiation has been presented by Baer-Nawrocka and Poczta [1] and Prus et al. [2]). In accordance with principles adopted in all EU states, a maximum of 30% of the national ceiling for funds used in supporting farmers’ incomes can be allocated to redistributive payments. The number of hectares which makes a farm eligible for the payment is limited on a per country basis (30 hectares or the average farm size in the country concerned, if over 30 hectares). Set by each EU country, the amount per hectare cannot exceed 65% of the average payment per hectare [3]. Currently in Poland, the payment is available to all farms with an area of 3 to 30 ha, and is disbursed based on the area of land eligible for the single area payment (however for no more than 27 ha per farm). The purpose of the payment is to reduce the differences in the amount of aid granted between the farms. The differences are due to the fact that the amount of support provided under the basic payment is prorated to the area of the farm’s agricultural land.
The second pillar of the CAP serves a restructuring purpose. It enables accessing additional financial support for planned activities focused on rural and agricultural development in accordance with rural development programs set by each Community country. Support is provided for co-financing development projects implemented by rural residents, and the way it is used largely depends on how active are the potential beneficiaries [4].
Although the beneficial impact of CAP on the stabilization on farming income is undisputable, the distribution of benefits derived from the CAP between operators and regions gives rise to some controversy. This issue is particularly important in Poland, which demonstrates spatial polarization of farms and great differences in agrarian structure between regions. This is manifested by small, economically disadvantaged farms forming by far the largest group; they are mostly located in southeastern voivodeships. Conversely, those found in northern and western voivodeships demonstrate a much more sound economic and area structure. Currently, the strategic development plan of Polish agriculture for the years 2021–2027 is being constructed. The initial version of the first part of the plan has been revealed for public consultations. It is clearly visible from the proposal, that a strong emphasis has been put on supporting small farms. However, so far not clear regional delimitation in funds distributions have been proposed.
Determining, on a comprehensive basis, the impact of the CAP on differences in rural and agricultural development between regions is important for guiding the agricultural policy in Poland. It shows the outcomes of the policy in place and can thus serve as an indicator of what are the farmers’ preferences to the changes in the form and scope of intervention in different regions. From a theoretical perspective, the differences in preferences can be analyzed using some tools of the game theory. Indeed, the outcome of the game (equilibrium) indicates a consensus in the beneficiaries’ expectations. As Ordeshook [5] states, ‘in game theory, an equilibrium is a prediction, for a prespecified circumstance, about the choices of people and the corresponding outcomes’.
The purpose of this paper was to estimate regional differences in benefits derived from the CAP in Poland, based on simulated changes in intervention forms under the 1st and 2nd pillar of the CAP, and to present in the form of a non-cooperative game the potential expectations of farmers from different Polish regions as vectors of change in the agricultural policy. CAPRI (Common Agricultural Policy Regionalized Impact), a partial equilibrium model for the agricultural sector, was used in examining the effects of changes to intervention measures taken under the 1st and the 2nd pillar of the CAP. The use of a unified method in assessing the effects of simultaneous impacts of the 1st and the 2nd pillar of the CAP allows to consistently identify the differences in farmers’ preferences between the regions and to use this information in the non-cooperative game. The analysis aims to identify a coherent position of farmers from different Polish regions vis-à-vis the selected support tools under the CAP.
The outline of the paper is as follows. First, we present the research method. Next, we present the literature review on the impact of the CAP in regional dimension. Finally, we demonstrate the results of the CAPRI model simulations and the theory of moves game. Based on that we conclude with a discussion.
2. Materials and Methods
CAPRI is a model widely used in the literature in estimating the effects of different scenarios of changes to the CAP [6,7,8,9,10,11,12,13,14,15,16]. It gives the ability to simulate production outcomes and incomes of agricultural producers under the assumption that the farming sector is in an equilibrium state. One major advantage of CAPRI is the ability to carry out analyses at NUTS—Nomenclature of Territorial Units for Statistics 2 level which enables analyzing regional effects of simulated changes to the CAP.
Based on the model’s database, having in mind the forecasts of the situation in the global agricultural market by OECD—The Organisation for Economic Co-operation and Development, FAO—The Food and Agriculture Organization and DG-AGRI—The Directorate-General for Agriculture and Rural Development, and taking into consideration user-defined scenarios of changes to the Common Agricultural Policy, the authors determine the trend functions. Following this, the results of these estimations are calibrated by two main modules—the supply module and the market module. The supply model includes nonlinear optimization models developed for a group of representative farms. These models maximize the farming income at a given price level, under the assumption that the available productive inputs are used optimally. The prices, in turn, are the outcome of the market model which assumes that the agricultural market (CAPRI determines the equilibrium for 47 unprocessed and 29 processed agricultural products in 77 countries and 40 trade blocks. CAPRI takes into account processed products in international trade flows. This is an indisputable advantage as these products have an increasingly large share in international trade [17]) is balanced upon taking trade flows into consideration. The model-based analysis boils down to examining the farms’ response to changes in prices of agricultural produce, as predicted in the market module [17].
In this paper, the farmers’ benefits derived from the CAP in each region are determined based on changes in the farmers’ unit incomes in the simulated changes to intervention forms (CAP change scenarios) against the base scenario in which intervention remains unchanged. The first scenario consisted in discontinuing the 1st pillar of the CAP which includes direct payments for farmers and market intervention. In the second scenario, instruments established under the 2nd pillar (rural development funds) were discontinued. In turn, the third scenario consisted in a total dismantling of the CAP.
Although the CAP has positively changed over the years to become a more market-oriented policy, for many observers a sectorial, distributive policy directed to a chosen economic group (farmers) remains controversial. This feeling is supported by the high budgetary cost of the policy and its constant critique by WTO—World Trade Organization. The second pillar, although more accepted internationally, remains less accepted by the EU farmers. Clearly, farmers prefer support including intervention and direct payments, rather than the rural development policy, as the former does not require co-financing yet guarantees stable incomes. Thus, the future of the CAP is being constantly a subject of public debates and disagreements on national, EU and global level. For this reason we decided to analyze all possible major of changes of the policy including its total liquidation and the separate removal of its two pillars.
The changes in incomes, retrieved from the CAPRI model, were used as a basis for developing a game theory model illustrating the possible conflict between farmers operating in regions that derive greater or smaller benefits from CAP support. Two alternative methodological approaches were adopted—the classic theory of non-cooperative games and the theory of moves introduced by Brams [18]. The solution of the non-cooperative game is the Nash equilibrium whereas the theory of moves results in what is referred to as the nonmyopic equilibrium. In accordance with the theory of moves, a game in its normal form can be converted into a dynamic game. This is done by using the backward induction mechanism. Based on possible pay-offs, the players can decide whether or not to change their strategy to attain a more advantageous state. The TOM—Theory of Moves allows players starting at any outcome in a payoff matrix (an intersection of a row and a column of a payoff matrix), to move and countermove within the matrix, thereby capturing the changing strategic nature of games as they evolve over time. The game is different when play starts in a different state, but the payoff matrix remains unchanged. A play of a game starts in an initial state, at which players accrue payoffs only if they remain in that state so that it becomes the final state, or outcome, of the game. If they do not remain in the initial state, they still know what payoffs they would have accrued had they stayed; hence, they can make a rational calculation of the advantages of staying or moving [18]. Therefore, that theory answers the question if, starting from the existing condition and continuing the game by predicting the behavior of other players, the player is able to attain a greater profit (for a detailed description of the method, see [18]). Just like in the case of classic non-cooperative games, the pay-offs in the theory of moves are expressed as ordinal utilities.
Authors who used the theory of moves in analyzing public choice conflicts include Brams [19], Kiryluk-Dryjska [20], Simon [21] and Zeager and Bascom [22]. As mentioned earlier, the preference system of the game theory used in this paper is based on the results provided by the CAPRI partial equilibrium model. Examples of an integrated use of these methods in predicting the reforms to the European Union’s agricultural policy are also presented in Kiryluk-Dryjska and Baer-Nawrocka [6] and Baer-Nawrocka et al. [23].
3. Literature Review
CAP is one of the most important policies of the EU, having for decades occupied the major share of the EU’s budget and has had profound effects on farm structures, agricultural employment and rural areas, as well as wider economic, social, political, environmental and cultural implications, for EU member states [24]. Due to numerous controversies raised by the CAP, it is important that the decisions taken within its framework are supported by comprehensive analyzes, taking into account forecasts of various aspects as well as the effects of its changes.
Findings from research on how the CAP impacts the differences in rural and agricultural development between regions are not consistent. For instance, according to Esposti [25] and Heiko and Herrmann [26], the CAP narrows the gap between EU regions whereas [27,28,29] claim the contrary. Some authors [26,30,31] emphasize that the discrepancies between the estimations of CAP effects are due to different methodology approaches being used in assessing its impacts. Bradley [32] discussing different methodological approaches of measuring impact of structural polices, stressed the importance of bottom-up microanalysis. Sierhej [31] underlined that post econometric analysis show weaker—if any—impact, while ex ante economic models suggest stronger positive effects. Moreover, the findings usually focus on one of the CAP pillars. In Poland, the investigation into regional effects is mostly based on an ex-post analysis of the amounts and uses of direct payments received by farms in different regions [33,34,35] and on assessing the activity of potential beneficiaries in applying for support under the second pillar [29,36,37].
The current studies on the second pillar funds’ absorption in Polish agriculture [37,38] demonstrate that farms with higher than average production potential—in terms of land and total assets—benefit from EU investment funds more than smaller agricultural holdings. Some studies revealed also important regional differences in funds allocation [37,39,40]. Kiryluk-Dryjska et al. [29] demonstrated that the level of local agricultural potential is strongly related to the absorption of the CAP’s II pillar funds, including measures that were designed to diversify rural economies and increase the quality of life in rural areas. Kiryluk-Dryjska and Więckowska [41] showed that the policy toward farm diversification in Poland favors areas of better developed agricultural structures. Similar results were presented by Sadowski and Wojcieszak [42] in relation to agritourism. They demonstrated that obtaining funding for this type of activity is more frequent in areas where larger family farms predominate, rather than in areas featuring special natural or cultural values.
The economic impacts of direct payments included in first pillar is also a widely studied in the literature. A wide review of academic literature on the economic impacts of direct payments on agricultural incomes present Szerletics and Jámbor [43]. Sadłowski [44] simulated the impact of additional direct payments on the average amount of premiums per agricultural holding in Polish voivodeships. The research demonstrated that this payment would particularly increase the average level of support for agricultural holdings in central and central-east Poland. Smędzik-Ambroży [45] researched the influence of the subsides on the level of socio-economic sustainability of farms in Poland. They concluded that the impact of subsidies was uneven in various economic size classes of farms—the strongest farms benefited the most, which means that social sustainability in terms of the distribution of income has not been achieved.
Equilibrium models are applied in the effects projection under the influence of changes in various sectorial policies, including energy policy [46], fiscal policy [47], or services sector [48]. A wide application of these models is also involved for prediction of effects in agricultural sector, and their role within this field systematically increases [49,50,51]. At the level of the EU it is connected, inter alia, with the fact that before making final decisions about the changes in agricultural policy of the EU there is an indispensability of conducting the analysis of potential expenditures and profits of their implementation in the field of economic, social and environmental effects [52]. A wide section of both general and partial equilibrium models application in agricultural sector presented Conforti [53], Tongeren et al. [54], Balkhausen [55] and Garforth and Rehman [56]. The most often applied general equilibrium models in the projection of the CAP changes are: GTAP, WTO Housemodel, MEGABARE, GREEN, LINKAGE, INFORUM, GTEM and RUNS. Among partial equilibrium models, next to CAPRI, are: AGLINK, ESIM, AGMEMOD, CAPSIM, FAPRI and SWOPISM. They differ between each other in the aggregation degree in spatial approach, in the number of analyzed markets, in the method of estimating the parameters and in the type of a model (static or dynamic). As Adenauer [57] emphasizes, the regional approach is, undoubtedly, a strong feature of the CAPRI model, because most of the models of this type include merely national scale. The regional approach also applies to some other models, for example POMMARD model, which explore the relationships between agricultural multifunctionality, territorial rural development and quality of life and the impacts of different kinds of policies on these relationships [58] or DERREG model an interpretative model for anticipating and responding to challenges for regional development in an evolving international context [59]. As CAPRI is a supply model it well covers the production side of the policy. However, game theoretical applications as presented in the paper, might be also used with other models simulating the economic, social and environmental impacts of different future policy scenarios in different rural contexts.
One of the advantages of CAPRI model applied in the paper is a possibility of determining, on a comprehensive basis, the impact of the CAP on regional differences while changing two pillars of the policy. Simulation of different scenarios of potential effects on agricultural income and development possibilities of regions with different production potential can contribute to a better tailored national adaption. Moreover, understanding of the interactions among players and predicting policy results based on benefits redistribution can give a contribute on to the understanding of the decision- making process of the CAP.
4. Results
Table 1 presents the percentage changes of farming income against status quo in the following cases—the 1st pillar is discontinued (scenario 1); the 2nd pillar is discontinued (scenario 2); and the CAP is totally dismantled (scenario 3). The results are calculated by the CAPRI model as described in the method part of the paper. The trends functions in the model were determined by the model database and the adopted forecasts of macroeconomic indicators and the global agricultural market published by European Commission in Prospects for EU agricultural markets and income 2016–2026, in accordance with OECD-FAO forecast for years 2016–2025 [60].
According to these data, the dismantling of the CAP would result in a nearly 30% decline in incomes of Polish farmers. The decline would mostly result from the discontinuation of the 1st pillar of the CAP (23%), whereas the discontinuation of the 2nd pillar of the CAP would entail a 6% drop in farming income on a countrywide basis. Hence, the results confirm that the 1st pillar plays a key role in supporting the incomes of the Polish farming sector. It is therefore reasonable to believe that when considering the possible scenarios of change to the CAP, the farmers will be particularly interested not only in keeping the 1st pillar but also in a possible increase of support provided under it, especially including direct payments.
When analyzing the consequences of discontinuing the 1st pillar, it can be concluded that the sharpest decline in incomes (by 25% or more) would be experienced in the Zachodniopomorskie, Lubuskie and Pomorskie voivodeships, followed by the Kujawsko-Pomorskie, Dolnośląskie, Opolskie and Warmińsko-Mazurskie voivodeships (by 24%). Located in the northern and western parts of Poland, they demonstrate a relatively favorable farm structure (compared to other regions) and have the largest share of farms with an area of 50 ha or more (Table 2) which use most of the region’s utilized agricultural area. Upon discontinuing the 1st pillar, a decline in incomes would also be recorded in voivodeships located in southeast Poland (i.e., the Podkarpackie, Małopolskie and Śląskie voivodeships), which demonstrate a fragmented agrarian structure dominated by the smallest farms (up to 5 ha). In these regions, concentration is adversely affected by multiple historical, economic and socio-cultural factors rooted both in agriculture itself and in its environment. In turn, such voivodeships as Podlaskie, Mazowieckie and Wielkopolskie, with a large share of economically strong family farms, would face the smallest reduction in incomes upon removing the 1st pillar.
Based on the analysis of changes in farming income in scenario 1, it can be concluded that support provided under the 1st pillar has the greatest impact on the economic situation of farmers located in regions which are home to physically larger farms (as they derive benefits from the coupling between direct payments and farm area). In regions with a fragmented agrarian structure, direct payments (including the redistributive payment) currently account for a large share in incomes. This means the farms located there also enjoy relatively large benefits from the payments, though not as much as their peers based in the northern and western parts of Poland.
The analysis of scenario 2 provides grounds for concluding that discontinuing the 2nd pillar would have the most severe consequences for agricultural producers based in the Lubuskie, Zachodniopomorskie, Pomorskie, Wielkopolskie and Warmińsko-Mazurskie voivodeships. Conversely, the discontinuation of support under the 2nd pillar would have the least effect on farmers based in the southern part (Świętokrzyskie, Małopolskie, Śląskie and Opolskie voivodeships) and central-eastern part of Poland (Mazowieckie and Łódzkie voivodeships). It is thus clear that the outcomes of support under the 2nd pillar are largely affected by the agrarian structure.
It follows from the simulations that Polish farmers derive benefits from the CAP irrespective of the region they operate in. However, both the 1st and the 2nd pillar of the CAP are more profitable to farmers from Polish regions with a more advantageous agrarian structure and a higher agricultural potential (northwestern regions of Poland) than to their peers based in regions with a fragmented agriculture (southeast Poland). Uneven effects of support can give rise to controversy and can provide grounds for claims from farmers established in regions demonstrating a smaller production potential (with a less favorable agrarian structure) which is not enough to generate an adequate level of incomes. These claims can mostly take the form of pressures to increase the redistributive payment in the EU’s new financial perspective.
Based on the results of simulations, when determining the farmers’ potential expectations towards the CAP, the farmers’ demand to increase funding under both the 1st and the 2nd pillar was found to be reasonable (both pillars have a positive impact on incomes). However, considering the differences in benefits derived from the CAP, the demand to increase the redistributive payment for small farms was used as an additional strategic option for farmers based in regions with a smaller production potential. Having in mind the EU’s regulations on the acceptable level of financing (expressed as a percentage of the national ceiling) and the acceptable payment rate (expressed as the percentage of the average national amount of payment per hectare), it can be concluded that Poland is able to increase the financing level of the redistributive payment, which would result in increasing the payment rate. According to a study by Sadłowski [62], in 2015–2019, the amounts disbursed through that instrument to the Polish agriculture grew each year, reaching an annual average level of ca. 8.5% of the national ceiling (the maximum acceptable level being 30%). The redistributive payment rate in that period varied in the range of 40 to 42 EUR/ha whereas the average national payment per hectare was EUR 244.05. Hence, the redistribution payment rate could increase, though not above 158.63 EUR/ha (so as not to exceed 65% of the average national payment per hectare and 30% of the national ceiling). Moreover, Poland set a limitation on the eligibility of farms with an area of (0; 3] hectares for the redistribution payment. When designing the redistributive payment at national level, medium-sized farms were set as the target group for aid distributed through that instrument. Although achieving smaller economies of production scale than the largest ones, medium farms still have a considerable development potential [63]. Therefore, the decision was made that farms with an area of agricultural land falling within the interval (0; 3] will be non-eligible for the redistributive payment. This, too, provides room for changes.
When anticipating the preferences of the two farmer groups covered by this analysis based on the results of the CAPRI model, we assume that the best strategic option for farmers from regions with a greater production potential would be to increase the funds disbursed under the 1st pillar while not agreeing to an increase in the redistributive payment for small farms. An increase in funds disbursed under the 1st pillar would be more beneficial to the farmers than an increase in funds disbursed under the 2nd pillar which translates into only a few percent increase in incomes (Table 1). It would be even more beneficial for them if it would result in increasing only the single payment. The second best option would be to increase the funds available under the 1st pillar while also increasing the redistributive payment. Indeed, that option would restrict their ability to apply for additional support under the 2nd pillar (however, the increase in incomes through direct payments, even with redistribution, would compensate them for that loss). The least advantageous option for them would consist in only increasing the funds offered under the 2nd pillar while increasing the redistributive payment for small farms.
When it comes to farmers based in regions with a smaller production potential, the most beneficial option would also be to increase the funds disbursed under the 1st pillar (offering greater benefits than the 2nd pillar) while concurrently increasing the redistributive payment for small farms. The least advantageous option for them would consist in increasing the funds offered under the 2nd pillar without providing additional redistributive payment. Table 3 presents a pay-off matrix of the non-cooperative game based on the preferences discussed above. It enables a logical analysis of positions adopted by farmers in the negotiation process. The matrix was created based on ordinal utilities, with 4 and 1 corresponding to the greatest and the smallest utility, respectively.
In the non-cooperative game model developed in this study, the demand to increase the funds available under the 1st pillar is the dominant strategy (due to greater benefits being derived by both farmer groups covered by the 1st pillar in this analysis). The Nash equilibrium for this game is the state (3, 4), which means increasing the funds disbursed under the 1st pillar and increasing the redistributive payment for small farms.
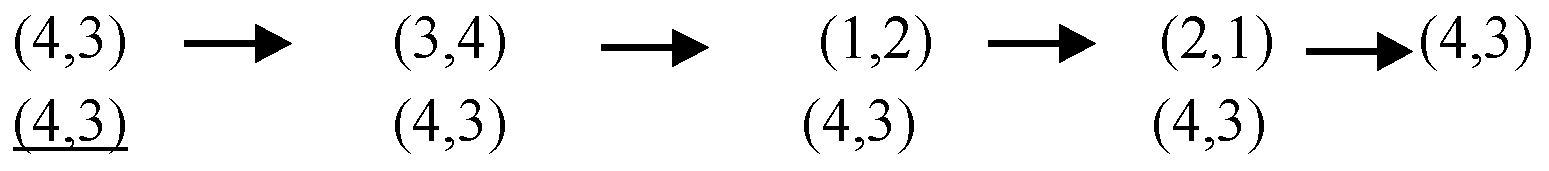
In determining the nonmyopic equilibrium, the assumption was made that the game starts in (4, 3), where the farmers demand that funds available under the 1st pillar be increased while keeping the existing extent of the redistributive payment. That state was chosen because it best corresponds to the current situation. Next, in accordance with the theory of moves ‘either player can unilaterally switch its strategy and thereby change the initial state into a new state, in the same row or column as the initial state. The second player can respond by unilaterally switching its strategy, thereby moving the game to a new state. The alternating responses continue until the player whose turn is to move next chooses not to switch its strategy. When this happens, the game terminates in a final state, which is the outcome of the game [18]. Thus, sequential transitions from the initial state lead to a nonmyopic equilibrium which, in the analyzed game, will be a consensus in the beneficiaries’ expectations.
The state (4, 3) is relatively beneficial to the players: this is where player 1 (farmers operating in regions with a greater production potential) reaches its maximum utility and where player 2 reaches is second greatest utility. As a consequence, player 1 will not endeavor to leave that state. According to the theory of moves, an attempt to move can be made by player 2 who might try to improve its results. However, backward induction shows that if player 2 (farmers operating in regions with smaller production potential) leaves the state (4, 3), then—considering the preference structure identified in this study—any subsequent changes in players’ strategies will result in coming back to the initial state. Figure 1 illustrates backward induction and shows the progression of moves, starting from state (4, 3) and cycling back to this state.
Whoever is the first to change its strategy, the same result is attained—support available under the 1st pillar is increased whereas the redistributive payment remains at its current level. That outcome does not coincide with the Nash equilibrium.
The theory of moves offers a different basis for making individualistic calculations of noncooperative game theory compared to the standard theory. It explains strategically the progression of states that lead to a more permanent outcome. If the game starts (as in the analyzed case) in a state, at which players accrue payoffs and they remain in that state, it becomes the outcome of the game.
5. Discussion and Conclusions
It follows from the simulations that the benefits Polish farmers derive from the CAP vary significantly across regions. Despite the redistributive payment, regions with a greater potential (mostly including the territories with a larger average farm area) derive more benefits from the CAP than regions with a smaller potential. This is true for both the 1st and the 2nd pillar of the CAP.
In a hypothetical game between farmers operating in regions differing in agricultural potential, the Nash equilibrium corresponds to a state in which funds available under the 1st pillar are increased along with an increase in the redistributive payment. Due to a large number of small farms in Poland, it seems that addressing these preferences is the government’s current goal. However, while the nonmyopic equilibrium (attained as a result of applying the theory of moves) involves increasing the funds available under the 1st pillar, it does not provide for any further increase in the redistributive payment. Hence, the structure of area payments should remain as is. This solution seems more desirable from the perspective of the restructuring in the Polish agriculture which struggles with a basic problem of low production concentration resulting from a disadvantageous agrarian structure. Indeed, agrarian structure—a factor of direct relevance to farms—plays a key role in forming the characteristics of the agricultural sector. The experience of different highly developed countries around the world shows that the impacts of agrarian transformation were mostly focused on improving farming productivity. In turn, long-term productivity improvements in the agriculture make it possible to transfer the resources (mainly including labor) to more efficient sectors. The ultimate consequence is an increase in productivity across the entire national economy. The desired final outcome of that process is a high level of productivity in agriculture which absorbs a small share of the total number of employed in the national economy [64]. Despite the ongoing transformation, the Polish agrarian structure is highly fragmented. A large part of land continues to be managed by physically and economically small farms that are incapable of renewing their assets. This hampers the absorption of state-of-the-art solutions designed to improve efficiency. As emphasized by Sadowski [65], in addition to being inefficient and non-competitive, most physically small operators are often unfriendly to the environment.
Therefore, unfocused support in Polish agriculture will improve neither the market position nor the development opportunities of smaller operators. Quite the contrary—it can make them dependent upon CAP instruments and can serve only a social function. Moreover, dispersing the support under the CAP will threaten family farms that follow a development path; it will therefore have an adverse effect on the direction and pace of restructuring.
Some critical opinions on unfocused support for farms can also be found in the literature. For instance, according to Rembisz [66], in the case of excessive support for farms, the political rent replaces the economic rent and has a detrimental effect on farm efficiency. The adverse impact of payments on productivity was also pointed out by Ciaian and Swinnen [67], Hennessy [68], Zhu and Lansink [69] and Zhu et al. [70], whereas Tocco et al. [71] and Van Herck et al. [72] demonstrated that excessive payments slow down the agricultural restructuring. In this context, it is not advisable to further increase the redistributive payment; the nonmyopic Brams equilibrium for this game better addresses the needs of the Polish agriculture than the Nash equilibrium.
In turn, what comes as a worrying finding, regions with a small potential also derive smaller benefits from the 2nd pillar than regions with a greater potential. Farms operating there do not have enough potential to meet market requirements, and should therefore be better positioned to access the benefits offered under the 2nd pillar of the CAP, including diversification and professional reorientation. The model results for the 2nd pillar presented in this paper are consonant with a research by Kiryluk-Dryjska [29] who demonstrated that the group of farmers who applied for measures under the 2007–2013 RDP was much smaller in southern and eastern Polish regions than in northwestern voivodeships which have a greater farming production potential. The issue of negative selection in the 2nd pillar of the CAP consists in that owners of stronger farms, often located in regions with better conditions for agricultural development, derive greater benefits from structural programs, is not only specific to Poland. It was also pointed out by Camaioni et al. [73], Crescenzi et al. [74], Bonfiglio et al. [75], Chaplin et al. [76] and Zasada et al. [77]. The results of the studies demonstrate that in more remote and lower-income locations, where RDP are most needed, the programs’ performance has been relatively modest. However, considering the major significant differences in agricultural characteristics between Polish regions, this is particularly worrying as it reflects a mistargeting of the policy.
What may give rise to some doubts in this analysis is that the preferences of farmer groups from different regions are based on generalized model results. In the real world, commercial farms can be found in regions with a small potential for agricultural development, too. Conversely, strong agricultural regions are also home to weak farms which access the redistributive payment. Thus, the preferences anticipated in this study are of a generalized nature. Nevertheless, due to considerable differences in agricultural production potential between Polish regions, such an estimation seems reasonable. Moreover, quantitative policy models based on various assumptions have become recently a common tool for policymakers to understand the functioning of agricultural and food policy instruments and to simulate the impact of policy reforms [78].
In summary, considering a long-term development vision for Poland, the differences in benefits derived from the CAP, as identified in this paper, should not be reduced through an increase in the redistributive payment. Excessive support for small farms under the 1st pillar could perpetuate the defective agrarian structure in Poland and could extend the gap in agricultural development between Poland and EU-15. To prevent widening of regional differences and ensure the social and economic development of rural areas in regions with less favorable agrarian structures where agriculture is currently unable to compete, it would be critical to enhance conditions for alternative types of economic activities. Thus, support under the 2nd pillar should be focused so that farms with a smaller potential located in regions with a less developed agricultural sector could derive greater benefits from it.
In the paper we analyzed only major changes of the policy scenarios. We are aware that the total liquidations of the CAP, or even its pillars separately, are rather radical political options. Other, more gradual CAP’s shifts and current challenges, such as the provision of public goods, inclusion of environmental and climate change, effects on land use changes, multifunctionality, and so forth, could be further analyzed as alternative scenarios of the presented modeling approach.
Author Contributions
Conceptualization, E.K.-D. and A.B.-N.; methodology, E.K.-D. and A.B.-N.; investigation, E.K.-D. and A.B.-N.; writing—original draft preparation, E.K.-D. and A.B.-N.; writing—review and editing, E.K.-D. and A.B.-N.; project administration, E.K.-D.; funding acquisition, E.K.-D. and A.B.-N. All authors have read and agreed to the published version of the manuscript.
Funding
This research was funded by the National Science Centre, Poland, grant number 2017/25/B/HS4/02513.
Institutional Review Board Statement
Not applicable.
Informed Consent Statement
Not applicable.
Data Availability Statement
The data presented in this study are available on request from the corresponding author.
Acknowledgments
The authors would like to thank Marcel Adenauer for helpful insights and support.
Conflicts of Interest
The authors declare no conflict of interest. The funders had no role in the design of the study; in the collection, analyses, or interpretation of data; in the writing of the manuscript, or in the decision to publish the results.
References
- Baer-Nawrocka, A.; Poczta, W. Polish agriculture—Changes and regional differences. In Rural Poland 2018; Scholar Publishing House: Warszawa, Poland; pp. 93–108.
- Prus, P.; Dziekański, P.; Bogusz, M.; Szczepanek, M. Spatial Differentiation of Agricultural Potential and the Level of Development of Voivodeships in Poland in 2008–2018. Agriculture 2021, 11, 229. [Google Scholar] [CrossRef]
- European Commission. Redistributive Payment EC 2016. Available online: Ds-dp-redistributive-payment_en.pdf (europa.eu) (accessed on 20 February 2020).
- Kiryluk-Dryjska, E.; Baer-Nawrocka, A. Polityka Rolna Unii Europejskiej, Kierunki Zmian i Konsekwencje dla Rolnictwa Polskiego (Agricultural Policy of the European Union, Directions of Changes and Consequences for Polish Agriculture); Uniwersytet Przyrodniczy: Poznań, Poland, 2014. [Google Scholar]
- Ordeshook, P.C. Game Theory and Political Theory: An Introduction; Cambridge University Press: Cambridge, UK, 1986. [Google Scholar]
- Kiryluk-Dryjska, E.; Baer-Nawrocka, A. Reforms of the Common Agricultural Policy of the EU: Expected results and their social acceptance. J. Policy Modeling 2019, 41, 607–622. [Google Scholar] [CrossRef]
- Perez-Dominguez, I.; Britz, W.; Holm-Müller, K. Trading Schemes for Greenhouse Gas Emissions from European Agriculture: A Comparative Analysis based on different Implementation Options. Rev. Agric. Environ. Stud. 2009, 90, 287–308. [Google Scholar]
- Tukker, A.; de Koning, A.; Wolf, O.; Bausch-Goldbohm, S.; Verheijden, M.; Kleijn, R.; Pérez-Domínguez, I.; Rueda-Cantuche, J.M. Environmental Impacts of Changes to Healthier Diets in Europe. Ecol. Econ. 2011, 70, 447–463. [Google Scholar] [CrossRef]
- Weiss, F.; Leip, A. Greenhouse gas emissions from the EU livestock sector: A life cycle assessment carried out with the CAPRI model. Agric. Ecosyst. Environ. 2012, 149, 124–134. [Google Scholar] [CrossRef]
- Shrestha, S.; Ciaian, P.; Himics, M.; Van Doorslaer, B. Impacts of climate change on EU agriculture. Rev. Agric. Appl. Econ. 2013, 16, 24–39. [Google Scholar] [CrossRef]
- Britz, W.; Gocht, A.; Pèrez Dominguez, I.; Jansson, T.; Grosche, S.; Zhao, N. EU-Wide (Regional and Farm Level) Effects of Premium Decoupling and Harmonisation Following the Health Check Reform. Ger. J. Agric. Econ. 2012, 61, 44–56. [Google Scholar]
- Kempen, M.; Witzke, P.; Pérez Domiguez, I.; Jansson, T.; Sckokai, P. Economic and environmental impacts of milk quota reform in Europe. J. Policy Model. 2011, 33, 29–52. [Google Scholar] [CrossRef]
- Gocht, A.; Britz, W.; Ciaian, P.; Gomez y Paloma, S. Farm Type Effects of an EU-wide Direct Payment Harmonisation. J. Agric. Econ. 2013, 64, 1–32. [Google Scholar] [CrossRef]
- Renwick, A.; Jansson, T.; Verburg, P.H.; Revoredo-Giha, C.; Britz, W.; Gocht, A.; McCracken, D. Policy reform and agricultural land abandonment in the EU. Land Use Policy 2013, 30, 446–457. [Google Scholar] [CrossRef]
- Baer-Nawrocka, A.; Grochowska, R.; Kiryluk-Dryjska, E.; Seremak-Bulge, J.; Szajner, P. Światowy Rynek Mleka i Jego Wpływ na Polskie Mleczarstwo po Zniesieniu Kwot Mlecznych (The World Milk Market and Its Impact on the Polish Dairy Industry after the Abolition of Milk Quotas); IERiGŻ-PIB: Warszawa, Poland, 2012. [Google Scholar]
- Kiryluk-Dryjska, E.; Baer-Nawrocka, A. Międzynarodowa konkurencyjność polskich produktów mleczarskich w warunkach liberalizacji rynku mleka (International competitiveness of Polish dairy products in the conditions of milk market liberalization). Gospod. Nar. 2013, 3, 101–118. [Google Scholar] [CrossRef]
- Britz, W.; Witzke, P. CAPRI Model Documentation. Available online: https://www.capri-model.org/docs/capri_documentation.pdf (accessed on 20 February 2020).
- Brams, S. Theory of Moves; Cambridge University Press: Cambridge, UK, 1994. [Google Scholar]
- Brams, S. Game Theory and the Humanities, Bringing Two Words; The MIT Press: Cambridge, MA, USA, 2011. [Google Scholar]
- Kiryluk-Dryjska, E. Negotiation analysis using the theory of moves-Theoretical background and a case study. J. Policy Model. 2016, 38, 44–53. [Google Scholar] [CrossRef]
- Simon, M. When sanctions can work: Economic sanctions and the theory of moves. Int. Interact. 1996, 21, 203–228. [Google Scholar] [CrossRef]
- Zeager, L.; Bascom, J. Strategic Behavior in Refugee Repatriation: A Game-Theoretic Analysis. J. Confl. Resolut. 1996, 40, 460–485. [Google Scholar] [CrossRef]
- Baer-Nawrocka, A.; Kiryluk-Dryjska, E.; Poczta, W. Przewidywanie kierunków zmian Wspólnej Polityki Rolnej Unii Europejskiej—podejście zintegrowane (Anticipating the changes in the Common Agricultural Policy of the European Union—An integrated approach). Ekonomista 2018, 6, 664–681. [Google Scholar]
- Papadopoulos, A.G. The Impact of the CAP on Agriculture and Rural Areas of EU Member States. Agrarian South. J. Polit. Econ. 2015, 4, 22–53. [Google Scholar]
- Esposti, R. Regional growth and policies in the European Union: Does the common agricultural policy have a counter-treatment effect? Am. J. Agric. Econ. 2007, 89, 116–134. [Google Scholar] [CrossRef]
- Heiko, H.; Herrmann, R. The two dimensions of policy impacts on economic cohesion: Concept and illustration for the CAP. Food Policy 2012, 37, 483–491. [Google Scholar]
- Shucksmith, M.; Thomson, K.J.; Roberts, D. The CAP and the Regions: The Territorial Impact of the Common Agricultural Policy; CABI Publishing: Wallingford, UK, 2005. [Google Scholar]
- Allanson, P. On the characterisation and measurement of the redistributive effect of agricultural policy. J. Agric. Econ. 2008, 59, 169–187. [Google Scholar] [CrossRef]
- Kiryluk-Dryjska, E.; Beba, P.; Poczta, W. Local determinants of the Common Agricultural Policy rural development funds’ distribution in Poland and their spatial implications. J. Rural Stud. 2020, 74, 201–209. [Google Scholar] [CrossRef]
- Santos, I. Evaluating EU structural policy. Soc. Econ. 2008, 30, 195–208. [Google Scholar] [CrossRef]
- Sierhej, R. EU funds in EU new member states: Available resources and possible economic impact. Soc. Econ. 2008, 30, 181–193. [Google Scholar] [CrossRef]
- Bradley, J. Evaluating the impact of European Union Cohesion policy in less-developed countries and regions. Reg. Stud. 2006, 40, 189–200. [Google Scholar] [CrossRef]
- Kisiel, R.; Babuchowska, K.; Marks-Bielska, R. Wykorzystanie Dopłat Bezpośrednich Przez Rolników z Województwa Warmińsko-Mazurskiego (The Use of Direct Payments by Farmers from the Warmińsko-Mazurskie Voivodship); Wydawnictwo Uniwersytetu Warmińsko-Mazurskiego: Olsztyn, Poland, 2008. [Google Scholar]
- Sadowski, A.; Antczak, W. Kierunki wykorzystania dopłat bezpośrednich przez rodzinne gospodarstwa rolne położone w wybranych województwach (Directions of using direct payments by family farms located in selected voivodships). J. Agribus. Rural Dev. 2012, 4, 103–113. [Google Scholar]
- Teszbir, H.; Gołaś, Z. Regionalne zróżnicowanie aktywności producentów rolnych w aplikowaniu o dopłaty bezpośrednie (Regional diversification of agricultural producers’ activity in applying for direct payments). J. Agribus. Rural Dev. 2014, 4, 181–189. [Google Scholar]
- Wrzochalska, A. Aktywność rolników w pozyskiwaniu funduszy na przykładzie działania “różnicowanie w kierunku działalności nierolniczej”—Pierwsze rezultaty wdrażania PROW 2007–2013 (An activity of farmers in raising funds—The case of measure 311 “diversification into non-agricultural activities”—The first results of RDP 2007–2013 implementation). Rocz. Nauk. Ser. 2016, 13, 536–541. [Google Scholar]
- Biczkowski, M. Endogenous potential of rural areas vs. the structure and allocation of funds under the 2007–2013 RDP. J. Agribus. Rural Dev. 2019, 1, 5–14. [Google Scholar] [CrossRef]
- Czubak, W.; Sadowski, A. Wpływ modernizacji wspieranych funduszami UE na zmiany sytuacji majątkowej w gospodarstwach rolnych w Polsce. (The impact of modernization supported by EU funds on changes in the property situation of farms in Poland.). J. Agribus. Rural Dev. 2014, 2, 45–57. [Google Scholar]
- Wojewodzic, T. Absorption differentation factors of selected PROW 2007-2013 measures the Małopolska and Pogórze Macroregion. Rocz. Nauk. Stow. Ekon. Rol. I Agrobiz. 2016, 18, 290–295. [Google Scholar]
- Rudnicki, R.; Biczkowski, M.; Wiśniewski, Ł. Działanie PROW 2007–2013 “Różnicowanie działalności gospodarstw rolnych” jako czynnik wielofunkcyjnego rozwoju wsi i rolnictwa. Measure PROW 2007–2013 “Diversification of farm activities” as a factor of multifunctional rural and agricultural development). Zesz. Nauk. Sggw W Warsz. Probl. Rol. Świat. 2017, 17, 249–267. [Google Scholar] [CrossRef] [Green Version]
- Kiryluk-Dryjska, E.; Więckowska, B. Territorial Clusters of Farmers’ Interest in Diversification in Poland: Geospatial Location and Characteristics. Sustainability 2020, 12, 5276. [Google Scholar] [CrossRef]
- Sadowski, A.; Wojcieszak, M. Geographic differentiation of agritourism activities in Poland vs. cultural and natural attractiveness of destinations at district level. PLoS ONE 2019, 14, e0222576. [Google Scholar] [CrossRef]
- Szerletics, A.; Jámbor, A. Economic impacts of direct payments on agricultural income—A Literature Review. Competition 2021, 19, 1–23. [Google Scholar] [CrossRef]
- Sadłowski, A. Einfluss der fakultativen Direktzahlungen auf die durchschnittliche Höhe der Stützung für einen landwirtschaftlichen Betrieb in Polen in regionaler Perspektive. Ber. Uber Landwirtsch. 2020, 98. [Google Scholar] [CrossRef]
- Smędzik-Ambroży, K.; Guth, M.; Stępień, S.; Brelik, A. The Influence of the European Union’s Common Agricultural Policy on the Socio-Economic Sustainability of Farms (the Case of Poland). Sustainability 2019, 11, 7173. [Google Scholar] [CrossRef] [Green Version]
- Welsch, H. Armington elasticities for energy policy modeling: Evidence from four European countries. Energy Econ. 2008, 30, 2252–2264. [Google Scholar] [CrossRef]
- Radulescu, D.; Stimmelmayr, M. The impact of the 2008 German corporate tax reform: A dynamic CGE analysis. Econ. Model. 2010, 27, 454–467. [Google Scholar] [CrossRef] [Green Version]
- Bruijn, R.; Kox, H.; Lejour, A. Economic benefits of an Integrated European Market for Services. J. Policy Model. 2008, 30, 301–319. [Google Scholar] [CrossRef]
- Pope, J.; Annandale, D.; Morrison-Saunders, A. Conceptualising sustainability assessment. Environ. Impact Assess. Rev. 2004, 24, 595–616. [Google Scholar] [CrossRef] [Green Version]
- López-Parra, C.; Groot, J.; Carmona-Torresa, C.; Rossing, W. An integrated approach for ex-ante evaluation of public policies for sustainable agriculture at landscape level. Land Use Policy 2009, 26, 1020–1030. [Google Scholar] [CrossRef]
- Thiel, T. The use of ex-ante modelling tools in European Impact Assessment: What role does land use play? Land Use Policy 2009, 26, 1138–1148. [Google Scholar] [CrossRef]
- Bäcklund, A.K. Impact assessment in the European Commission—a system with multiple objectives. Environ. Sci. Policy 2009, 12, 1077–1087. [Google Scholar] [CrossRef]
- Conforti, P. The Common Agricultural Policy in Main Partial Equilibrium Models; Working Paper n.7; Osservatorio Sulle Politiche Agricole dell’UE, Istituto Nazionale di Economia Agraria (INEA): Roma, Italy, 2001.
- Tongeren, F.; van Meijl, H.; van Surry, Y. Global models applied to agricultural and trade policies: A review and assessment. Agric. Econ. 2001, 26, 149–172. [Google Scholar] [CrossRef]
- Balkhausen, O.; Banse, M.; Grethe, H. Modelling CAP Decoupling in the EU: A Comparison of Selected Simulation Models and Results. J. Agric. Econ. 2006, 59, 57–71. [Google Scholar] [CrossRef]
- Garford, C.; Rehman, T. Review of Models for Agricultural Policy Analysis, Research to Understand and Model the Behaviour and Motivations of Farmers in Responding to Policy Changes; Projects EPES 0405/17, Report No.5; CABI: London, UK, 2006. [Google Scholar]
- Adenauer, M. CAPRI versus AGLINK-COSIMO: Two Partial Equilibrium Models—Two Baseline Approaches. In Proceedings of the 12th Congress of the European Association of Agricultural Economists—EAAE, Ghent, Belgium, 26–29 August 2008. [Google Scholar] [CrossRef]
- Bryden, J.M.; Johnson, T.; Refsgaard, K.; Dax, T.; Arandia, A. TOP-MARD Final Report—Scientific Approach. In Toward a Policy Model of Multifunctional Agriculture and Rural Development Final Report Chapter; Alva-Lizarraga, S., Refsgaard, K., Gordon, T., Eds.; Taylor& Francis: London, UK, 2011. [Google Scholar]
- Nadler, R.; Burdack, J.; Kriszan, M. DERREG Case Study Report ‘Oberlausitz’ Developing Europe’s Rural Regions in the Era of Globalization. Available online: https://www.researchgate.net/publication/290982511_DERREG_Case_Study_Report_%27Oberlausitz%27 (accessed on 8 March 2021). [CrossRef]
- OECD-FAO. Agricultural Outlook 2016–2025. Available online: http://www.fao.org/documents/card/en/c/f0589695-58d9-425c-8be2-7dc065e5602f/ (accessed on 8 March 2021).
- Główny Urząd Statystyczny. Użytkowanie Gruntów i Powierzchnia Zasiewów w 2018r. (Land Use and Sown Area in 2018); Główny Urząd Statystyczny: Warszawa, Poland, 2019. [Google Scholar]
- Sadłowski, A. Skutki stosowania płatności redystrybucyjnej w zależności od wariantu wdrożeniowego na przykładzie Polski. (The effects of the redistributive payment depending on the implementation variant, on the example of Poland). Polityki Eur. Finans. I Mark. 2019, 22, 170–183. [Google Scholar]
- Ministerstwo Rolnictwa i Rozwoju Wsi. Projekt Systemu Płatności Bezpośrednich w Latach 2015–2020 (Project of the Direct Payments System in 2015–2020); Ministerstwo Rolnictwa i Rozwoju Wsi: Warszawa, Poland, 2015; p. 11. [Google Scholar]
- Sadowski, A.; Czubak, W.; Poczta, W.; Rowiński, J. Struktury obszarowe i ekonomiczne polskiego rolnictwa oraz innych państw unijnych (Area and economic structures of Polish agriculture and other EU countries). In Struktura Polskiego Rolnictwa na tle Unii Europejskiej (The Structure of Polish Agriculture against the Background of the European Union); Poczta, W., Rowiński, J., Eds.; Wydawnictwo CeDeWu: Warszawa, Poland, 2019; pp. 45–81. [Google Scholar]
- Sadowski, A. Zrównoważony Rozwój Gospodarstw Rolnych z Uwzględnieniem Wpływu Wspólnej Polityki Rolnej Unii Europejskiej (Sustainable Development of Farms in Terms of the Common Agricultural Policy of the European Union); Wydawnictwo Uniwersytetu Przyrodniczego: Poznań, Poland, 2012. [Google Scholar]
- Rembisz, W. Mikroekonomiczne Podstawy Wzrostu Dochodów Producentow Rolnych (Microeconomic Foundations of Income Growth of Agricultural Producers); VIZJA. PRESS&IT: Warszawa, Poland, 2007. [Google Scholar]
- Ciaian, P.; Swinnen, J.F.M. Credit Market Imperfections and the Distribution of Policy Rents. Am. J. Agric. Econ. 2009, 91, 1124–1139. [Google Scholar] [CrossRef] [Green Version]
- Hennessy, D.A. The Production Effects of Agricultural Income Support Polices Under Uncertainty. Am. J. Agric. Econ. 1998, 80, 46–57. [Google Scholar] [CrossRef]
- Zhu, X.; Lansink, A.O. Impact of CAP subsidies on technical efficiency of crop farms in Germany, the Netherlands and Sweden. J. Agric. Econ. 2010, 61, 545–564. [Google Scholar] [CrossRef]
- Zhu, X.; Karagiannis, G.; Lansink, A.O. The impact of direct income transfers of CAP on Greek olive farms performance: Using a non-monotonic inefficiency effects model. J. Agric. Econ. 2011, 62, 630–638. [Google Scholar] [CrossRef]
- Tocco, B.; Davidova, S.; Bailey, A. The Impact of CAP Payments on the Exodus of Labour from Agriculture in Selected EU Member States. Factor Mark. Work. Pap. 2013, 64, 1–39. [Google Scholar]
- Van Herck, K.; Swinnen, J.F.M.; Vranken, L. Direct Payments and Land Rents, Evidence from New Member States. Factor Mark. Work. Pap. 2013, 62, 1–22. [Google Scholar] [CrossRef] [Green Version]
- Camaioni, B.; Esposti, R.; Lobianco, A.; Pagliacci, F.; Sotte, F. How rural is the EU RDP? An analysis through spatial fund allocation. Bio-based. Appl. Econ. 2013, 2, 277–300. [Google Scholar]
- Crescenzi, R.; De Filippis, F.; Pierangeli, F. In Tandem for Cohesion? Synergies and Conflicts between Regional and Agricultural Policies of the European Union. Reg. Stud. 2015, 49, 681–704. [Google Scholar] [CrossRef]
- Bonfiglio, S.; Camaioni, B.; Coderoni, S.; Esposti, R.; Pagliacci, F.; Sotte, F. Are rural regions prioritizing knowledge transfer and innovation? Evidence from Rural Development Policy expenditure across the EU space. J. Rural Stud. 2017, 53, 78–87. [Google Scholar] [CrossRef]
- Chaplin, H.; Davidova, S.; Gorton, M. Agricultural adjustment and the diversification of farm households and corporate farms in Central Europe. J. Rural Stud. 2004, 20, 61–77. [Google Scholar] [CrossRef]
- Zasada, I.; Weltin, M.; Reutter, M.; Verburg, P.H.; Piorr, A. EU’s rural development policy at the regional level—Are expenditures for natural capital linked with territorial needs? Land Use Policy 2018, 77, 344–353. [Google Scholar] [CrossRef]
- Soregaroli, C.; Sckokai, P.; Moro, D. Agricultural policy modelling under imperfect competition. J. Policy Model. 2011, 33, 195–212. [Google Scholar] [CrossRef]
Figure 1.
An attempt by player 2 to exit the state (4, 3) by changing its strategy (an analysis based on backward induction). Source: own compilation.
Figure 1.
An attempt by player 2 to exit the state (4, 3) by changing its strategy (an analysis based on backward induction). Source: own compilation.


Table 1.
Changes in farming income against status quo in the following cases: the 1st pillar is discontinued (scenario 1); the 2nd pillar is discontinued (scenario 2); and the Common Agricultural Policy (CAP) is totally dismantled (scenario 3).
Table 1.
Changes in farming income against status quo in the following cases: the 1st pillar is discontinued (scenario 1); the 2nd pillar is discontinued (scenario 2); and the Common Agricultural Policy (CAP) is totally dismantled (scenario 3).
| Specification | Scenario 1: Discontinuing the 1st Pillar of the CAP | Scenario 2: Discontinuing the 2nd Pillar of the CAP | Scenario 3: Dismantling of the CAP |
|---|---|---|---|
| Poland | −0.23 | −0.06 | −0.29 |
| Łódzkie | −0.19 | −0.03 | −0.21 |
| Mazowieckie | −0.16 | −0.04 | −0.19 |
| Małopolskie | −0.23 | −0.04 | −0.27 |
| Śląskie | −0.21 | −0.04 | −0.25 |
| Lubelskie | −0.23 | −0.05 | −0.28 |
| Podkarpackie | −0.22 | −0.05 | −0.27 |
| Świętokrzyskie | −0.19 | −0.04 | −0.23 |
| Podlaskie | −0.13 | −0.05 | −0.16 |
| Wielkopolskie | −0.18 | −0.10 | −0.22 |
| Zachodniopomorskie | −0.27 | −0.12 | −0.39 |
| Lubuskie | −0.27 | −0.13 | −0.40 |
| Dolnośląskie | −0.24 | −0.05 | −0.29 |
| Opolskie | −0.24 | −0.02 | −0.24 |
| Kujawsko-Pomorskie | −0.24 | −0.05 | −0.29 |
| Warmińsko-Mazurskie | −0.24 | −0.07 | −0.28 |
| Pomorskie | −0.25 | −0.09 | −0.33 |
Source: own calculations based on the CAPRI model.
Table 2.
Structure of farms in each voivodeship and in Poland, grouped by utilized agricultural area in 2018 (%).
Table 2.
Structure of farms in each voivodeship and in Poland, grouped by utilized agricultural area in 2018 (%).
| Specification | 1–1.99 ha | 2–2.99 ha | 3–4.99 ha | 5–6.99 ha | 7–9.99 ha | 10–14.99 ha | 15–19.99 ha | 20–29.99 ha | 30–49.99 ha | 50 ha or More | Average Farm Size (ha) |
|---|---|---|---|---|---|---|---|---|---|---|---|
| POLAND | 20.3 | 13.6 | 18.4 | 11.2 | 11.3 | 10.1 | 5.0 | 4.5 | 3.0 | 2.4 | 10.3 |
| Dolnośląskie | 24.7 | 15.4 | 13.5 | 10.1 | 9.5 | 9.0 | 4.2 | 4.8 | 3.3 | 5.6 | 15.0 |
| Kujawsko-Pomorskie | 10.9 | 8.2 | 10.1 | 10.5 | 11.5 | 16.4 | 8.3 | 12.5 | 6.9 | 4.7 | 17.3 |
| Lubelskie | 16.7 | 14.5 | 20.7 | 13.9 | 13.1 | 9.6 | 3.8 | 3.6 | 2.6 | 1.5 | 8.4 |
| Lubuskie | 21.9 | 11.8 | 14.1 | 9.7 | 10.4 | 8.9 | 5.5 | 5.8 | 4.3 | 7.7 | 18.6 |
| Łódzkie | 15.6 | 11.7 | 21.3 | 14.9 | 14.6 | 11.5 | 4.3 | 3.2 | 2.0 | 0.9 | 8.0 |
| Małopolskie | 38.3 | 22.1 | 23.0 | 8.1 | 4.1 | 1.9 | 1.0 | 0.6 | 0.5 | 0.3 | 3.9 |
| Mazowieckie | 12.7 | 10.1 | 19.8 | 13.4 | 17.0 | 12.8 | 6.8 | 3.8 | 2.6 | 1.2 | 9.1 |
| Opolskie | 24.1 | 12.2 | 10.3 | 8.4 | 9.6 | 9.6 | 5.1 | 7.3 | 6.4 | 7.0 | 18.6 |
| Podkarpackie | 40.5 | 20.2 | 21.4 | 8.0 | 4.3 | 2.4 | 1.0 | 0.9 | 0.8 | 0.7 | 4.3 |
| Podlaskie | 4.9 | 9.6 | 12.2 | 10.6 | 14.0 | 17.4 | 12.6 | 9.8 | 5.9 | 3.0 | 14.1 |
| Pomorskie | 15.0 | 9.4 | 9.9 | 10.2 | 12.4 | 14.7 | 8.7 | 8.0 | 5.5 | 6.1 | 18.7 |
| Śląskie | 34.3 | 17.9 | 20.7 | 8.1 | 7.1 | 4.6 | 2.2 | 2.2 | 1.4 | 1.5 | 6.4 |
| Świętokrzyskie | 21.5 | 16.2 | 27.2 | 14.4 | 9.3 | 6.0 | 2.3 | 1.7 | 0.9 | 0.5 | 5.6 |
| Warmińsko-Mazurskie | 11.4 | 9.3 | 11.5 | 7.6 | 10.1 | 16.2 | 8.0 | 9.9 | 8.1 | 7.9 | 22.4 |
| Wielkopolskie | 15.2 | 10.7 | 13.6 | 9.8 | 13.0 | 15.0 | 7.6 | 7.3 | 4.3 | 3.4 | 14.0 |
| Zachodniopomorskie | 13.6 | 8.6 | 14.0 | 8.2 | 9.3 | 15.2 | 4.8 | 7.6 | 6.9 | 11.9 | 27.6 |
Source: own calculations based on [61].
Table 3.
Pay-off matrix for the non-cooperative game.
| Farmers Operating in Regions with a Greater Production Potential | Farmers Operating in Regions with a Smaller Production Potential | ||
| Increasing the redistributive payment | Maintaining the existing redistributive payment | ||
| Increasing the support available under the 1st pillar | 3, 4 * | 4, 3 B | |
| Increasing the support available under the 2nd pillar | 1, 2 | 2, 1 | |
* Nash equilibrium, B Brams equilibrium. Source: own compilation.
Publisher’s Note: MDPI stays neutral with regard to jurisdictional claims in published maps and institutional affiliations. |
© 2021 by the authors. Licensee MDPI, Basel, Switzerland. This article is an open access article distributed under the terms and conditions of the Creative Commons Attribution (CC BY) license (http://creativecommons.org/licenses/by/4.0/).
Share and Cite
MDPI and ACS Style
Kiryluk-Dryjska, E.; Baer-Nawrocka, A. Regional Differences in Benefits from the EU Common Agricultural Policy in Poland and Their Policy Implications. Agriculture 2021, 11, 288. https://0-doi-org.brum.beds.ac.uk/10.3390/agriculture11040288
AMA Style
Kiryluk-Dryjska E, Baer-Nawrocka A. Regional Differences in Benefits from the EU Common Agricultural Policy in Poland and Their Policy Implications. Agriculture. 2021; 11(4):288. https://0-doi-org.brum.beds.ac.uk/10.3390/agriculture11040288
Chicago/Turabian StyleKiryluk-Dryjska, Ewa, and Agnieszka Baer-Nawrocka. 2021. "Regional Differences in Benefits from the EU Common Agricultural Policy in Poland and Their Policy Implications" Agriculture 11, no. 4: 288. https://0-doi-org.brum.beds.ac.uk/10.3390/agriculture11040288
Note that from the first issue of 2016, this journal uses article numbers instead of page numbers. See further details here.