Article

Early Weed Detection Using Image Processing and Machine Learning Techniques in an Australian Chilli Farm

1
School of Engineering and Technology, Central Queensland University, Rockhampton, QLD 4700, Australia
2
Centre for Intelligent Systems, School of Engineering and Technology, Central Queensland University, Rockhampton, QLD 4700, Australia
3
Institute for Future Farming Systems, Central Queensland University, Bundaberg, QLD 4670, Australia
4
School of Health, Medical and Applied Sciences, Central Queensland University, Bundaberg, QLD 4760, Australia
5
ConnectAuz pty Ltd., Truganina, VIC 3029, Australia
*
Author to whom correspondence should be addressed.
Submission received: 6 April 2021 / Revised: 19 April 2021 / Accepted: 19 April 2021 / Published: 25 April 2021
(This article belongs to the Special Issue Integrated Weed Management in Agricultural Systems)

Abstract

:
This paper explores the potential of machine learning algorithms for weed and crop classification from UAV images. The identification of weeds in crops is a challenging task that has been addressed through orthomosaicing of images, feature extraction and labelling of images to train machine learning algorithms. In this paper, the performances of several machine learning algorithms, random forest (RF), support vector machine (SVM) and k-nearest neighbours (KNN), are analysed to detect weeds using UAV images collected from a chilli crop field located in Australia. The evaluation metrics used in the comparison of performance were accuracy, precision, recall, false positive rate and kappa coefficient. MATLAB is used for simulating the machine learning algorithms; and the achieved weed detection accuracies are 96% using RF, 94 % using SVM and 63 % using KNN. Based on this study, RF and SVM algorithms are efficient and practical to use, and can be implemented easily for detecting weed from UAV images.

1. Introduction

The rapid growth of global population compounded by climate change is putting enormous pressure on the agricultural sector to increase the quality and quantity of food production. It is predicted that the global population will reach nine billion by 2050, and therefore, agricultural production must double to meet the increasing demands [1]. However, agriculture is facing immense challenges from the growing threats of plant diseases, pests and weed infestation [2,3,4,5] . The weed infestations, pests and diseases reduce the yield and quality of food, fibre and biofuel value of crops. Losses are sometimes cataclysmic or chronic, but on average account for about 42 % of the production of a few important food crops [1]. Weeds are undesired plants which compete against productive crops for space, light, water and soil nutrients, and propagate themselves either through seeding or rhizomes. They are generally poisonous, produce thorns and burrs and hamper crop management by contaminating crop harvests. That is why farmers spend billions of dollars on weed management, often without adequate technical support, resulting in poor weed control and reduced crop yield. Hence, weed control is an important aspect of horticultural crop management, as failure to adequately control weeds leads to reduced yields and product quality [6]. The use of chemical and cultural control strategies can lead to adverse environmental impacts when not managed carefully. A low-cost tool for identification and mapping of weeds at early growth stages will contribute to more effective, sustainable weed management approaches. Along with preventing the loss of crop yield by up to 34 % , early weed control is also useful in reducing the occurrence of diseases and pests in crops [2,7]. Many approaches have been developed for managing weeds, and they normally consider current environmental factors. Among these approaches, image processing is promising. In the image processing approach, unmanned aerial vehicles (UAVs) are used for monitoring crops and capturing the possible weeds in the fields. UAVs are found to be beneficial for agriculture usage due to their ability to cover large areas in a very short amount of time, and at the same time, do not cause any soil compaction or damage in the fields [8]. However, the interpretation of data collected from UAVs into meaningful information is still a painstaking task. This is because a standard data collection and classification require significant amounts of manual effort for segment size tuning, feature selection and rule-based classifier design.
The underline motivation of this paper was a real scenario. This scenario involved a chilli producing farm (AustChilli Group Australia) which is located in Bundaberg, Australia. As found in many studies [3,9,10,11] in the literature, the quality and quantity of the crop yields were being hampered due to the water and nutrients consumed by weed. Therefore, an effective solution for weed control in early stages of the crops is much needed. Hence, the objective of this study was to find an efficient and robust machine learning-based approach for detecting unwanted weed and parasites within crops. For this purpose, we analysed three machine learning algorithms, namely, random forest (RF), k-nearest neighbours (KNN) and support vector machine (SVM), and compared their performances at detecting weeds. In our previous work [12], we presented a weed detection mechanism using the RF algorithm. This study was an extended version, where we detected weeds using SVM and KNN and compared the results with the performance of RF. It is noteworthy to mention the condition of the farmland, which is one of the very crucial parameters for selecting the appropriate weed detection algorithm or detection mechanism. Generally, the field background for weed detection could be classified as one of two groups. The first one is a field early in the season, when weeds can be easily differentiated from the background (soil, plastic mulch, etc.), and crops (in seedling stage) can be identified as a simple spatial pattern (e.g., rows, or grid pattern) [13]. The second category is known as the closed crop canopy in agriculture, which has a fairly complicated background. In this case, weeds are detected within mature crops; this requires finding out unique features that differentiate weeds and crops (spectral signature, shape, etc.). This can be quite challenging and sometimes requires laborious annotation/ground truthing [14]. For our paper, we have done the weed detection at early stage of crop growth. The reason for this was that the seedlings are more hampered early on by weeds, since weeds consume the nutrients (water and fertiliser) which are much needed for the seedlings to grow [15]. Therefore, it is very important to detect and remove weeds in the early stages.
This paper is organised into five sections. Section 2 provides a literature review on machine learning algorithms used in weed detection. Section 3 presents the materials and experimental methods used for weed detection in an Australian chilli field. This approach includes several stages: UAV image collection, image pre-processing, feature extraction and selection, labelling images and applying machine learning classifiers. The simulation method and parameters are also presented in Section 3. Section 4 presents the simulation results of the classifiers along with performance analysis of RF, KNN and SVM. Finally, Section 5 concludes the paper with some potential directions for our future work.

2. Literature Review on Machine Learning Algorithms for Weed Detection

In this section, we explore relevant works conducted in recent years that use machine learning and image analysis for weed detection. Recent studies in the literature present a variety of classification approaches used to generate weed maps from UAV images [16,17,18,19]. However, as evidence in the recent state-of-art works shows [3,5,13,20], machine learning algorithms make more accurate and efficient alternatives than conventional parametric algorithms, when dealing with complex data. Among these machine learning algorithms, the RF classifier is becoming a very popular option for remote sensing applications due to its generalised performance and operational speed [3,4,5,13,21]. RF has been found to be desirable for high resolution UAV image classification and agricultural mapping [3,4,5,13,21]. Another popular machine learning classifier is SVM, which has been popularly used for weed and crop classification [22,23,24,25]. On the other hand, Kazmi et al. [26] used the KNN algorithm for creeping thistle detection in sugar beet fields. Table 1 presents an overview of recent works on machine learning based approach for weed detection.
Brinkhoff et al. [22] generated a land cover map to locate and classify perennial crops over a 6200 km 2 area of the Riverina region located in New South Wales, Australia. To optimise accuracy, they used object-based image analysis techniques along with supervised SVM classification. They found the overall accuracy to be 84.8 % for an object count with twelve classes, whereas the accuracy was 90.9 % when weighted by object area. These results demonstrated the potential of using a time series of medium resolution remote sensing images to produce detailed land cover maps over intensive perennial cropping areas. Alam et al. [3] used an RF classifier to develop a real-time computer vision-based system to distinguish weeds from crops. The authors created their own dataset to train the classification model, and then they tested it with field data. Moreover, they developed a pulse width modulation-based fluid flow control system which controls an equipment to spray a desired amount of agrochemical based on the feedback from the vision-based system. Hence, the authors demonstrated the effectiveness of their real time vision-based agrochemical spraying system.
Faisal et al. [28] proposed a SVM algorithm to identify the weeds from chilli field images. The goal of their research was to explore the performance of the SVM classifier in an integrated weed management scheme. They collected images from chilli fields of Bangladesh that included five different weeds. Those images were then segmented by using a global thresholding-based binarisation technique to distinguish the plants from the ground, and extract features. From each image, fourteen features were classified into three groups—colour feature, shape features and moment invariants. Finally, SVM classifier was used to detect weeds. Their experimental results showed that the SVM achieved overall 97% accuracy on 224 test images. In [24], the authors proposed a weed detection approach for sugar beet cultivation where they combined several shape features to set up patterns which then were used to separate the highly similar sugar beets from the weeds. The images used in the research were collected from Shiraz University sugar beet fields. MATLAB toolbox was used to process these images. To differentiate between weeds and sugar beets, the authors explored different shape features—namely: shape factors, moment invariants and Fourier descriptors. Then, KNN and SVM classifiers were used; the overall accuracies were found to be 92.92 % and 95 % , respectively.
In [25], a weed detection approach was introduced where a histogram based on colour indices is used to identify soil, soybean and weed (broadleaf) classes by using colour indices as a feature, and a monochrome image is generated. To obtain grey-scale images, the image was scaled to an interval of 0–255, and image histograms were produced and normalised; BPNN and SVM classifiers were used to train with these histograms. The aim of this research was to determine an alternative feature vector that includes simple computational steps, and at the same time, ensure a high weed detection rate. The overall accuracies achieved by this technique for BPNN and SVM were 96.601 % and 95.078 % , respectively. In [14], the authors proposed an automated weed detection framework that was able to detect weeds at the various phases of plant growth. Colour, multispectral and thermal images were captured by using UAV-based sensors. Next, they converted the collected images into NDVI images and applied image processing techniques to those images, and by using colour images as the ground truth, they manually drew bounding boxes and hand-labelled vegetation bulbs. Finally, they applied the machine learning approaches to separate the weeds.
Gao et al. [5] investigated the effectiveness of a hyperspectral snapshot mosaic camera for the identification of weed and maize, where the images were collected from a laboratory of plant in Belgium. These raw images were processed, and for the band features, the calibration formula reflectance was acquired. These reflectance, NDVI and RVI features were generated in VB and NIR regions and one hundred eighty-five features were found. Then, a PCA-based feature reduction method was used. Next, feature selection algorithms were applied to extract distinctive features. Finally, a RF classifier was used to detect weed and crop. Overall, 81% accuracy was achieved for different types of weed recognition.
Castro et al. [13] proposed an automatic, RF-based image analysis approach to identify weeds from the early growing phases of the herbaceous crops. In this approach, the UAV images were used in the combination of digital surface models (DSMs) and orthomosaic techniques. After that, RF classifier was used to separate the weeds from the crops and soil, and the approach achieved 87.9% and 84% accuracies for sunflower and cotton fields. In [21], a simple flow diagram was proposed that can be used to track invasive water troops, both emerging and submerged; the important components of this workflow are the gathering of radiometrically calibrated multispectral imagery, image segmentation and using a machine learning model. The images were collected by using the eBee mapping drone. The orthomosaic of the multispectral imagery was generated by using Pix4Dmapper Pro 3.0. The images were then mosaiced and made into absolute maps of reflectivity, and they used ENVI 5.4 for image segmentation and extracted 14 spatial features. Moreover, they also generated an NDVI band and integrated it into the segmentation. Finally, they used an RF classifier for detection of infestations among the plants. The overall accuracies achieved for the above-water and submerged features were 92.19% and 83.76%, respectively.
In [4], the authors introduced an approach that can accurately estimate the different growth stages of avocado trees by using UAVs. They used a Parrot Sequoia® multi-spectral camera to capture multi-spectral images. To calculate the tree height, they used a canopy height model by separating the digital terrain model from the digital surface model. Then they utilised red edge and NIR bands brightness and different vegetation indices based on orthomosaic at-surface reflectance imagery. Finally, an RF algorithm was used which achieved 96% accuracy.
In [27], a weed mapping approach was proposed for precision agriculture, where UAV captured images were used from sunflower and maize crop fields. The research addressed the early growth stage problem of spectral similarity for crops and weed pixels with object-based image analysis (OBIA), for which they used an SVM algorithm integrated with feature selection techniques. The UAV was used to collect images of sunflower and maize fields located at the private farms, namely, La Monclova and El Mazorcal, in Spain. Next, these images were mosaicked using the Agisoft Photoscan software, and the subsample was labelled based on unsupervised feature selection techniques from these objects, whereas the automatic labelling was performed under the supervision of an expert. These objects were represented as colour histograms and data features based on remote-sensing measurements (first-order statistics, textures, etc.) for the classification of the objects. The overall accuracy of this SVM based approach was found to be around 95.5 % .

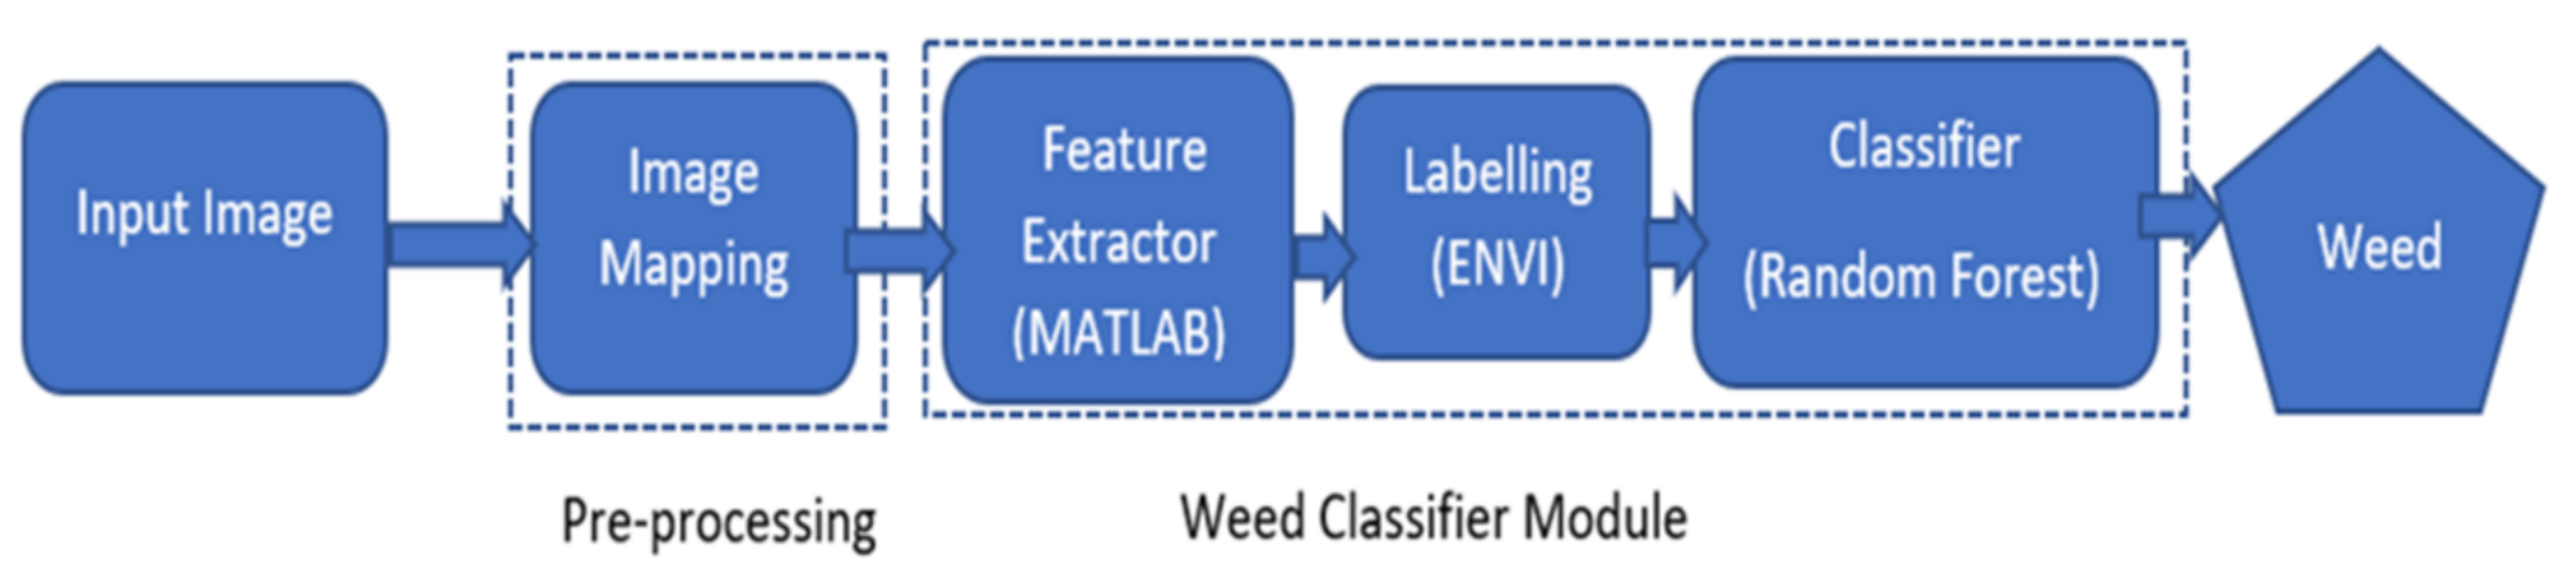
3. Materials and Experimental Methods

This section presents the materials and methodologies used in the proposed weed detection method. Figure 1 shows the workflow diagram showing different stages between the initial stage of inputting RGB images and the final stage of detecting weed. The materials and experimental methods of different stages are presented in the following subsections.

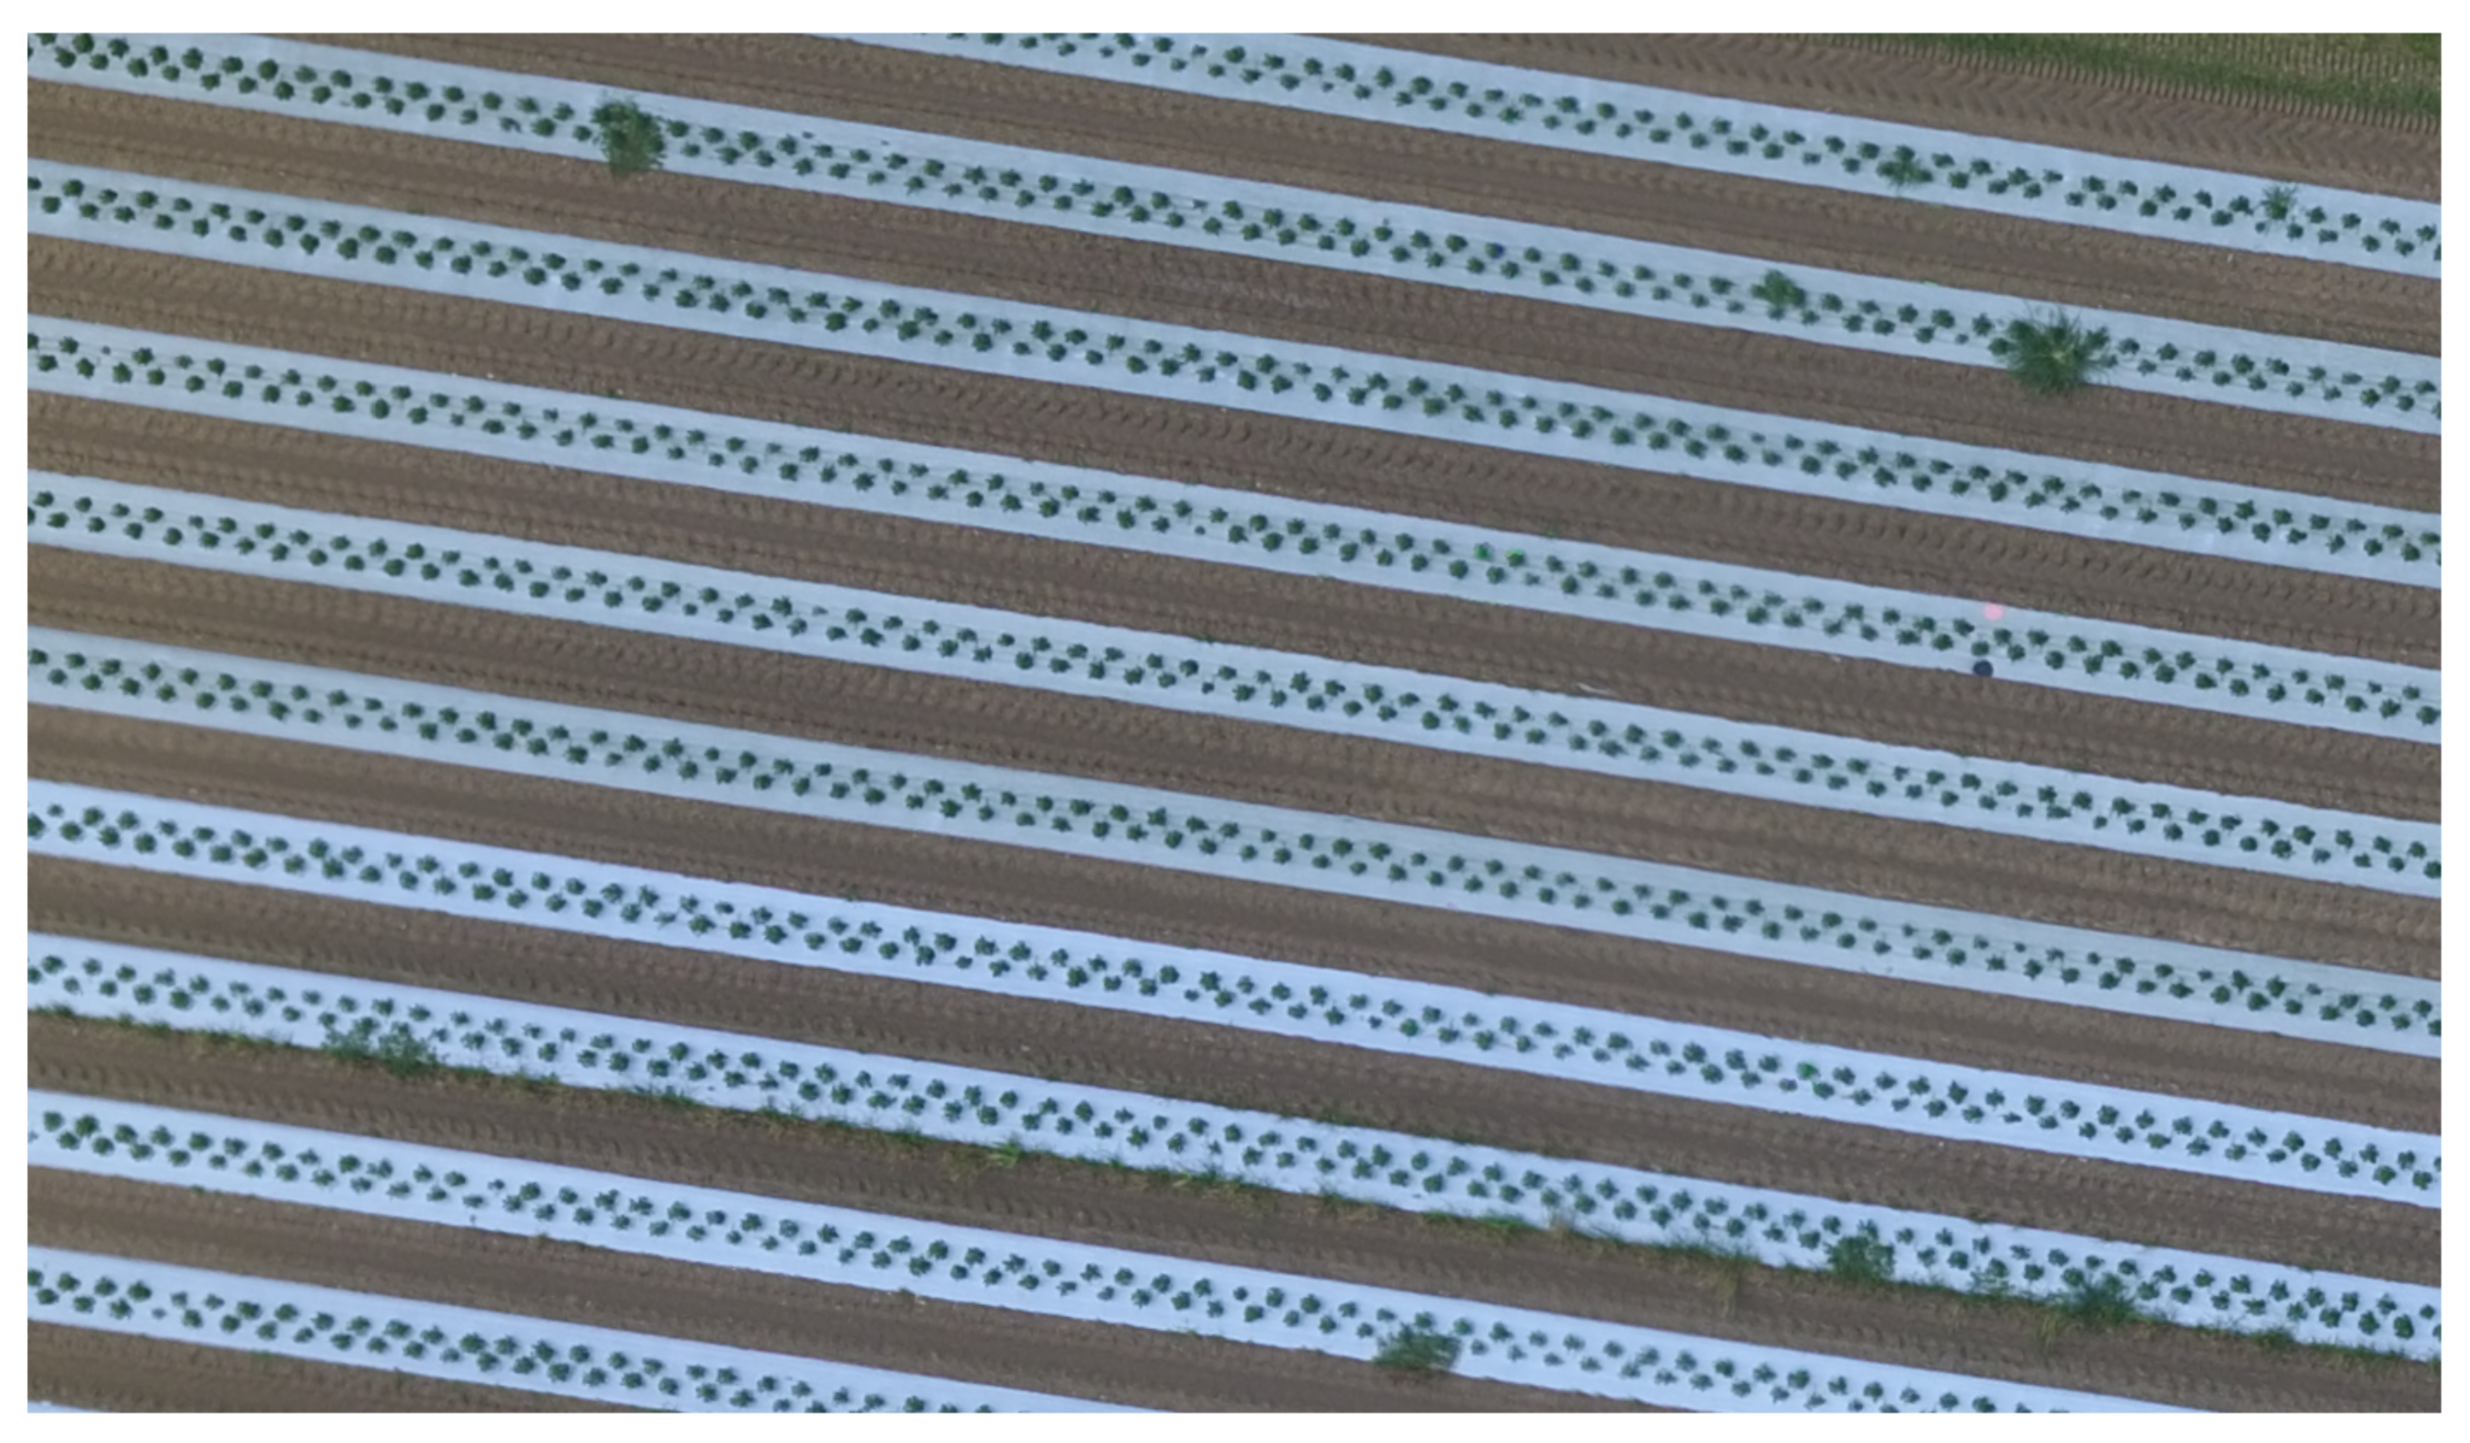
3.1. UAV Image Collection

As mentioned in the previous section, recent research publications in the field of agriculture have demonstrated successful applications of several imaging techniques for identifying diseases and weeds, and monitoring host plants. Sensors and camera-mounted UAVs can be used to capture images of field crops for the purpose. Depending on the type of camera, different types of images can be captured, such as RGB, thermal, multi-spectral, hyper-spectral, 3D and chlorophyll florescence. For our work, we have used RGB images captured by RGB cameras mounted in a drone (i.e., UAV). These images were captured over the chilli farm using a Phantom 3 Advanced drone mounted camera with the 1/2.3 CMOS sensor (the specifications of the drone and camera can be found here: https://www.dji.com/au/phantom-3-adv/info, accessed on 1 June 2019). We chose RGB images because of their availability and the reasonable price of RGB cameras. On the contrary, the high prices of other types of camera, such as the multi-spectral camera, make them unaffordable for small farms [29]. Therefore, there is the need for an efficient and robust system for weed and other anomaly detection using RGB images which are more affordable for small farms and less wealthy stakeholders.

3.2. Image Preprocessing

The RGB UAV images were pre-processed and converted to orthomosaic images. In the image pre-processing step, the images were calibrated and mosaicked using Pix4D Mapping software following the default settings of “3D Maps”. Then they were geo-registered into a single orthophoto. The aerial images were geo-registered using ground control points [30] which were set with coordinates measured by a differential GPS with 0.02 m error (Leica Viva GS14 GNSS antenna and CS20 controller, Leica Geosystems, St. Gallen, Switzerland) and then converted to orthophotos. An orthophoto, also known as an orthophotograph or orthoimage, is an aerial photograph which is geometrically corrected to make the scale uniform so that the photo has the same lack of distortion as a map. An orthophoto consists of adjusted camera tilts, lens distortion and topographic relief. Therefore, it represents the earth’s surface accurately, and consequently, it can be used to measure true distance.

3.3. The Extraction and Selection of Features from Images

From a RGB image of a small part of the chilli farm, we extracted the reflectance of red, green and blue bands, from which we extracted the vegetation indices such as normalised red band, normalised green band and normalised blue band. The purpose of this normalisation was to reduce the effects of different lighting conditions on the colour channels. After that, excess green ( E x G ), excess red ( E x R ), excess green and red ( E x G E x R ) and the greenness index were calculated, as shown in Table 2, where R b a n d represents the reflectance of a specific band. The E x G index gives the difference between the detected light values of green channel and the red and blue channels. For our machine learning approach, we used r, g, b, GI and E x G E x R indices, since they provide the optimum results of weed detection.

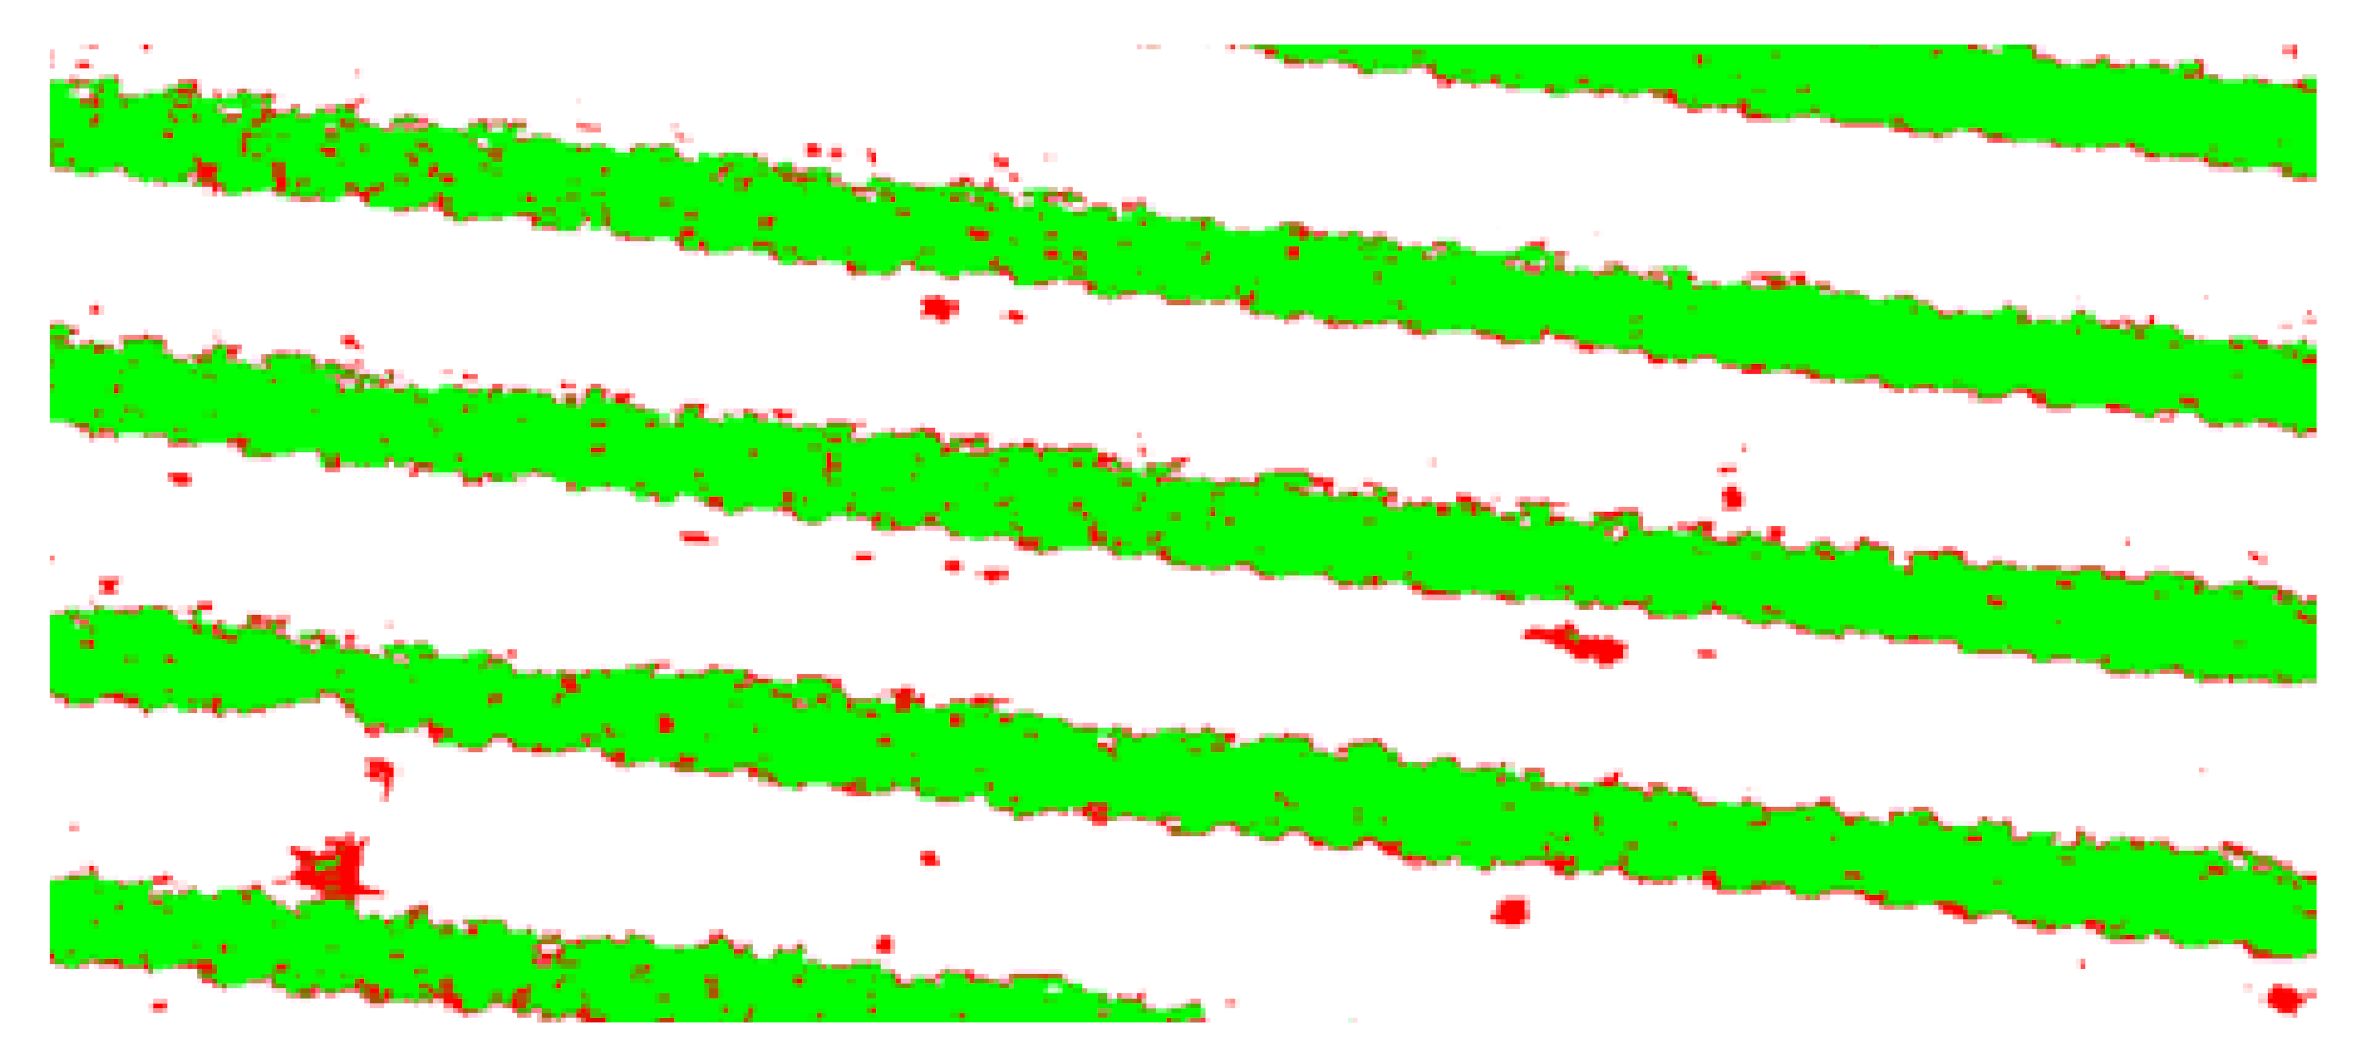
3.4. Labelling the Images

We need a labelled image to train our RF, KNN and SVM algorithms. Here, we used ENVI classic software to label a small section of the image as weeds, crops and bare field so that we could use it as the training data for the three machine learning algorithms. In ENVI, we manually labelled some of the areas as weeds, crops and bare field using ROIs (Region of interest) and then used the neural network classifier to label rest of area in the image. Figure 2 shows a labelled image where the crops are labelled in green, weeds are labelled in red and bare land is labelled in white. This labelled image was used to train our RF, KNN and SVM algorithms and detect weeds.

3.5. Machine Learning-Based Classification

Once image features were extracted and selected, these were used to build classification models. We have used the following machine learning classifiers as they have been efficiently used in the literature:
  • Random forest (RF) classifier: Breiman et al. [32] defined the RF as, “An ensemble of classification trees, where each decision tree employs a subset of training samples and variables selected by a bagging approach, while the remaining samples are used for internal cross-validation of the RF performance. The classifier chooses the membership classes having the most votes, for a given case.” RF has been proven to be highly suitable for high resolution UAV image classification and for agricultural mapping [3,4,5,13,21].
  • Support vector machine (SVM) classifier: SVM classifies data points based on hyperplanes which optimally differentiate the classes based on training data [24,25]. These hyperplanes are the surfaces defined by combinations of input features. SVM has been popularly used in literature to perform weed and crop classification [22,23,24,25].
  • K-nearest neighbours (KNN) classifier: KNN is a non-parametric algorithm, popularly used for regression and classification. The input consists of the k closest training examples in the feature space [33,34]. Kazmi et al. [26] used the KNN algorithm for creeping thistle detection in sugar beet fields.
As mentioned earlier, RF, SVM and KNN have been widely used for weed and crop classification; hence we selected and used these algorithms in our study, and compared the results of these classifiers. We have classified three different classes, namely, weeds, crops and unwanted area (bare land and plastic mulch) in the chilli farm in Australia.

3.6. Simulation Method and Parameters

MATLAB has been used for feature extraction from the pre-processed images and to simulate the machine learning based algorithms. For RF, we used 500 decision trees to generate the random forest algorithm, and we used the value of k = 4 for KNN. For any machine learning technique, we need to use a training data to train the algorithm. In this study, we used the labelled image shown in Figure 2 from ENVI to train the machine learning algorithm. We used this training data in our RF, KNN and SVM classifiers to detect weed in the chilli field. Additionally, we compare some performance metrics of RF, KNN and SVM classifiers, such as accuracy, recall (also known as sensitivity), specificity, precision, false positive rate and kappa coefficient [27,28]. We define the following parameters to be used in the performance metrics:
  • T P = True positive = number of records when weed is detected correctly.
  • T N = True negative = number of records when crop and bare land is detected correctly.
  • F P = False positive = number of records when weed is detected incorrectly.
  • F N = False Negative = number of records when crop and bare land is detected incorrectly.
  • P= Total positive = T P + F N .
  • N= Total negative = T N + F P .
Based on these formulas, we calculated the following performance metrics for RF classifier and compared them with KNN and SVM classifiers. The classification accuracy, recall, specificity, precision, false positive rate and kappa coefficient (kc) [35] were calculated from the following formulae [24,36,37]:
Accuracy = T P + T N P + N
Recall = T _ P T _ P + F _ N
Precision = T _ P T _ P + F _ P
Specificity = T _ N T _ N + F _ P
FPR = 1 Specificity
kappa coefficient = max ( [ A k c 1 k c * k c A 1 A ] )
where A is accuracy and
k c = ( P ( T P + F P ) ) + ( N ( F N + T N ) ) ( T P + T N + F P + F N ) 2
The following section presents the simulation results of machine learning-based image processing for weed detection and compares the above-mentioned performance metrics of the machine learning techniques.

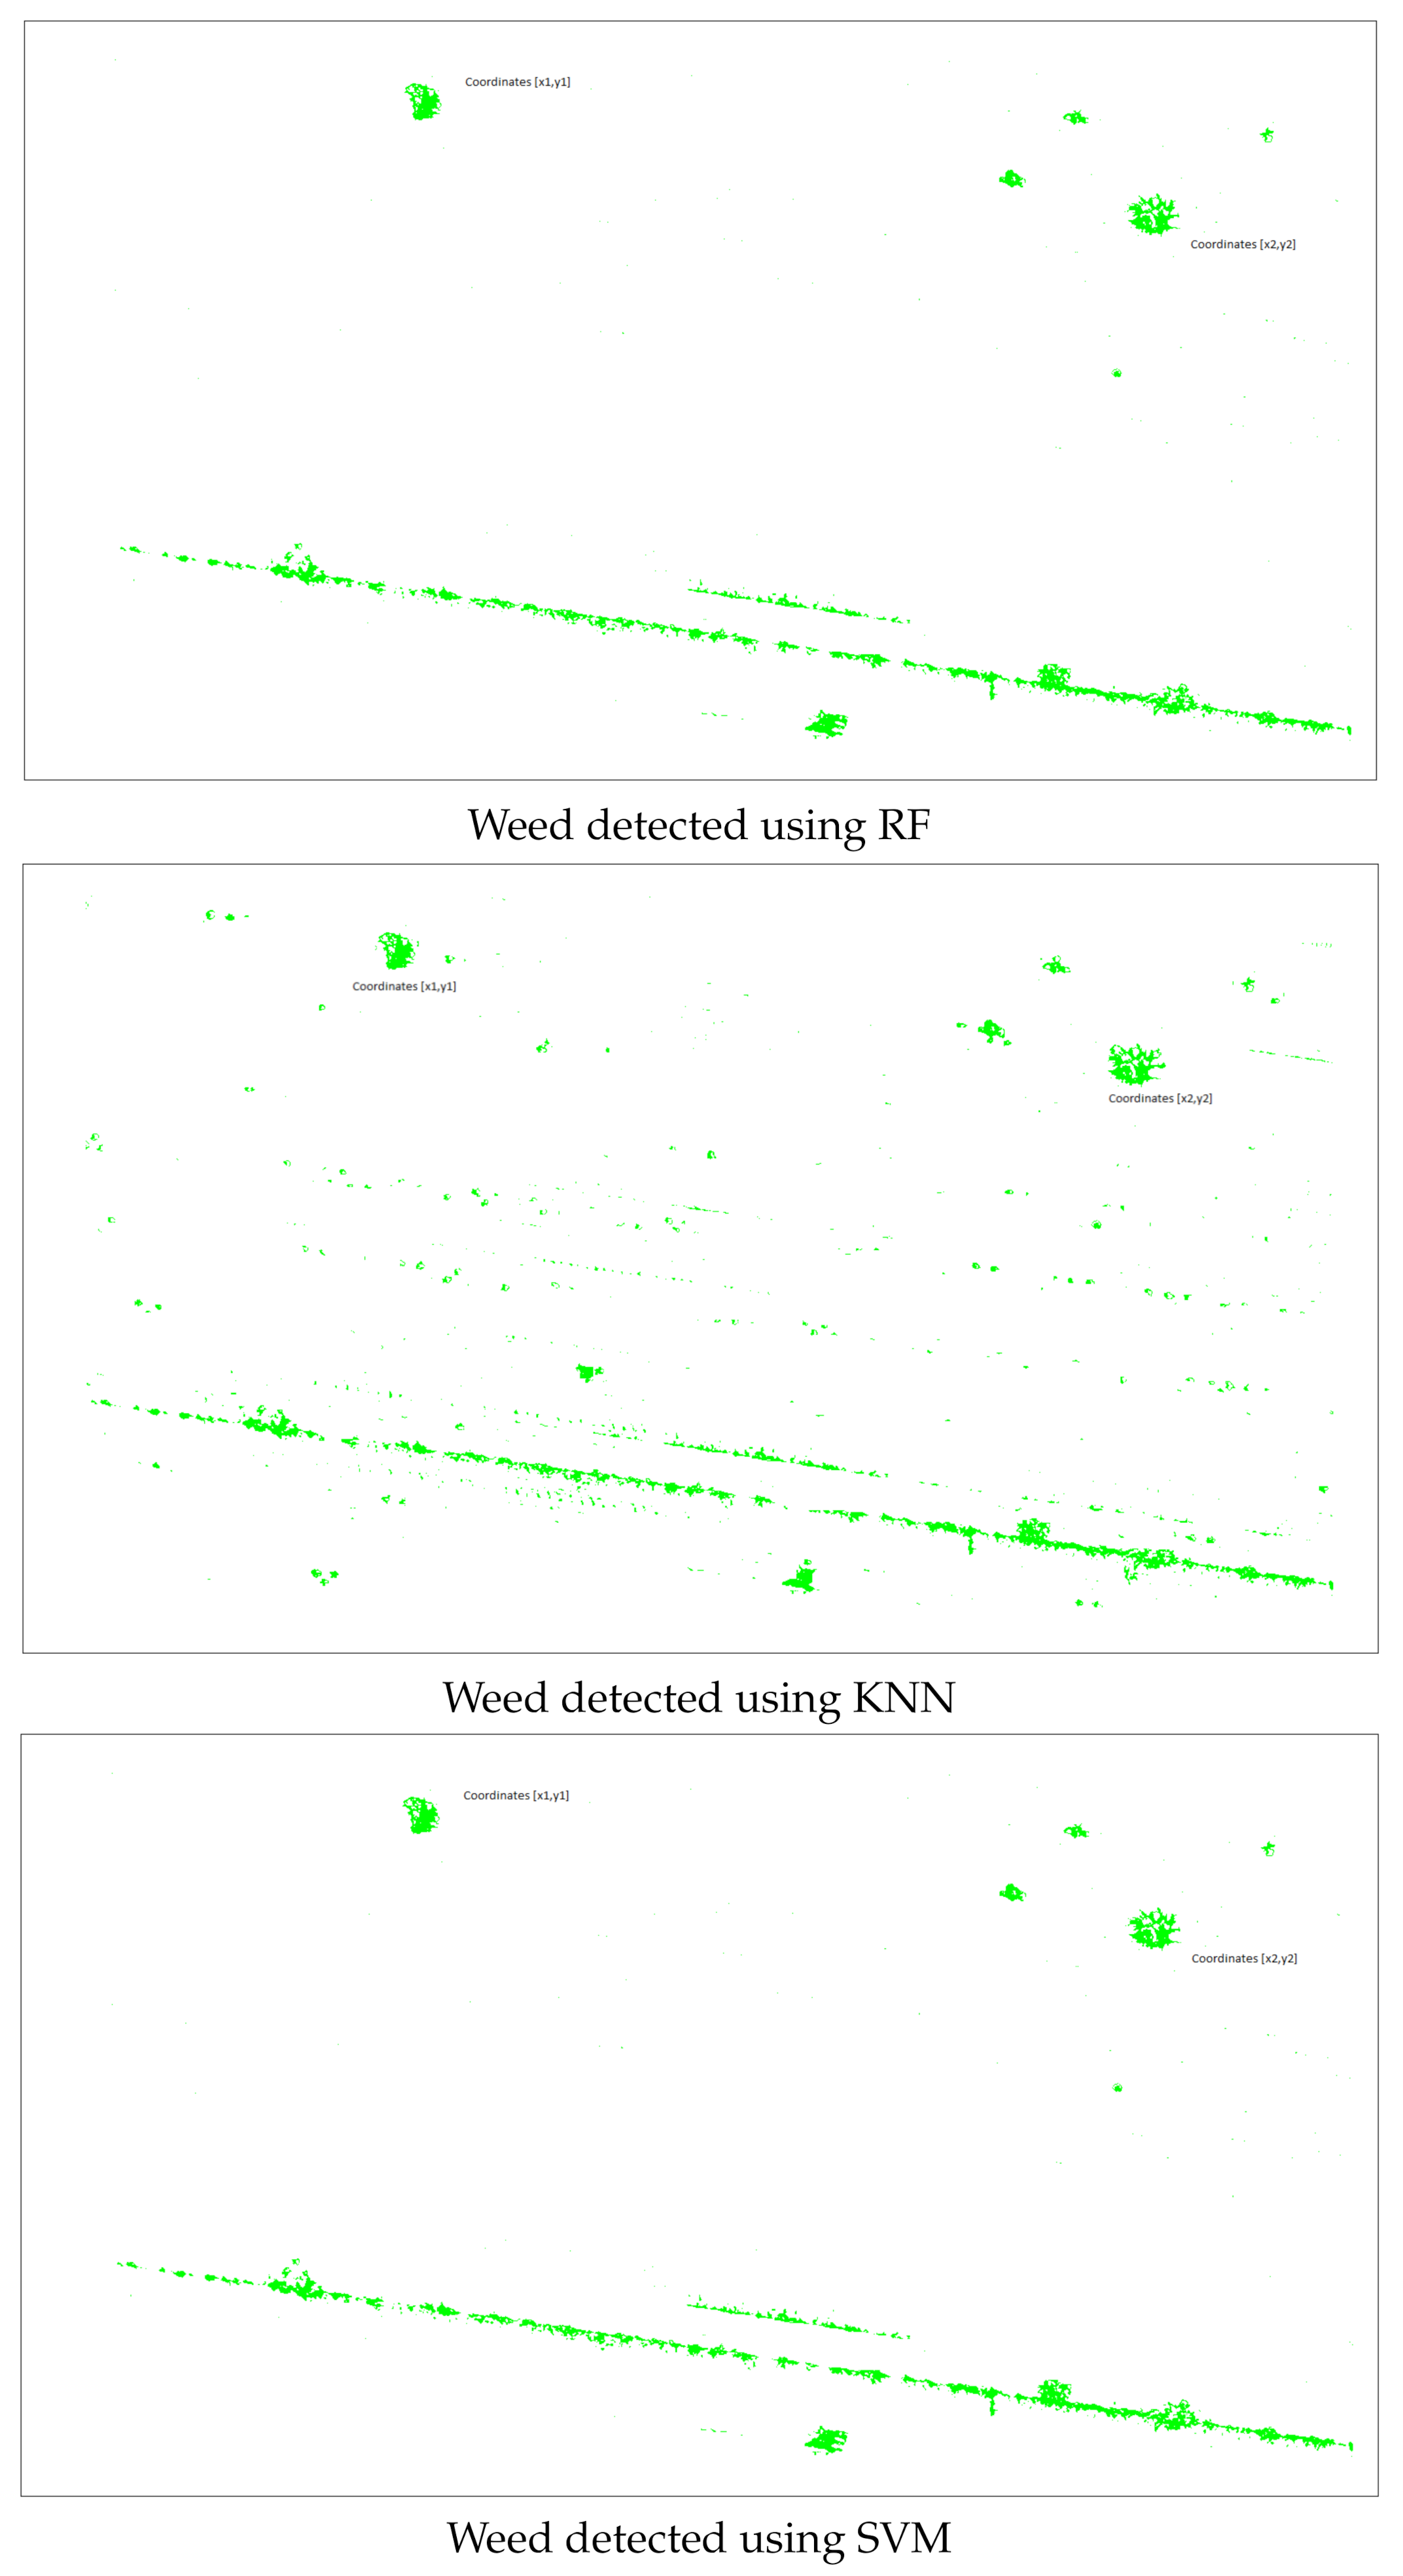
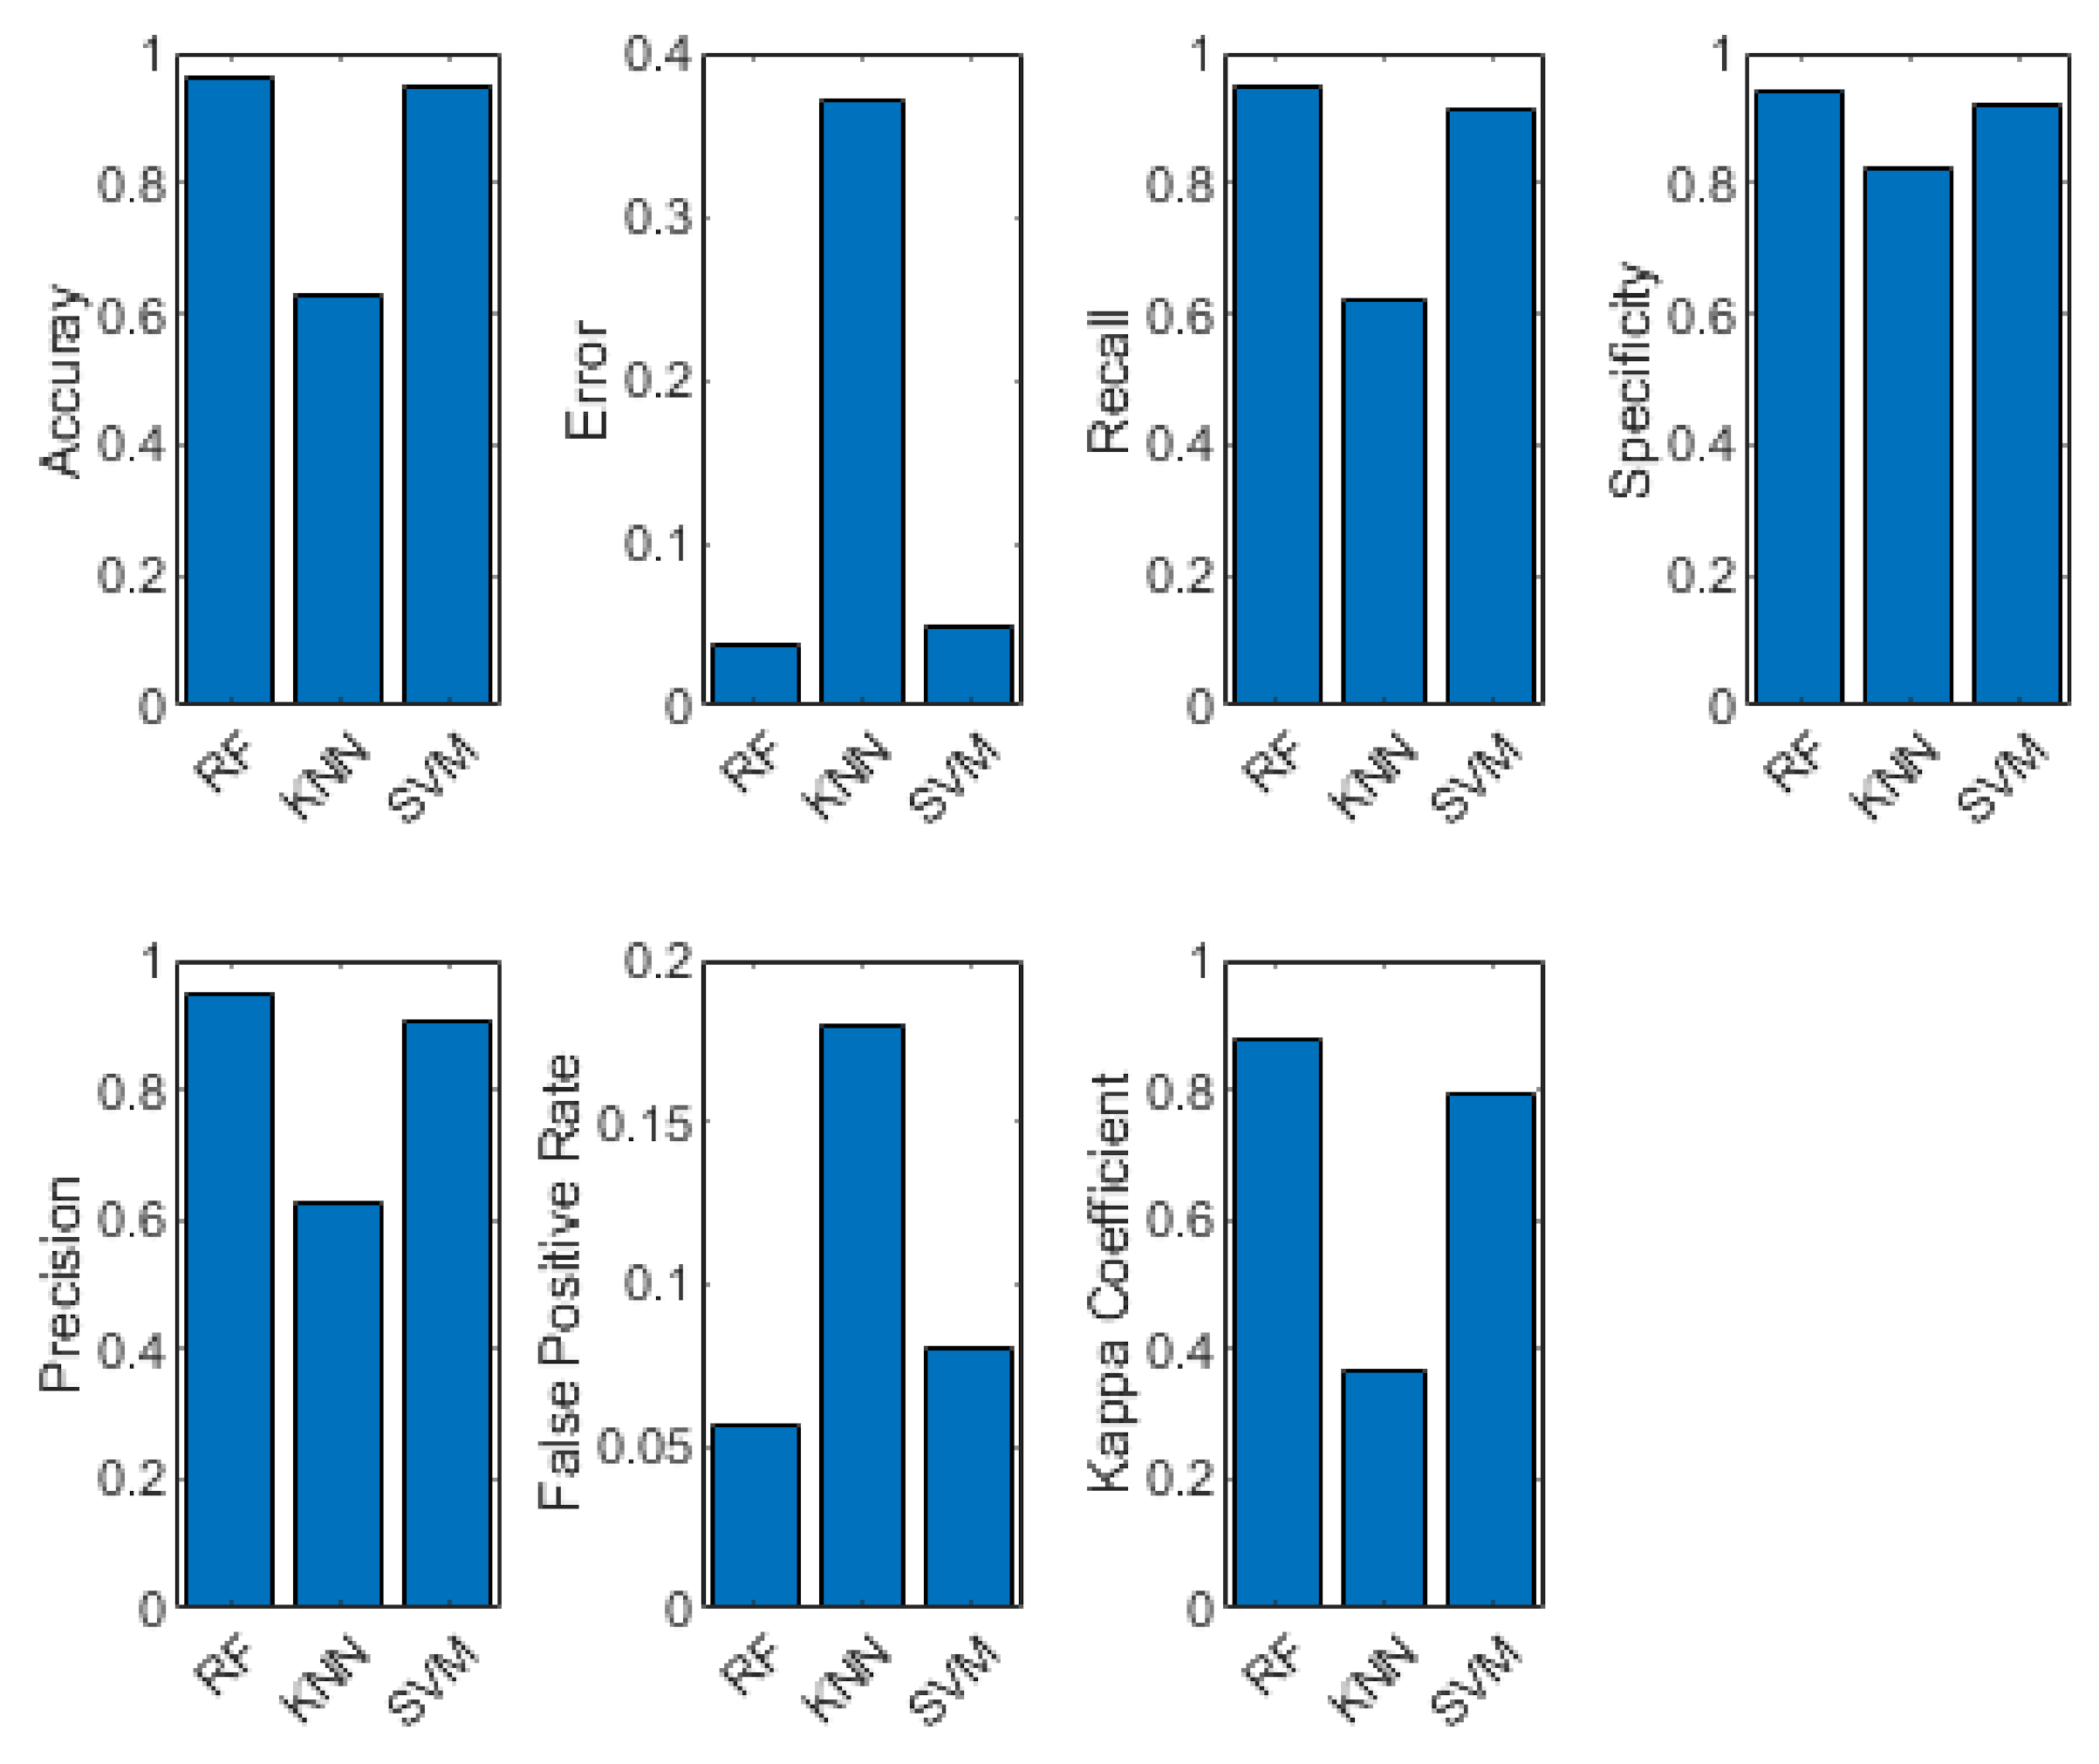
4. Simulation Results

Figure 3 shows the original RGB image of a small part of the farm; and the simulation results of identifying weeds in and within the rows of chilli using RF, KNN and SVM are shown in Figure 4. We have classified three different classes: weeds, crops and unwanted area (bare land and plastic mulch). We only show the weeds class in Figure 4.
We compared and contrasted the weed map with the original image of a small part of the chilli field, as shown in Figure 3. From visual analysis, we can see that the weed map was created properly for RF and SVM. However, we can see some false detection in the KNN map. Once the weed map was created, we used the QGIS software to find the coordinates of that weeded areas. Hence, the farm owner could identify the weeded area and apply manpower to remove the weeds. We compare the performance of RF, KNN and SVM in the following subsection.

Performance Analysis of RF, KNN and SVM

The performance metrics of RF, KNN and SVM were calculated using Equations (1)–(6) and are presented in Table 3.
These matrices are also presented in a bar chart in Figure 5, where we show the performance measures in terms of accuracy, recall, specificity, precision, false positive rate (FPR) and kappa coefficient. The accuracies for RF, KNN and SVM on the test dataset were 0.963, 0.628 and 0.94; RF shows better results than KNN and SVM. The recall and specificity for RF, KNN and SVM were 0.951 and 0.887; 0.621 and 0.819; and 0.911 and 0.890, respectively. The precision, FPR and kappa coefficient for RF, KNN and SVM were 0.949, 0.057 and 0.878; 0.624, 0.180 and 0.364; and 0.908, 0.08 and 0.825, respectively. Similarly to the accuracy metric, RF showed better results than the others in all other metrics. SVM also performed well. However, RF was more accurate than SVM. On the other hand, KNN did not perform well on our dataset. Therefore, it is evident that both RF and SVM are efficient classifiers for weed detection from UAV images.

5. Conclusions

Early weed detection is crucial in agricultural productivity, as weeds act as a pest to crops. This work aimed to detect weeds in a chilli field using image processing and machine learning techniques. The UAV images were collected from an Australian chilli farm, and these images were pre-processed using image processing techniques. Then features were extracted from the images to distinguish properties of weeds and the crop. Three different classifiers were tested using those properties: RF, SVM, and KNN. The experimental results demonstrate that RF performed better than the other classifiers in terms of accuracy and other performance metrics. RF and SVM offered 96 % and 94 % accuracy in weed detection from RGB images, respectively, whereas KNN offered only 63 % accuracy. In the future, we will explore multispectral and hyperspectral UAV images, and will apply deep learning algorithms to increase the accuracy of weed detection.

Author Contributions

Conceptualisation, N.I., M.M.R., S.W., C.-Y.X. and A.M.; methodology, N.I., M.M.R. and S.W.; software, N.I., M.M.R. and S.M.R.; validation, N.I., M.M.R. and S.W.; resources, C.-Y.X.; writing—original draft preparation, N.I., M.M.R., S.W. and S.A.W.; writing—review and editing N.I., M.M.R., S.W., A.M. and C.-Y.X., supervision S.M.; funding acquisition N.I., M.M.R. and S.A.W. All authors have read and agreed to the published version of the manuscript.

Funding

This research was funded by New Staff Research Grant-2019, CQUniversity, grant number RSH/5339.

Institutional Review Board Statement

Not applicable.

Informed Consent Statement

Not applicable.

Acknowledgments

We would like to thank AustChilli Group, Australia, for allowing us to collect the images from their farm. This research was partially funded by research project grant-RSH/5339, funded by Central Queensland University, Australia.

Conflicts of Interest

The authors declare no conflict of interest.

Abbreviations

The following abbreviations are used in this manuscript:
FPRFalse positive rate
KNNK-nearest neighbour
MLMachine learning
NDVINormalised difference vegetation index
OBIAObject based image analysis
RFRandom forest
SVMSupport vector machine
UAVUnmanned aerial vehicle

References

  1. Singh, A.; Ganapathysubramanian, B.; Singh, A.K.; Sarkar, S. Machine Learning for High-Throughput Stress Phenotyping in Plants. Trends Plant Sci. 2016, 21, 110–124. [Google Scholar] [CrossRef] [PubMed] [Green Version]
  2. Dadashzadeh, M.; Abbaspour-Gilandeh, Y.; Mesri-Gundoshmian, T.; Sabzi, S.; Hernández-Hernández, J.L.; Hernández-Hernández, M.; Arribas, J.I. Weed Classification for Site-Specific Weed Management Using an Automated Stereo Computer-Vision Machine-Learning System in Rice Fields. Plants 2020, 9, 559. [Google Scholar] [CrossRef] [PubMed]
  3. Alam, M.; Alam, M.S.; Roman, M.; Tufail, M.; Khan, M.U.; Khan, M.T. Real-Time Machine-Learning Based Crop/Weed Detection and Classification for Variable-Rate Spraying in Precision Agriculture. In Proceedings of the 2020 7th International Conference on Electrical and Electronics Engineering (ICEEE), Antalya, Turkey, 14–16 April 2020; pp. 273–280. [Google Scholar]
  4. Tu, Y.H.; Johansen, K.; Phinn, S.; Robson, A. Measuring canopy structure and condition using multi-spectral UAS imagery in a horticultural environment. Remote Sens. 2019, 11, 269. [Google Scholar] [CrossRef] [Green Version]
  5. Gao, J.; Nuyttens, D.; Lootens, P.; He, Y.; Pieters, J.G. Recognising weeds in a maize crop using a random forest machine-learning algorithm and near-infrared snapshot mosaic hyperspectral imagery. Biosyst. Eng. 2018, 170, 39–50. [Google Scholar] [CrossRef]
  6. Myers, S.S.; Smith, M.R.; Guth, S.; Golden, C.D.; Vaitla, B.; Mueller, N.D.; Dangour, A.D.; Huybers, P. Climate change and global food systems: Potential impacts on food security and undernutrition. Annu. Rev. Public Health 2017, 38, 259–277. [Google Scholar] [CrossRef]
  7. Aharon, S.; Peleg, Z.; Argaman, E.; Ben-David, R.; Lati, R.N. Image-Based High-Throughput Phenotyping of Cereals Early Vigor and Weed-Competitiveness Traits. Remote Sens. 2020, 12, 3877. [Google Scholar] [CrossRef]
  8. Herrmann, I.; Bdolach, E.; Montekyo, Y.; Rachmilevitch, S.; Townsend, P.A.; Karnieli, A. Assessment of maize yield and phenology by drone-mounted superspectral camera. Precis. Agric. 2020, 21, 51–76. [Google Scholar] [CrossRef]
  9. Kawamura, K.; Asai, H.; Yasuda, T.; Soisouvanh, P.; Phongchanmixay, S. Discriminating crops/weeds in an upland rice field from UAV images with the SLIC-RF algorithm. Plant Prod. Sci. 2020, 1–18. [Google Scholar] [CrossRef]
  10. Zisi, T.; Alexandridis, T.K.; Kaplanis, S.; Navrozidis, I.; Tamouridou, A.A.; Lagopodi, A.; Moshou, D.; Polychronos, V. Incorporating surface elevation information in UAV multispectral images for mapping weed patches. J. Imaging 2018, 4, 132. [Google Scholar] [CrossRef] [Green Version]
  11. Islam, N.; Rashid, M.M.; Pasandideh, F.; Ray, B.; Moore, S.; Kadel, R. A Review of Applications and Communication Technologies for Internet of Things (IoT) and Unmanned Aerial Vehicle (UAV) Based Sustainable Smart Farming. Sustainability 2021, 13, 1821. [Google Scholar] [CrossRef]
  12. Islam, N.; Rashid, M.M.; Wibowo, S.; Wasimi, S.; Morshed, A.; Xu, C. Machine learning based approach for Weed Detection in Chilli field using RGB images. In Proceedings of the 16th International Conference on Fuzzy Systems and Knowledge Discovery (FSKD), Xi’an, China, 19–21 December 2020. [Google Scholar]
  13. De Castro, A.I.; Torres-Sánchez, J.; Peña, J.M.; Jiménez-Brenes, F.M.; Csillik, O.; López-Granados, F. An automatic random forest-OBIA algorithm for early weed mapping between and within crop rows using UAV imagery. Remote Sens. 2018, 10, 285. [Google Scholar] [CrossRef] [Green Version]
  14. Etienne, A.; Saraswat, D. Machine learning approaches to automate weed detection by UAV based sensors. In Autonomous Air and Ground Sensing Systems for Agricultural Optimization and Phenotyping IV; International Society for Optics and Photonics: Bellingham, WA, USA, 2019; Volume 11008, p. 110080R. [Google Scholar]
  15. Ronay, I.; Ephrath, J.E.; Eizenberg, H.; Blumberg, D.G.; Maman, S. Hyperspectral Reflectance and Indices for Characterizing the Dynamics of Crop–Weed Competition for Water. Remote Sens. 2021, 13, 513. [Google Scholar] [CrossRef]
  16. Tian, H.; Wang, T.; Liu, Y.; Qiao, X.; Li, Y. Computer vision technology in agricultural automation—A review. Inf. Process. Agric. 2020, 7, 1–19. [Google Scholar] [CrossRef]
  17. Wang, A.; Zhang, W.; Wei, X. A review on weed detection using ground-based machine vision and image processing techniques. Comput. Electron. Agric. 2019, 158, 226–240. [Google Scholar] [CrossRef]
  18. Herrmann, I.; Shapira, U.; Kinast, S.; Karnieli, A.; Bonfil, D. Ground-level hyperspectral imagery for detecting weeds in wheat fields. Precis. Agric. 2013, 14, 637–659. [Google Scholar] [CrossRef]
  19. Weis, M.; Gutjahr, C.; Ayala, V.R.; Gerhards, R.; Ritter, C.; Schölderle, F. Precision farming for weed management: Techniques. Gesunde Pflanz. 2008, 60, 171–181. [Google Scholar] [CrossRef]
  20. Liakos, K.G.; Busato, P.; Moshou, D.; Pearson, S.; Bochtis, D. Machine learning in agriculture: A review. Sensors 2018, 18, 2674. [Google Scholar] [CrossRef] [Green Version]
  21. Chabot, D.; Dillon, C.; Shemrock, A.; Weissflog, N.; Sager, E.P. An object-based image analysis workflow for monitoring shallow-water aquatic vegetation in multispectral drone imagery. ISPRS Int. J. Geo-Inf. 2018, 7, 294. [Google Scholar] [CrossRef] [Green Version]
  22. Brinkhoff, J.; Vardanega, J.; Robson, A.J. Land Cover Classification of Nine Perennial Crops Using Sentinel-1 and-2 Data. Remote Sens. 2020, 12, 96. [Google Scholar] [CrossRef] [Green Version]
  23. Zhang, S.; Guo, J.; Wang, Z. Combing K-means Clustering and Local Weighted Maximum Discriminant Projections for Weed Species Recognition. Front. Comput. Sci. 2019, 1, 4. [Google Scholar] [CrossRef]
  24. Bakhshipour, A.; Jafari, A. Evaluation of support vector machine and artificial neural networks in weed detection using shape features. Comput. Electron. Agric. 2018, 145, 153–160. [Google Scholar] [CrossRef]
  25. Abouzahir, S.; Sadik, M.; Sabir, E. Enhanced Approach for Weeds Species Detection Using Machine Vision. In Proceedings of the 2018 International Conference on Electronics, Control, Optimization and Computer Science (ICECOCS), Kenitra, Morocco, 5–6 December 2018; pp. 1–6. [Google Scholar]
  26. Kazmi, W.; Garcia-Ruiz, F.J.; Nielsen, J.; Rasmussen, J.; Andersen, H.J. Detecting creeping thistle in sugar beet fields using vegetation indices. Comput. Electron. Agric. 2015, 112, 10–19. [Google Scholar] [CrossRef] [Green Version]
  27. Pérez-Ortiz, M.; Peña, J.M.; Gutiérrez, P.A.; Torres-Sánchez, J.; Hervás-Martínez, C.; López-Granados, F. Selecting patterns and features for between-and within-crop-row weed mapping using UAV-imagery. Expert Syst. Appl. 2016, 47, 85–94. [Google Scholar] [CrossRef] [Green Version]
  28. Ahmed, F.; Al-Mamun, H.A.; Bari, A.H.; Hossain, E.; Kwan, P. Classification of crops and weeds from digital images: A support vector machine approach. Crop Prot. 2012, 40, 98–104. [Google Scholar] [CrossRef]
  29. Lameski, P.; Zdravevski, E.; Trajkovik, V.; Kulakov, A. Weed detection dataset with rgb images taken under variable light conditions. In Proceedings of the International Conference on ICT Innovations, Skopje, Macedonia, 18–23 September 2017; pp. 112–119. [Google Scholar]
  30. Hung, C.; Xu, Z.; Sukkarieh, S. Feature learning based approach for weed classification using high resolution aerial images from a digital camera mounted on a UAV. Remote Sens. 2014, 6, 12037–12054. [Google Scholar] [CrossRef] [Green Version]
  31. Andújar, D.; Weis, M.; Gerhards, R. An ultrasonic system for weed detection in cereal crops. Sensors 2012, 12, 17343–17357. [Google Scholar] [CrossRef] [PubMed]
  32. Breiman, L. Random forests. Mach. Learn. 2001, 45, 5–32. [Google Scholar] [CrossRef] [Green Version]
  33. Suomela, P. Construction of Nearest Neighbour Systems; Suomalainen Tiedeakatemia: Helsinki, Finland, 1976. [Google Scholar]
  34. Feyaerts, F.; Van Gool, L. Multi-spectral vision system for weed detection. Pattern Recognit. Lett. 2001, 22, 667–674. [Google Scholar] [CrossRef]
  35. Cohen, J. A coefficient of agreement for nominal scales. Educ. Psychol. Meas. 1960, 20, 37–46. [Google Scholar] [CrossRef]
  36. Gupta, D.; Malviya, A.; Singh, S. Performance analysis of classification tree learning algorithms. Int. J. Comput. Appl. 2012, 55, 39–44. [Google Scholar]
  37. Kandhasamy, J.P.; Balamurali, S. Performance analysis of classifier models to predict diabetes mellitus. Procedia Comput. Sci. 2015, 47, 45–51. [Google Scholar] [CrossRef] [Green Version]
Figure 1. The workflow of our proposed approach.
Agriculture 11 00387 g001
Figure 2. Labelled image to train the ML algorithms. (Crops are labelled in green, weeds are labelled in red and unwanted area is labelled as white).
Agriculture 11 00387 g002
Figure 3. RGB image of a part of the chilli field.
Agriculture 11 00387 g003
Figure 4. Weed detection using three different machine learning algorithm (RF, KNN, SVM).
Agriculture 11 00387 g004
Figure 5. Comparison of performance matrices for RF, KNN and SVM.
Agriculture 11 00387 g005
Table 1. Machine learning techniques for weed detection.
AuthorYearProblem DefinitionTargeted CropDatasetModel/ToolsAccuracy
Alam et al. [3]2020Crop/weed detection and classificationUnspecifiedImages were collected from private farmRF95%
Brinkhoff et al. [22]2020Land cover mapping9 perennial cropsImages were taken from the Riverina region in NSW, AustraliaSVM84.8%
Aaron et al. [14]2019Weed detection by UAVMaizeImages were collected from private farmNVDI digit, YOLOv3 Detector98%
Zhang et al. [23]2019Weeds species recognition8 weed plants1600 weed images were taken from South China crop fieldSVM92.35%
Y-H Tu et al. [4]2019Measuring Canopy structureAvocado treeAvocado field Bundaberg, AustraliaRF96%
Adel et al. [24]2018Weed detection using shape featureSugar beetImages were taken Shiraz University, IranSVM95%
Abouzahir et al. [25]2018Weeds species detectionSoybeanImages were collected from Sâa José farm, BrazilSVM95.07%
J Gao et al. [5]2018Weeds recognitionMaizeImages were taken from crop field of BelgiumRF, KNN81% 76.95%
Castro et al [13]2018Early Weed mappingSunflower, cottonImages were taken from crop field of SpainRF87.9%
D Chabot et al. [21]2018Monitoring water aquatic vegetationStratiotes aloidesTrent-Severn Waterway in Ontario, CanadaRF92.19%
Maria et al. [27]2016weed mapping using UAV-imagerySunflower, maizeImages were collected from private farmSVM95.5%
Faisal et al. [28]2012Classification of crops and weedChilliImages were Collected chilli fieldSVM97%
Table 2. Formulae of vegetation indices which were used in our work (adapted from [4,29,31]).
Vegetation IndexFormula
Normalised red band r = R R e d 255
Normalised green band g = R G r e e n 255
Normalised blue band b = R B l u e 255
Greenness Index G I = R G r e e n R R e d
Excess green E x G = 2 g r b
Excess red E x R = 1.4 r b
Excess green and red E x G E x R = E x G E x R
Table 3. Comparison of performance metrics for the RF classifier, KNN classifier and SVM classifier.
Performance MetricRFKNNSVM
Accuracy0.960.630.94
Recall/Sensitivity0.950.620.91
Specificity0.890.810.89
Precision0.950.620.91
False Positive Rate0.060.180.08
Kappa coefficient0.880.360.83
Publisher’s Note: MDPI stays neutral with regard to jurisdictional claims in published maps and institutional affiliations.

