
Farming Systems Changes in the Urban Shadow: A Mixed Approach Based on Statistical Analysis and Expert Surveys


1
Department of Economics and Food Economy, University of Agriculture in Krakow, Al. Mickiewicza 21, 31-120 Kraków, Poland
2
Department of Economic Policy and Development Programming, Cracow University of Economics, ul. Rakowicka 27, 31-510 Kraków, Poland
*
Author to whom correspondence should be addressed.
Agriculture 2021, 11(5), 455; https://0-doi-org.brum.beds.ac.uk/10.3390/agriculture11050455
Submission received: 8 April 2021
/
Revised: 14 May 2021
/
Accepted: 15 May 2021
/
Published: 18 May 2021
(This article belongs to the Special Issue Recent Advances in Technological and Agronomic Practices for Sustainable Agriculture)
Abstract
:Due to the growth of the “urban shadow”, farming systems in metropolitan areas (MAs) are characterized by specific environmental, economic, and social pressures. Urbanization pressure and its related threats, as well as the opportunities resulting from a convenient location close to consumers’ markets, cause rapid farming systems changes. The present study provides a quali-quantitative overview of change in farming systems in selected Polish metropolitan areas. Various statistical methods were applied to analyze changes in farming systems. First, farming system changes were characterized for the study area by the exploratory factor analysis. In addition, experts’ opinions (qualitative data) on changes in farming systems until 2027 are presented. The research conducted showed that there are a few main patterns in changes to/adaptations of farming systems: Horizontal growth of farms, farmland concentration, process of specialization (horticulture, orchards), trajectories towards more multifunctional farming practices (off-farm diversification, as well as “deepening” and “broadening” strategies), reduction of livestock farming, deintensification and farmland abandonment. Those processes vary in space, and they are only partially explained in terms of distance to the core city (location). Experts forecast that the identified trends will continue, paying attention to the growing importance of multifunctional agriculture and the intensification of recessive processes, including farmland abandonment and excessive deintensification of production. According to the experts surveyed, most farmers will continue to apply traditional development strategies, which will be ineffective without the possibility of increasing the area of farms.
1. Introduction
Metropolitan areas (MAs) in many developed countries are currently undergoing major transformations. The expansion of urban areas entails a transformation in population composition, business structures, employment, farming systems, etc. [1]. These significant changes concern agriculture (farming systems), in particular—both with regards to its spatial and functional dimensions. Urbanization has transformed agricultural areas into mixed spaces characterized by landscape fragmentation and a typically peri-urban socioeconomic context [2]. Traditional farming activities come into conflict with alternative economic, residential, and recreational interests within the MA [3]. Many scholars report conflicts over competition for land [3,4], lower capital profitability of farms [5], problems with succession and finding employees [6,7], as well as conflicts related to the nuisance generated by agriculture (dust, noise, odor, etc.) [8,9]. At the same time, it is emphasized that the peri-urban environment favors the development of multifunctional farms that benefit from the proximity of the city [10,11,12]. Multifunctional farms exploit the potential of the advantageous urban consumer and avoid the manifold disadvantages caused by the city environment resulting in a comprehensive heterogeneity of city adjusted farm strategies [13].
Taking into account both the opportunities and threats related to operating in areas with high urbanization pressure, it should be noted that farmers, households, and land owners make various decisions regarding the allocation of land, labor, and capital resources. Their decisions result in diverse agricultural trajectories, including growth, intensification, on-farm and off-farm diversification, extensification, and decline [2,14,15,16]. Their decisions have direct repercussions on both the spatial distribution of agricultural activities at the farm-level and changes in entire farming systems, and thus determine the role and functions of urban and peri-urban agriculture (UPUA) [17].
Cities and metropolitan peri-urban areas are currently facing huge challenges related to the management of social, economic, and environmental issues [1,10]. Therefore, actions are necessary to direct urban development so that it follows a sustainable, livable, and resilient course [18]. Many studies emphasize the need to develop multifunctional land uses, to which UPUA can contribute [18,19,20,21]. Based on the understanding that urban societies partly depend on functions and services provided by the surrounding peri-urban agriculture, the correct design of territorial strategies for land management becomes crucial [2]. To develop these strategies, it is necessary to have a full understanding of urban and peri-urban faming systems and its changes over time and space, as well as to obtain comprehensive knowledge on the adaptation strategies of farmers and other land users [2].
In this study, changes in farming systems were analyzed. This issue is rarely discussed in the literature [17,22,23]. Nevertheless, the research conducted to date [1,2,3,24,25,26] has shown that in peri-urban areas, changes in farming systems are very dynamic. Moreover, the scholars emphasize that urbanization is the main force shaping farm adaptation processes. In developed countries with a slightly lower level of economic development (e.g., Central and Eastern Europe), no research has been conducted on changes in farming systems in urban and peri-urban areas to date. However, several studies describe a number of very worrying processes, including uncontrolled land grabbing, over-extensification, and land abandonment [27,28,29]. Therefore, a research gap was identified concerning an assessment of the course of adaptation processes in farming systems in the context of increasing urbanization pressure.
The aim of the study is to present changes in farming systems in Polish metropolitan areas, as well as to assess the diversity of these dynamics depending on the location of municipalities in relation to the core city (metropolitan core). The influence of the distance to the core city was analyzed, as a proxy of rural-urban interface relationships.
Based on these aims, in the first part of the study, we define the concept of farming systems and present the main driving forces behind their changes. In the following sections, we discuss how the proximity to the urban centers (measured by distance to the core cities) affects farming systems evolution. Our analyses concern both the past (analysis of agricultural census data using the exploratory factor analysis) and future changes in farming systems. In the second case, based on the assessments made by 112 local experts, we present pathways for Polish peri-urban agriculture until 2027.
2. Research Design and Methodology
2.1. Theoretical Framework
Farming systems (FS) can be described in many ways. Over the years, scholars have used a variety of terms, such as agricultural system, cropping system, integrated crop–livestock farming, to identify agricultural systems based on particular characteristics or definitions [30]. Most scholars agree that a farming system is an economic and agricultural concept holistically describing a farm household [30,31,32]. FS is usually defined in terms of agricultural land use, the systems of crop and livestock production, non-agricultural economic activities, and in terms of the natural, social, economic, infrastructural, and institutional resources that determine all of these economic activities [30,31]. A farming system is also a kind of characterization of a farm household strategy [24,32]. Agricultural land and farming system dynamics can be considered to be the set of processes which cause changes in land use, production systems, adaptation strategies, etc. [33,34,35,36]. Currently, research into farming systems is conducted mainly in response to the challenges of climate change, increasing food demand, ecosystem services, but more often in terms of increasing urbanization [34]. Scholars use a variety of theoretical frameworks, ranging from Boserup’s Agricultural Intensification Theory and subsistence land use by smallholders through to institutional theories and economic rent theories. [33,37]. Analyses have been conducted both at the global and continental level, as well as on a regional and local scale.
Figure 1 shows a set of factors, both internal and external, that can cause farming systems to change over time. External factors include, among others, standardization and commodification of agricultural goods, new marketing devices and globalized marketing of foodstuffs, climate change, urbanization and political factors. On the other hand, two types of internal forces determine peri-urban farming: Available resources and the socio-economic characteristics of a farm [25]. The first group of factors includes quality of the soil, farm size, work force employed, management practices, etc. [26,29]. The socio-economic farm characteristics include farmer age, children, and potential successors to continue the farming business, etc. [6]. A peri-urban farming system is also influenced by specific environmental, economic, and social pressures, due to the “urban shadow”. High population density, attractive labor market, higher incomes, etc. create a number of opportunities (proximity to urban markets) but also threats (high competition for land, potential conflicts with residents, etc.) for urban and peri-urban farms. Location in relation to the city is of key importance [12]. The closer to the city, the greater the impact of the opportunities and threats [2]. Filippini [22] and Inwood and Sharp [12] also noted that in the case of urban and peri-urban areas, location was an important driver of farming systems change.
In this study, the analyses are based on a farming system approach, since it conceives of agriculture as a complex system, where the different elements, (e.g., land resources, labor, crop, and animal management) are related to social, economic, and environmental conditions [22,38].
Moreover, the conducted analyses take the location aspect into account. Based on the assumptions of selected economic theories, an analysis of farming system change depending on the location (distance to the core city) was conducted. It was analyzed, how farming system changes was determined by location and the related barriers, threats, and opportunities for peri-urban agriculture.
2.2. Study Area
The research was conducted in six Polish metropolitan areas—one large one: The Warsaw metropolitan area; four medium-sized ones: The Krakow, Wroclaw, Poznan, and Tricity metropolitan areas, and one small one: The Lublin metropolitan area (Figure 2). The delimitation of these areas (at the municipality level) was based on development documents and strategies adopted by regional authorities [39]. In total, about 25% (9.5 million) of the Polish population live in the analyzed areas (Table 1), but the analyzed metropolitan areas (MAs) differ in terms of population size. The Warsaw MA dominates here, with its core as the only Polish city in excess of 1 million inhabitants. The individual MAs are located in different parts of the country and represent a different level of socio-economic development, including urbanization processes. The analyzed metropolitan areas are characterized by a higher population density than the national average, as well as relatively favorable characteristics of the labor market, including above-average wages.
It should be emphasized that the MAs have primarily rural peri-urban areas where agricultural land (Utilized Agricultural Area—UAA) is spatially dominant—the average share in individual MAs ranges from 45.0% to 66.1% of the total area, but, in some municipalities, it even exceeds 90%. In core cities, the share of UAA ranges from 28.3% in Tricity to 46.0% in Lublin.
2.3. Data Collection
The study employed both primary and secondary sources. The analysis was based on the literature research, which was conducted in the second half of 2020. A statistical analysis of the agricultural census data (1996, 2002, and 2010) for municipalities belonging to the selected metropolitan areas was then carried out. There are no data available for subsequent periods in Polish official statistics. It should also be emphasized that the agricultural census carried out in 2020 did not provide complete data at the municipal level. Moreover, due to changes in the methodology, including the exclusion of some of the smallest farms (<1 ha) from the census, comparisons with previous censuses (at the municipal level) might be difficult. Attempts were made to present changes in farming systems over as long a period as possible, hence the time range of individual characteristics of agriculture is different. The data from agricultural censuses (secondary sources) are complemented by primary sources, i.e., local experts comments (the method of collecting data will be described further in the chapter) who assessed the state of agriculture and farming system changes in 2007–2017. The spatial scope covered 284 municipalities belonging to metropolitan areas, including six core cities.
A total of 25 indicators for each municipality of the Polish metropolitan areas were collected from official statistics (Table 2). The analyses covered private (family) farms, without other actors (companies, cooperatives, etc.). The variables concerned the state and changes in the production factors, as well as the scale and structure of agricultural production. They were selected on the basis of an analysis of the literature [2,40,41], but the availability and comparability of data proved to be a significant limitation. The input characteristics concerning farming systems in 1996, 2002, and 2010 have been presented as indicators (in relative terms), since, for example, due to the different area of municipalities and changes in it over time, it was not possible to base these on absolute values [2].
When assessing the changes in farming systems, various methods of measuring the dynamics were tested, but it was finally decided that a rate of change expressed as a simple difference in the indicators (which are presented in relative terms) over two periods in time would be used [42]. According to Zurek et al. [43], a rate of change is useful for measuring the stability or variability of a system. The use of relative measures based on absolute values caused a number of problems, for example, where the value of a variable at the beginning or end of the period was zero. Moreover, in many cases, relatively small changes in farming systems, e.g., an increase in the share of small farms from 0.001 to 0.1 in relative terms, meant very high dynamics, despite slight absolute changes.
Primary data were obtained from surveys conducted with experts. The respondents were experts familiar with the local agricultural conditions, i.e., scientists and employees of agricultural advisories’ offices, who have at least 20 years of experience and live or work in the areas assessed. The survey was carried out in the second half of 2017. The experts assessed changes in farming systems (plant and animal production, changes in the structure of a farm, etc.), and also indicated possible future changes. The questionnaire was delivered in paper form. At an in-person meeting, the experts were informed about the purpose of the research and given instructions on how to fill in the questionnaires. Completed questionnaires were sent in paper form. The questionnaire consisted of five chapters devoted to the following issues: 1. The conditions of agricultural development under urban pressure; 2. changes of farming systems in the past 10 years (plant and animal production, changes in the farm structure, etc.); 3. expected changes in farming systems in the next 10 years; 4. multifunctionality of peri-urban agriculture; 5. peri-urban agricultural policies. The questions were both open and closed. The present study uses the questions contained in Section 2, Section 3 and Section 4.
All experts completed the questionnaires, providing comprehensive answers and explanations. After verification of the collected questionnaires, some information that was missing in a few cases was gained via an e-mail or a telephone conversation. The survey was conducted in 96 deliberately-selected municipalities, located at varying distances from the cores of metropolitan areas, and characterized by diverse biophysical parameters of land [44]. The number of fully and correctly completed surveys was 112.
The analyzed municipalities were grouped together according to the distance from the core city. In the first part of the study (Section 3.2), the core city and 4 zones of municipalities at different distances from the metropolitan core were classified. The boundaries of individual zones were determined every 10 km, starting from a radius of 25 km from the core [2]. In the second part of the study on changes in agricultural systems in the future (Section 3.3), analyzing the impact of location (due to the smaller number of observations), 3 groups of municipalities were designated: (a) The first group: The core, (b) the second group: Up to 25 km from the core, and (c) the third group: More than 25 km from the core. In each of the six analyzed metropolitan areas, the number of surveys obtained was at least: Two from MA cores, five from municipalities bordering the core (<25 km to the core), and ten from the other MA municipalities (>25 km).
2.4. Data Analysis
Various statistical methods were applied to analyze changes in farming systems (Figure 3). First, using secondary data, (past) farming system changes were characterized for the study area by the exploratory factor analysis [40]. An exploratory factor analysis (EFA) was run on the collected data matrix to investigate multifarious relationships between indicators assessing farming system dynamics [2]. The correlation matrix of variables based on a group of 284 municipalities showed statistically significant relationships, but the scatter plots analysis showed the presence of outliers. A large group of outliers were small towns located in the per-urban areas, where agriculture often plays a marginal role, reducing the correlation of variables. Therefore, it was decided to exclude them from the analysis and, in the end, 236 rural municipalities and 6 core cities qualified for the research.
In the first stage of the analyses, the adequacy of the factor analysis was confirmed by calculating the Kaiser-Meiyer-Olkin index (KMO), which was significantly higher (0.711) than the critical value of 0.5 [45]. After standardizing the variables, an EFA was run. The number of factors to retain was determined using Kaiser’s criterion of retaining factors with eigenvalues greater than 1. In order to achieve the so-called simple structure, the factor loadings were rotated using all the rotation methods available in STATISTICA 13 software, but, in the end, the Varimax method was chosen [40].
Subsequently, after isolating and “naming” the main factors, the resultant factor scores were used to analyze the diversity of farming systems. The analyses (with the Kruskal-Wallis rank test, which is a non-parametric alternative to ANOVA) aimed to show the significance of the location and related urbanization pressure regarding farming system changes.
The analysis of data collected with the use of the survey (primary data) was conducted mainly with the use of quantitative methods, including the Kruskal-Wallis rank test and rank size comparisons, but also qualitative ones. Descriptions were enriched with statements from individual respondents [46]. The experts forecast future changes to agricultural systems by 2027.
All calculations were performed with the use of STATISTICA 13 software (StatSoft, Tulsa, OK, USA).
3. Results
The present section provides a quali-quantitative overview of change in farming systems in selected Polish metropolitan areas. The first two subsections are based on the statistical-based approach (factor analysis and rank size comparisons) and use data from public statistics. The research conducted identified main patterns in adaptations of farming systems (Section 3.1). Furthermore, the analysis allows finding out whether the proximity driver plays a significant role in shaping farming systems (Section 3.2). In the Section 3.3, experts’ opinions (primarily qualitative data) on changes in farming systems until 2027 are presented.
3.1. Identification of Farming System Changes
Factor loadings of the 25 variables (after rotation) are shown in Table 3. Based on Kaiser’s criterion, seven factors were extracted explaining 68.20% of the total variance, which is satisfactory [45].
Factor F1 is positively associated with an increase in the share of farms larger than 10 ha, an increase in the average area of farms, as well as an improvement in the education of farmers. Moreover, a positive correlation was observed with the increase in the share of cereals in crops, and with the share of farms keeping horses. While negative correlations were related to the variables representing the equipment of farms with tractors and combined harvesters (for cereals). F1 illustrates the changes related to horizontal growth combined with the professionalization of agricultural activity expressed by the improvement in education and rational use of agricultural machinery (e.g., fewer tractors are used, but “larger” and newer ones). Reducing the number of tractors per 100 ha of UAA is also a derivative of the increasing size of farms.
Factor F2 identifies changes in farming systems that consist of a decrease in animal production. There are negative correlations of F2 with the share of farms keeping cattle and pigs, as well as total livestock units/100 ha of UAA, while a positive correlation concerns the share of farms without animals. Factor F3 presents opposite processes: (1) Land concentration and increasing the share of land on farms with more than 10 ha, and (2) fragmentation (negative loadings seen in the share of land on a farm of less than 1 ha). F4 identifies the processes of farm specialization in vegetable and fruit production (orchards), and F5 shows increases in the importance of off-farm diversification. Factor F6 presents the processes of farmland abandonment and exiting agriculture, while F7 shows processes of deintensification of agricultural production.
The structure of factor loadings allowed for a fairly unambiguous interpretation of the identified factors. Each factor was closely related to at least two variables.
3.2. Farming System Changes: Analysis of the Impact of Location
Changes in farming systems are dependent on multiple drivers, including location (distance to the core city). In order to verify the significance of the above-mentioned driver of farming systems, a non-parametric version of ANOVA was used with the Kruskal-Wallis test (the variables do not have a normal distribution). Moreover, selected variables with high factor loadings were discussed. The medium rank sizes of factor scores presented in Table 4 illustrate the average position of the objects in groups, and the higher the value, the greater the advancement of the processes analyzed.
Among the identified trajectories in farming systems, only the processes of reduction of livestock farming (F2) and farmland concentration (F3) are significantly affected by the location (distance to the core city). The closer the municipality to the core city, the greater the reduction in animal production observed. In the case of concentration processes, their intensity increases with the decrease in the distance from the metropolitan core. Changes in the other identified processes (farming systems trajectories) are not determined by the distance from the core (no statistical significance at the level of 0.05).
In order to explain the diversification of the processes of changes in farming systems, it is necessary to conduct detailed analyses concerning not only the dynamics but also the individual variables—input characteristics. This is due to the fact that the effect of a low or high statistical base is very significant [43]. For example, in areas with a small population of animals (e.g., in the core cities), a large decrease in the number of animals is not observed, as it is very low at the outset (beginning of the period). In the case of factors whose changes over time are not statistically significant, spatial diversification of input characteristics/variables depending on location relative to the core was analyzed (static analysis for data from 1996, 2020, and 2010). This approach allows finding out whether location played a significant role in the past in shaping farming systems.
3.2.1. Horizontal Growth and Professionalization
The first identified development trajectory of farming systems in Polish MAs are processes of increases in the area of farms and the professionalization of the farming profession. ANOVA tests showed that the location does not significantly affect the course of these processes. Therefore, it could be assumed that horizontal growth processes are universal and their course is similar, regardless of the distance from the core.
Nevertheless, detailed analyses of selected variables correlated with F1 show that in the case of the share of farms larger than 10 ha and the average farm UAA size, there was a statistically significant differentiation in 1996, dependent on distance from the core (Table 5). With an increase in distance from the metropolitan core, both the share of larger farms (>10 ha) and their average size increased (the medium rank size increased). In the following years, both indicators improved, with greater increases in those zones, which were assessed as worse in 1996 (closer to the core), and slower increases in those areas where the indicators achieved higher values. It should therefore be noted that, in the case of processes of horizontal growth, there is a convergence—equalization of the values of indicators in zones located further and closer to the core cities.
No statistically significant differences were noticed in the case of the indicators relating to education—in both periods, the distance from the core city did not have any effect on the level of education of farmers. Research showed that, in 2002–2010, the median share of farmers with higher education increased by 5 percentage points to a level of 12%. In that case, the processes of improving education were noticeable in those areas where the share of better-educated farmers was higher (mainly in the core and its immediate surroundings)—so some divergence was observed.
Most of the experts (83/112) assessing the changes over the recent 10 years (2007–2017) indicated an increase in the average area of farms and increase in the share of larger farms. However, urbanization as a driver of these changes was only mentioned by experts from municipalities directly bordering MA cores. The other experts indicated worldwide trends, including decreasing profitability of production in small farms, as the main driver of these transformations. According to experts, changes in the (farm) land market are faster in metropolitan areas than the average for the country, but they are inhibited by speculation processes. Closer to MA cores, especially in small farms, processes of conversion to non-agricultural purposes are observed. Several experts noted that in areas closer to the MA core, the share of part-time farmers and professionals increases. This is consistent with the data from agricultural censuses.
3.2.2. Reduction of Livestock Farming
In the analyzed MAs, there were dynamic processes of reducing animal production. When analyzing the variables most correlated with F2, it should be noted that, in the period of 1996 to 2010, the median share of farms without animals increased from 18.3% to 50.1%, and the livestock density decreased from 49.2 to 32.9 LU/100 ha of UAA (Table 6). The share of farms without livestock, both in 1996 and 2010, was clearly (and statistically significantly) differentiated depending on the distance from the MA core. Increasing rank size values approaching the core meant a higher frequency of non-livestock farms. When analyzing the dynamics in groups, it should be noted that, in the period of 1996 to 2010, farms located closer to the MA core (up to 35 km) recorded a faster increase in resignation from livestock production. Only at a distance of over 35 km were the reductions relatively smaller. In the case of livestock density, similar relationships and trends could be observed, with relatively smaller decreases in livestock density (manifested by an increase in rank size in the period of 1996 to 2010) noticed only at a distance of more than 45 km from the city core. The exception were the city cores, where, despite the greatest urbanization pressure, an increase in livestock density was recorded. However, that might be the result of the creation of a few very large entities (industrial farms) dealing with industrial livestock production.
The analysis of changes in livestock production showed that there was a deepening differentiation (divergence): In areas with a relatively low share of livestock farms and low production intensity, the reductions were even greater than in other areas. Nevertheless, in all areas, especially those located further from the MA core, processes of concentration of production were observed: Livestock density decreased much slower than the number of livestock farms. For example, in zones located more than 35 km from the core city, there was an almost three-fold increase in the share of farms without livestock, and the decrease in livestock density was within the range of 15%–30%.
Moreover, the experts almost unanimously claim that in the period 2007–2017 clear processes of reduction in the livestock population occurred. As many 42 out of 112 experts estimated that the number of livestock farms decreased by over 70%. In some municipalities, livestock production was almost completely suppressed, with a few large farms—most often with cattle—left. As the main reasons for resigning from livestock production, the experts cited (according to the number of indications): Decrease in profitability compared to other sectors of the economy, high labor intensity and lack of people willing to work/take over the farm, attractive urban labor market and necessity of incurring high investment costs (adjusting production to cross compliance rules). A dozen or so (19) experts, who mainly assessed cities and municipalities located directly at the borders of cities, also indicated problems connected with neighborly conflicts, which prompted resignation from livestock production.
3.2.3. Farmland Concentration
In the analyzed metropolitan areas, processes of farmland concentration were identified, and the ANOVA analysis showed that they proceeded at a different rate depending on the location. The median share of land on farms of >10 ha increased from 45.7% in 1996 to 55.3% in 2010, while the median share of land on farms of <1 ha decreased from 2.4% to 1.5% (Table 7). It should be noted that there was an improvement in the area structure and land concentration. Nevertheless, in about 20% of municipalities, the process of deconcentration continues (the share of land on the smallest farms is increasing).
When observing the differentiation of the share of land on farms of < 1 ha, it should be noted that the shares of very fragmented land decreased with an increasing distance from the core. Changes (over time) in the value of the medium rank size for individual groups of municipalities indicated an improvement mainly in the MA cores and zone 1, and a relative deterioration in the remaining ones (slower processes of reducing the share of land on farm of <1 ha). In the case of the share of land on farms of >10 ha (in 1996 and 2010), there was no significant differentiation between the groups. However, in that case, the farm size structure improved (increase share of land on farms >10 ha) in MA cores and zone 1 (<25 km).
Experts mostly agree that urbanization accelerates not only deconcentration processes, but also concentration processes, i.e., increase in the share of larger farms. The closer to the MA core, the faster these processes proceed. However, location in different parts of the country is even more important. Experts note that in the metropolitan areas of Tricity, Poznan, and Wroclaw, farming land is transferred from smaller to larger farms and concentration occurs. In the other areas (MAs of Krakow, Lublin, and Warsaw), experts do not indicate clear directions of changes, pointing to huge problems in land markets related to farm fragmentation. They stress, however, that “official statistics” do not show real changes, as concentration processes often take the form of informal land loan contracts (rental agreements).
3.2.4. Specialization (Vegetables and Orchards)
There were dynamic changes in vegetable and fruit production (orchards) in the surveyed MAs, but it was difficult to assess them relating to all municipalities. ANOVA showed no statistical differentiation in the dynamics of vegetable production and fruit growing. When interpreting the results, it should be noted that, on the one hand, a decrease in the median value of the share of vegetables from 1.2% to 0.7% (Table 8) was observed. On the other hand, taking into account a share of the total vegetable cultivation area on arable land (ARA), the share of vegetables increased from 2.7% to 2.9% in the period from 1996 to 2010 (Table 2). Similarly, the value of the 3rd quartile increased from 2.4% to 2.5% in 2010. However, changes in vegetable areas were accompanied by a 25 percentage point decrease in the share of farms with vegetables. That data clearly indicated dynamic processes of concentration of production. Moreover, the increase in the share of vegetables in the crops structure took place in those municipalities where vegetable production was very important. In areas where, in 1996, the share of vegetables exceeded 10% (that applied to 7% of municipalities), the median increased from 20.9% in 1996 to 24.0% in 2010. While in the case of areas where, in 1996, the share of vegetables exceeded 20% (concerning 4% of municipalities), the increase in the median in the years from 1996 to 2010 was of 6 percentage points. When looking at statistical measures for the whole MA area, the indicated processes of increasing concentration of production became blurred (average) and were not statistically significant.
Nevertheless, both in 1996 and in 2010, there was a significant statistical differentiation in groups depending on the distance from the MA core: The share of vegetables decreased as the distance from the core increased. Changes in the medium rank size for individual groups in the period from 1996 to 2010 indicated a relative decrease in the share of vegetables in areas up to 25 km away from the MA core and an increase at 25–35 km away from the core. In the zone furthest from the core, there was also a relative increase (in the share of vegetables), but low values of the medium rank size indicated that the share of vegetables in the crops was low.
In the case of changes in the share of permanent crops (including orchards), analogous relationships were seen to occur. The analysis of the median of that variable showed a decrease by 0.2 percentage points, and the values of the 3rd quartile (Q3) and the ratio of the total area of permanent crops to the total area of agricultural land (for all municipalities) indicated an increase (Table 2). Moreover, in that case, production was concentrated in well-established areas of permanent crop production. The high dynamics of increasing the share of those crops (the median increased from 8% to 17%) occurred mainly in the areas where, in 1996, their share exceeded 7% of the UAA. As in the case of vegetables, both in 1996 and 2010, there was a correlation between the percentage of permanent crops and the distance from the core: As the distance from the city increased, the percentage decreased.
Experts confirm the polarization presented in official statistics: On the one hand, the number of farms growing vegetables and possessing orchards is decreasing, while on the other hand, there is a clear professionalization and concentration of production. In municipalities where vegetable growing and orchards dominate, dynamic processes of farm development occur, and farmland is transferred from smaller to larger farms. Experts note that location relative to the core is of secondary importance. Of more importance to the growth of such production are bio-physical characteristics of soil and climate (in the case of orchards)—where these characteristic are favorable and production grows.
3.2.5. Off-Farm Diversification of Income
The ANOVA did not show any significant differences in the dynamics of off-farm diversification processes in spatial (distance) terms (Table 9). However, a levelling out in the intensity of economic activity and the importance of non-agricultural income in zones 1–3 was visible. While, in 1996, in the case of both variables, the differentiation was clear and strongly related to the distance to the core, in 2010, the differences were blurred. It is possible that market saturation had taken place especially in the core and zone 1 and therefore further increases were relatively small.
According to experts, off-farm diversification is playing an increasing role in the agriculture of MA. In the period 2007–2017, 70% of them noted an increase in the number of farmers deciding to start the non-agricultural activity. The main reason for undertaking such activity was (according to the number of indications): Low profitability of agricultural production (and necessity of seeking an alternative), desire to better use the farm’s resources (labor and capital), and desire to diversify income. One of the experts from Wroclaw MA (WR32) noted that it was resignation from agricultural production, in particular livestock production, that initiated an increase in the number of farmers running their own businesses: “it was necessary to seek lost income, and as a result of abandoning livestock production farmers gained a lot of free time.” This may partially explain the faster (over recent 10 years) increase in off-farm diversification processes in municipalities located further from the core, where total or partial resignation from agricultural production was delayed in relation to typically peri-urban municipalities—subject to strong urbanization pressure.
3.2.6. Farmland Abandonment and Exit from Farming Activities
The conducted analyses showed that during the researched period, the recessive processes in MAs were visible. They were expressed as an exit from farming activities and farmland abandonment. Those processes were intensifying, since, in 1996, in half of all the municipalities, less than 1.1% of farms were not conducting agricultural activity—while, in 2010, that indicator was 4.2% (Table 10). In practice, the actual advancement of the exit from farming was greater, as that data showed only farms that had completely ceased production. They were slightly better illustrated by the second indicator: The share of farmland abandonment.
According to the data for 2010, in half of the analyzed municipalities, farmland abandonment accounted for over 9.7% of AA, but detailed analyses showed that those recessive processes were highly polarized: In some municipalities they hardly occurred at all, and in some they constituted a very big problem (in 1/4 of municipalities, the percentage of farmland abandonment in 2010 exceeded 21.6%). The problem of a very large scale of farmland abandonment mainly concerned some of the areas located in the MAs of Krakow and Warsaw, where, at the same time, there was a high fragmentation of farms and weak biophysical characteristics of farmland [29]. The analyses showed that the distance to the core city was not the main driver of farmland abandonment and exits from farming. Although there was a slightly higher intensity of recessive processes in the MA cores and zone 1 of municipalities, the ANOVA showed that those differences were not statistically significant.
As many as 40% of experts think that in Polish MAs abandonment processes have significantly increased over the recent 10 years, and currently in some of them they pose a potential risk to sustainable development (loss of production function, agrobiodiversity loss, landscape degradation, etc.). These problems, according to experts, do not affect all metropolitan areas to the same extent. By far the worst situation is in Krakow, Warsaw, and Lublin MPUs, where in some municipalities up to 50% of farmland may be at various stages of abandonment. In others, especially in Poznan and Tricty MPUs, farmland abandonment occurs in very few municipalities. As the main reason for farmland abandonment, experts indicate fragmentation of farmland and increasing disparities in income in agriculture and in other sectors of the economy, which result in exiting the agricultural sector. “It is mostly areas with low biophysical parameters and highly fragmented that are abandoned, hence despite willingness, it is difficult to find buyers for them” (Ekspert KR 107).
3.2.7. Deintensification
In addition to the processes of farmland abandonment and exiting from agriculture in the studied MAs, the occurrence of deintensification processes was observed. Those processes were described as: An increase in the share of subsistence farms and a slow reduction in the share of permanent grasslands in relation to the reduction of livestock production. In the case of the first variable, there was an increase in the median from 6.1% in 1996 to 13.1% in 2010, and an over-proportional increase in the share of subsistence farms occurred in zones 1 and 3. In 2010, in 25% of municipalities, the percentage of farms producing for their own needs exceeded 25%, which proved a decrease in production intensity. Those processes may not be explained by the distance from the core.
In the case of share of permanent grassland (PG) in the UAA, the situation was slightly different. Although there was a decrease in the share of PG (the median dropped from 15% to 11.7%), but, in 25% of municipalities that indicator decreased only by less than 2 percentage points. Taking into account an increase (which was more than two-fold) in the share of non-livestock farms, the share of PG would not be used for production purposes. According to estimates by Sroka et al. [29], in Polish MAs in 2010, at least 25% of PG was not used due to the lack of an appropriate number of livestock, and in some MAs, e.g., in Krakow, this figure was even over 35%. ANOVA showed that there was no differentiation of both indicators, both in static and dynamic terms. Therefore, the distance from the core did not affect the course of the processes extensification of production.
According to experts, deintensification processes are the first stage of abandonment and exit from agriculture. As in the case of abandonment, the driver of such changes is the decreasing profitability of production in agriculture and related fragmentation of farmland. Location relative to the core has merely an indirect impact (through the labor market) on that process, as it is only observed in a portion of metropolitan areas. Several experts noted that this process is intensified by the desire to obtain CAP payments.
3.3. Future Changes of Farming Systems—Until 2027—Experts’ Opinions
3.3.1. Processes of Farm Horizontal Growth as Traditional Development Path
About 1/3 of respondents (39/112 experts) believe that processes of increasing the average area of farms should be expected over the next 10 years. However, these processes will occur in areas with a more advantageous farm structure, i.e., mainly in the MAs of Poznan, the Tricity, and Wroclaw. In the remaining areas, i.e., the MAs of Krakow, Lublin, and Warsaw, experts are more skeptical about the prospects for the horizontal growth of farms, but most agree that the area of some of the best farms should be expected to increase in size. In their opinion, small and very small farms will also continue to operate in MAs, which, by not “transferring” land to other entities, will hinder the development of other farms. Nevertheless, several experts from the Krakow and Lublin MAs provide reassurances that, in most areas, there will be some increases in the area of farms, but they will be largely based on leases and, above all, “rental agreements”. Such rental agreements are usually based on an oral agreement, and thus, are informal. An expert from the Krakow MA (KR91) explains that land owners, especially those with land in “good locations”, do not even consider long-term (e.g., 10-year) lease contracts to be an option, as the possibility of selling land at an attractive price may arise at any time.
Experts differ in their assessments of the growth prospects of farms depending on the distance from the MA core (Table 11). Dunn’s pairwise tests showed that there are only differences between the core and the rest of the groups. Experts assessing agriculture in core cities agree that a significant increase in the farm size should not be expected over the next 10 years (apart from a few exceptions). The further they are from the core cities, the greater the possibilities of horizontal growth of farms are. However, there are no significant differences in the zones located up to 25 km and over 25 km from the city core. In the case of experts assessing areas located further than 25 km from the core, an increase in the average area of farms was forecast more often, but as many as 1/3 of them believe that urbanisation and the impact of core cities will only slightly or indirectly affect changes in farm size. In their opinion, processes of horizontal growth are a derivative of nationwide or even global trends driving growth in farm size. According to an expert from the Tricity MA (TR66), ”… in the future, achieving acceptable profitability on traditional farms (not multifunctional) will depend to an even greater extent on the size of farms”.
Summing up the findings on this point, it should be noted that the distance to the core city is not the main driver of farming system changes. However, the responses of experts assessing individual metropolitan areas clearly differ. Experts from the Poznan, Tricity, and Wroclaw MAs predict an increase in farm size significantly more often and positively assess the prospects of land transfer from smaller to larger farms. Lease agreements will play an important role here. An expert from the Wroclaw MPA notes that “… attractive urban and peri-urban labor markets cause the owners of small farms to leave agriculture. Professionals will remain in agriculture. The land will be leased—seldom sold” (WR 21). The more fragmented areas (the MAs of Krakow, Lublin, but also Warsaw) will find themselves in the worst situation, where the leasing—or even rental by oral agreement—of land is very difficult (it is necessary to conclude dozens of transactions). Mainly in these areas, experts point to a lack of prospects for an increase in farm size and a high risk of land abandonment.
3.3.2. Future Changes in Farm Specialization (Vegetables and Orchards)
Another change in the farming system which was assessed are processes of farm specialization in vegetable and fruit growing. About 1/3 of experts predict an increase in processes of specialization in vegetable and fruit growing, while only eight are definitely certain of these trends. This mainly concerns municipalities, which are already characterized by a very high intensity of vegetable and fruit production. Experts point out that this production is adequate for urban and peri-urban areas with land shortages. They note that farmers are making further investments and organizing the sale of products more and more effectively (mainly wholesale, but also using short distribution channels). The production of fruit and vegetables will also contribute to the creation of businesses (and jobs) dealing with trade and processing. Experts who predict the growth of vegetable and fruit production in their statements often point to the issues of location in relation to the sales market and the quality of land and climatic conditions (for orchard production), as well as a certain element of “tradition”, as the main factors for the development of this production. Nevertheless, ANOVA and Dunn’s tests showed that there are no significant differences in the perception of the development prospects of vegetable and fruit growing in municipalities up to 25 km and over 25 km from the core city (Table 12). In the core cities, no increase in specialization in vegetable and fruit production is expected. Such production is instead expected to decline. “Nurseries of ornamental plants will operate in highly urbanized areas—trading rather than producing” (Expert from the Lublin MA—L55).
Summing up, it should be noted that experts anticipate the continuation of processes of specialization in vegetable and fruit production. These processes will occur mainly in areas already specialized in these types of production. In addition to growing vegetables and orchards, several experts also pointed to a tendency of farmers to specialize in the creation and development of ornamental plantations (mainly in places with good communications links with the city), as well as a growing trend in the development of herbalism and organic farming. An expert from the Lublin MA (L 47) mentions the establishment of farms producing champignons and even Asian mushrooms.
3.3.3. Future Changes in Animal Production
Assessing the future of livestock production, as many as 95% of respondents estimate a further decrease in the number of animals, especially those kept in small herds. Almost half of them are definitely sure of their forecasts. The decline of livestock production will occur across almost all the MAs, but experts’ estimates varied depending on the distance from the core (Table 13). Nevertheless, the forecasts differ significantly only with regards to the outlying groups at the extreme ends of the scale: Core cities versus areas located > 25 km away. In the core cities, experts’ confidence in reducing the scale of animal production is higher than in the other groups.
The scale of livestock production will continue to decline, but over 60% of experts believe that these processes will be accompanied by the concentration and specialization of production. In their opinion, specialized and professional farms keeping cattle (dairy and fattening), pigs, and poultry will develop in the MAs. No significant differences between individual zones were identified, but experts believe that these farms will rather operate outside the more highly urbanized areas, although two experts from the cores also forecast the development of this type of entities/farms.
Experts also point out that, in the years to come, the number of horses will increase—especially in the core cities and municipalities closer to the cities. According to one of the experts from the Wroclaw MA (WR33), ”… this upward trend has been present for about 10 years and demand is still growing”. Similarly, a small percentage of respondents envisage the possibility of keeping smaller animals, including ostriches, deer, sheep, goats, etc. (for recreational purposes and meat production) in the future. However, they note that it will apply to a small group of farms.
3.3.4. Off-Farm Diversification of Income and Multifunctionality until 2027
According to approximately 40% of experts, the number of farmers engaged in non-agricultural activities will increase over the next 10 years. However, this process will not be differentiated by the distance from the city. Experts believe that the size of the farm and the possibility of earning adequate income will be the most important factor in taking up a non-agricultural activity or “full-time job” in the future. Thus, in municipalities with fragmented land (MAs of Krakow, Lublin, and Warsaw), farmers will diversify their income by looking for alternative employment. On small farms (less than 5 ha), “full-time work and business activity not related to agriculture will dominate in the future, and over time, there will be a complete resignation from agricultural activities” (WAR 16). On larger farms (over 30 ha), over the next 10 years, agricultural services will be less and less important (the demand from smaller farms will decrease), and the importance of trade, construction, transport, etc. will increase. In several municipalities near Warsaw, Krakow, and Wroclaw, experts point to the growing interest of farmers in providing accommodation services for people temporarily working in the city (construction companies, emigrants) as well as renting buildings for warehouses, etc.—especially around Warsaw and Wroclaw. The remaining experts (around 60%) are either not sure of the growing importance of off-farm diversification or predict a reduction in farmers’ involvement in non-agricultural business activity. In addition, they claim that many part-time farmers and farmers running their own businesses will permanently leave the agricultural sector. The expert from the Lublin MA states: (L49) “Non-agricultural activity kills agricultural activity—if the company develops, the land is leased...”.
Experts were also asked about the development prospects for multifunctional farms. Only half of them stated that, in the municipalities assessed by them, there are several dozen multifunctional farms that skillfully combine agricultural and service activities, i.e., local food production and processing, shortening of distribution channels, as well as recreational and educational services, etc. They stated that farmers more often manage only one activity, e.g., agrotourism or production and selling food, but without any additional services.
When assessing the changes in the number of multifunctional farms over the next 10 years, the experts almost unanimously state that, although the demand for local food and various services is growing, large increases in farm adjustments should not be expected. One of the experts from the Poznan MA (PO 47) emphasizes: “I believe that in the next 10 years the number of multifunctional farms adjusted to the affluent client with high consumer awareness will increase, but it will still be a marginal activity, not exceeding 5% of all farms”. Other respondents present similar opinions, although with different estimates of the percentage of such farms (0.1%–20%). More than half of the experts believe that direct sales will become more and more important, but the emergence of numerous farm shops, the creation of a supply network or e-commerce is expected to be unlikely. On the other hand, the number of seasonal fruit and vegetable stands will increase. In Poland, no dynamic growth is expected in the number of educational and social farms, “selling” various “experiences” or organizing various events (birthdays, pumpkin days, cabbage days, etc.). Several experts explain that such activities are mainly carried out by various associations (e.g., Rural Housewives’ Clubs and other rural organizations, e.g., fire brigade—account for most of the events). These organizations obtain external funds for their activities—mainly by participating in the LEADER program (financed under the common agricultural policy (CAP)). In many areas, the market for this type of service has been “saturated”. Some farms also conduct such activities, but usually they set up associations or foundations to obtain external funds.
The analysis of the diversity of the respondents’ answers did not reveal any differences of opinion between the areas located at different distances from the cities, but also in this case slightly more responses concerned entities located closer to the cities. One of the experts from the Wroclaw MA (WR 27) believes that, ”… in order to be successful, these multifunctional farms should be located no more than 60 min away from the city center”. Experts are quite skeptical about the chances of development of multifunctional farms in cities, pointing out that only horse riding and accompanying services have a chance for development. Experts relatively often indicate that multifunctional farms will develop mainly in places that are attractive to tourists, near bicycle paths, lakes, etc., and they may thus tend to exclude typically agricultural areas, e.g., with intensive vegetable production.
3.3.5. Recessive Processes, Including Farmland Abandonment and Deintensification
When assessing the prospects for the increase of farmland abandonment processes, it should be noted that about 40% of experts believe that this process will intensify, although only 7/112 experts are sure of it. However, they emphasize that, in most municipalities, a large increase in land abandonment should not be expected, and problems will only occur in areas where there is an accumulation of such factors as: Land fragmentation, lack of people willing to work in agriculture (attractive labor market), and a low quality of land. According to the respondents, farmland abandonment will increase especially in core cities, where high fragmentation and a “patchwork of fields” (“often housing estates are located in between arable fields”—expert from Krakow KR108) make the functioning of farms difficult, and moreover, the land is treated as an “investment asset”. Experts noticed that the closer the location to the city core, the higher the risk of farmland abandonment is. The situation improved with the increasing distance from the core (Table 14).
Over 90% of experts believe that, as a rule, very fertile land will not be abandoned, most of them admit that this does not apply to land in “very good locations”, i.e., in cities and surrounding areas. Experts predict that the greatest increases in farmland abandonment will occur in areas with very poor soils, especially where farms are fragmented.
Another process—but one which is related to the previous one—often constituting a preliminary step to farmland abandonment is the deintensification of production. About a quarter of experts forecast processes of reducing the intensity of agricultural production. The abandonment of livestock production in some areas—mainly in the MAs of Krakow and Warsaw—has caused problems related to the management of grasslands. The land is kept in a good agricultural and environmental condition, which guarantees the receipt of direct payments (CAP), but there is no commercial agricultural production in evidence on such farms. Experts say that in the future this land will gradually turn into an abandoned land. The chances of restoring production are marginal.
4. Discussion
The applied factor analysis allowed seven factors representing the main trajectory of changes in agricultural systems in Polish metropolitan areas to be identified. The identified changes in farming systems reveal a certain “pattern of adaptation” and include the following processes: Horizontal growth, specialization, off-farm diversification, but also a reduction in animal production, as well as farmland abandonment and deintensification. These results confirm a large diversity of adaptation processes also visible in other metropolitan areas [2,12,47,48,49]. The analyses also aimed to verify the role of the location and quality of biophysical parameters of farmland in the processes of changes in agricultural systems.
When assessing changes in farming systems in Polish MAs, it should be noted that the most important process observed in the period from 1996 to 2010 was an increase in farm size and professionalization, expressed as an improvement in education-related indicators and rationalization of the use of machines (F1). Moreover, processes of concentration of farmland (F3) were also observed. Although those processes should be correlated with each other, as with the increase in the share of farms larger than 10 ha (F1), the share of land in farms larger than 10 ha (F3) should increase, but the correlation coefficient was at the level of 0.11 and was not statistically significant. Those discrepancies resulted from very large changes in the number of farms (almost 30% of farms left agriculture in the period from 1996 to 2010), especially the smallest ones. The exit of the smallest farms from agriculture caused major changes in the structure of farms, and only minor changes in the structure of land use, hence there was a visible lack of correlation of those variables and they were identified as separate factors.
The analysis of variance (ANOVA) showed that processes of horizontal growth and farm professionalization proceeded at a similar pace, regardless of the distance to the core. Moreover, the occurrence of processes of convergence in the average size of farms was also observed. Those changes were an example of implementing a development strategy based on an increase in size (scale) [48].
Although ANOVA did not show a significant relationship between the processes of farm growth and professionalization and the location relative to the core, experts noted that the attractive urban labor market may play a significant role. Experts emphasize that due to the fact that “small farmers” (amateurs and part-time farmers) are exiting from agriculture, there is an improvement in the structure of farms and the professionalization of agriculture. “It is the bigger and better farmers—professionals—that remain in agriculture”—points out an expert from the Warsaw MA (WAR 6). These results are consistent with the occupational choice theory [7], according to which the higher the probability of finding a job outside agriculture is, the higher the income gap between agriculture and other sectors will be. A high income gap is assumed to increase the outward migration from farms. From this perspective, the urban labor market has a positive effect on processes of farm growth and professionalization. Nevertheless, in some areas, i.e., mainly in Krakow, Lublin, and Warsaw MA, the phenomenon of small farmers leaving the agricultural sector is not always accompanied by the transfer of land to other (larger) farms. As noted by Satoła et al. [37], in the case of small farms, the costs of exiting from agriculture (transaction costs, and above all, opportunity costs—costs of lost social insurance and tax privileges of farmers) are higher than revenues from the sale or lease of land. Thus, some land owners are not interested in transferring it to other entities. Several experts note that, in these areas, the practice of informal land lending is the most common [50].
When assessing the prospects for further horizontal growth, experts present different opinions. While everyone agrees that the best farms will increase in size, invest, and grow, there are also voices indicating that this strategy, if not combined with other city adjustment strategies, is doomed to failure. A strong competition for land and its high prices limit opportunities for development through horizontal growth [4,13,51]. As many as 60% of the respondents believe that dynamic increases in the size of farms are unlikely. Especially in cities and their outskirts, there is a lot of competition for land with entities from the non-agricultural sector. High land prices and speculation rule out the possibility of development through horizontal growth in practice. Experts predict that in areas further than 25 km from the core, the chances of implementing this strategy are greater. Several experts emphasize that, despite the many limitations and urbanization pressure in the MAs, the increase in farm size will be greater than in the rest of the country.
An important process of adapting farming systems are changes consisting of the specialization of agricultural production [52]. Both in Polish and European MAs, there is a long tradition of specializing in vegetable and fruit production [53,54]. In Polish MAs in 1996–2010, the share of vegetables increased from 2.7% to 2.9% ARA, and the share of permanent crops, including orchards, increased from 2.5% to 2.8% AA. However, those processes were accompanied by a very large reduction in the share of farms producing vegetables (by 25 percentage points). This data clearly indicated dynamic processes of concentration of production. The growing importance of vegetable and fruit crops took place in municipalities where that production was already on a large scale in 1996. The high share of vegetables and permanent crops (mainly orchards) is related to the distance from the core city (especially in the case of vegetables). The specialization in horticulture and intensive vegetable production traditionally represents a typical type of farming around urban areas following the Thunensian regularity [41]. Only nowadays this phenomenon is not explained by lower transport costs, but rather by the possibility of generating a high added value per farmland unit, as pointed out by Alonso [55]. Even with relatively small acreages, this production can generate a satisfactory income. Many studies point out that specializing in vegetable and fruit production is the main strategy of peri-urban farms [10,13,53,56]. However, it is increasingly recognized that this strategy has some limitations—disproportionate specialization tends to decrease the economic resilience of a farm [54].
The research results indicate that the location close to the core is not a sufficient condition for the development of vegetable and fruit production. According to experts it is also necessary to have appropriate biophysical characteristics. The premise of applying the specialization strategy is to obtain a high added value per unit area and this is possible only when there are appropriate biophysical characteristics of the land—as Ricardo [57] and other contemporary scholars point out [58,59].
The future of vegetable and fruit production in Polish MAs looks quite optimistic. Experts predict that these processes of specialization will continue, but note that this will take place in areas that are already specialized. Several experts also anticipate processes of farmers specializing in the field of ornamental plantation (mainly in places with good communications links with the city), as well as an upward trend in the development of herbalism and organic farming. These trends are also observed in other metropolitan areas [52,53,60].
One important type of process involved in changes in agricultural systems are processes of diversification in the income of farm users. According to many scholars, areas closer to cities are particularly likely to see the development of non-agricultural entrepreneurship [10,13]. Greater demand for services related to higher population density and better infrastructure has a positive influence on the diversification of activities [15,61,62]. Experts notice this pattern in Polish MAs, as well. They indicate the importance of the so-called “pull factors”—farmers operating closer to cities see more and more opportunities related to urbanization and globalization and take advantage of them.
According to experts in Polish MAs the demand for various (in the Polish context, new) products and services provided by farmers is increasing. This applies in particular to consumer-oriented diversification activities, such recreation services, education, care farming, etc. which are an expression of a “broadening strategy”, as well as shorter of distribution channels, production of high-quality local products, product certification, etc. referred to as a “deepening strategy” [63,64]. Experts agree that, in areas close to cities, the share of multifunctional farms will increase in the coming years, but, unlike in many Western European countries, a large increase in the number of such farms cannot be expected [65]. In the case of educational and recreational farms, a significant limitation is still the insufficient demand for such services and, paradoxically, competition between various rural organizations (associations and foundations), which receive public support for these activities. Care farming is, however, being held back by legal limitations (no regulations governing the activities of such farms) and a lack of financial support [66]. In recent years, new regulations favorable to farmers regarding short food supply chains have been adopted, although they are still in a pre-scaling up phase [67]. Nevertheless, the key problem is still the lack of a clear or well-defined framework for organizing short value chain food systems based on direct selling [68]. Until 2019, there were no legal regulations enabling the sale of processed food by farmers, which significantly hindered the development of local food farms [69].
In most highly developed countries, scientific research shows that the diversification of farm income has a positive effect on the development of agricultural activity [70,71,72]. In Polish MAs, many experts, especially in areas with fragmented land structures, believe that off-farm diversification leads mainly to the marginalization of agricultural activity and results, at best, in combining work in and outside agriculture (part-time farming). However, it often leads to a complete cessation of production and land abandonment. Most experts believe that the main motive for starting a business in those areas is a large income gap between agriculture and other sectors of the economy, and entrepreneurial activities are primarily a symptom of looking for an alternative (distress-push factors). The research results show that, in the case of small farm owners, their activity is usually not related to the farm (it concerns trade, construction, and mechanical services, etc.) and, over time, the agricultural activity will be discontinued.
The last group of processes taking place in the areas studied concerns declining agricultural production, including the reduction of livestock population (except horses), as well as farmland abandonment and deintensification. While the reduction of livestock production is observed in all metropolitan areas of the global north [21], the remaining processes seem to be specific to Poland and other countries with very fragmented land structures [27].
Reduction of the number of animals in metropolitan areas is a process that occurred in highly developed countries as early as the 1970s [73,74]. In Polish MAs, that process intensified at the beginning of the 90s, i.e., after the fall of the communist system in the Central Europe [75]. In the period from 1996 to 2010, the share of farms without livestock increased to over 50% and was very strongly related to the distance to the core. Both the number of farms keeping animals (except horses) and the livestock density decreased as the distance to the core decreased [16,76]. Duvernoy et al. [2] also noted that the share of livestock farms is positively correlated with the distance from the core and negatively correlated with population density. There are several reasons for giving up livestock production, including an attractive urban labor market, declining profitability of production, no prospects for the development of production, and finally policies and zoning regulations, as well as growing conflicts with the local population [9,73]. Very similar trends in the reduction of livestock production have been observed, e.g., in France [2], Germany, and Italy [77]. It was also noted that the favorable framework conditions for crop production negatively affected the intensity of livestock production [16,22].
Experts also agree that livestock production will be in decline over the next 10 years. The processes of concentration and specialization of animal production will be mainly visible further away from the core, and few animal farms will survive near cities [16]. Contrary to other studies, experts do not predict an increase in the number of small animals, including chickens, rabbits, goats bred for recreational purposes or for meat [78] or an increase in the number of livestock farms keeping local animal breeds and selling them with quality certificates [22].
In Polish metropolitan areas, farmland abandonment and deintensification of production are a relatively big problem. It is a phenomenon that is not observed in other highly developed countries [29]. The problem of excessive farmland abandonment is visible primarily in the metropolitan areas of Central and Eastern Europe [79] and in some Southern European countries, including the Barcelona metropolitan area and the Catania metropolitan area in Italy [29]. It is mainly countries with a high share of small farms that are concerned—due to the small size, often scattered locations and inconvenient shapes of farmland, remaining agricultural parcels become unprofitable for farming [27].
ANOVA showed that the dynamics of farmland abandonment is not dependent on the distance to the core, but (in static terms in 2010) closer to the core (up to 35 km), farmland abandonment rates are slightly higher. Sroka et al. [29] noted that farmland abandonment is increased by a relatively high attractiveness of the local labor market, which leads to part-time farming, with farmers deciding to abandon agricultural production over time. According to Terres et al. [80] and Paül and Tonts [28], the quality of biophysical characteristics of farmland has a very strong influence on the scale of land abandonment. They show that, when the natural environment is less suitable, there is an increase in the risk of agricultural land being abandoned.
In addition to farmland abandonment, in some areas (around 25% of municipalities) there was an increase in the share of permanent grassland with a simultaneous decrease in the livestock density, as well as an accompanying increase in the share of subsistence farms. According to Sroka et al. [29], PG is not used, constituting a semi-abandonment, and the lack of commercial production indicates the fake simulation of agricultural production. Therefore, it is a temporary form of land use resulting mainly from the willingness to receive CAP payments or to maintain the privileges associated with the farmer status [37]. Experts believe that in some municipalities with fragmented land structures (in their opinion it is the main driver) and poor biophysical characteristics of land, farmland abandonment, and deintensification will increase. Particularly in core cities, an increase in land abandonment is forecast, which is consistent with the results of research done by Grădinaru et al. [24], Paül and Tonts [28], and also Russo et al. [81]. The main problem here is the division of plots and the willingness to sell them, e.g., for construction purposes [29].
Research shows that the location of municipalities in relation to the core city has only a relatively small impact on changes in farming systems and is (statistically) significant only in the processes of land concentration and reduction of livestock production. This can be partially explained by the shortcomings of the chosen method of measuring changes in farming systems, i.e., the base effect. Nevertheless, location helped explain the differentiation in most of the analyzed variables used in the building of factors relatively well—especially in 1996. In 2010, the difference between analyzed groups of municipalities depending on the location was smaller (although still significant). The levelling out of values of individual indicators in areas with different distances from the cores might result, first of all, from the increasing impact of the core cities on the surrounding municipalities (also those located further from the core city)—especially due to the influence of the labor market. By contrast, the issue of “transport costs” is becoming increasingly relative—currently 30–40 km from the city is a “short distance”, which is a development also pointed out by experts.
Expert opinions as well as data from agricultural censuses show the diversity in terms of changes in agricultural systems in various metropolitan areas of Poland. It is directly related to the different paths of agricultural development in the four regions of this country. Agricultural structures in Poland, due to different political and legal conditions (e.g., loss of independence, collectivization of agriculture), are still clearly differentiated [82,83]. However, this does not have a negative impact on the results of the research, since in all MAs a similar influence of location on changes in farming systems was noticed.
5. Conclusions
The changes in farming systems identified in Polish MAs reveal both favorable and unfavorable trends. The first group of changes concerns the processes of growth and concentration of land in larger farms, as well as the processes of specialization consisting of the intensification of production with limited access to land (vegetables and orchards). Moreover, the occurrence of consumer-oriented diversification (“deepening”) and the increasing orientation of farmers towards services (“broadening”) were identified. Nevertheless, in Polish MAs, there are also intensified recessive processes related to the reduction of animal production (similar to other European MAs), but also related to farmland abandonment and deintensification of production, which are not observed in highly developed countries. These processes occur mainly in areas with structural problems, where agricultural production, as well as the leasing of land become unprofitable (leasing of land generates high alternative costs, i.e., loss of cheap social security, favorable taxation, and other privileges available to farmers).
When assessing future changes in farming systems, experts do not expect revolutionary changes. In their opinion, the specificity of the peri-urban environment will favor the processes of creating multifunctional agriculture, including shortening distribution channels, expanding the offer of farms, etc. However, experts believe that the broadening and deepening strategies will be implemented by a relatively small group of farmers (no more than 5%–10%). They also expect further processes of specialization and concentration of vegetable and fruit production, as well as of animal production—but, in this case also, these processes will take place only in some areas. According to the experts surveyed, most farmers will continue to apply traditional development strategies, which will be ineffective without the possibility of increasing the area of farms. This will lead to a further decline in the number of farms and, at best, transfer of land to other farms, including the best ones.
Although the location determines the rate of changes in farming systems only to a limited extent, it explains the differentiation of farming systems in static terms relatively well. It has been shown that, on the one hand, the proximity of the core has a positive effect on the processes of growth in the farm size, as well as specialization and diversification, but on the other—especially in areas with structural problems, it causes the increase of recessive processes, especially farmland abandonment and deintensification of production.
This research can help in creating a policy for the development of peri-urban areas, in particular, in that it points to the need to support the development of multifunctional farms, e.g., by creating friendly legislation, promoting locally produced food, etc. Contrary to many highly developed countries, the share of these farms in Poland is very small, and the possibility of increasing their number (according to experts) is still limited. In addition, this study should give a clear signal to take actions that inhibit the processes of farmland abandonment and excessive deintensification. The forecasted occurrence of these processes will negatively affect the economic, social, and environmental functions of urban and peri-urban agriculture.
6. Study Limitations and further Research
The main limitation of the presented research is the availability of source data. The information from agricultural censuses covers the period 1996–2010, so it does not present current changes. Moreover, there is little information in official statistics about the multifunctionality of agriculture. Both problems have been partially resolved by combining statistical (based on official statistics) and expert-based approaches. According to Berre et al. [84], this is the best way to understand and assess farming systems diversity. The surveys were conducted in 2017, i.e., relatively a long time ago, but the experts’ statements clearly indicate that changes in farming systems are progressing relatively slowly, hence the experts’ forecasts can still be considered valid. Problems related to access to current data can be solved by extending the analyses to include case studies—such proposals are presented, among others, by Duvernoy et al. [2]. Moreover, scholars can use information collected by the Farm Accountancy Data Network (FADN), which provides extensive data on the farm structures, agricultural production, socio-economic characteristics, as well as the multifunctionality of farms. Nevertheless, this database, due to the small number of farms surveyed in Polish metropolitan areas, does not ensure representativeness of the general population. The manuscript analyzed primarily changes in agricultural systems depending on the location in relation to the city cores. Thus, a number of other important factors have been omitted (e.g., the internal farm environment) that may be of great importance.
The challenge for further research is to understand the conditions under which farms decide to adapt farming practices towards multifunctional activities and the motivation underlying these decisions. Identification of these factors will be useful for the appropriate shaping of spatial policy and rural development policy. Furthermore, we suggest that further research should take into account the internal farm environment.
Author Contributions
Conceptualization, W.S.; data curation, W.S.; formal analysis, W.S.; funding acquisition, W.S.; investigation, W.S.; methodology, W.S.; project administration, W.S.; resources, W.S.; software, W.S.; supervision, W.S.; validation, W.S. and D.Ż.; visualization, W.S.; writing—original draft, W.S.; writing—review and editing, W.S. and D.Ż. All authors have read and agreed to the published version of the manuscript.
Funding
This research was funded by the National Science Centre, Poland, grant number 2016/21/D/HS4/00264.
Institutional Review Board Statement
Not applicable.
Informed Consent Statement
Not applicable.
Data Availability Statement
The data presented in this study are available on request from the corresponding author.
Acknowledgments
We would like to express our gratitude to the editor and the reviewers for their valuable comments and for the detailed suggestions they made on how to improve the manuscript. We would also like to thank the directors of Agricultural Advisory Centres in the Dolnośląskie, Lubelskie, Małopolskie, Mazowieckie, Wielkopolskie, and Pomorskie voivodeships of Poland.
Conflicts of Interest
The authors declare no conflict of interest.
References
- Busck, A.G.; Kristensen, S.P.; Præstholm, S.; Reenberg, A.; Primdahl, J. Land system changes in the context of urbanisation: Examples from the peri-urban area of Greater Copenhagen. Geografisk Tidsskr-Dan. J. Geogr. 2006, 106, 21–34. [Google Scholar] [CrossRef]
- Duvernoy, I.; Zambon, I.; Sateriano, A.; Salvati, L. Pictures from the other side of the fringe: Urban growth and peri-urban agriculture in a post-industrial city (Toulouse, France). J. Rural Stud. 2018, 57, 25–35. [Google Scholar] [CrossRef]
- Abass, K.; Adanu, S.K.; Agyemang, S. Peri-urbanisation and loss of arable land in Kumasi Metropolis in three decades: Evidence from remote sensing image analysis. Land Use Policy 2018, 72, 470–479. [Google Scholar] [CrossRef]
- Darly, S.; Torre, A. Conflicts over farmland uses and the dynamics of “agri-urban” localities in the Greater Paris Region: An empirical analysis based on daily regional press and field interviews. Land Use Policy 2013, 33, 90–99. [Google Scholar] [CrossRef]
- Mazzocchi, C.; Sali, G.; Corsi, S. Land use conversion in metropolitan areas and the permanence of agriculture: Sensitivity Index of Agricultural Land (SIAL), a tool for territorial analysis. Land Use Policy 2013, 35, 155–162. [Google Scholar] [CrossRef]
- Sroka, W.; Dudek, M.; Wojewodzic, T.; Król, K. Generational Changes in Agriculture: The Influence of Farm Characteristics and Socio-Economic Factors. Agriculture 2019, 9, 264. [Google Scholar] [CrossRef] [Green Version]
- Bertoni, D.; Cavicchioli, D. Farm succession, occupational choice and farm adaptation at the rural-urban interface: The case of Italian horticultural farms. Land Use Policy 2016, 57, 739–748. [Google Scholar] [CrossRef]
- LeJava, J.P.; Goonan, M.J. Cultivating urban agriculture: Addressing land use barriers to gardening and farming in cities. Real Estate Law J. 2012, 41, 216–245. [Google Scholar]
- Huang, D.; Drescher, M. Urban crops and livestock: The experiences, challenges, and opportunities of planning for urban agriculture in two Canadian provinces. Land Use Policy 2015, 43, 1–14. [Google Scholar] [CrossRef]
- Zasada, I. Multifunctional peri-urban agriculture—A review of societal demands and the provision of goods and services by farming. Land Use Policy 2011, 28, 639–648. [Google Scholar] [CrossRef]
- Spataru, A.; Faggian, R.; Docking, A. Principles of multifunctional agriculture for supporting agriculture in metropolitan peri-urban areas: The case of Greater Melbourne, Australia. J. Rural Stud. 2020, 74, 34–44. [Google Scholar] [CrossRef]
- Inwood, S.M.; Sharp, J.S. Farm persistence and adaptation at the rural–urban interface: Succession and farm adjustment. J. Rural Stud. 2012, 28, 107–117. [Google Scholar] [CrossRef]
- Pölling, B.; Mergenthaler, M.; Lorleberg, W. Professional urban agriculture and its characteristic business models in Metropolis Ruhr, Germany. Land Use Policy 2016, 58, 366–379. [Google Scholar] [CrossRef]
- Clark, J.K.; Jackson-Smith, D.; Sharp, J.; Munroe, D. The geography of US periurban agricultural adaptation. In Proceedings of the Trans Atlantic Land Use Conference, Washington, DC, USA, 24–26 September 2007; Available online: http://cffpi.osu.edu/agadapt.htm (accessed on 4 January 2021).
- Lange, A.; Piorr, A.; Siebert, R.; Zasada, I. Spatial differentiation of farm diversification: How rural attractiveness and vicinity to cities determine farm households’ response to the CAP. Land Use Policy 2013, 31, 136–144. [Google Scholar] [CrossRef]
- Pölling, B.; Sroka, W.; Mergenthaler, M. Success of urban farming’s city-adjustments and business models—Findings from a survey among farmers in Ruhr Metropolis, Germany. Land Use Policy 2017, 69, 372–385. [Google Scholar] [CrossRef]
- Silva, J.F.; Santos, J.L.; Ribeiro, P.F.; Canadas, M.J.; Novais, A.; Lomba, A.; Moreira, F. Identifying and explaining the farming system composition of agricultural landscapes: The role of socioeconomic drivers under strong biophysical gradients. Landsc. Urban Plan. 2020, 202, 103879. [Google Scholar] [CrossRef]
- Grădinaru, S.R.; Triboi, R.; Iojă, C.I.; Artmann, M. Contribution of agricultural activities to urban sustainability: Insights from pastoral practices in Bucharest and its peri-urban area. Habitat Int. 2018, 82, 62–71. [Google Scholar] [CrossRef]
- Lovell, S.T. Multifunctional urban agriculture for sustainable land use planning in the United States. Sustainability 2010, 2, 2499–2522. Available online: https://0-doi-org.brum.beds.ac.uk/10.3390/su2082499 (accessed on 4 January 2021). [CrossRef] [Green Version]
- Ferreira, A.J.D.; Guilherme, R.; Ferreira, C.S.S.; Oliveira, M.F.L. Urban Agriculture, a tool towards more resilient urban communities? Curr. Opin. Environ. Sci. Health 2018, 5, 93–97. [Google Scholar] [CrossRef]
- Mok, H.F.; Williamson, V.G.; Grove, J.R.; Burry, K.; Barker, S.F.; Hamilton, A.J. Strawberry fields forever? Urban agriculture in developed countries: A review. Agron. Sustain. Dev. 2014, 34, 21–43. [Google Scholar] [CrossRef] [Green Version]
- Filippini, R. Food production potential of periurban agriculture: Contribution of periurban farms to local food systems. In Agricultural Sciences; AgroParisTech; Scuola superiore Sant’Anna di studi universitari e di perfezionamento: Pise, Italie, 2015. [Google Scholar]
- Darnhofer, I.; Bellon, S.; Dedieu, B.; Milestad, R. Adaptiveness to enhance the sustainability of farming systems. A review. Agron. Sustain. Dev. 2010, 30, 545–555. [Google Scholar] [CrossRef] [Green Version]
- Darnhofer, I.; Gibbon, D.; Dedieu, B. (Eds.) Farming Systems Research into the 21st Century: The New Dynamic; Springer Science+Business Media: Berlin, Germany, 2012; p. 490. [Google Scholar]
- Sanz, E.S.; Martinetti, D.; Napoléone, C. Operational modelling of peri-urban farmland for public action in Mediterranean context. Land Use Policy 2018, 75, 757–771. [Google Scholar] [CrossRef]
- Meyer, M.A.; Früh-Müller, A. Patterns and drivers of recent agricultural land-use change in Southern Germany. Land Use Policy 2020, 99, 104959. [Google Scholar] [CrossRef]
- Gradinaru, S.R.; Ioja, C.I.; Onose, D.A.; Gavrilidis, A.A.; Patru-Stupariu, I.; Kienast, F.; Hersperger, A.M. Land abandonment as a precursor of built-up development at the sprawling periphery of former socialist cities. Ecol. Indic. 2015, 57, 305–313. [Google Scholar] [CrossRef]
- Paül, V.; Tonts, M. Containing urban sprawl: Trends in land use and spatial planning in the metropolitan region of Barcelona. J. Environ. Plan. Manag. 2005, 48, 7–35. [Google Scholar] [CrossRef]
- Sroka, W.; Pölling, B.; Wojewodzic, T.; Strus, M.; Stolarczyk, P.; Podlinska, O. Determinants of farmland abandonment in selected metropolitan areas of Poland: A spatial analysis on the basis of regression trees and interviews with experts. Sustainability 2018, 11, 3071. [Google Scholar] [CrossRef] [Green Version]
- Drinkwater, L.; Friedman, D.; Buck, L.E. Systems Research for Agriculture: Innovative Solutions to Complex Challenges; Sustainable Agriculture Research and Education (SARE): College Park, MD, USA, 2016; p. 97. [Google Scholar]
- Mądry, W.; Roszkowska-Mądra, B.; Gozdowski, D.; Hryniewski, R. Some aspects of the concept, methodology and application of farming system typology. Electron. J. Pol. Agric. Univ. 2016, 19, 12. [Google Scholar]
- Gomez Sal, A.; Gonzalez, G.A. A comprehensive assessment of multifunctional agricultural land-use systems in Spain using a multi-dimensional evaluative model. Agric. Ecosyst. Environ. 2007, 120, 82–91. [Google Scholar] [CrossRef]
- Meyfroidt, P.; Chowdhury, R.R.; de Bremond, A.; Ellis, E.C.; Erb, K.H.; Filatova, T.; Kull, C.A. Middle-range theories of land system change. Glob. Environ. Change 2018, 53, 52–67. [Google Scholar] [CrossRef]
- Debolini, M.; Marraccini, E.; Dubeuf, J.P.; Geijzendorffer, I.R.; Guerra, C.; Simon, M.; Napoléone, C. Land and farming system dynamics and their drivers in the Mediterranean Basin. Land Use Policy 2018, 75, 702–710. [Google Scholar] [CrossRef]
- Martin, G.; Martin-Clouaire, R.; Duru, M. Farming system design to feed the changing world. A review. Agron. Sustain. Dev. 2013, 33, 131–149. [Google Scholar] [CrossRef] [Green Version]
- Sharma, K.D.; Pathania, M.S.; Lal, H. Farming system approach for sustainable development of agriculture in mountain regions—A case of Himachal Pradesh. Agric. Econ. Res. Rev. 2006, 19, 101–112. [Google Scholar]
- Satoła, L.; Wojewodzic, T.; Sroka, W. Barriers to exit encountered by small farms in light of the theory of new institutional economics. Agric. Econ. 2018, 64, 277–290. [Google Scholar]
- Ribeiro, P.F.; Santos, J.L.; Bugalho, M.N.; Santana, J.; Reino, L.; Beja, P.; Moreira, F. Modelling farming system dynamics in High Nature Value Farmland under policy change. Agric. Ecosyst. Environ. 2014, 183, 138–144. [Google Scholar] [CrossRef]
- Sroka, W.; Mikolajczyk, J.; Wojewodzic, T.; Kwoczynska, B. Agricultural land vs. urbanisation in chosen Polish metropolitan areas: A spatial analysis based on regression trees. Sustainability 2018, 10, 837. [Google Scholar] [CrossRef] [Green Version]
- Stylianou, A.; Sdrali, D.; Apostolopoulos, C.D. Capturing the diversity of Mediterranean farming systems prior to their sustainability assessment: The case of Cyprus. Land Use Policy 2020, 96, 104722. [Google Scholar] [CrossRef]
- Zasada, I.; Loibl, W.; Köstl, M.; Piorr, A. Agriculture under human influence: A spatial analysis of farming systems and land use in European rural-urban-regions. Eur. Countryside 2013, 5, 71–88. [Google Scholar] [CrossRef]
- Therond, O.; Duru, M.; Roger-Estrade, J.; Richard, G. A new analytical framework of farming system and agriculture model diversities. A review. Agron. Sustain. Dev. 2017, 37, 21. [Google Scholar] [CrossRef]
- Zurek, M.; Keenlyside, P.; Brandt, K. Intensifying Agricultural Production Sustainably: A Framework for Analysis and Decision Support. In Amsterdam, the Netherlands: International Food Policy Research Institute (IFPRI). 2015, Climate: Focus. Available online: http://ebrary.ifpri.org/cdm/ref/collection/p15738coll2/id/130125 (accessed on 5 January 2021).
- Witek, T. Waloryzacja Rolniczej Przestrzeni Produkcyjnej Polski Według Gmin; IUNG: Puławy, Poland, 1994; p. 248. [Google Scholar]
- Yong, A.G.; Pearce, S. A beginner’s guide to factor analysis: Focusing on exploratory factor analysis. Tutor. Quant. Methods Psychol. 2013, 9, 79–94. [Google Scholar] [CrossRef]
- Hanh, H.Q.; Azadi, H.; Dogot, T.; Ton, V.D.; Lebailly, P. Dynamics of agrarian systems and land use change in North Vietnam. Land Degrad. Dev. 2017, 28, 799–810. [Google Scholar] [CrossRef] [Green Version]
- Clark, J.K.; Munroe, D.K. The relational geography of periurban farmer adaptation. J. Rural Community Dev. 2013, 8, 15–28. [Google Scholar]
- Akimowicz, M.; Cummings, H.; Landman, K. Green lights in the Greenbelt? A qualitative analysis of farm investment decision-making in peri-urban Southern Ontario. Land Use Policy 2016, 55, 24–36. [Google Scholar] [CrossRef]
- Rogus, S.; Dimitri, C. Agriculture in urban and peri-urban areas in the United States: Highlights from the Census of Agriculture. Renew. Agr. Food Syst. 2015, 30, 64–78. [Google Scholar] [CrossRef]
- Musiał, W. Użyczenie jako alternatywa dla dzierżawy ziemi rolniczej. Wieś i Rolnictwo 2020, 187, 79–98. [Google Scholar]
- Wästfelt, A.; Zhang, Q. Reclaiming localisation for revitalising agriculture: A case study of peri-urban agricultural change in Gothenburg, Sweden. J. Rural Stud. 2016, 47, 172–185. [Google Scholar] [CrossRef]
- Skar, S.L.G.; Pineda-Martos, R.; Timpe, A.; Pölling, B.; Bohn, K.; Külvik, M.; Tzortzakis, N. Urban agriculture as a keystone contribution towards securing sustainable and healthy development for cities in the future. Blue-Green Syst. 2020, 2, 1–27. [Google Scholar] [CrossRef] [Green Version]
- Piorr, A.; Zasada, I.; Doernberg, A.; Zoll, F.; Ramme, W. Research for AGRI Committee–Urban and Peri-urban Agriculture in the EU, European Parliament; Policy Department for Structural and Cohesion Policies: Brussels, Belgium, 2018; p. 89. [Google Scholar]
- De Roest, K.; Ferrari, P.; Knickel, K. Specialisation and economies of scale or diversification and economies of scope? Assessing different agricultural development pathways. J. Rural Stud. 2018, 59, 222–231. [Google Scholar] [CrossRef]
- Alonso, W. Location and Land Use; Harvard University Press: Cambridge, MA, USA, 1964; p. 204. [Google Scholar]
- Sroka, W.; Pölling, B.; Mergenthaler, M. City adjustments as the main factor of success of urban and peri-urban farms–empirical evidence from the Ruhr metropolis. NJAS-Wageningen J. Life Sci. 2019, 89, 100299. [Google Scholar] [CrossRef]
- Ricardo, D. On the Principles of Political Economy and Taxation, 3rd ed.; John Murray: London, UK, 1821; p. 333. [Google Scholar]
- Chakir, R.; Lungarska, A. Agricultural rent in land-use models: Comparison of frequently used proxies. Spat. Econ. Anal. 2017, 12, 279–303. [Google Scholar] [CrossRef] [Green Version]
- Daedlow, K.; Lemke, N.; Helming, K. Arable land tenancy and soil quality in Germany: Contesting theory with empirics. Sustainability 2018, 10, 2880. [Google Scholar] [CrossRef] [Green Version]
- Van Veenhuizen, R.; Danso, G. Profitability and sustainability of urban and periurban agriculture (Vol. 19). Food Agric. Org. 2007. Available online: https://ruaf.org/assets/2019/11/Profitability-and-Sustainability.pdf (accessed on 5 January 2021).
- Asfaw, A.; Simane, B.; Hassen, A.; Bantider, A. Determinants of non-farm livelihood diversification: Evidence from rainfed-dependent smallholder farmers in northcentral Ethiopia (Woleka sub-basin). Dev. Stud. Res. 2017, 4, 22–36. [Google Scholar] [CrossRef] [Green Version]
- Henke, R.; Vanni, F. Drivers of on-farm diversification in the Italian peri-urban agriculture. Italian Rev. Agric. Econ. 2017, 72, 79–100. [Google Scholar]
- Pölling, B.; Mergenthaler, M. The location matters: Determinants for “deepening” and “broadening” diversification strategies in Ruhr Metropolis’ urban farming. Sustainability 2017, 9, 1168. [Google Scholar] [CrossRef] [Green Version]
- Rivaroli, S.; Ghelfi, R.; Bertazzoli, A.; Piorr, A. Diversification pathways and farming systems: Insights from the Emilia-Romagna region, Italy. Outlook Agric. 2017, 46, 239–247. [Google Scholar] [CrossRef]
- Pölling, B.; Prados, M.J.; Torquati, B.M.; Giacchè, G.; Recasens, X.; Paffarini, C.; Lorleberg, W. Business models in urban farming: A comparative analysis of case studies from Spain, Italy and Germany. Moravian Geogr. Rep. 2017, 25, 166–180. [Google Scholar] [CrossRef] [Green Version]
- Knapik, W. Stimulators and inhibitors of the development of social care and support for the elderly in Poland. J. Rural Stud. 2020, 76, 12–24. [Google Scholar] [CrossRef]
- Vittersø, G.; Torjusen, H.; Laitala, K.; Tocco, B.; Biasini, B.; Csillag, P.; Malak-Rawlikowska, A. Short Food Supply Chains and Their Contributions to Sustainability: Participants’ Views and Perceptions from 12 European Cases. Sustainability 2019, 11, 4800. [Google Scholar] [CrossRef] [Green Version]
- Kneafsey, M. Innovative Short Food Supply Chain Management; EIP-AGRI Focus Group Final Report; European Commission: Brussels, Belgium, 2015. [Google Scholar]
- Barska, A.; Wojciechowska-Solis, J. E-consumers and local food products: A perspective for developing online shopping for local goods in Poland. Sustainability 2020, 12, 4958. [Google Scholar] [CrossRef]
- Salvioni, C.; Henke, R.; Vanni, F. The Impact of Non-Agricultural Diversification on Financial Performance: Evidence from Family Farms in Italy. Sustainability 2020, 12, 486. [Google Scholar] [CrossRef] [Green Version]
- Lien, G.; Kumbhakar, S.C.; Hardaker, J.B. Determinants of off-farm work and its effects on farm performance: The case of Norwegian grain farmers. Agric. Econ. 2010, 41, 577–586. [Google Scholar] [CrossRef]
- Yoshida, S.; Yagi, H.; Kiminami, A.; Garrod, G. Farm diversification and sustainability of multifunctional peri-urban agriculture: Entrepreneurial attributes of advanced diversification in Japan. Sustainability 2019, 11, 2887. [Google Scholar] [CrossRef] [Green Version]
- Pepliński, B. Location of Cows and Pigs in Suburban Areas of Polish Metropolitan Centers. Sustainability 2020, 12, 2619. [Google Scholar] [CrossRef] [Green Version]
- Lawrence, H.W. Changes nn Agricultural Production In Metropolitan Areas. Prof. Geographer. 1988, 40, 159–175. [Google Scholar] [CrossRef]
- Banski, J. Phases to the transformation of agriculture in Central Europe–Selected processes and their results. Agric. Econ. 2018, 64, 546–553. [Google Scholar] [CrossRef]
- Zasada, I.; Berges, R.; Hilgendorf, J.; Piorr, A. Horsekeeping and the peri-urban development in the Berlin Metropolitan Region. J.Land Use Sci. 2013, 8, 199–214. [Google Scholar] [CrossRef]
- Filippini, R.; Lardon, S.; Bonari, E.; Marraccini, E. Unraveling the contribution of periurban farming systems to urban food security in developed countries. Agron. Sustain. Dev. 2018, 38, 21. [Google Scholar] [CrossRef] [Green Version]
- McClintock, N.; Pallana, E.; Wooten, H. Urban livestock ownership, management, and regulation in the United States: An exploratory survey and research agenda. Land Use Policy 2014, 38, 426–440. [Google Scholar] [CrossRef] [Green Version]
- Grădinaru, S.R.; Iojă, C.I.; Pătru-Stupariu, I.; Niţă, M.R.; Gavrilidis, A.A.; Cârstea, E.M. Land abandonment changes between 2005 and 2008 in Bucharest city. Proced. Technol. 2013, 8, 536–539. [Google Scholar] [CrossRef] [Green Version]
- Terres, J.M.; Scacchiafichi, L.N.; Wania, A.; Ambar, M.; Anguiano, E.; Buckwell, A.; Strijker, D. Farmland abandonment in Europe: Identification of drivers and indicators, and development of a composite indicator of risk. Land Use Policy 2015, 49, 20–34. [Google Scholar] [CrossRef]
- Russo, P.; Tomaselli, G.; Pappalardo, G. Marginal periurban agricultural areas: A support method for landscape planning. Land Use Policy 2014, 41, 97–109. [Google Scholar] [CrossRef]
- Kopiński, J.; Matyka, M. Assessment of Regional Diversity Correlations of Environmental and Organizational-Production Factors in Polish Agriculture. Probl. Agrc. Econ. 2016, 1, 56–78. [Google Scholar]
- Marks-Bielska, R. Conditions underlying the regional diversity of the area structure of farms in Poland. Acta Scientiarum Polonorum. Oeconomia 2016, 15, 105–116. [Google Scholar]
- Berre, D.; Baudron, F.; Kassie, M.; Craufurd, P.; Lopez-Ridaura, S. Different ways to cut a cake: Comparing expert-based and statistical typologies to target sustainable intensification technologies, a case-study in Southern Ethiopia. Exp. Agric. 2016, 55, 191–207. [Google Scholar] [CrossRef] [Green Version]
Figure 1.
Conceptual framework of external and internal forces shaping farming systems. Source: own elaboration.
Figure 1.
Conceptual framework of external and internal forces shaping farming systems. Source: own elaboration.

Figure 2.
Metropolitan areas falling within the scope of the study. Source: own work.

Figure 3.
Analytical framework. Source: own elaboration.


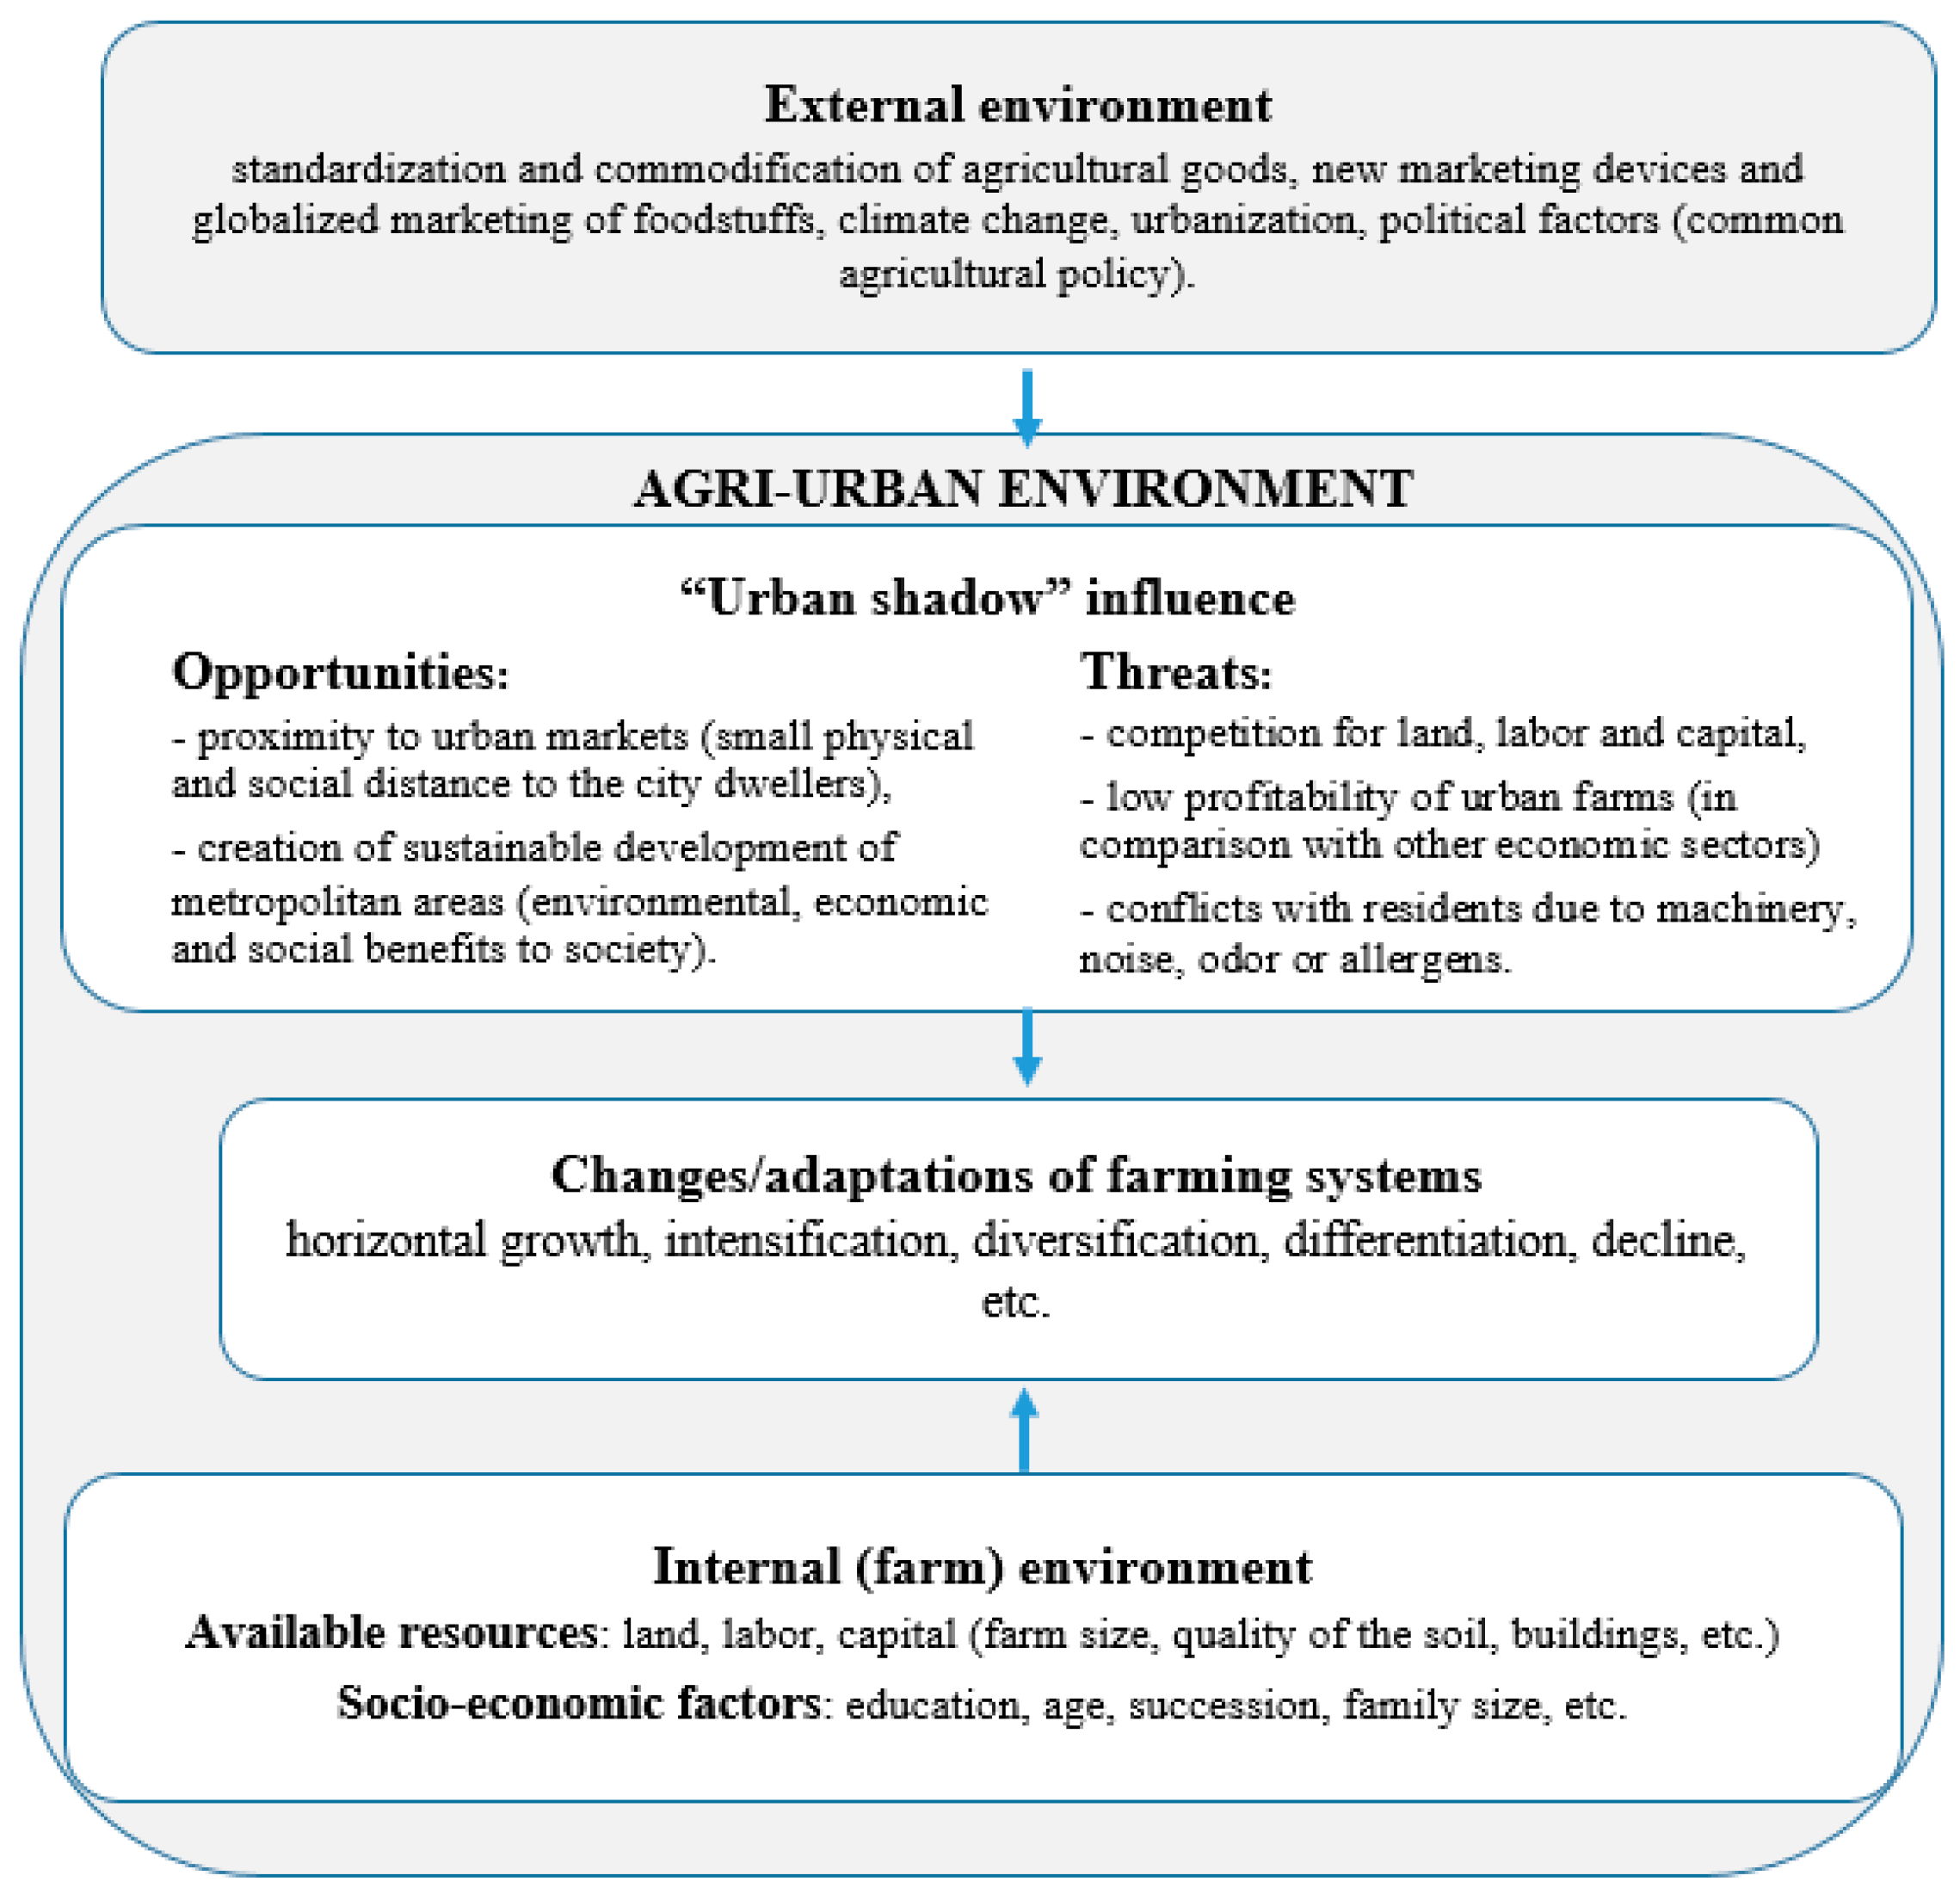
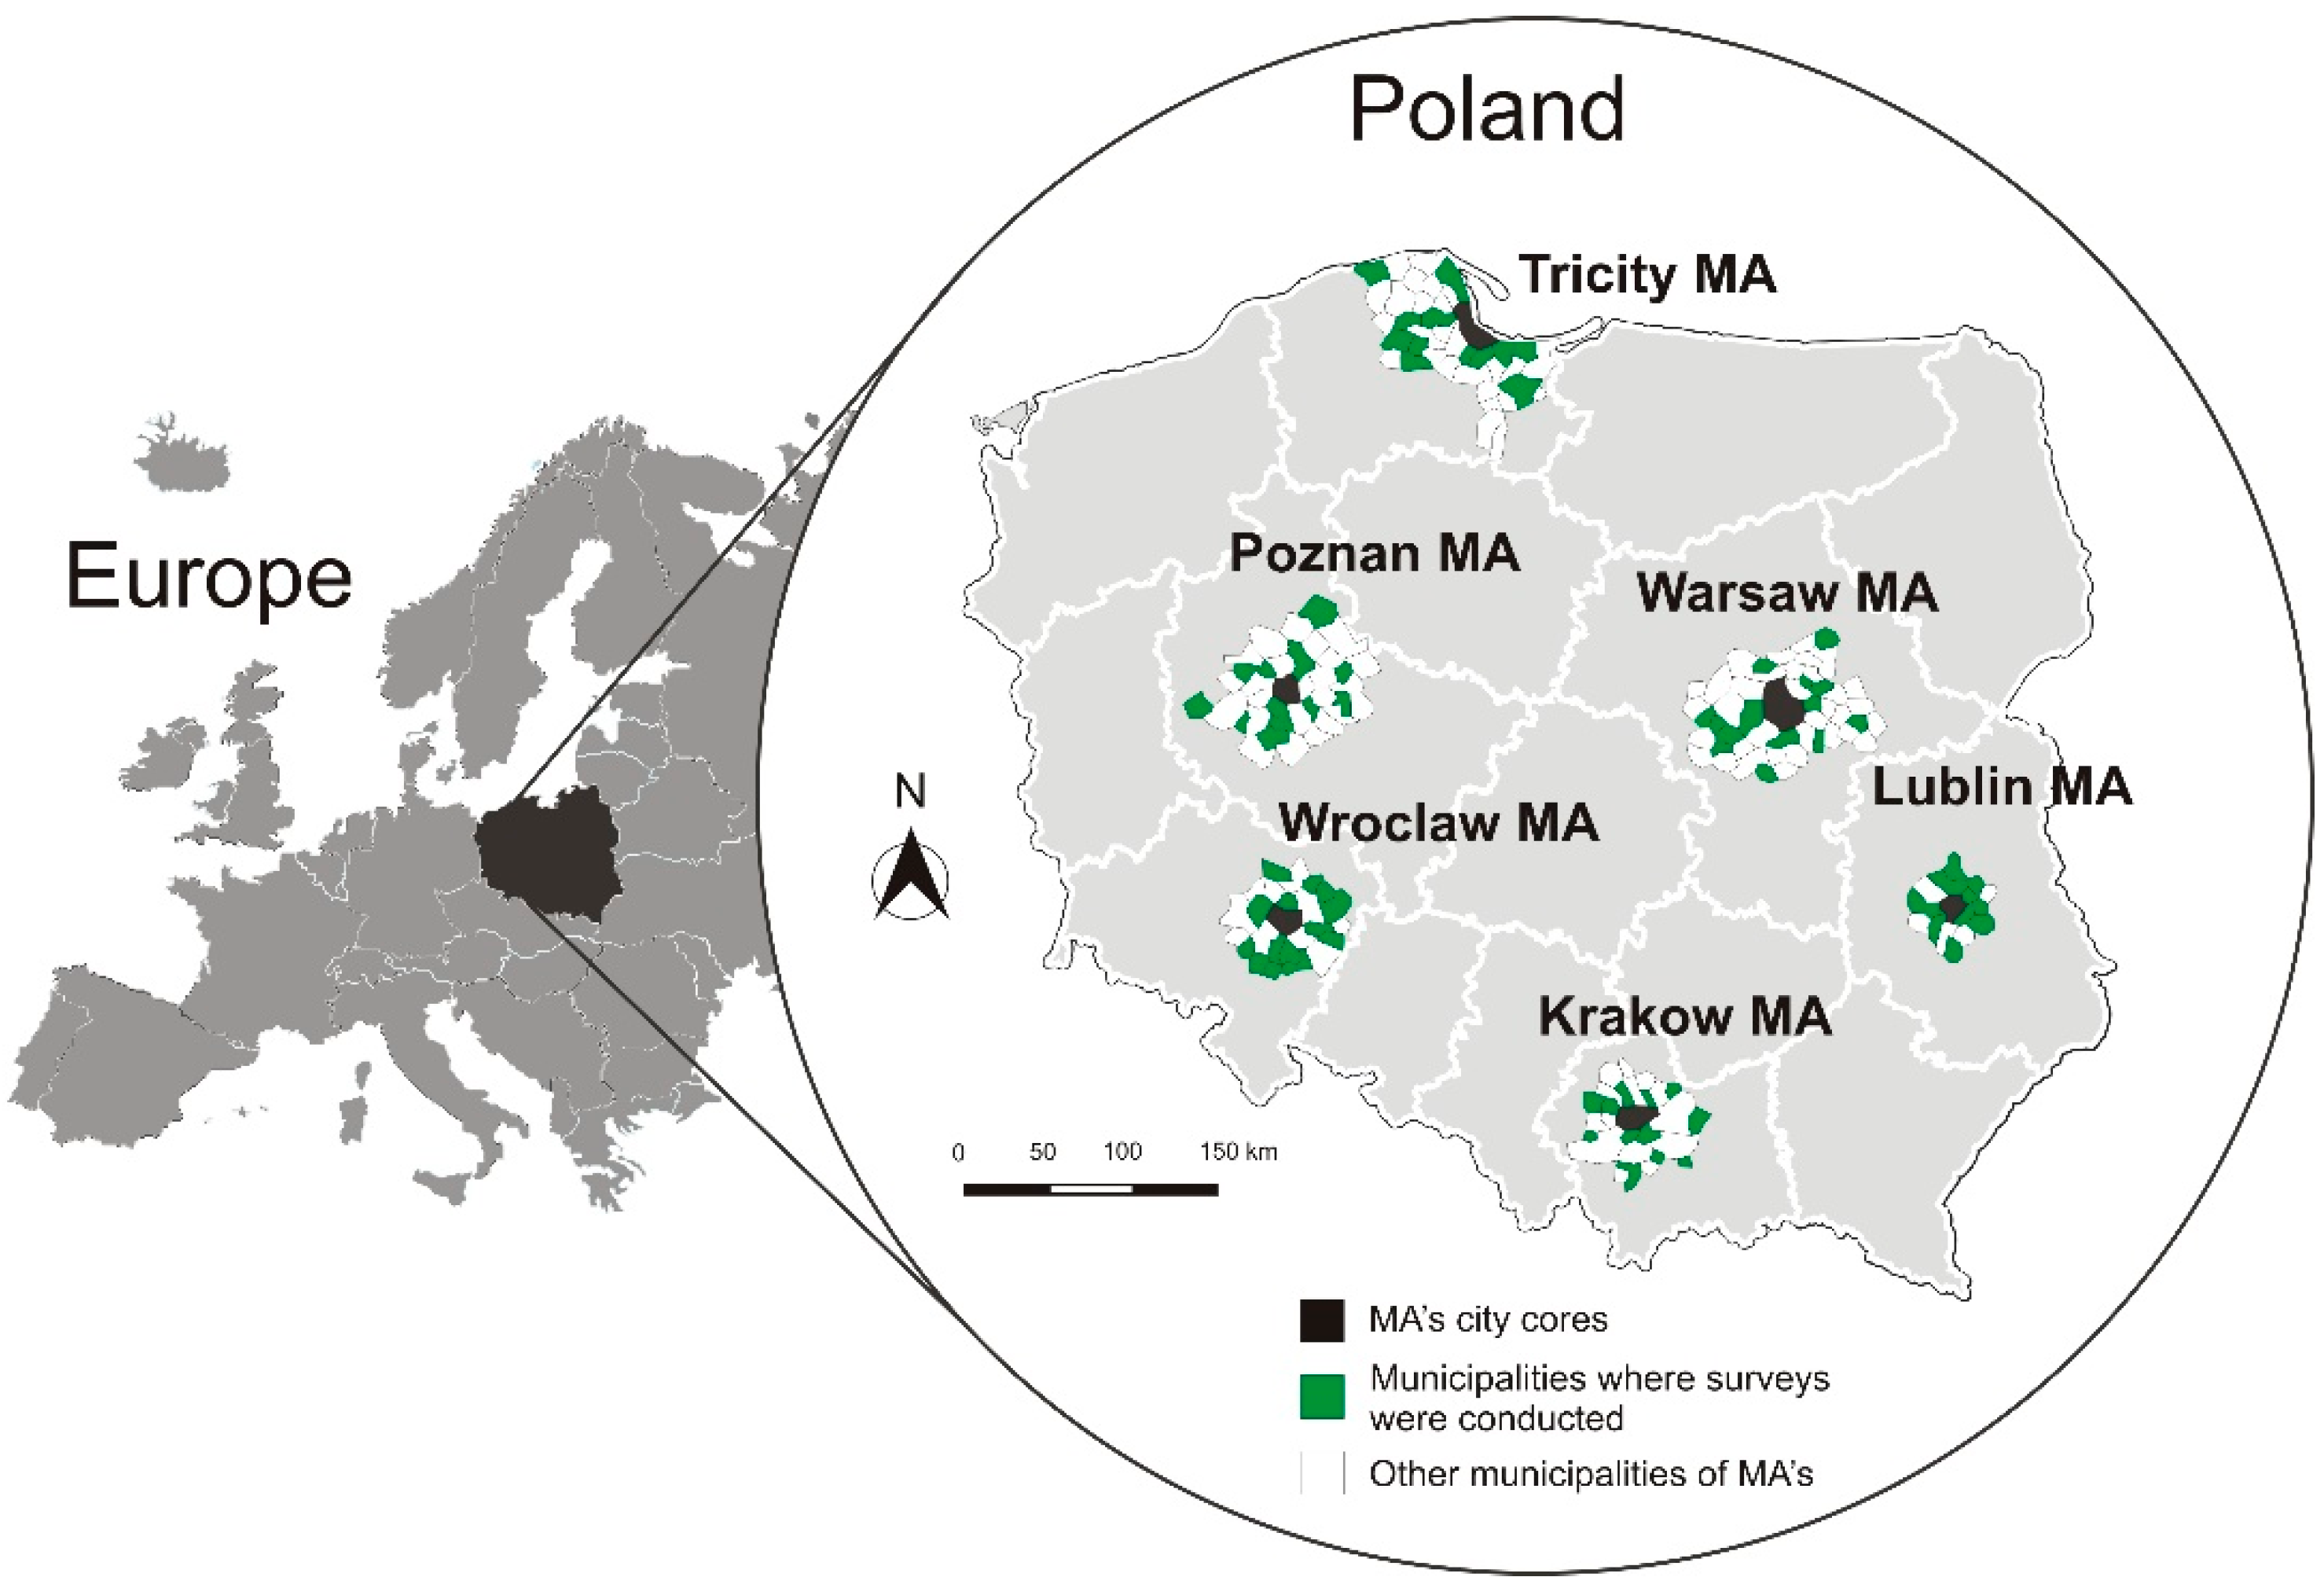
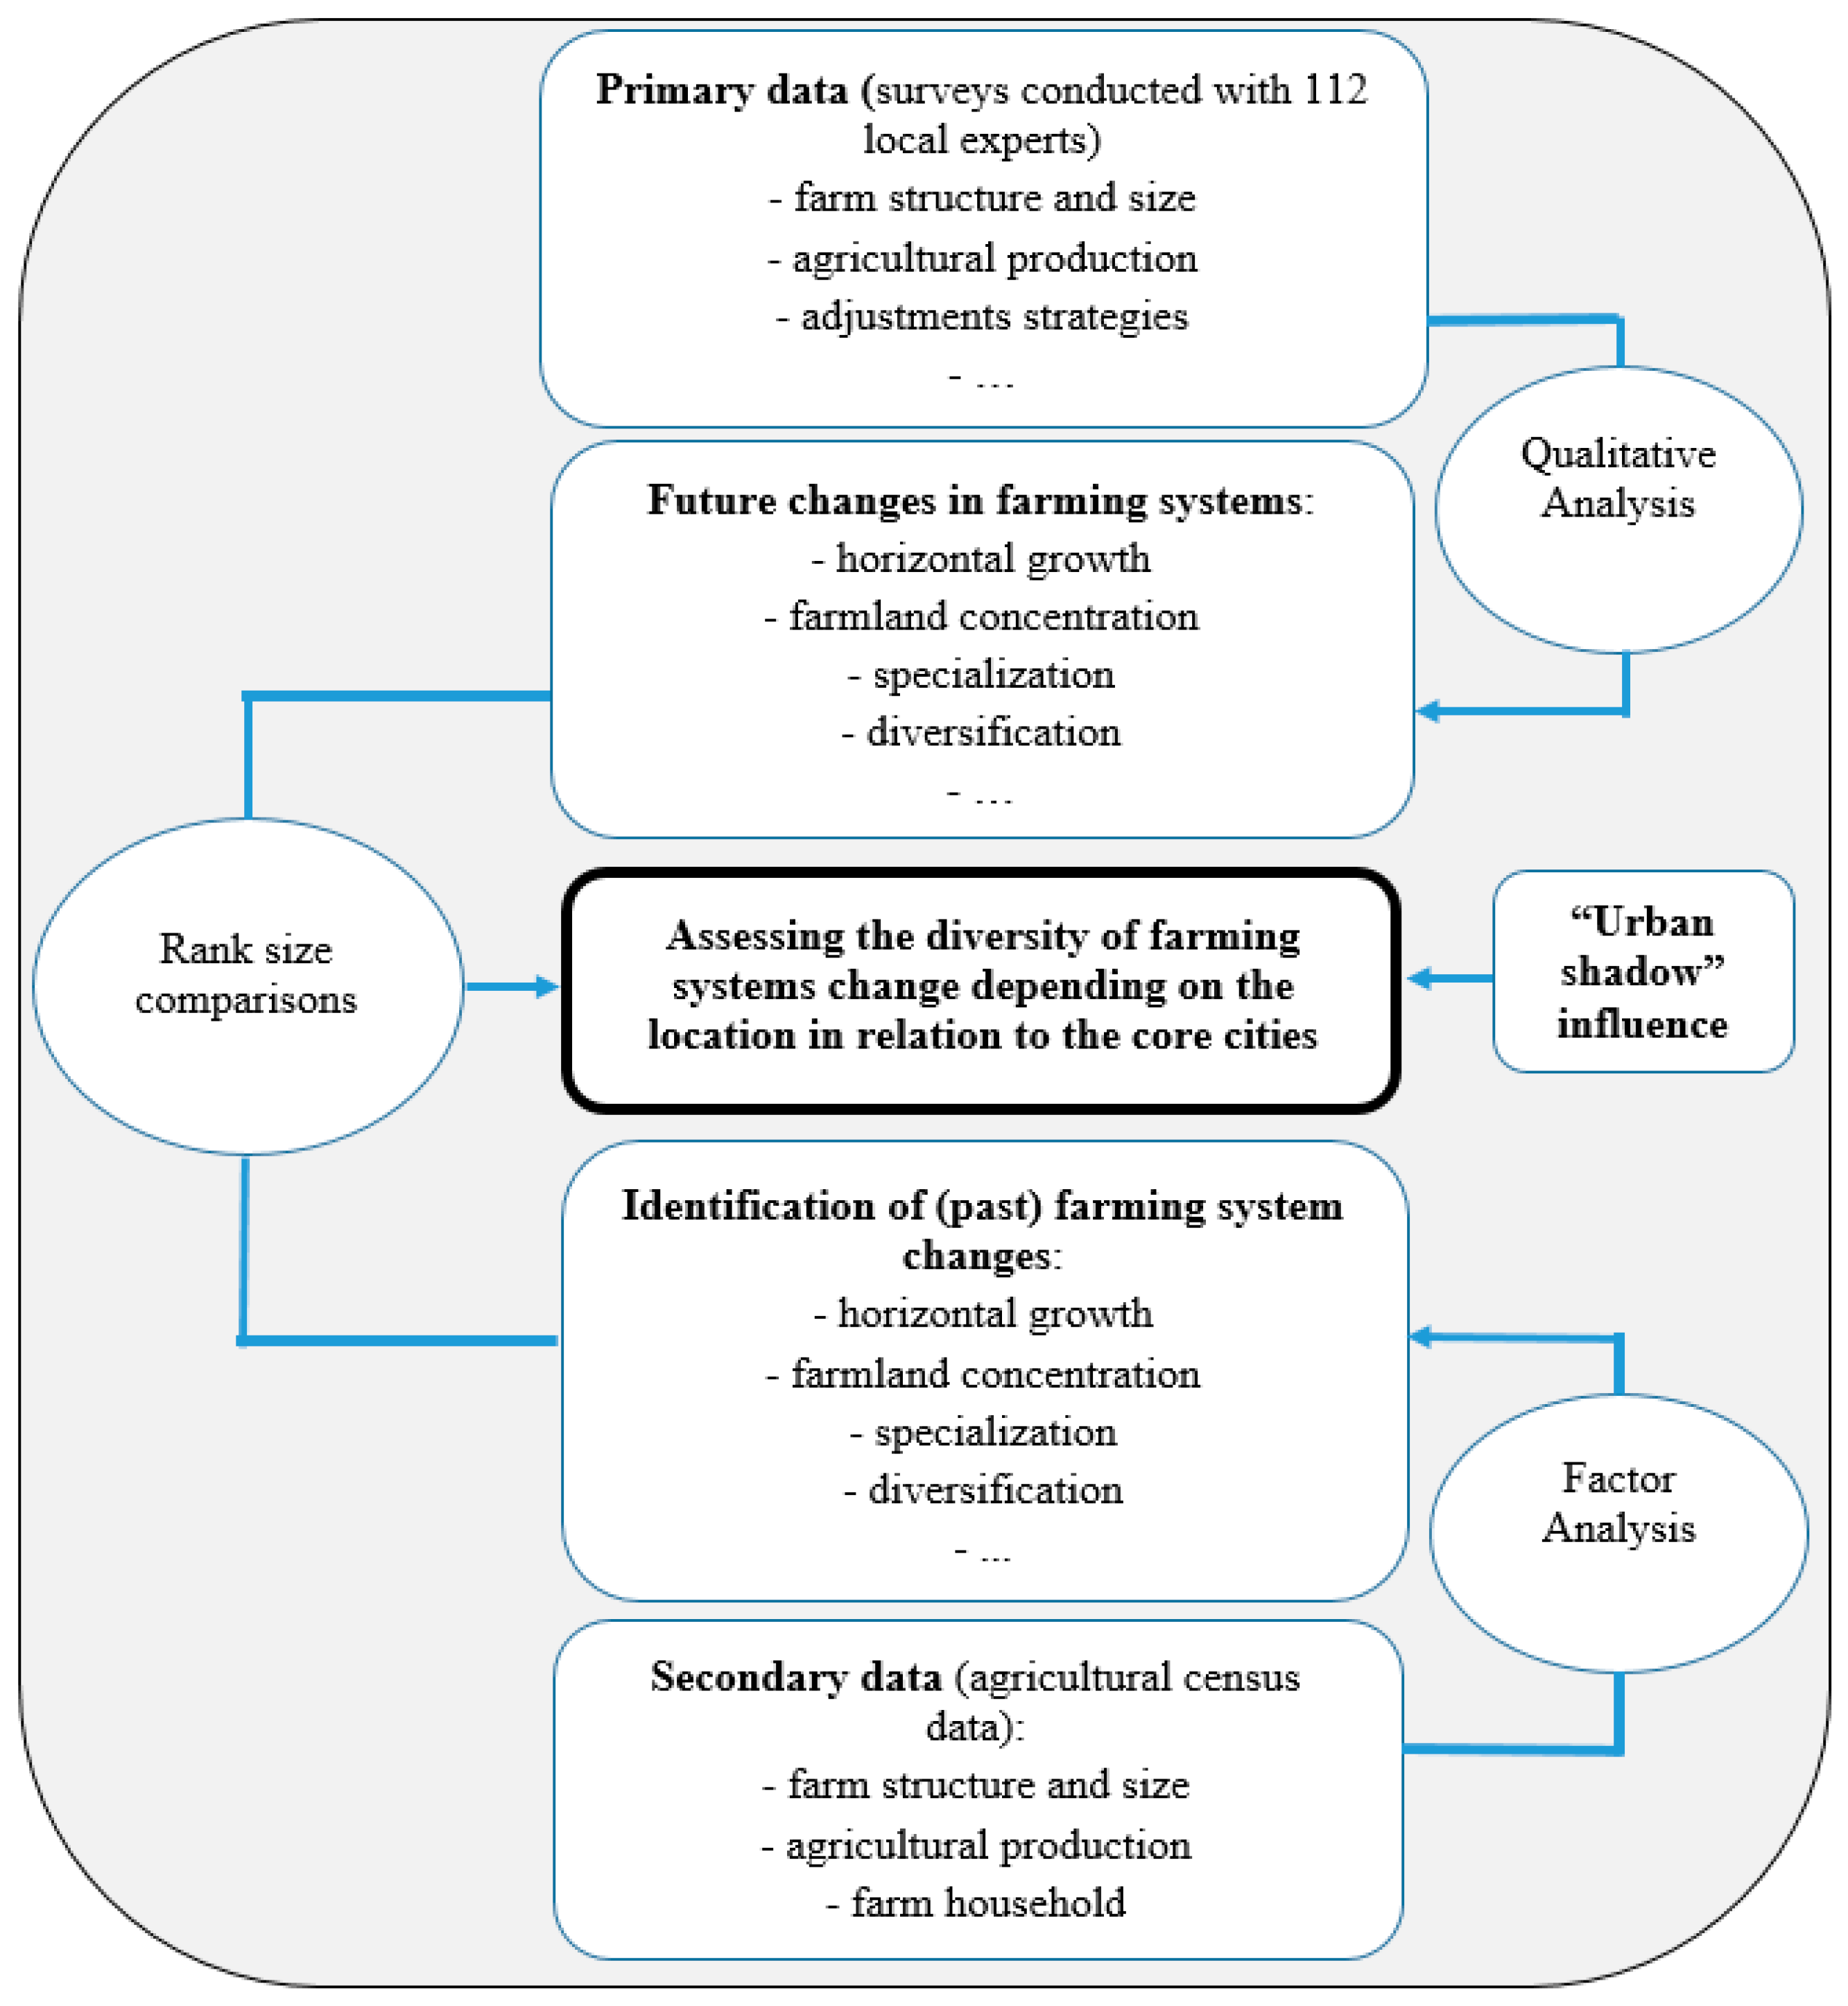
Table 1.
Socio-economic characteristics of the studied metropolitan areas.
| In Detail: | Metropolitan Area (MA) | Poland | |||||
|---|---|---|---|---|---|---|---|
| Warsaw | Krakow | Tricity | Wroclaw | Poznan | Lublin | ||
| Average salary (national average = 100%) - Core city | 133.1 | 111.0 | 114.7 | 110.4 | 110.8 | 97.4 | 100.0 |
| Population, 2019 (in 1000 inhab.) - Core city - peri-urban area | 1778.0 1476.4 | 771.7 763.2 | 749.0 836.1 | 640.6 414.9 | 536.4 901.3 | 339.7 270.3 | 38,411.1 |
| Population density, 2019 (in inhab./km2) - Core city - peri-urban area | 3440.6 221.5 | 2362.5 204.4 | 1810.0 132.0 | 2189.9 118.5 | 2050.0 151.9 | 2303.4 137.0 | 123.0 |
| % UAA of total area, 2010 - Core city - peri-urban area | 33.3 45.0 | 28.4 47.1 | 28.3 48.5 | 44.1 58.6 | 43.0 65.3 | 46.0 66.1 | 49.4 |
Source: Own elaboration based on Statistics Poland.
Table 2.
Farming system indicators for Polish MAs (n = 284).
| Indicators | 1996 | 2002 | 2010 | Rate of Change | |||
|---|---|---|---|---|---|---|---|
| Mean | SD | Mean | SD | Mean | SD | ||
| Farms with total farm area <1 ha (%) | 36.9 | 0.17 | - | - | 36.5 | 0.18 | −0.4 pp |
| Share of total farm area of farms <1 ha (%) | - | - | 3.9 | 0.07 | 2.5 | 0.06 | −1.4 pp |
| Farms with total farm area >10 ha (%) | 8.9 | 0.13 | - | - | 10.9 | 0.16 | +2.0 pp |
| Share of total farm area of farms >10 ha (%) | - | - | 53.2 | 0 | 64.9 | 0.28 | +11.7 pp |
| UAA on farms on average (ha) | 6.6 | 5.67 | - | - | 10.7 | 11.8 | +62.1% * |
| Share of farms conducting agricultural activity (%) | 97.6 | 0.10 | - | - | 95.9 | 0.10 | −1.7 pp |
| Share of subsistence farms (%) | 10.5 | 0.11 | - | - | 24.3 | 0.17 | +13.8 pp |
| Share of abandoned agricultural area (%) | 8.3 | 0.10 | - | - | 14.5 | 0.17 | +6.2 pp |
| Share of UAA under permanent grassland (%) | 16.3 | 0.13 | - | - | 12.0 | 0.12 | −4.3 pp |
| Share of UAA under permanent crops. including orchards (plantations of fruit-bearing trees and shrubs and nurseries) | 2.5 | 0.04 | - | - | 2.8 | 0.08 | +0.3 pp |
| Share of ARA under cereals (%) | 68.7 | 0.11 | - | - | 69.4 | 0.13 | +0.7 pp |
| Share of ARA under vegetables (%) | 2.7 | 0.07 | - | - | 2.9 | 0.08 | +0.2 pp |
| Farms with vegetables (%) | - | - | 34.6% | 0.18 | 8.7 | 0.11 | −25.9 pp |
| Agricultural labor input per 100 ha (AWU/100 ha UAA) | 16.7 | 12.1 | - | - | 14.1 | 11.6 | −2.6 pp |
| Farm-holders with at least secondary agricultural education (%) | - | - | 6.9% | 0.06 | 11.0 | 0.09 | +4.1 pp |
| Farms with cattle (%) | 54.1 | 0.21 | - | - | 18.9 | 0.14 | −35.2 pp |
| Farms with pigs (%) | 43.0 | 0.22 | - | - | 16.7 | 0.16 | −26.3 pp |
| Farms with horse (%) | 17.5 | 0.11 | - | - | 5.7 | 0.07 | −11.8 pp |
| Farms without livestock (%) | 23.3 | 0.20 | - | - | 52.8 | 0.18 | +29.5 pp |
| Livestock density (LU/100 ha of UAA) ** | 49.0 | 33.4 | - | - | 41.4 | 23.1 | −15.5% * |
| Share of farms producing mainly for the market (%) | 43.1 | 0.24 | - | - | 64.1 | 0.19 | +21.0 pp |
| Farms with non-agricultural economic activity (%) | 4.7 | 0.03 | - | - | 16.4 | 0.09 | +11.7 pp |
| Farms with high income (>50%) from non-agricultural activities (%) | 3.7 | 0.03 | - | - | 9.0 | 0.06 | +5.3 pp |
| Tractors per 100 ha UAA | 8.6 | 3.58 | - | - | 9.7 | 5.85 | +12.8% * |
| Combine harvesters per 100 ha UAA | 0.58 | 0.36 | - | - | 0.96 | 0.59 | +65.5% * |
Abbreviations: AA: Agricultural Area; UAA: Utilized Agricultural Area; ARA: Arable land; AWU: Annual Work Unit (2120 h year–1); LU: Livestock Unit. * Expressed as percentage change; ** cattle, pigs, horses, sheep, and poultry are included. Source: Own elaboration based on Statistics Poland (Agricultural Census 1996, 2002, and 2010).
Table 3.
Factor loadings of indicators of changes in farming systems (loadings >|0.6|).
| Variable | Factor | ||||||
|---|---|---|---|---|---|---|---|
| F1 | F2 | F3 | F4 | F5 | F6 | F7 | |
| Farms with a total farm area >10 ha (%) | 0.825 | ||||||
| Farms with a total farm area <1 ha (%) | −0.709 | ||||||
| Average UAA of farms (ha) | 0.618 | ||||||
| Farm-holders with at least secondary agricultural education (%) | 0.731 | ||||||
| Share of ARA under cereals (%) | 0.721 | ||||||
| Tractors per 100 ha UAA | −0.614 | ||||||
| Combined harvesters per 100 ha UAA | −0.601 | ||||||
| Farms with a horse (%) | 0.705 | ||||||
| Farms with cattle (%) | −0.606 | ||||||
| Farms with pigs (%) | −0.615 | ||||||
| Farms without livestock (%) | 0.840 | ||||||
| Livestock density (LU/100 ha of UAA) | −0.670 | ||||||
| Share of a total farm area of farms <1 ha (%) | −0.820 | ||||||
| Share of a total farm area of farms >10 ha (%) | 0.873 | ||||||
| Share of ARA under vegetables (%) | 0.911 | ||||||
| Share of UAA under permanent crops, including orchards (%) | 0.887 | ||||||
| Farms with non-agricultural economic activity (%) | 0.895 | ||||||
| Farms with high income (>50%) from non-agricultural activities (%) | 0.908 | ||||||
| Share of farms conducting agricultural activity (%) | −0.890 | ||||||
| Share of abandoned agricultural area (%) | 0.812 | ||||||
| Share of subsistence farms (%) | 0.653 | ||||||
| Share of UAA under permanent grassland (%) | 0.878 | ||||||
| Eigenvalues | 5.35 | 2.62 | 2.35 | 1.68 | 1.34 | 1.58 | 1.14 |
| % of variance (68,20) | 22.3 | 10.9 | 9.8 | 7.0 | 6.9 | 6.6 | 4.7 |
Source: Own elaboration.
Table 4.
Medium rank size for identified factors, depending on the location.
| Factor | Kruskal–Wallis Test (p) | Location | ||||
|---|---|---|---|---|---|---|
| Core City | Zone 1 <25 km | Zone 2 25–35 km | Zone 3 35–45 km | Zone 4 >45 km | ||
| Number of municipalities | - | 6 | 60 | 64 | 57 | 55 |
| F1 Horizontal growth and professionalization | 1.78 (0.7745) | 121.2 | 124.9 | 122.6 | 126.9 | 110.8 |
| F2 Reduction of livestock farming | 23.06 (0.0001) * | 98.0 | 149.3 | 134.7 | 104.4 | 96.0 |
| F3 Farmland concertation | 60.11 (0.0000) * | 234.5 | 164.0 | 125.4 | 88.4 | 92.5 |
| F4 Specialization (vegetables and orchards) | 5.61 (0.2302) | 115.0 | 132.6 | 123.9 | 125.4 | 103.1 |
| F5 Off-farm diversification of income | 1.34 (0.8542) | 98.0 | 117.5 | 126.0 | 125.1 | 119.4 |
| F6 Farmland abandonment | 1.74 (0.7822) | 90.0 | 124.4 | 121.8 | 125.7 | 117.0 |
| F7 Deintensification | 7.11 (0.1297) | 136.2 | 137.7 | 105.1 | 121.3 | 121.3 |
* p < 0.05. Source: Own elaboration.
Table 5.
Median and medium rank size of selected variables building factor F1, depending on the location.
Table 5.
Median and medium rank size of selected variables building factor F1, depending on the location.
| Indicators (Selected) | Mdn | Kruskal–Wallis Test (p) | Location | ||||
|---|---|---|---|---|---|---|---|
| Core City | Zone 1 <25 km | Zone 2 25–35 km | Zone 3 35–45 km | Zone 4 >45 km | |||
| Farms with a total farm area >10 ha in 1996 (%) | 10.2 | 20.4 (0.0004) * | 62.2 | 98.2 | 114.8 | 137.8 | 144.3 |
| Farms with a total farm area >10 ha in 2010 (%) | 12.6 | 13.0 (0.0109) * | 81.0 | 102.0 | 115.6 | 134.9 | 140.1 |
| Average UAA of farms in 1996 (ha) | 6.7 | 9.17 (0.0493) * | 142.3 | 105.7 | 111.4 | 130.6 | 138.6 |
| Average UAA of farms in 2010 (ha) | 8.4 | 5.4 (0.2450) | 155.2 | 111.9 | 112.5 | 126.8 | 133.2 |
| Farm-holders with at least secondary agricultural education in 1996 (%) | 7.1 | 0.26 (0.9921) | 133.3 | 121.3 | 120.7 | 123.2 | 119.6 |
| Farm-holders with at least secondary agricultural education in 2010 (%) | 12.0 | 0.49(0.9741) | 133.7 | 122.6 | 118.4 | 123.8 | 118.1 |
* p < 0.05. Source: Own elaboration.
Table 6.
Median and medium rank size of selected variables building factor F2, depending on the location.
Table 6.
Median and medium rank size of selected variables building factor F2, depending on the location.
| Indicators (Selected) | Mdn | Kruskal–Wallis Test (p) | Location | ||||
|---|---|---|---|---|---|---|---|
| Core City | Zone 1 <25 km | Zone 2 25–35 km | Zone 3 35–45 km | Zone 4 >45 km | |||
| Farms without livestock in 1996 (%) | 18.3 | 29.08 (0.0000) * | 218.8 | 146.9 | 123.6 | 104.6 | 98.0 |
| Farms without livestock in 2010 (%) | 50.2 | 52.8 (0.0000) * | 224.5 | 160.8 | 125.9 | 99.6 | 84.8 |
| Livestock density in 1996 (LU/100 ha of UAA) | 49.2 | 27.25 (0.0000) * | 8.8 | 102.8 | 118.4 | 139.8 | 138.8 |
| Livestock density in 2010 (LU/100 ha of UAA) | 32.9 | 27.27 (0.0000) * | 56.0 | 93.5 | 114.8 | 139.1 | 148.6 |
* p < 0.05. Source: Own elaboration.
Table 7.
Median and medium rank size of selected variables building factor F3, depending on the location.
Table 7.
Median and medium rank size of selected variables building factor F3, depending on the location.
| Indicators | Mdn | Kruskal–Wallis Test (p) | Location | ||||
|---|---|---|---|---|---|---|---|
| Core City | Zone 1 <25 km | Zone 2 25–35 km | Zone 3 35–45 km | Zone 4 >45 km | |||
| Share of total farm area of farms <1 ha in 2002 (%) | 2.4% | 41.32 (0.0000) * | 205.8 | 154.7 | 129.0 | 99.1 | 88.5 |
| Share of total farm area of farms <1 ha in 2010 (%) | 1.5% | 18.12 (0.0012) * | 135.5 | 144.1 | 133.8 | 106.7 | 96.3 |
| Share of total farm area of farms >10 ha in 2002 (%) | 45.7% | 6.92 (0.1401) | 89.8 | 109.3 | 113.9 | 130.5 | 135.4 |
| Share of total farm area of farms >10 ha in 2010 (%) | 55.3% | 2.74 (0.6006) | 146.8 | 116.7 | 113.5 | 125.1 | 129.4 |
* p < 0.05. Source: Own elaboration.
Table 8.
Median, quartile, and median rank size of selected variables building factor F4, depending on the location.
Table 8.
Median, quartile, and median rank size of selected variables building factor F4, depending on the location.
| Indicators | Mdn | Q3 | Kruskal–Wallis Test (p) | Location | ||||
|---|---|---|---|---|---|---|---|---|
| Core City | Zone 1 <25 km | Zone 2 25–35 km | Zone 3 35–45 km | Zone 4 >45 km | ||||
| Share of ARA under vegetables in 1996 (%) | 1.2 | 2.4 | 45.68 (0.0000) * | 217.3 | 160.7 | 114.4 | 112.0 | 86.3 |
| Share of ARA under vegetables in 2010 (%) | 0.7 | 2.5 | 28.26 (0.0000) * | 188.3 | 153.3 | 118.8 | 111.7 | 92.9 |
| Share of UAA under permanent crops, including orchards in 1996 (%) | 1.2 | 2.7 | 37.74 (0.0000) * | 206.6 | 154.0 | 120.3 | 115.8 | 84.1 |
| Share of UAA under permanent crops, including orchards in 2010 (%) | 1.0 | 3.0 | 13.80 (0.0079) * | 153.8 | 146.2 | 120.4 | 111.0 | 103.2 |
* p < 0.05. Source: Own elaboration.
Table 9.
Median and medium rank size of selected variables building factor F5, depending on the location.
Table 9.
Median and medium rank size of selected variables building factor F5, depending on the location.
| Indicators | Mdn | Kruskal–Wallis Test (p) | Location | ||||
|---|---|---|---|---|---|---|---|
| Core City | Zone 1 <25 km | Zone 2 25–35 km | Zone 3 35–45 km | Zone 4 >45 km | |||
| Farms with high income (>50%) from non-agricultural activities in 1996 (%) | 3.3% | 35.14 (0.0000) * | 203.7 | 159.6 | 102.9 | 108.6 | 105.9 |
| Farms with high income (>50%) from non-agricultural activities in 2010 (%) | 7.9% | 4.30 (0.3669) | 141.8 | 131.0 | 122.9 | 122.5 | 106.2 |
| Farms with non-agricultural economic activity in 1996 (%) | 4.3% | 26.25(0.0000) * | 195.8 | 153.4 | 104.2 | 113.9 | 106.6 |
| Farms with non-agricultural economic activity in 2010 (%) | 15.0% | 2.31 (0.6789) | 125.8 | 132.9 | 115.5 | 118.6 | 118.5 |
* p < 0.05. Source: Own elaboration.
Table 10.
Median, quartile, and medium rank size of selected variables building factor F6, depending on the location.
Table 10.
Median, quartile, and medium rank size of selected variables building factor F6, depending on the location.
| Indicators | Mdn | Quartile | Kruskal–Wallis Test (p) | Location | ||||
|---|---|---|---|---|---|---|---|---|
| Core City | Zone 1 <25 km | Zone 2 25–35 km | Zone 3 35–45 km | Zone 4 >45 km | ||||
| Share of farms conducting agricultural activity in 1996 (%) | 98.9 | Q1 = 96.6 | 7.67 (0.1043) | 56.5 | 111.3 | 125.6 | 128.7 | 127.5 |
| Share of farms conducting agricultural activity in 2010 (%) | 95.8 | Q1 = 90.5 | 4.06 (0.3978) | 78.7 | 112.5 | 124.5 | 125.6 | 128.3 |
| Share of abandoned agricultural area in 1996 (%) | 6.9 | Q3 =12.6 | 6.90 (0.1412) | 194.2 | 123.3 | 117.8 | 117.3 | 120.2 |
| Share of abandoned agricultural area in 2010 (%) | 9.7 | Q3 = 21.6 | 4.56 (0.3352) | 170.5 | 129.7 | 118.8 | 115.9 | 116.0 |
Source: Own elaboration.
Table 11.
Experts’ opinions on increases in farm size until 2027 (n = 112).
| In Detail | Medium Rank Size | Number of Responses | ||||
|---|---|---|---|---|---|---|
| Strongly Agree | Agree | Undecided | Disagree | Strongly Disagree | ||
| Test H * (2, n = 112) = 14.46; p = 0.0007 | ||||||
| Core City | 26.2 ** | - | - | - | 5 | 7 |
| <25 km to MA Core | 55.7 | - | 13 | 1 | 18 | 7 |
| >25 km to MA Core | 62.9 ** | 3 | 23 | 4 | 22 | 9 |
| In total | - | 3 | 36 | 5 | 45 | 23 |
* Test H—Test ANOVA Kruskal-Wallis; ** Dunn’s pairwise tests—significant at the level <0.05. Source: Own elaboration.
Table 12.
Experts’ opinions on the occurrence of processes of specialization in vegetable and/or fruit production until 2027 (n = 112).
Table 12.
Experts’ opinions on the occurrence of processes of specialization in vegetable and/or fruit production until 2027 (n = 112).
| In Detail: | Medium Rank Size | Number of Responses | ||||
|---|---|---|---|---|---|---|
| Strongly Agree | Agree | Undecided | Disagree | Strongly Disagree | ||
| Test H * (2, n = 112) = 9.41; p = 0.0090 | ||||||
| Core city | 36.6 ** | - | 1 | - | 5 | 6 |
| <25 km to MA Core | 66.4 | 4 | 14 | - | 15 | 6 |
| >25 km to MA Core | 54.1 | 1 | 16 | 3 | 24 | 17 |
| In total | - | 5 | 31 | 3 | 44 | 29 |
*, ** Description as in Table 11. Source: Own elaboration.
Table 13.
Experts’ opinions on the process of reducing the number of livestock until 2027 (n = 112).
Table 13.
Experts’ opinions on the process of reducing the number of livestock until 2027 (n = 112).
| In Detail | Medium Rank Size | Number of Responses | ||||
|---|---|---|---|---|---|---|
| Strongly Agree | Agree | Undecided | Disagree | Strongly Disagree | ||
| Test H * (2, n = 112) = 11.52; p = 0.0031 | ||||||
| Core city | 81.1 ** | 11 | 1 | - | - | - |
| <25 km to MA Core | 58.3 | 19 | 20 | - | - | - |
| >25 km to MA Core | 50.5 ** | 24 | 31 | 2 | 4 | - |
| In total | - | 54 | 52 | 2 | 4 | - |
*, ** Description as in Table 11. Source: Own elaboration.
Table 14.
Experts’ opinions on growth in the process of farmland abandonment until 2027 (n = 112).
| In Detail | Medium Rank Size * | Number of Responses | ||||
|---|---|---|---|---|---|---|
| Strongly Agree | Agree | Undecided | Disagree | Strongly Disagree | ||
| Test H (2, n = 112) = 15.41; p = 0.0004 | ||||||
| Core city | 82.2 ** | 3 | 7 | - | 2 | - |
| <25 km to MA Core | 62.8 | 2 | 19 | 4 | 12 | 2 |
| >25 km to MA Core | 47.3 ** | 2 | 14 | 10 | 28 | 7 |
| In total | - | 7 | 40 | 14 | 42 | 9 |
*, ** Description as in Table 11. Source: Own elaboration.
Publisher’s Note: MDPI stays neutral with regard to jurisdictional claims in published maps and institutional affiliations. |
© 2021 by the authors. Licensee MDPI, Basel, Switzerland. This article is an open access article distributed under the terms and conditions of the Creative Commons Attribution (CC BY) license (https://creativecommons.org/licenses/by/4.0/).
Share and Cite
MDPI and ACS Style
Sroka, W.; Żmija, D. Farming Systems Changes in the Urban Shadow: A Mixed Approach Based on Statistical Analysis and Expert Surveys. Agriculture 2021, 11, 455. https://0-doi-org.brum.beds.ac.uk/10.3390/agriculture11050455
AMA Style
Sroka W, Żmija D. Farming Systems Changes in the Urban Shadow: A Mixed Approach Based on Statistical Analysis and Expert Surveys. Agriculture. 2021; 11(5):455. https://0-doi-org.brum.beds.ac.uk/10.3390/agriculture11050455
Chicago/Turabian StyleSroka, Wojciech, and Dariusz Żmija. 2021. "Farming Systems Changes in the Urban Shadow: A Mixed Approach Based on Statistical Analysis and Expert Surveys" Agriculture 11, no. 5: 455. https://0-doi-org.brum.beds.ac.uk/10.3390/agriculture11050455
Note that from the first issue of 2016, this journal uses article numbers instead of page numbers. See further details here.