
Evaluation and Experiment of Flight Parameter Quality of the Plant Protection UAV Based on Laser Tracker

 , ,
, ,  and
and
Abstract
:1. Introduction
- (1)
- Error analysis and calibration of the flight parameter measurement system of the plant protection UAV based on a laser tracker
- (2)
- Measurement system layout and flight parameter setting
- (3)
- Flight parameter quality evaluation index and evaluation method design
- (4)
- Data processing and evaluation after the experiments
2. Materials and Methods
2.1. Distance Measurement Error Calibration
- (1)
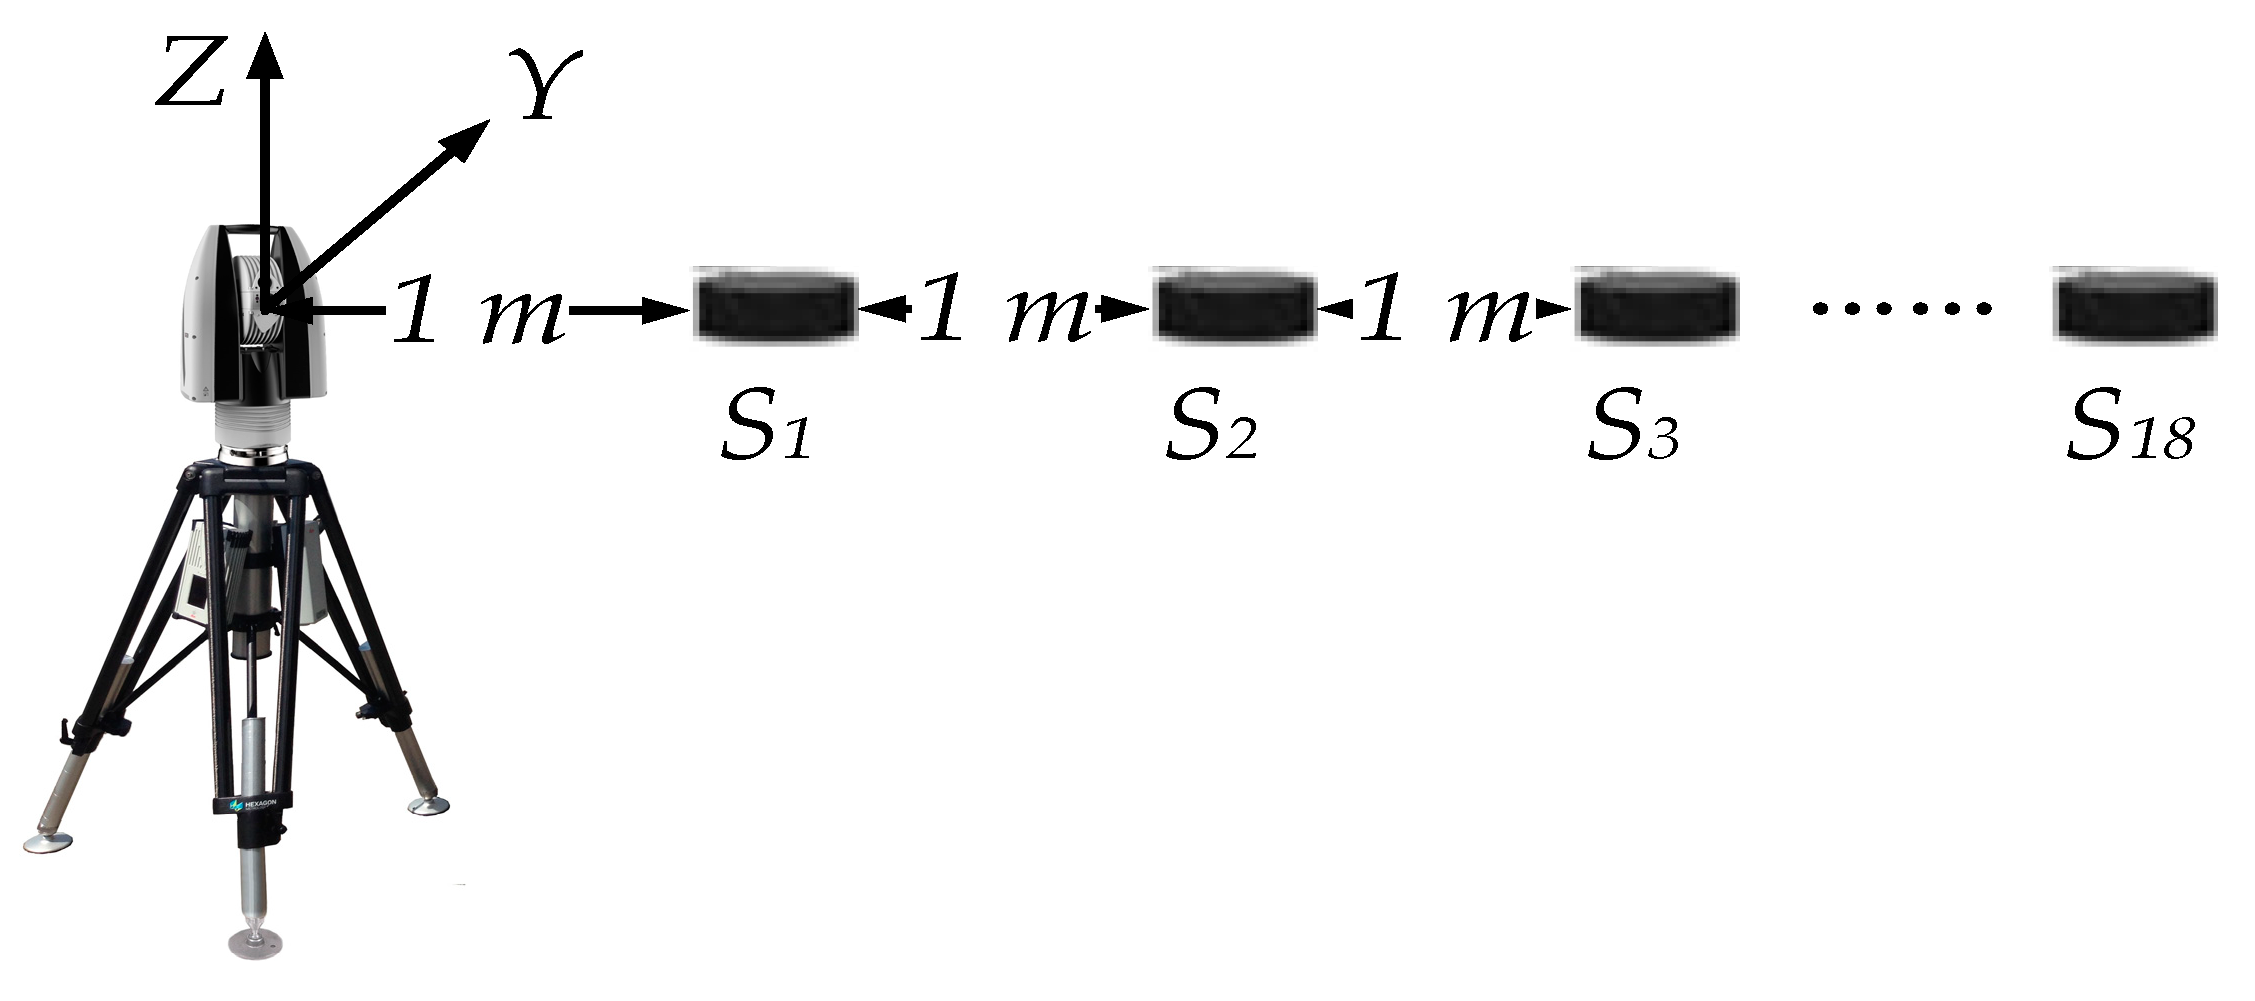
- The laser was placed on the bracket, and the level was adjusted.
- (2)
- Eighteen collinear target ball base placement points, S1, S2, S3, …, S18, were set up. Additionally, the line between the base placement points coincided with the X-axis of the laser tracker to minimize the effects of horizontal and vertical angle errors. The distance between each base placement point was 1 m, the distance was determined by the distance information displayed by the host computer of the laser tracker, and the distance Li was recorded as the standard value.
- (3)
- The target ball was placed on the base, the distance information of the host computer was recorded, the target ball was picked up and placed again in the same position, and the distance was recorded. The measurement was repeated three times at each base placement point, and the average distance Si was recorded as the measured value.
- (4)
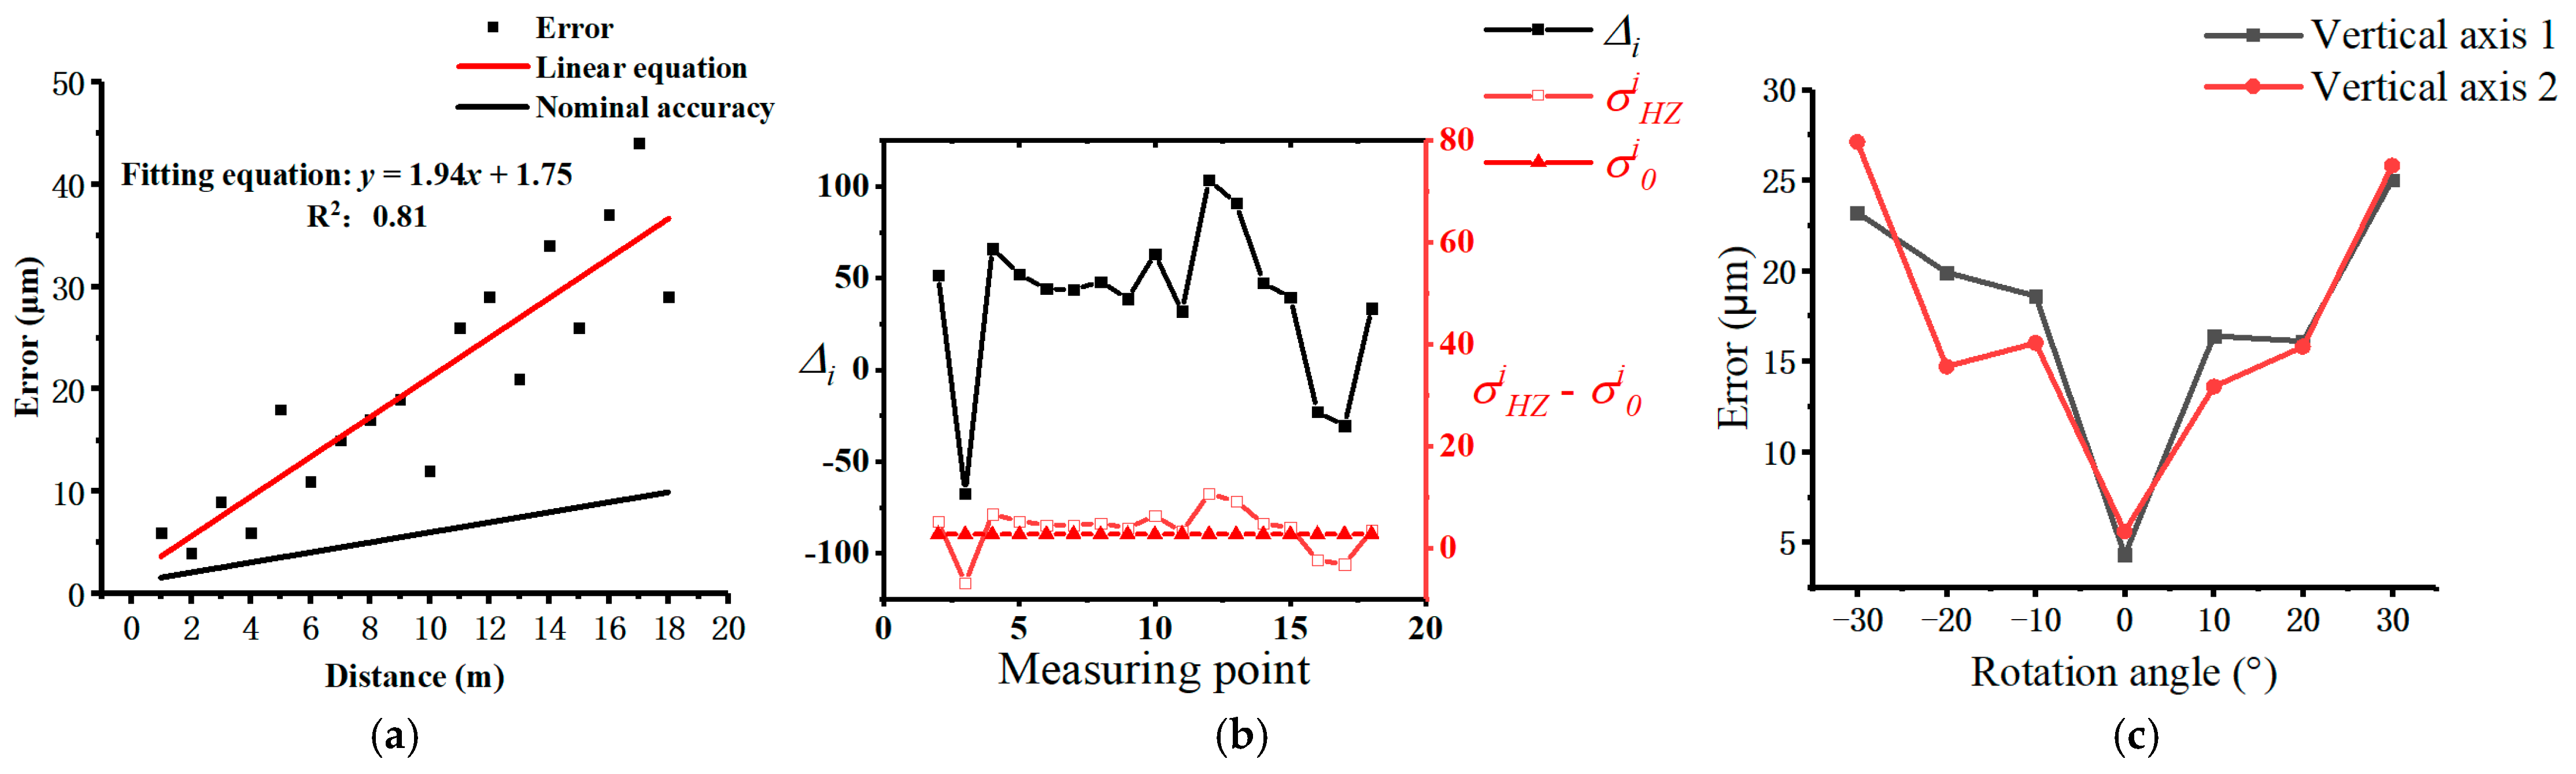
- The measurements were completed from S1 to S18 in sequence, and continuous light was ensured throughout the measurement process; otherwise, all measurements were repeated. The error δ was calculated using the formula .
2.2. Angle Measurement Calibration
- (1)
- A horizontal guide rail was arranged within the measuring range of the laser tracker. The laser tracker was placed on the side of the guide rail and adjusted to the level. The specific placement method was as follows: the laser tracker was located on the vertical line of the guide rail, 5 m away from the guide rail, and the height was the same as the guide rail.
- (2)
- A total of 18 target ball base placement points, P1 to P18, were set up from the starting point to the endpoint of the guide rail. The distance between the placement points was 2 m. The coordinates of each placement point were measured with a laser tracker. The distance Di between each placement point and the previous placement point was calculated as the standard value according to the formula , where Xi, Yi, and Zi are the coordinates of the ith point.
- (3)
- The target ball was placed in sequence from P1 to P18 again and was then placed three times at each placement point. The average coordinate was recorded to calculate the distance Pi from each placement point to the previous placement point as the measured value. The horizontal angle measurement error was calculated according to Formula (3).
2.3. Laser Incident Angle Error Calibration
- (1)
- The target ball was placed on a fixed base, which was 5 m away from the tracker. The laser tracker and the target ball were placed on the same horizontal line to reduce the effect of angle measurement error.
- (2)
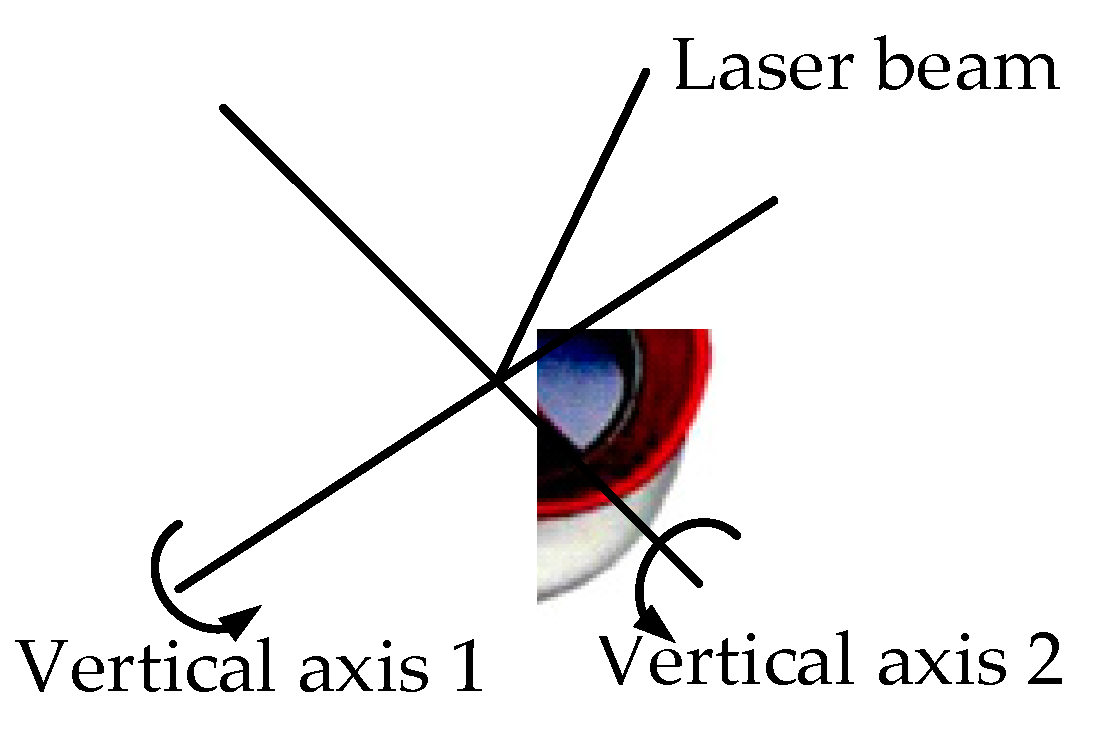
- The target ball was directed to the laser beam, and then the target ball was rotated around the laser beam in turn by 0°, 90°, 180°, and 270°. The measurement was repeated 3 times, and the measurement value displayed by the laser tracker host computer was recorded.
- (3)
- Within the incident range of the target ball, the target ball was rotated around 2 vertical axes with a rotation step of 10°. The measurement was repeated 3 times, and the measurement value was recorded.
- (4)
- The average value of the 3 repeated measurements in each axial was the observation value in that axial. The data obtained by rotating the target ball around the laser beam were fitted to obtain the center point of the target ball. Then, the error caused by the incident angle of the laser beam to the target ball on the measurement accuracy of the laser tracker was obtained by the difference between the observed value and the center point of the target ball.
2.4. Flight Parameter Quality Evaluation Method
- (1)
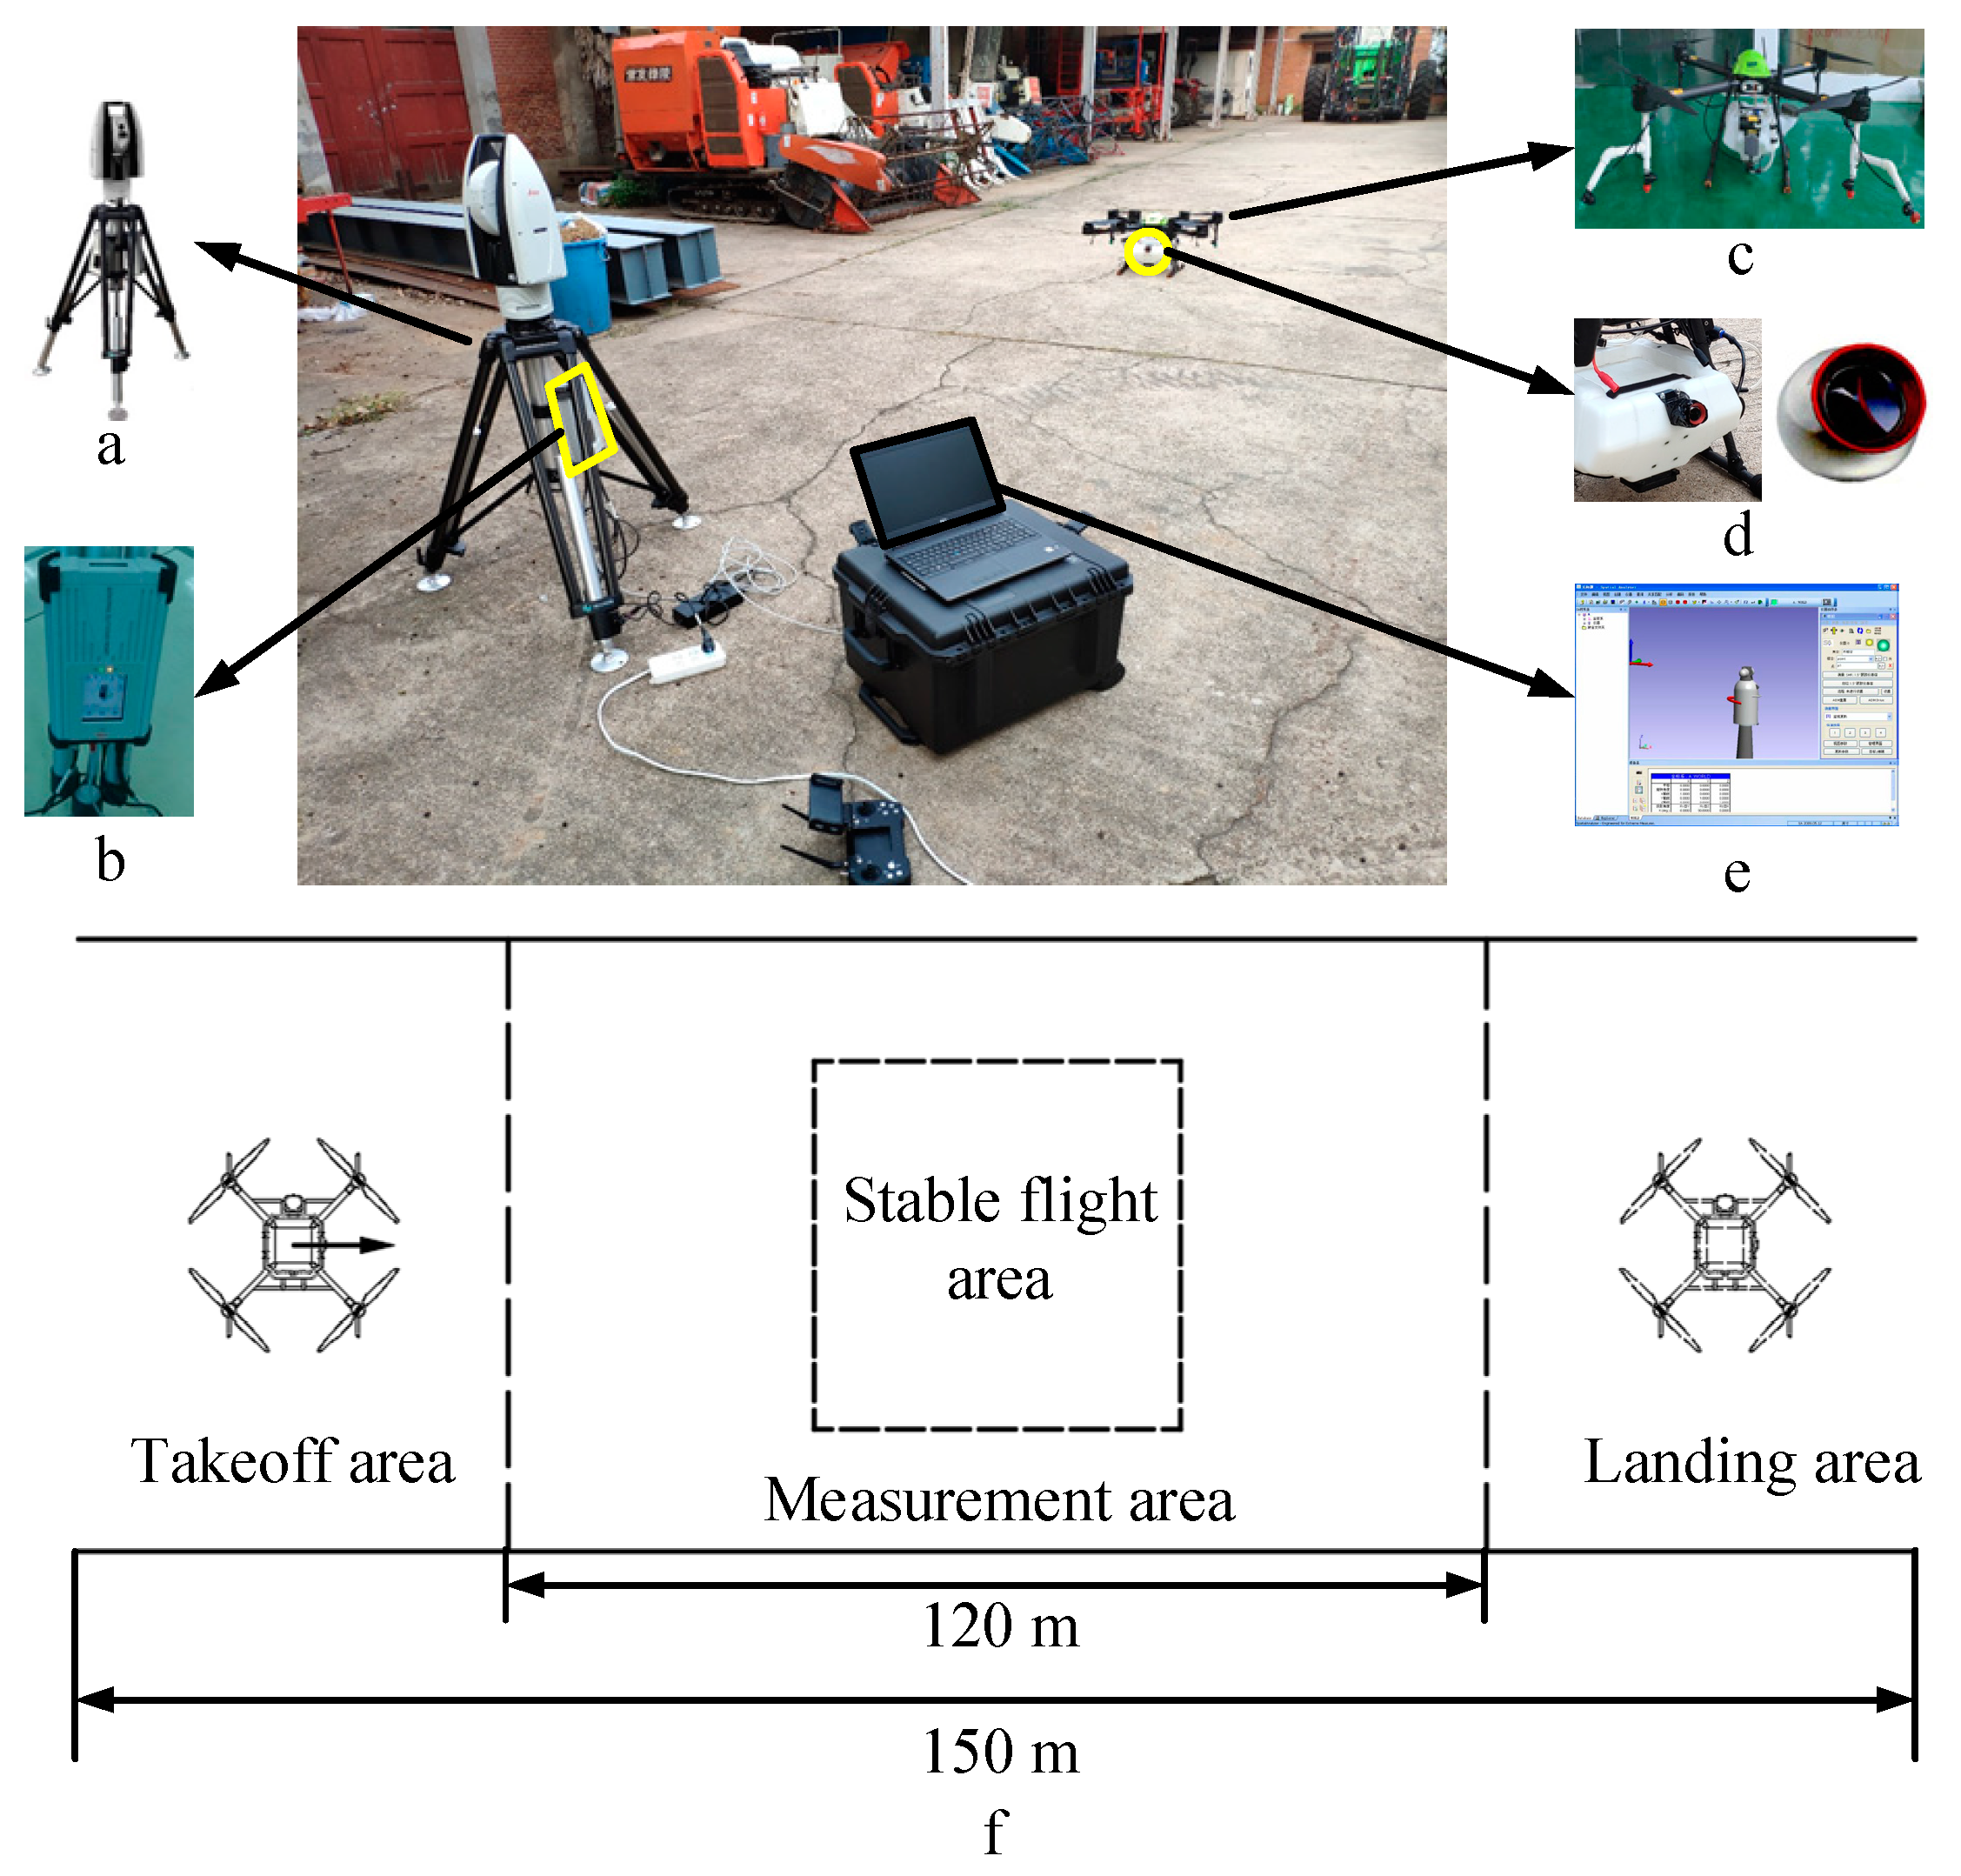
- As shown in Figure 1, the flight altitude and speed accurate measurement experiment of the plant protection UAV was conducted at the Institute of Agricultural Equipment Engineering of Jiangsu University (32°12′01″ N; 119°30′45″ E). A rectangular area of 150 m × 10 m was selected in the east–west direction. Additionally, the area was divided into a takeoff area, a measurement area, and a landing area. The length of the measurement area was 120 m. The altitude of the plant protection UAV was determined by measuring the distance to the ground using an onboard MMV radar. In order to reduce the influence of terrain undulations on the measurement, a flat area of 25 m × 5 m in the measurement area was selected as the stable flight area. The evaluation of flight parameter quality was based on the stable flight data in this area.
- (2)
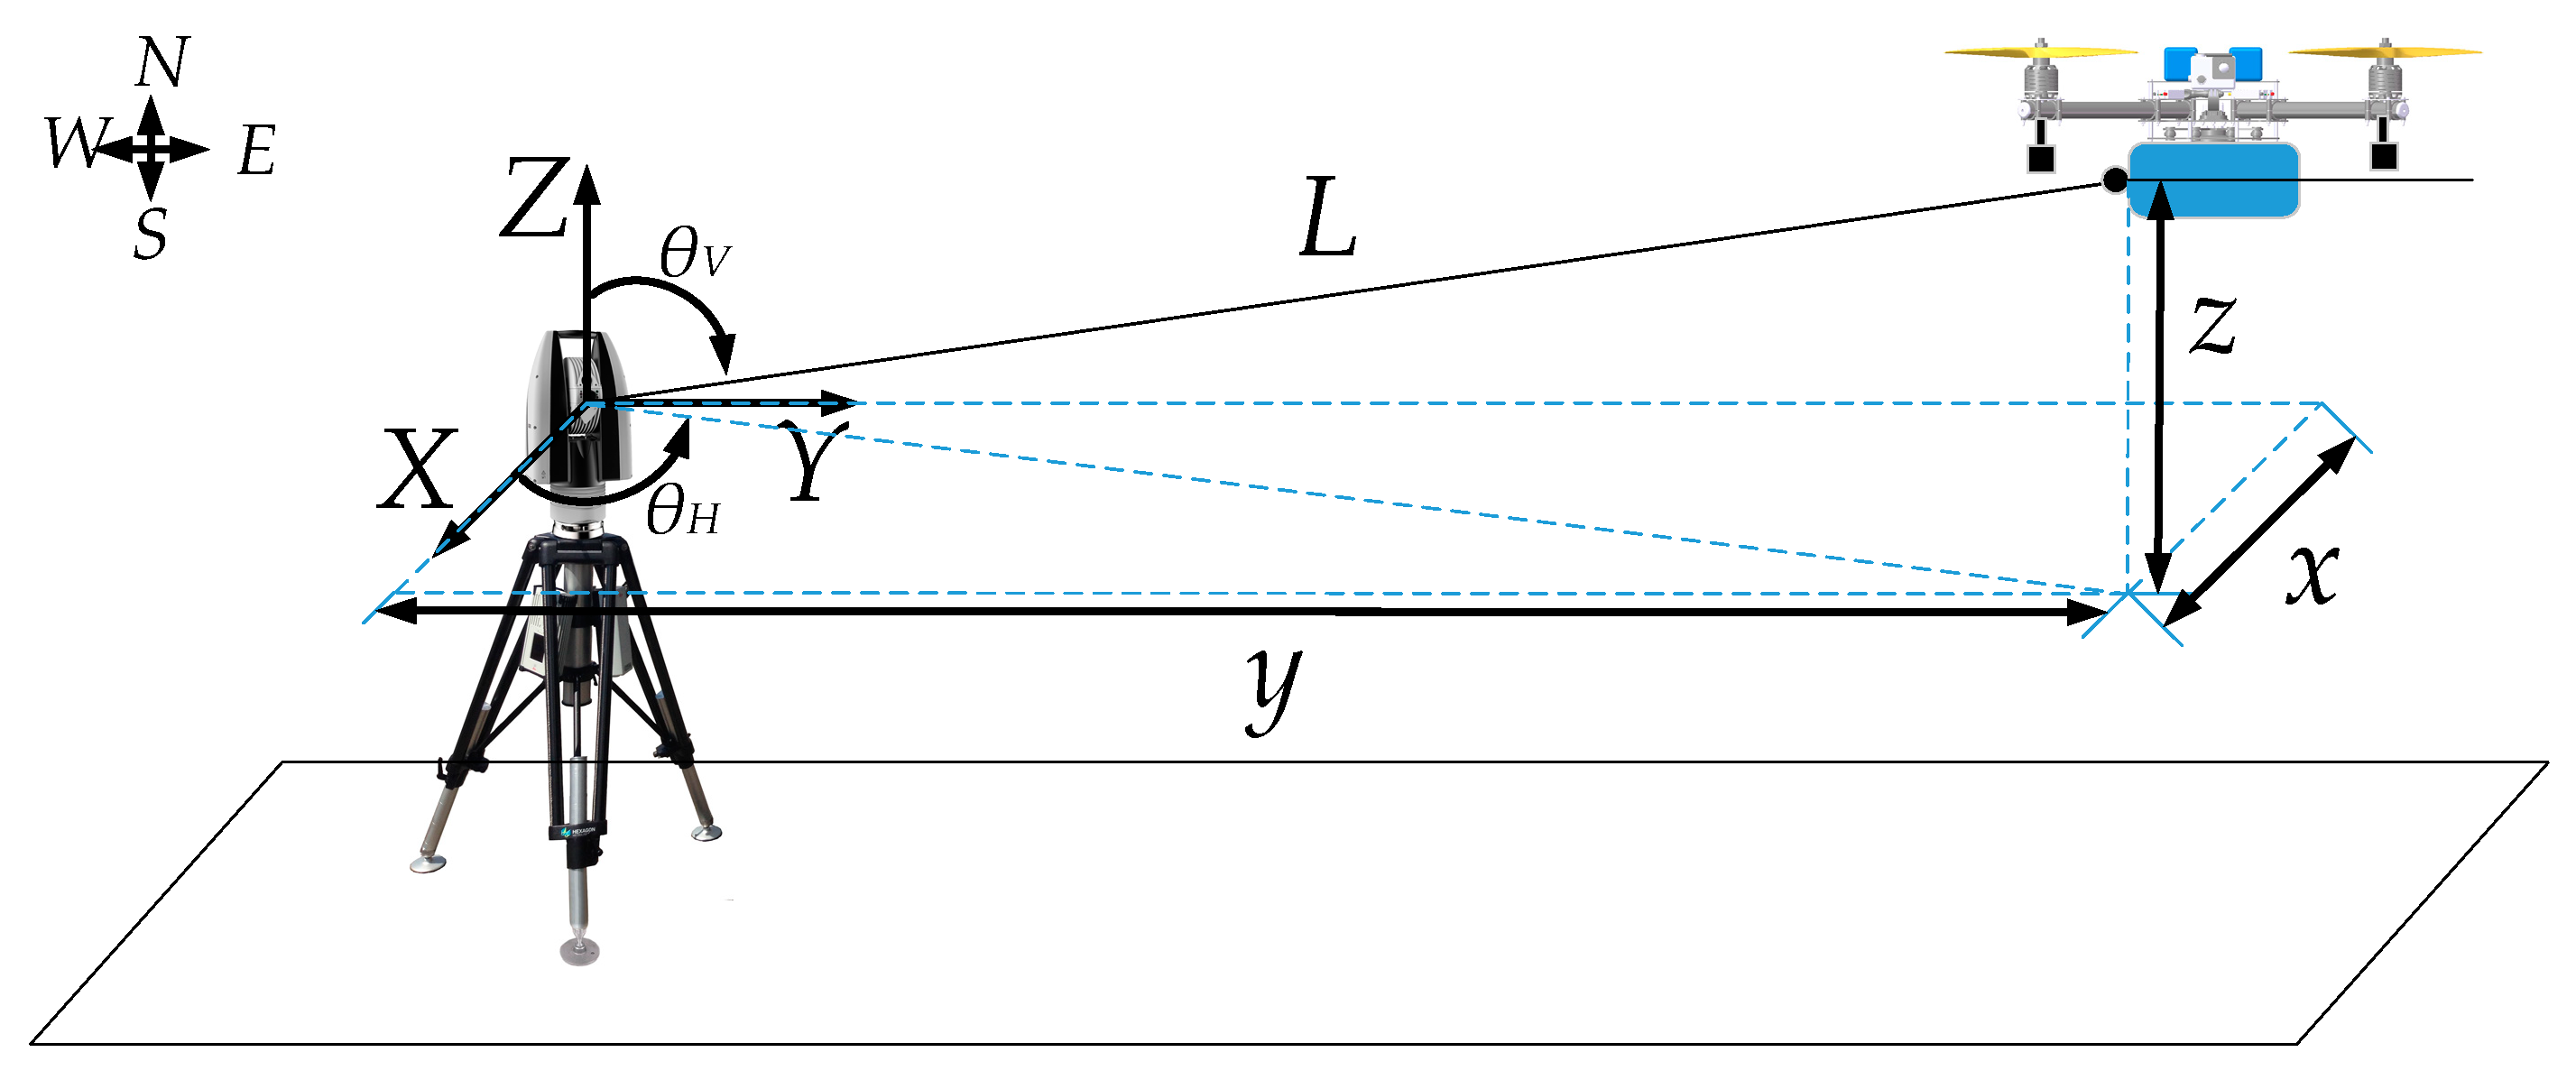
- The Leica AT960-LR laser tracker measurement system was placed on the west edge of the east–west central axis of the rectangular area, and the x, y direction of the tracker coordinate system coincided with the x, y direction of the UTM coordinate system. The height of the center of the tracking head of the laser tracker was measured from the ground as hju, and the GPS position information of the laser tracker was recorded. Data were converted to three-dimensional coordinates (xju, yju, hju) into the UTM coordinate system.
- (3)
- The UAV was placed on the central axis of the rectangular area in the east–west direction, facing east and flying from west to east. The Leica 38.1 mm target ball was installed on the tail of the UAV 1 m away from the laser tracker.
- (4)
- In order to avoid the measurement error caused by manual operation, this experiment used autonomous flight. The starting and ending points of the UAV route were set along the east–west central axis of the rectangular area. The distance between the two points was 150 m.
- (5)
- After the UAV took off and stabilized hold at the starting point, the Leica AT960 measurement system started to record data. The UAV performed autonomous flight according to the flight parameters in Table 2. After the UAV reached the end point, the Leica AT960 measurement system stopped recording data. During the whole process, the laser light between the laser tracker and the target ball was kept constant; otherwise, the UAV was returned to the starting point, and the experiment was restarted.
- (6)
- The high-precision position of the UAV from the laser tracker and the longitude, latitude, altitude, and speed of the UAV from the flight log were determined. Latitude, longitude, and altitude information was converted into three-dimensional coordinates (xu, yu, hu) in the UTM coordinates. The position of the UAV relative to the laser tracker was calculated from the onboard sensor data obtained by (xu- xju, yu- yju, hu- hju). The data (xj, yj, hj) and (xu- xju, yu- yju, hu- hju) were analyzed and processed.
- (7)
- The flight trajectory, flight speed consistency and flight altitude consistency were used as evaluation indexes to evaluate the flight parameter quality of the plant protection UAV. Additionally, the consistency calculation was performed according to Formula (4).
3. Results and Discussion
3.1. Error Calibration Result
3.2. Flight Parameter Quality Evaluation Results
- (1)
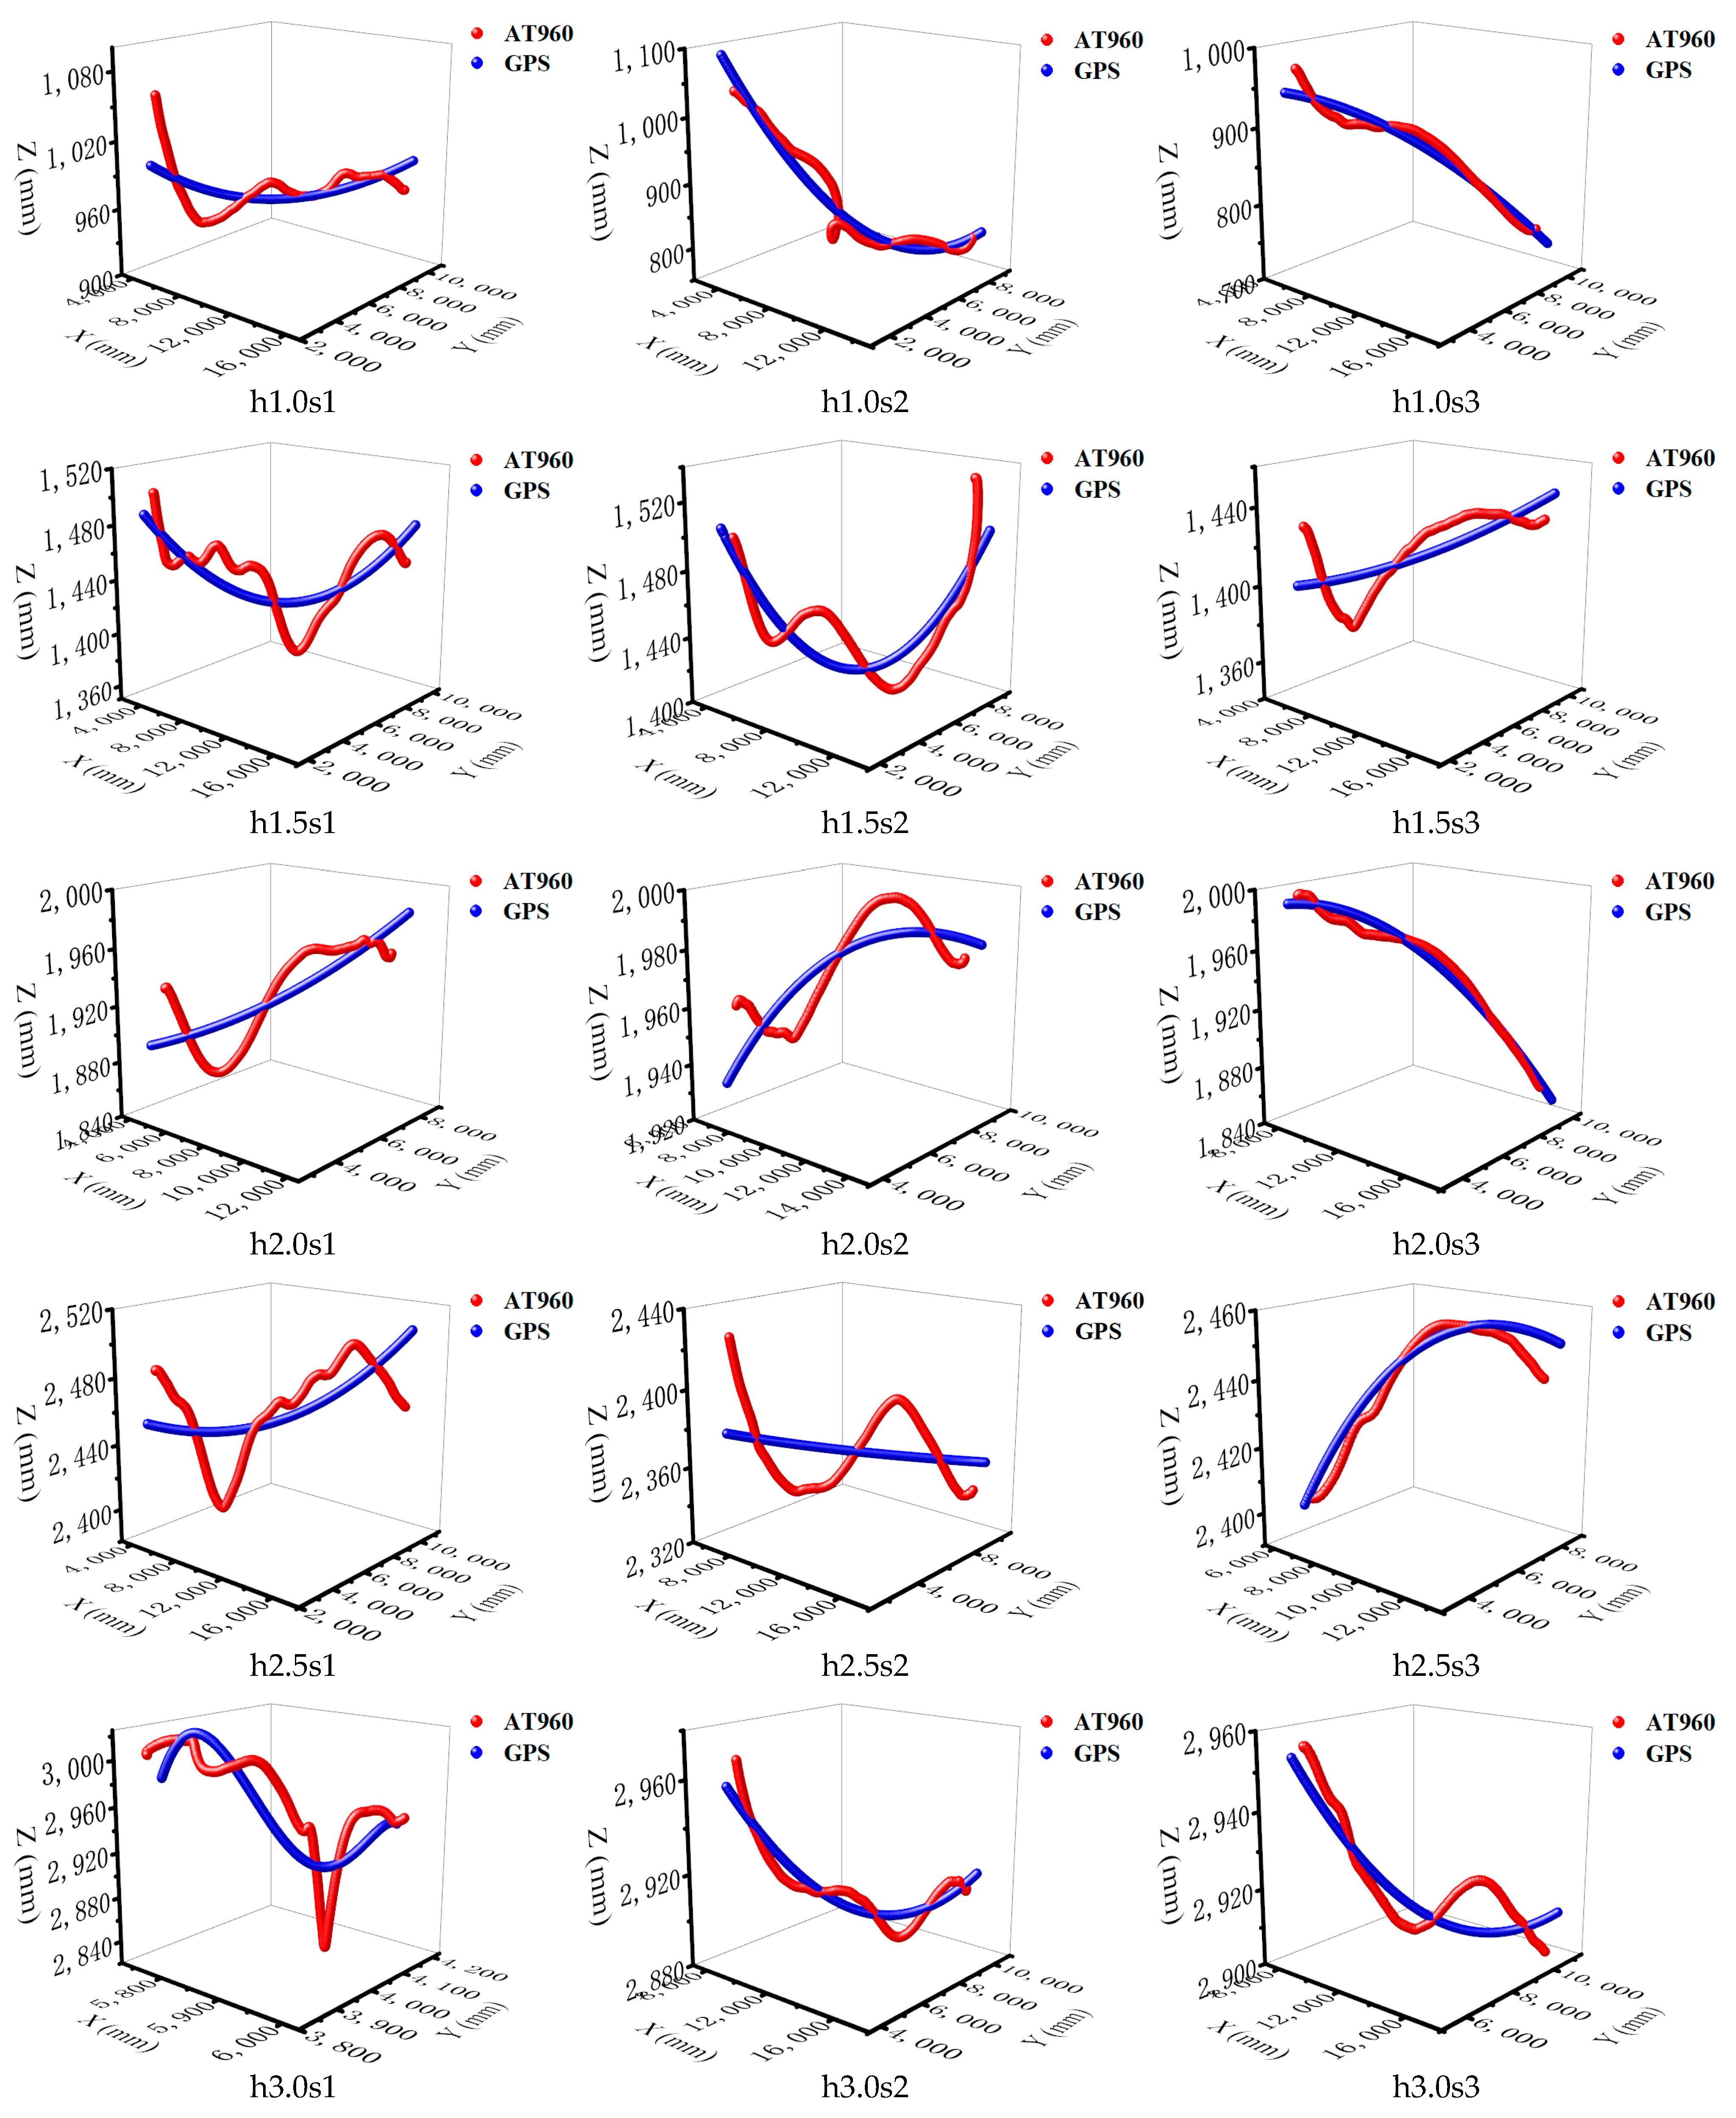
- It is shown in Figure 7 that the flight trajectory of the UAV reflected by the onboard sensor was relatively smooth, while the high-precision flight trajectory obtained by the laser tracker fluctuated greatly, especially for the flight altitude. Further analysis based on Table 4 and Figure 8 shows that the error between the average altitude and the set value obtained by the onboard sensor and laser tracker was less than 15%, and the error range was concentrated in the 5%–8% range.The deviation between the instantaneous flight altitude and the set altitude was relatively large. When the set flight altitude and speed were 1 m and 3 m/s, respectively, the maximum deviation between the altitude measured by the laser tracker and the set value was 245 mm. And at the same flight altitude and speed, the deviation between the altitude measured by onboard sensors and the set value was also the largest, which was 262 mm.
- (2)
- According to the analysis of the altitude consistency index reflecting the actual flight altitude stability, the altitude consistency measured by onboard sensors was the best when the set flight altitude and speed were 2.5 m and 2.0 m/s, respectively, which was 0.20%. The worst was 8.34% when the set flight altitude and speed were 1.0 m and 2.0 m/s, respectively. The results of the laser tracker, which had higher accuracy and were closer to reality, were as follows: the altitude consistency was the best when the flight altitude was 3.0 m and the flight speed was 3.0 m/s, which was 0.50%; the worst was 8.99% when the flight altitude was 1.0 m and the flight speed was 2.0 m/s.Comparing the altitude consistency between the laser tracker and the onboard sensor under the same flight parameters, when the flight altitude and speed were set at 2.0 m and 3.0 m/s, respectively, the deviation was the smallest, at 0.45%. When the flight altitude and speed were set at 2.5 m and 2.5 m/s, respectively, the deviation was the largest, at 76.19%. In the whole experiment, the average deviation of the altitude consistency was 24.95%.
- (3)
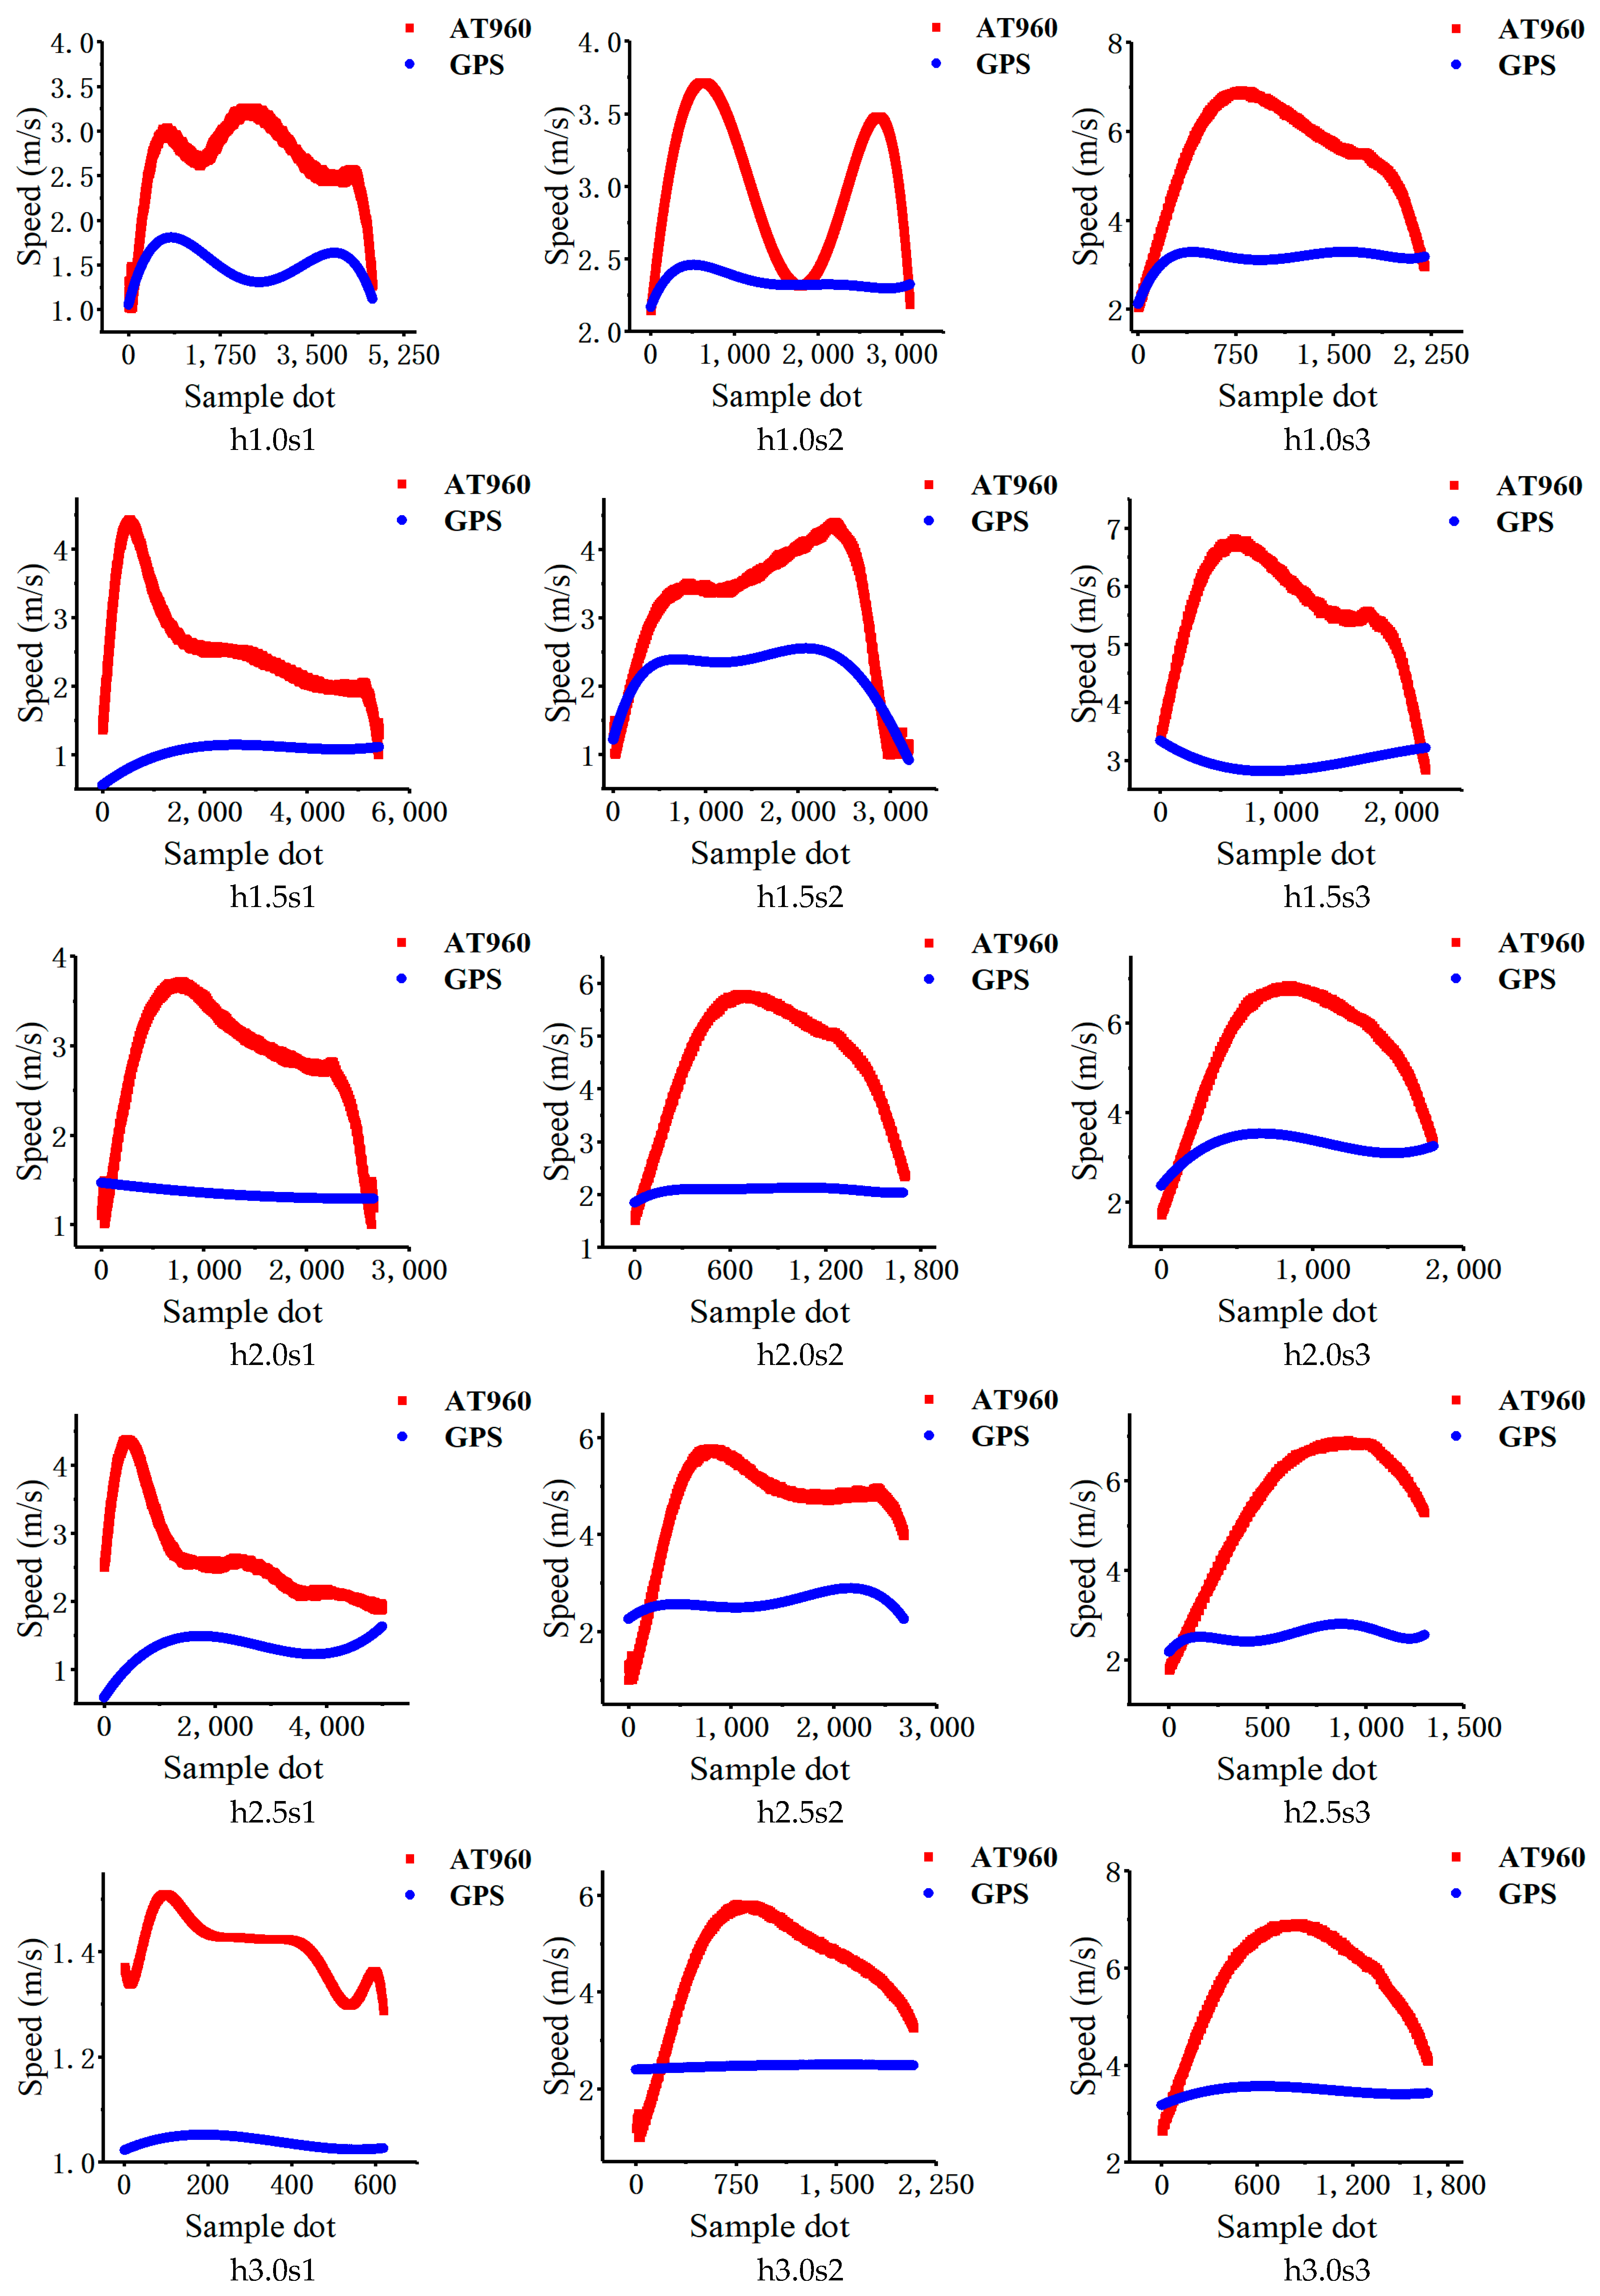
- According to Table 4 and Figure 9, the flight speed curve obtained by the onboard sensors was relatively stable without significant fluctuation, while the high-precision flight speed obtained by the laser tracker fluctuated greatly. The maximum error between the average flight speed measured by onboard sensors and the set value was 52%, the minimum error was 0.7%, and the error was concentrated at 15%. The maximum error between the average flight speed measured by the laser tracker and the set value was 187%, and the minimum error was 41%.
- (4)
- From the analysis of the speed consistency index, which reflects the actual flight speed stability, the speed consistency measured by onboard sensors was the best when the flight altitude was 3.0 m and the flight speed was 1.0 m/s, which was 0.98%. The worst speed consistency measured by onboard sensors was 17.28% when the flight altitude and speed were 1.5 m and 2.0 m/s, respectively. The speed consistency measured by the laser tracker was the best when the flight altitude was 3.0 m and the flight speed was 1.0 m/s, which was 4.01%; when the flight altitude was 1.5 m and the flight speed was 2.0 m/s, the speed consistency measured by the laser tracker was the worst, at 30.14%.Comparing the speed consistency between the laser tracker and onboard sensor under the same flight parameters, it can be seen that when the flight altitude and speed were set to 1.0 m and 1.0 m/s, respectively, the deviation between the two was the smallest, at 33.57%; when the flight altitude and speed were set to 3.0 m and 2.0 m/s, respectively, the deviation between the two was the largest, at 95.42%; in the whole experiment, the average deviation of the speed consistency between the two was 70.02%.
- (5)
- The experimental results show that the current plant protection UAV used the average altitude and speed of onboard sensors to determine whether to reach the set values of operational flight parameters. However, by comparing the real-time data of the laser tracker, it was found that the consistency of flight altitude and speed measured by the onboard sensors was erroneous and tended to stabilize. The flight altitude and speed of the plant protection UAV during operation changed constantly and showed a large deviation from the set value. With regard to the flight speed, there was a huge difference between the speed measured by the laser tracker and the set value. Based on the experimental results, the possible reasons for this situation are as follows.
4. Conclusions
- (1)
- According to the experimental results, the current plant protection UAV used the average altitude and speed of the onboard sensors to judge whether the flight operation parameters reached the set values. Compared with the Leica AT960-LR absolute laser tracker, the flight trajectory, altitude consistency, and speed consistency output from the onboard sensors were erroneous, with a tendency to become smoother and more stable. This may be due to the fact that the onboard sensor sampling frequency (GPS: 10 Hz, MMW: 100 Hz) is lower than that of the laser tracker sampling frequency (1000 Hz) or that the data are filtered and smoothed by the control algorithm of the plant protection UAV. This shows that only using the data from onboard sensors to evaluate the flight parameter quality cannot accurately reflect real flight conditions. The real-time data of the onboard sensor and laser tracker indicate that the flight altitude and speed of the plant protection UAV change constantly during the operation process, and the deviation between the real-time data and the set value was large. Particularly in the flight speed, the deviation between the real-time data measured by the laser tracker and the set value was large, the maximum error was 187%, and the minimum error was 41%.
- (2)
- The maximum difference between the average flight altitude measured by onboard sensors and the laser tracker was only 4.11 mm. However, there was a large gap between the two in flight altitude consistency. The best flight altitude consistency measured by onboard sensors was 0.20%, and the worst was 8.34%. The best flight altitude consistency measured by the laser tracker was 0.50%, and the worst was 8.99%. Under the same flight parameters, the minimum deviation of flight altitude consistency measured by onboard sensors and the laser tracker was 0.45%, the maximum deviation was 76.19%, and the average deviation was 24.95%.
- (3)
- The best flight speed consistency measured by onboard sensors was 0.98%, and the worst was 17.28%. The best flight speed consistency measured by the laser tracker was 4.01%, and the worst was 30.14%. Under the same flight parameters, the minimum deviation of flight speed consistency measured by the onboard sensors and laser tracker was 33.57%, the maximum deviation was 95.42%, and the average deviation was 70.02%.
- (4)
- The experimental results show that only using the data from onboard sensors to evaluate flight parameter quality causes a large error in real flight conditions. This article utilized the high accuracy of the laser tracker to accurately obtain the flight trajectory, altitude, and speed of the plant protection UAV, which can further improve the accuracy of flight parameter quality evaluation. It aimed to provide new ideas for the accurate evaluation of the flight parameter quality of the plant protection UAV and provide data support and guidance for accurate spraying and performance improvement of the plant protection UAV through accurate flight parameter quality evaluation.
Author Contributions
Funding
Institutional Review Board Statement
Informed Consent Statement
Data Availability Statement
Conflicts of Interest
References
- Nan, N. 2020 Plant protection UAV industry development report. China South Agric. Mach. 2021, 52, 1–2. [Google Scholar]
- Cheng, Z.Y. 2020 plant protection UAV industry development report released. China Agric. Prod. News 2021, 7, 16. [Google Scholar]
- Radoglou-Grammatikis, P.; Sarigiannidis, P.; Lagkas, T.; Moscholios, I. A compilation of UAV applications for precision agriculture. Comput. Netw. 2020, 172, 107148. [Google Scholar] [CrossRef]
- Stafford, J.V. Implementing Precision Agriculture in the 21st Century. J. Agric. Eng. Res. 2000, 76, 267–275. [Google Scholar] [CrossRef] [Green Version]
- Da Cunha, J.P.A.R.; Victor, A.P.; Sales, C.G.R. Spray Deposition on Soybean Crop Using Different Travel Speeds and Application Rates. Eng. Agrícola 2018, 38, 82–87. [Google Scholar] [CrossRef]
- Xue, X.Y.; Qin, W.C.; Sun, Z.; Zhang, S.C.; Zhou, L.X.; Wu, P. Effects of N-3 UAV spraying methods on the efficiency of insecticides against planthoppers and Cnaphalocrocis medinalis. Acta Phytophylacica Sin. 2013, 40, 273–278. [Google Scholar] [CrossRef]
- Gao, Y.Y.; Zhang, Y.T.; Zhang, N.; Niu, L.; Zheng, W.W.; Yuan, H.Z. Primary Studies on Spray Droplets Distribution and Control Effects of Aerial Spraying Using Unmanned Aerial Vehicle (UAV) against Wheat Midge. Crops 2013, 2, 139–142. [Google Scholar] [CrossRef]
- Zhang, P.; Lv, Q.; Yi, S.L.; Liu, Y.; He, S.L.; Xie, R.J.; Zheng, Y.Q.; Pan, H.Y.; Deng, L. Evaluation of spraying effect using small unmanned aerial vehicle (UAV) in citrus orchard. J. Fruit Sci. 2016, 33, 34–42. [Google Scholar] [CrossRef]
- Fritz, B.K.; Kirk, I.W.; Hoffmann, W.C.; Martin, D.E.; Hofman, V.L.; Hollingsworth, C.; McMullen, M.; Halley, S. Aerial Application Methods for Increasing Spray Deposition on Wheat Heads. Appl. Eng. Agric. 2006, 22, 357–364. [Google Scholar] [CrossRef]
- Butts, T.R.; Butts, L.E.; Luck, J.D.; Fritz, B.K.; Hoffmann, W.C.; Kruger, G.R. Droplet size and nozzle tip pressure from a pulse-width modulation sprayer. Biosyst. Eng. 2019, 178, 52–69. [Google Scholar] [CrossRef] [Green Version]
- Butts, T.R.; Luck, J.D.; Fritz, B.K.; Hoffmann, W.C.; Kruger, G.R. Evaluation of spray pattern uniformity using three unique analyses as impacted by nozzle, pressure, and pulse-width modulation duty cycle. Pest Manag. Sci. 2019, 75, 1875–1886. [Google Scholar] [CrossRef] [PubMed] [Green Version]
- Lan, Y.; Chen, S. Current status and trends of plant protection UAV and its spraying technology in China. Int. J. Precis. Agric. Aviat. 2018, 1, 1–9. [Google Scholar] [CrossRef]
- Qin, W.-C.; Qiu, B.-J.; Xue, X.-Y.; Chen, C.; Xu, Z.-F.; Zhou, Q.-Q. Droplet deposition and control effect of insecticides sprayed with an unmanned aerial vehicle against plant hoppers. Crop. Prot. 2016, 85, 79–88. [Google Scholar] [CrossRef]
- Zhang, Y.; Li, Y.; He, Y.; Liu, F.; Cen, H.; Fang, H. Near ground platform development to simulate UAV aerial spraying and its spraying test under different conditions. Comput. Electron. Agric. 2018, 148, 8–18. [Google Scholar] [CrossRef]
- Wang, C.L.; Song, J.L.; He, X.K.; Wang, Z.C.; Wang, S.L.; Meng, Y.H. Effect of flight parameters on distribution characteristics of pesticide spraying droplets deposition of plant-protection unmanned aerial vehicle. Trans. Chin. Soc. Agric. Eng. 2017, 33, 109–116. [Google Scholar] [CrossRef]
- Kirk, I.W. Measurement and prediction of atomization parameters from fixed-wing aircraft spray nozzles. Trans. ASABE 2007, 50, 693–703. [Google Scholar] [CrossRef]
- Chen, S.D.; Lan, Y.B.; Li, J.Y.; Zhou, Z.Y.; Jin, J.; Liu, A.M. Effect of spray parameters of small unmanned helicopter on distribution regularity of droplet deposition in hybrid rice canopy. Trans. Chin. Soc. Agric. Eng. 2016, 32, 40–46. [Google Scholar] [CrossRef]
- Kharim, M.N.A.; Wayayok, A.; Shariff, A.R.M.; Abdullah, A.F.; Husin, E.M. Droplet deposition density of organic liquid fertilizer at low altitude UAV aerial spraying in rice cultivation. Comput. Electron. Agric. 2019, 167, 105045. [Google Scholar] [CrossRef]
- Zhang, P.; Deng, L.; Lyu, Q.; He, S.L.; Yi, S.L.; Liu, Y.D.; Yu, Y.X.; Pan, H.Y. Effects of citrus tree-shape and spraying height of small unmanned aerial vehicle on droplet distribution. Int. J. Agric. Biol. Eng. 2016, 9, 45–52. [Google Scholar] [CrossRef]
- Tang, Q.; Zhang, R.; Chen, L.; Deng, W.; Xu, M.; Xu, G.; Li, L.; Hewitt, A. Numerical simulation of the downwash flow field and droplet movement from an unmanned helicopter for crop spraying. Comput. Electron. Agric. 2020, 174, 105468. [Google Scholar] [CrossRef]
- Qiu, B.J.; Wang, L.W.; Cai, D.L.; Wu, J.H.; Ding, G.R.; Guan, X.P. Effects of flight altitude and speed of unmanned helicopter on spray deposition uniform. Trans. Chin. Soc. Agric. Eng. 2013, 29, 25–32. [Google Scholar] [CrossRef]
- Nuyttens, D.; De Schampheleire, M.; Baetens, K.; Sonck, B. The Influence of Operator-Controlled Variables on Spray Drift from Field Crop Sprayers. Trans. ASABE 2007, 50, 1129–1140. [Google Scholar] [CrossRef]
- Chen, S.D.; Lan, Y.B.; Zhou, Z.Y.; Li, J.Y.; Ou, Y.F.; Xu, X.J.; Yao, W.X. Test and evaluation for flight quality of aerial spraying of plant protection UAV. J. South China 2019, 40, 89–96. [Google Scholar] [CrossRef]
- Jin, Y.K.; Xue, X.Y.; Qin, W.C.; Sun, Z. Performance test of electric powered single-rotor UAV for plant protection. J. Chin. Agric. Mech. 2019, 40, 56–61. [Google Scholar] [CrossRef]
- Xu, Y.M.; Zheng, Q.; Guan, X. Precision Analysis of Leica AT960 Absolute Laser Tracker. J. Geomat. 2020, 45, 8–12. [Google Scholar] [CrossRef]
- Ulrich, S.; Jens, H.; Jens-André, P.; Ingo, N. A Framework Based on Reference Data with Superordinate Accuracy for the Quality Analysis of Terrestrial Laser Scanning-Based Multi-Sensor-Systems. Sensors 2017, 17, 1886. [Google Scholar] [CrossRef] [Green Version]


| Device | Parameters | Values | |
|---|---|---|---|
| Leica AT960-LR | Maximum measuring distance L (m) | 160 | |
| Distance accuracy AIFM ɛL (µm·m−1) | 0.5 | ||
| Horizontal rotation angle θH (°) | 0 to 360 | ||
| Vertical rotation angle θV (°) | −145 to +145 | ||
| Angle measurement accuracy ɛθ (µm·m−1) | ±15 + 6 | ||
| Maximum sampling frequency f (Hz) | 1000 | ||
| Working temperature T (°C) | 0 to 40 | ||
| UAV | Physical parameters | Self-weight (kg) | 8 |
| Frame length (mm) | 1200 | ||
| Wingspan length (mm) | 1980 | ||
| Flight parameters | Maximum takeoff weight (kg) | 21.5 | |
| Flight altitude (m) | 0 to 20 | ||
| Flight speed (m·s−1) | 1.0 to 8.0 | ||
| Obstacle avoidance parameters | Obstacle avoidance mode | Hold; Detour | |
| Minimum obstacle diameter (mm) | 30 | ||
| Maximum flight speed (m·s−1) | 3 | ||
| Spray parameters | Medicine box volume (L) | 10 | |
| Spray volume (L·ha−1) | 12 to 18 | ||
| Nozzle type | Solid cone nozzle | ||
| Spray span (m) | 3 to 5 | ||
| Combination Code | Altitude (m) | Speed (m·s−1) |
|---|---|---|
| h1.0s1 | 1.0 | 1 |
| h1.0s2 | 1.0 | 2 |
| h1.0s3 | 1.0 | 3 |
| h1.5s1 | 1.5 | 1 |
| h1.5s2 | 1.5 | 2 |
| h1.5s3 | 1.5 | 3 |
| h2.0s1 | 2.0 | 1 |
| h2.0s2 | 2.0 | 2 |
| h2.0s3 | 2.0 | 3 |
| h2.5s1 | 2.5 | 1 |
| h2.5s2 | 2.5 | 2 |
| h2.5s3 | 2.5 | 3 |
| h3.0s1 | 3.0 | 1 |
| h3.0s2 | 3.0 | 2 |
| h3.0s3 | 3.0 | 3 |
| Device | Parameters | Values |
|---|---|---|
| GPS (JS-AD56UB8) | Positioning accuracy (m) | 2.5 (Without SBAS); 2 (SBAS) |
| Sampling frequency (Hz) | 10 | |
| Receiver type | GPS; SBAS; QZSS; GLONASS; BDS | |
| Start time (s) | 29 (Cold); 1 (Hot) | |
| Velocity accuracy (m·s−1) | 0.1 | |
| MMW radar (Landing AG50) | Distance range (m) | 0.5 to 50 |
| Distance accuracy (m) | 0.1 | |
| Angle range (°) | 43 (Horizontal); 30 (Vertical) | |
| MMW frequency (GHz) | 24 to 24.25 | |
| Sampling frequency (Hz) | 100 |
| Parameters | Average Altitude (mm) | Error from Set Altitude (%) | Average Speed (m·s−1) | Error from Set Speed (%) | Altitude Consistency (%) | Speed Consistency (%) | ||||||
|---|---|---|---|---|---|---|---|---|---|---|---|---|
| AT960 | Airborne Sensor | AT960 | Airborne Sensor | AT960 | Airborne Sensor | AT960 | Airborne Sensor | AT960 | Airborne Sensor | AT960 | Airborne Sensor | |
| h1.0s1 | 974.19 | 975.45 | 2.6 | 2.5 | 2.69 | 1.52 | 169.0 | 52.0 | 2.02 | 0.95 | 16.95 | 11.26 |
| h1.0s2 | 868.39 | 868.93 | 13.2 | 13.1 | 3.01 | 2.35 | 50.5 | 17.5 | 8.99 | 8.34 | 15.57 | 2.37 |
| h1.0s3 | 861.42 | 861.17 | 13.9 | 13.9 | 5.50 | 3.16 | 83.3 | 5.3 | 7.22 | 6.96 | 21.58 | 5.77 |
| h1.5s1 | 1441.42 | 1439.39 | 5.9 | 6.1 | 2.58 | 1.04 | 158.0 | 4.0 | 1.82 | 1.16 | 27.10 | 13.17 |
| h1.5s2 | 1450.88 | 1448.60 | 4.9 | 5.1 | 3.19 | 2.21 | 59.5 | 10.5 | 2.12 | 1.63 | 30.14 | 17.28 |
| h1.5s3 | 1416.14 | 1416.04 | 8.4 | 8.4 | 5.59 | 2.98 | 86.3 | 0.7 | 1.30 | 0.92 | 16.19 | 4.73 |
| h2.0s1 | 1930.57 | 1929.17 | 6.9 | 7.1 | 2.87 | 1.35 | 187.0 | 35.0 | 1.65 | 1.28 | 22.66 | 3.98 |
| h2.0s2 | 1972.80 | 1972.38 | 2.7 | 2.8 | 4.60 | 2.08 | 130.0 | 4.0 | 0.82 | 0.71 | 24.12 | 2.47 |
| h2.0s3 | 1940.41 | 1941.08 | 6.0 | 5.9 | 5.46 | 3.24 | 82.0 | 8.0 | 2.21 | 2.22 | 24.36 | 7.58 |
| h2.5s1 | 2458.06 | 2458.75 | 4.2 | 4.1 | 2.65 | 1.31 | 165.0 | 31.0 | 1.09 | 0.57 | 25.00 | 14.37 |
| h2.5s2 | 2362.02 | 2364.11 | 13.8 | 13.6 | 4.66 | 2.62 | 133.0 | 31.0 | 0.84 | 0.20 | 22.09 | 5.96 |
| h2.5s3 | 2440.33 | 2444.44 | 6.0 | 5.6 | 5.53 | 2.56 | 84.3 | 14.7 | 0.62 | 0.54 | 26.33 | 5.49 |
| h3.0s1 | 2950.64 | 2948.52 | 4.9 | 5.1 | 1.41 | 1.04 | 41.0 | 4.0 | 1.78 | 1.33 | 4.01 | 0.98 |
| h3.0s2 | 2913.17 | 2913.87 | 8.7 | 8.6 | 4.52 | 2.48 | 126.0 | 24.0 | 0.53 | 0.48 | 25.97 | 1.19 |
| h3.0s3 | 2919.64 | 2917.45 | 8.0 | 8.3 | 5.75 | 3.46 | 91.7 | 15.3 | 0.50 | 0.43 | 18.96 | 2.45 |
Publisher’s Note: MDPI stays neutral with regard to jurisdictional claims in published maps and institutional affiliations. |
© 2021 by the authors. Licensee MDPI, Basel, Switzerland. This article is an open access article distributed under the terms and conditions of the Creative Commons Attribution (CC BY) license (https://creativecommons.org/licenses/by/4.0/).
Share and Cite
Huang, X.; Dong, X.; Ma, J.; Liu, K.; Ahmed, S.; Lin, J.; Ahmad, F.; Qiu, B. Evaluation and Experiment of Flight Parameter Quality of the Plant Protection UAV Based on Laser Tracker. Agriculture 2021, 11, 628. https://0-doi-org.brum.beds.ac.uk/10.3390/agriculture11070628
Huang X, Dong X, Ma J, Liu K, Ahmed S, Lin J, Ahmad F, Qiu B. Evaluation and Experiment of Flight Parameter Quality of the Plant Protection UAV Based on Laser Tracker. Agriculture. 2021; 11(7):628. https://0-doi-org.brum.beds.ac.uk/10.3390/agriculture11070628
Chicago/Turabian StyleHuang, Xin, Xiaoya Dong, Jing Ma, Kuan Liu, Shibbir Ahmed, Jinlong Lin, Fiaz Ahmad, and Baijing Qiu. 2021. "Evaluation and Experiment of Flight Parameter Quality of the Plant Protection UAV Based on Laser Tracker" Agriculture 11, no. 7: 628. https://0-doi-org.brum.beds.ac.uk/10.3390/agriculture11070628