
Production Costs and Benefits of Japonica Rice in Mwea, Kenya


1
Japan International Research Center for Agricultural Sciences, Tsukuba 305-8686, Ibaraki, Japan
2
The United Graduate School of Agricultural Sciences, Gifu University, Gifu-City 501-1193, Gifu, Japan
3
Takenaka Civil Engineering & Construction Co., Ltd., Koto, Tokyo 136-8570, Japan
4
Faculty of Applied Biological Sciences, Gifu University, Gifu-City 501-1193, Gifu, Japan
*
Author to whom correspondence should be addressed.
Agriculture 2021, 11(7), 629; https://0-doi-org.brum.beds.ac.uk/10.3390/agriculture11070629
Submission received: 27 May 2021
/
Revised: 27 June 2021
/
Accepted: 1 July 2021
/
Published: 5 July 2021
Abstract
:From the perspective of national food security, strengthening domestic rice production is an urgent issue for Kenya. For this purpose, it is helpful to consider varieties that generate novel and competitive values different from those of conventional varieties. Recently, domestic japonica rice, which is now being distributed, has become an attractive variety with a high market price and its production is expected to increase. Although it is competitive and promising as a crop for small-scale farmers, the production stage costs and benefits are not clear. Thus, a study was conducted to perform a cost–benefit analysis of japonica rice in comparison to conventional rice at the production stage and evaluate strategies for strengthening the domestic production of rice. We conducted an experimental cultivation of japonica rice in the Mwea region, Kenya, where japonica rice is produced. As a result, although production costs for japonica rice are higher than costs for conventional varieties (24.46 KSh/kg versus 22.63 KSh/kg), when a high-yielding variety is grown (6.44 tons/ha for japonica rice compared to 6.07 tons/ha for conventional rice), a larger net profit can be obtained (65.54 KSh/kg versus 32.37 KSh/kg). We believe that initiatives to improve difficulties at the production stage would make the production of both japonica rice and conventional rice more economically viable and facilitate strengthening of the overall domestic rice production.
1. Introduction
After maize and wheat, rice is Kenya’s most important grain and has become an important staple food in urban areas. In 2008, the year-over-year rate of increase in annual rice consumption was 12%, in comparison with 4% for wheat and 1% for maize, the nationwide staples [1,2,3]. Although the crop acreage, unit yield, and total volume of production of rice have trended sideways since 2012, the volume of rice imports increased by approximately 60% between 2012 and 2019, which is consistent with the increased consumption; the quantity of rice grown in 2019 was 80,000 tons, and the consumption was 710,000 tons [4]. Rice consumption in Kenya is thus over-reliant on the international market, a fact that has significant implications for national food security [2]. Increasing domestic rice production could play an important role in closing the gap between the volume of production and the volume of consumption and in improving national food security [5].
According to Atera et al. (2018), to strengthen Kenyan domestic rice production and improve food security, it is necessary to promote awareness of high-quality competitive varieties that generate novel value different from the value of conventional varieties. The main challenges for the domestic rice value chain in Kenya are a lack of water for irrigation, inefficient water management, poor land productivity, high input costs, machinery shortages, damage by birds, low-quality seedlings/seeds, difficulties in delivering grain from farms to mills, and inefficient agriculture with high production costs due to the circumstance that most relevant activities are performed manually [2,5]. Many of these challenges are within the production stages of the value chain.
According to Mwangi (2017), the conventional variety BW390 is a high-yielding variety with a low market price, Basmati 370 is low-yielding variety with a high market price, and the new variety NERICA is not suitable for cultivation in irrigated areas and has a low market price. Currently, domestic japonica rice (hereinafter, japonica rice) is eaten by the Asian community in Nairobi. Although it is non-aromatic and has a low yield, it has a higher market price than basmati rice (the exact price was not available), and thus is an attractive variety whose production volume is forecast to increase in the future [6]. This suggests that japonica rice is highly profitable and competitive, making it a promising crop for small-scale farmers. According to Ndirangu et al. (2019), the costs of production in irrigated and lowland areas of Kenya are 22.9 KSh/kg and 13.3 KSh/kg (on an unprocessed basis), respectively. Here, KSh (the Kenyan shilling) is the local currency, and one KSh is roughly equivalent to 0.00966 USD. However, there are no reports on the production costs and benefits of japonica rice.
In this study, to examine whether it would it be beneficial to recommend japonica rice, a promising variety that can create new value different from the value of conventional rice, and thus contribute to strengthening the domestic rice production, we analyzed and evaluated the production stage costs and benefits of japonica rice, compared them to those of conventional rice, and evaluated the future potential of japonica rice production.
2. Materials and Methods
2.1. Study Area
The Mwea region, which was targeted for this study, is located 100 km north of the capital of Kenya, Nairobi, and is a flat area extending to the south of Mount Kenya, the nation’s highest mountain (5199 m). With an altitude of approximately 1159 m, the Mwea region has an average annual temperature of ~22 °C and an average annual rainfall of ~930 mm [7]. The local climate is tropical, with two rainy seasons: a long rainy season from March to May and short season from October to November [8]. Most of the fields in the Mwea region are covered by Vertisols [9], black, heavy clay soils popularly known as “black cotton soil” [10]. Figure 1 shows the locations of Nairobi and the Mwea region.
The Mwea Irrigation Scheme is the largest irrigation zone in Kenya in terms of area. However, the aging of irrigation facilities and the outward expansion of paddy fields through the voluntary cultivation of farmers have caused serious shortages of irrigation water supply. A new Yen loan project involving facility improvements to promote irrigation development with the intention of increasing the total crop acreage from 7860 ha to 16,920 ha has been in place since 2017 [11]. The main growing season for rice in the Mwea region is July to December, but the absolute shortage of irrigation water has resulted in three cropping groups: from July to December, September to February, and November to April. A total of 86% of all domestically grown rice is produced within the Mwea Irrigation Scheme and, notably, 95% of all domestically grown basmati rice is produced within it [5]. Basmati 370 is the most popular variety in the Mwea region [12], and 87.7% of the harvested Basmati 370 is made available for sale [13]. Henceforth, in this paper, the term “conventional rice” refers to Basmati 370. In addition to rice, some farmers produce tomatoes, mung beans, and kale as a double crop.
2.2. Japonica Rice Production Stage Cost and Benefit Calculation
The available japonica rice was cultivated at the Mwea Irrigation Agricultural Development Centre (MIAD), which was established with support from Japan. Seeds were selected and propagated under the direction of the Japan International Cooperation Agency technical support project RiceMAPP (Rice-Based and Market-Oriented Agriculture Promotion Project).
Experimental cultivation was carried out at the MIAD test farm. The varieties used were the S1 and S2 koshihikari strains chosen by RiceMAPP. The S1 variety matures later and has a higher yield than the S2 variety. These japonica rice seeds were submitted for variety certification by the Kenya Plant Health Inspectorate Service, but the certification has not yet been granted. In Kenya, japonica rice is produced only by MIAD. All japonica rice grown during that crop season was sampled. In accordance with guidelines produced by RiceMAPP, triple superphosphate and muriate of potash were used for basal fertilization and ammonium sulfate was used as top dressing [14]. The fertilizer was manually spread on the field surface. The nitrogen, phosphoric acid, and potassium input for the combined basal fertilization and top dressing were 31.5, 34.5, and 45.0 kg/ha, respectively.
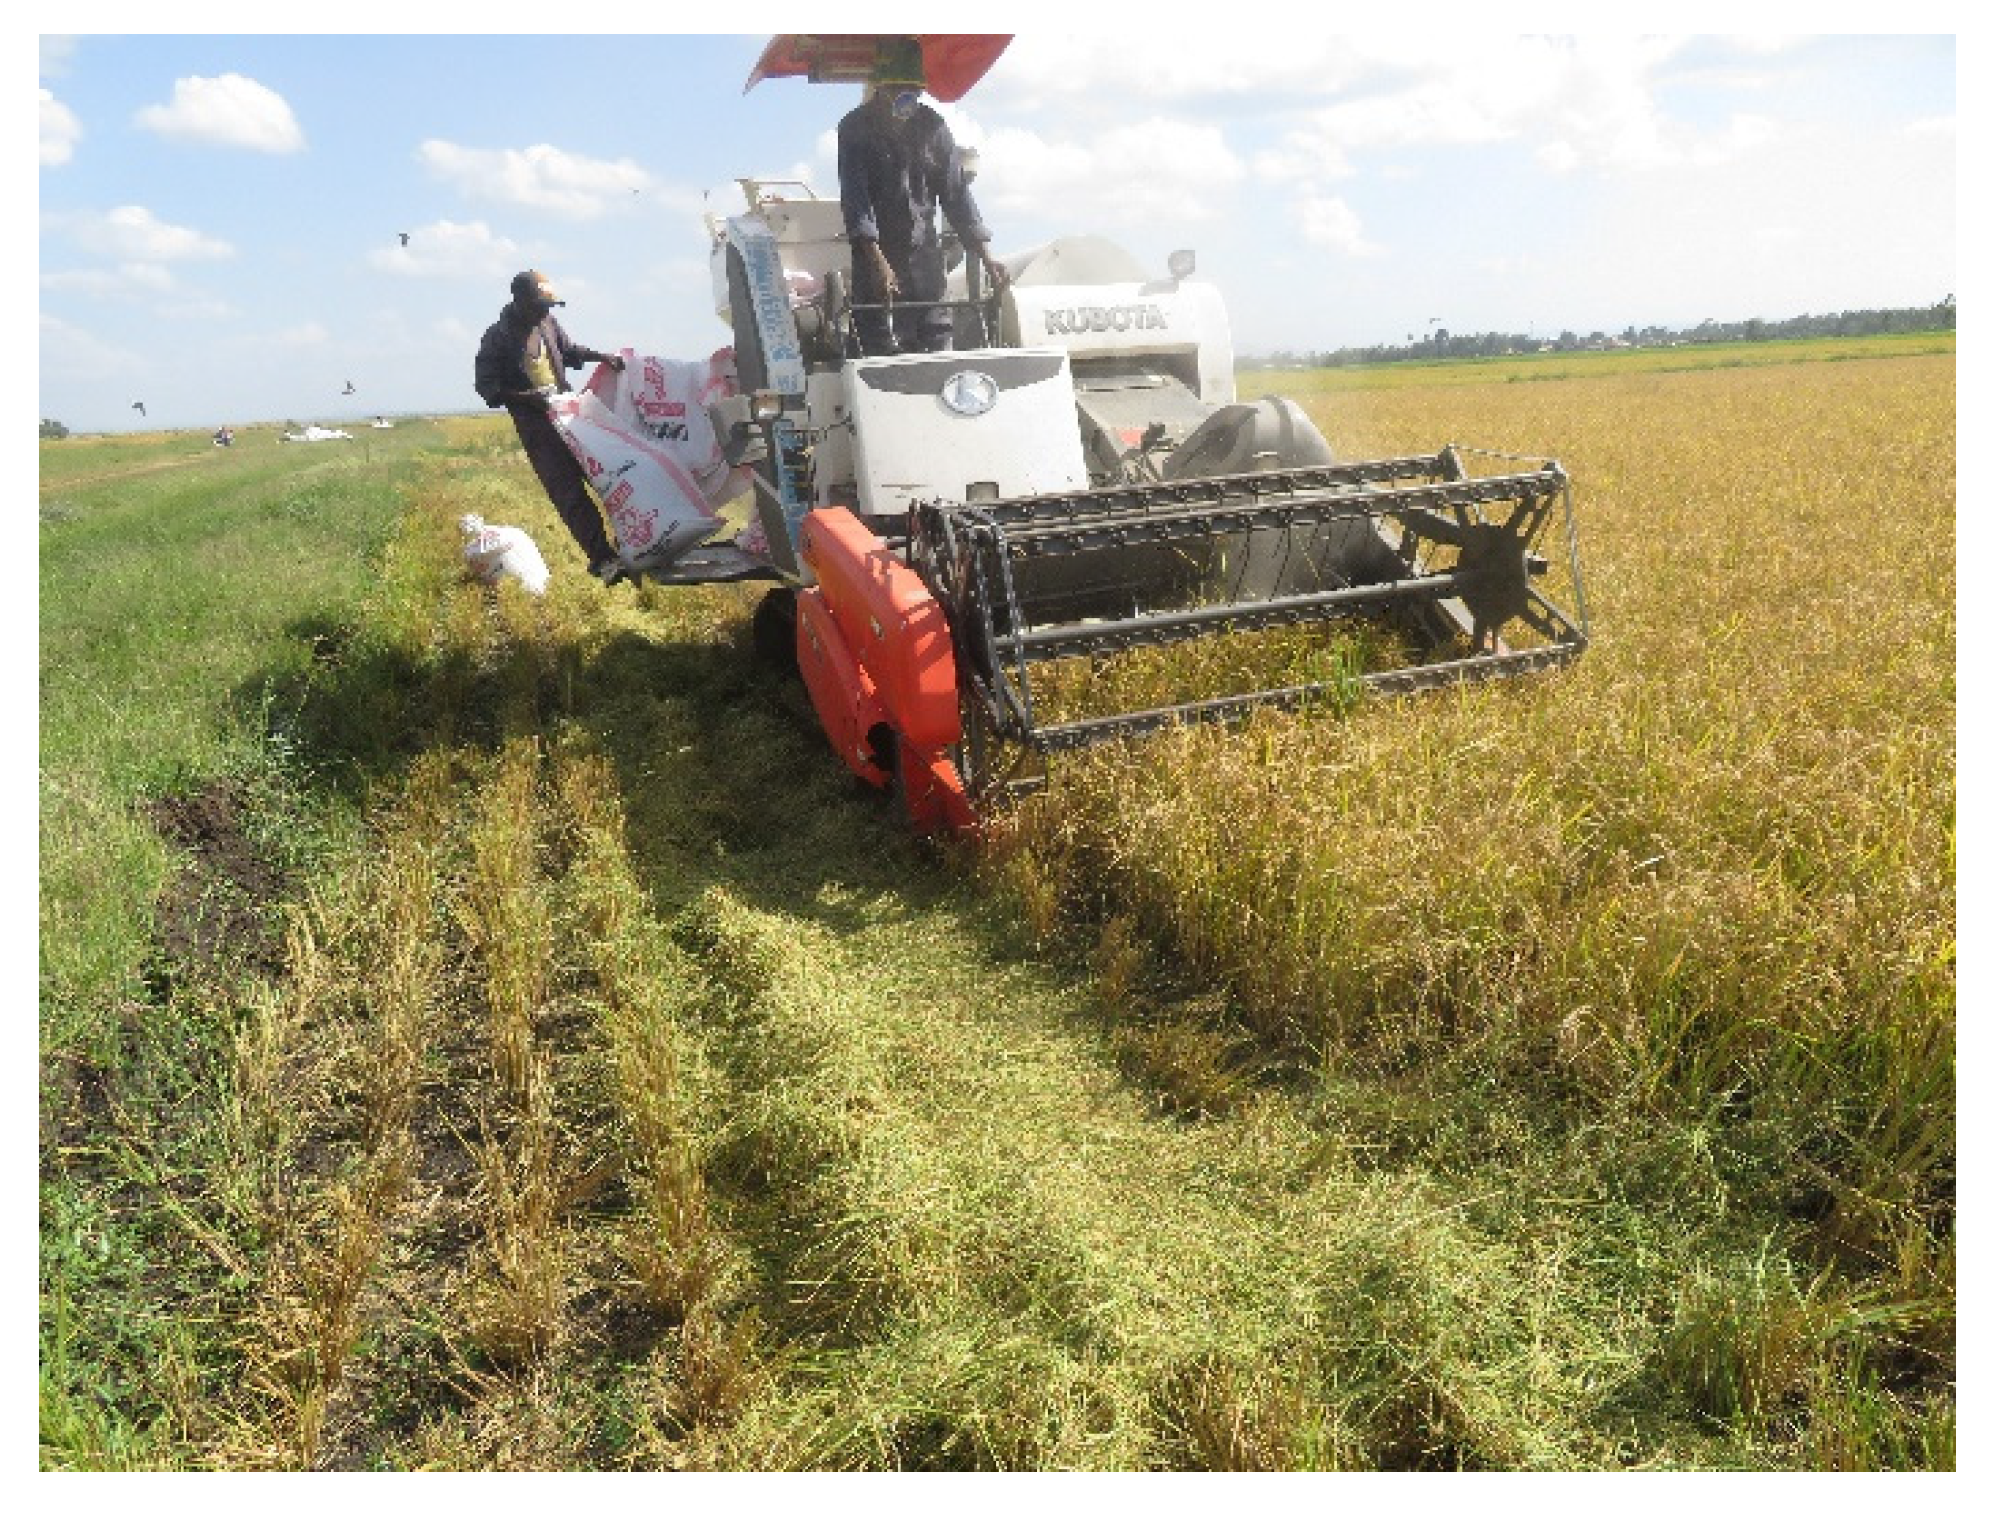
The area of experimental cultivation was divided into six plots, three for S1 and three for S2, each with an average area of 0.33 ha. The cultivation methods were consistent with MIAD’s normal practices. From 19 June 2017, the growing area was filled with water, tilled using a tractor (New Holland TD80) towing a rotavator, leveled using a draft animal (in some cases, leveled manually), and harrowed manually. During the leveling, seed beds were created in some plots, and S1 and S2 were sown on 15 July. After manual transplantation in a grid pattern (30 cm × 15 cm cells) in the S1 experimental plot from 7–12 August and in the S2 experimental plot from 10–17 August, supplementary planting was carried out as required. For both S1 and S2, manual application of basal fertilizer was done on 18 and 19 August, and application of the top dressing was performed on 27 September. Irrigation was started after transplanting and continued until the flowering stage in early October, because the period from June to September has little rainfall. The irrigation water, transported by irrigation canals, was managed by MIAD staff on the MIAD test farm. Pesticide application, weeding, levee repair, water channel cleaning, and night irrigation were carried out manually, as appropriate. Birds were continuously scared away from the S1 plot for 52 days from 23 October to 13 December (the day before harvest), and from the S2 plot for 63 days, from 3 October to 4 December (the day before harvest). In principle, one scarer was posted at each plot, but the number was adjusted according to the number of birds; two scarers were posted at each plot from 6 to 22 October owing to a tremendous increase in the number of birds, but only one scarer per two or three plots was used from 15 November to 4 December. Harvesting, performed using a combine harvester (Kubota DC70), was carried out on 14 December at S1 and 5 December at S2 (Figure 2). The total yield of the S1 and S2 plots was measured using the crop weight after drying. After harvesting, threshing, sorting, and bagging at the test farm, the rice was moved to another location within the MIAD site, where it was dried naturally in the sun and stored in a warehouse.
For each plot, the tasks carried out, number of workers, and quantities of fertilizer and pesticide used were logged daily. All relevant tasks were performed by hired laborers. The tasks included land preparation (flooding, levee formation, water channel cleaning, leveling by draft animal, manual leveling, and manual harrowing), seedbed preparation, transplantation, application of pesticides, replanting, application of fertilizer, weeding, maintenance and other costs (bird scaring, levee repair, water channel cleaning, and night irrigation), and harvesting (harvesting, sorting, threshing, bagging, transporting, drying, and storage). A record was also kept of the purchase quantity, purchase price, and date of purchase for each input material. These materials included seeds, fertilizers, pesticide, bags, and twine. The records were created by MIAD staff.
Costs for materials were calculated by multiplying the per-unit purchase price of fertilizers, pesticide, bags, and twine by the quantity of input per unit of area. The seeds used belonged to MIAD, and the unit price was set at the same level as the price of conventional rice. For the service charge for use of agricultural machinery, the fee per unit of area was used. The cost of labor was determined by calculating the labor needed (in man-days) per unit area for each task and then multiplying this by the daily labor rate (350 KSh, approximately 3.4 USD). For pesticide application, the unit price per unit area was used. When a task item was composed of multiple tasks, the cost of labor was calculated using the labor needed per unit area for each component task. For the task of leveling the land by draft animal and the task of flooding the land (included in land preparation), the unit price per unit area was used. For the task of bagging (included in harvesting), the unit price per bag was used.
In addition, interviews were conducted with six farmers on 19 and 20 October 2016 to determine the average production costs of conventional rice as a reference for japonica rice. The cultivation method used for conventional rice was based on the conventional method used in the Mwea region, which was almost identical to the method used by MIAD to grow japonica rice. However, the types of fertilizer and pesticide used differed from those used in the cultivation of japonica rice, and di-ammonium phosphate and ammonium sulfate were used in conventional rice cultivation. The volume of nitrogen and phosphorus inputs for the combined basal fertilization and top dressing used in the cultivation of conventional rice were 48.8 and 57.7 kg/ha, respectively. The tasks carried out by hired laborers included land preparation (leveling by draft animal, manual harrowing), seedbed preparation, transplantation, application of pesticides, replanting, application of fertilizer, weeding, maintenance and other costs (bird scaring, operation and management of water channels including irrigation facility maintenance, and management fees paid by famers as compensation for the use of irrigation water), and harvesting (harvesting, sorting, threshing, bagging, and transporting). Harvested rice was bagged, transported to the farmer’s home, and then sold to a broker. The materials input were considered to include seeds, fertilizers, pesticide, and bags. The conventional rice seed was produced by and purchased from MIAD, as was the japonica rice seed.
The cost of materials was calculated by multiplying the per-unit purchase price of seeds, fertilizers, pesticide, and bags by the input quantity per unit area. For the service charge for use of agricultural machinery, the fee per unit area was used. The cost of labor was determined by multiplying the daily unit cost of labor of 350 Ksh (3.4 USD) by the labor needed per unit area for tasks performed by hired laborers. For the tasks of leveling by draft animal (included in land preparation), preparing the seedbeds, bird scaring, and operation and management of water channels, the unit price per unit area was used.
3. Results and Discussion
3.1. Experimental Cultivation of Japonica Rice
3.1.1. Total Yield and Unit Yield
Table 1 shows the total yield and unit yield of japonica rice for each experimental plot. The total yield was measured on a dry weight basis, and the unit yield was determined on an unprocessed basis. The total yield for the 1.97 ha area was 10.07 tons, and the average unit yield for the area of experimental cultivation was 5.11 tons/ha. This unit yield was approximately 16% lower than the 6.07 tons/ha average for Kenya (2017 unit yield) [4]. The average unit yields for S1 and S2 were 6.44 tons/ha and 3.77 tons/ha, respectively. A t-test performed on the average yields for the S1 and S2 plots confirmed a significant difference (p < 0.05). One of the reasons for the difference in monoculture yields was that S2 was damaged more extensively by birds. An analysis on the bird damage is provided later in this paper. According to a RiceMAPP report, with a total nitrogen input (basal fertilization and top dressing combined) of 84 kg/ha, unit yields for S1 and S2 (using a 1-m2 sampling) were 9.06 tons/ha and 7.42 tons/ha, respectively, and as in our investigation, S1 produced a higher total yield than S2 [15].
3.1.2. Production Stage Cost–Benefit Analysis
All six conventional rice growers who were interviewed used irrigation water and produced only basmati rice. Their average yield (on an unprocessed basis) was 6.00 ton/ha. The seeds were procured from MIAD, and the rice produced was either consumed by the farmers’ households or sold to a broker at 55 KSh/kg. The price of 55 KSh/kg of conventional rice is the broker’s purchase price, which is lower than the purchase price of the rice mill. Farmers lack the means to transport their rice to a rice mill, so they sell it to a broker who comes to the farmer and purchases it for cash at a lower price.
Table 2 shows the production costs per unit production volume (kg) for japonica and conventional rice. The gross profit was considered to be the sale price of unprocessed rice. The sale price of unprocessed japonica rice, according to MIAD, was 90 KSh/kg, and the sale price of conventional rice, obtained from farmers, was 55 KSh/kg. The average yields of japonica rice for S1 and S2, which were obtained from the experimental cultivation of japonica rice, were 6.44 and 3.77 tons/ha, respectively. The average yield of rice in Kenya in 2017 was 6.07 tons/ha [4]. As 86% of Kenya’s rice is produced in the Mwea Irrigation Scheme and Basmati 370 is the most popular variety in the region, 6.07 tons/ha and 55 KSh/kg can serve as the representative conventional rice yield and sale price, respectively. Production costs comprise materials’ costs and labor costs. Furthermore, the unit yield of 6.07 tons/ha for conventional rice was a United States Agency for International Development statistic and only provides a single unit yield for the whole country of Kenya. Therefore, a comparator with the japonica rice yield was unfortunately not available for assessment of statistical significance. The soil in the Mwea region is black cotton soil, which becomes very hard when it dries; therefore, during the land preparation stage, tillage was done with rotavators, followed by leveling with an animal. Threshing was done in the portion of the field harvested by combine harvesters, and loading was done where the combine harvesters entered and exited the field. There was no significant difference of these production environments between japonica rice and conventional rice. On the other hand, as shown in Table 1, three plots of japonica rice for each of S1 and S2 were established, and the unit yields were different. Although there was no difference in the production environment, as described above, the distance to the canal and the condition of the canal may have caused the difference in unit yield. The same can be said about the relationship between japonica rice and conventional rice. In this case, the comparison of the yield of conventional rice to the yield of japonica rice was based on yield data of the whole country, making it less sensitive to the production environment, such as the distance to the canal. The production costs per unit production volume were calculated by dividing the production cost per unit of area by the average unit yield. Additionally, as the average unit yields of S1 and S2 japonica rice differed, as shown in Table 1, data for both were included.
The production costs for S1 were approximately 6 KSh/kg higher than the costs for conventional rice, but the net profit was approximately 29 KSh/kg higher. The labor costs accounted for 67% of the S1 production costs, but they accounted for only 57% of the conventional rice production costs. The S2 production cost was 35 KSh/kg higher than the production cost for conventional rice, and the S2 net profit was slightly higher than the net profit from conventional rice. Labor costs accounted for more than 70% of the S2 production costs. In neighboring Tanzania, for farmers with paddy-field rice acreage of 0.4–0.6 ha, when reliance on hired labor was 60% or higher, the labor costs accounted for 59–72% of the production costs [16], a similar level to the labor cost weighting found in this study. The production cost of conventional rice was consistent with the cost of 22.9 KSh/kg reported by Ndirangu et al. (2019). The sale price for producers was higher for japonica rice, at 90 KSh/kg, than for conventional rice, at 55 KSh/kg, which was consistent with the report by Mwangi (2017).
Table 3 shows the breakdown of materials’ costs, which are included in production costs, for japonica and conventional rice. For both of these, the agricultural machinery service charges accounted for the greatest proportion of the costs, at 37% and 42%, respectively. The relevant agricultural machinery comprised tractors and combine harvesters. Farmers paid agricultural machinery service charges to owners of individual machinery or to the Mwea Rice Growers Multi-Purpose Co-op Society (MRGM), which uses tractors to till the land (as part of land preparation) and combine harvesters to reap the crop at harvest time. The MRGM, which provides services to members related to rice production, processing, and sales, is the largest growers’ cooperative in the Mwea region. It is conceivable that the shortage of such machines (Atera et al., 2018) is contributing to excessive demand and a situation in which the levels of agricultural machinery service charges are unlikely to decrease. Government and aid agency investment support is needed to increase the amount of agricultural machinery available. In the case of Tanzania, the weighting of tractor service charges (i.e., not including combine harvester fees) within the materials costs is 16–34% for farmers whose reliance on hired labor is 60% or more and 26–52% for those whose reliance is less than 60% [16]. In our study, the weighting of labor costs within the production costs for japonica rice (which are high at approximately 70%) was compared with weighting for conventional rice (57%). Furthermore, while the weighting of agricultural machinery service charges within the materials costs was 37% for japonica rice, it was 42% for conventional rice. This result revealed the same trend that exists in the case of Tanzania, where a lower reliance on hired labor leads to a higher weighting of agricultural machinery services within production costs. Table 4 shows the breakdown of labor costs, which are included in production costs, for japonica rice and conventional rice.
For japonica rice, the weighting of “maintenance and other costs” was much higher than the weightings of the other items (40% for S1 and 52% for S2 in contrast to 16% for conventional rice). The items with the next-highest weightings were land preparation, transplantation, and weeding. By contrast, weeding had the highest weighting for conventional rice, followed by transplantation, maintenance and other costs, and land preparation. In the study on Tanzania, tasks undertaken by hired laborers were categorized into five groups: harrowing (equivalent to land preparation), rice planting (transplantation), weeding, bird scaring, and harvesting. These groups respectively accounted for the following proportions of time spent on supervision of hired laborers: 25%, 25%, 12%, 25%, and 13% [16]. These groups match the task items with a high labor cost weighting in our study for japonica and conventional rice. It is thus possible that this is a trend of hired labor that is common to the East African region. It is conceivable that harvesting accounts for a higher proportion of the hired labor costs in the Tanzanian example because harvesting there is carried out manually. For japonica rice, the weighting of maintenance and other costs, which include bird scaring, as mentioned earlier, is much higher than in the case of Tanzania. Interviews with farmers growing conventional rice indicated that wages for hired laborers were rising because young people were choosing to work in other industries, such as transportation, or were moving to cities and because of an increase in the cost of living. Given that labor costs account for 60–70% of production costs, the increase in wages for hired laborers is expected to have a significant influence on production costs in the future.
Table 5 shows the breakdown of maintenance and other costs within labor costs. A comparison of labor costs related to bird scaring for S1, S2, and conventional rice showed that the costs for S1 and S2 were approximately 6 KSh/kg and 19 KSh/k higher than those of conventional rice, respectively, and accounted for 84% and 90%, respectively, of the costs related to maintenance and other costs, proportions that are significantly higher than the 40% for conventional rice. Labor costs other than costs for bird scaring within maintenance and other costs did not differ significantly among S1 (1.19 KSh/kg), S2 (2.05 KSh/kg), and conventional rice (1.25 KSh/kg).
Damage caused by birds, such as the Quelea quelea and weaver, represents a major challenge for farmers in the Mwae region [3,5], and bird scaring accounts for the highest proportion of labor costs in the region. One person is needed for each 0.2–0.8 ha for approximately six weeks preceding harvest [13]. In our experimental cultivation of japonica rice, bird scarers were employed for approximately 20% longer in the S1 plot and approximately 40% longer in the S2 plot than described in the report by Kihoro et al. (2013), and two people were posted at each plot (0.33 ha) for 17 days. Considering that the MIAD staff also reported a relatively large number of birds, it is possible that there were more birds than normal during our study period. As mentioned previously, our unit yields were lower than the yields reported by RiceMAPP, implying that bird damage was sustained and that it was worse in the S2 plot. Differences in the bird preference by variety, such as those reported for sorghum production [17], may also affect japonica rice. Furthermore, as mentioned in the Materials and Methods section, different methods were used to calculate labor costs associated with bird scaring for japonica rice and conventional rice. For conventional rice, the unit labor cost for bird scarers for a whole growing season was set at 2000 KSh (19.3 USD) per unit area. The level at which this unit labor cost is set has a significant influence on the labor costs related to bird scaring.
Table 6 shows the production costs calculated on the assumption that the bird scaring unit labor cost for japonica rice is the same as the cost for conventional rice. The bird scaring input volume was assumed to be at the same level as that for conventional rice. The same unit yield of 6.07 tons/ha as used for conventional rice was used as the S1 unit yield, whereas the S2 unit yield was set conservatively at the original figure of 3.77 tons/ha. Thus, labor costs for japonica rice were reduced by 5–18 KSh/kg, meaning that the S1 production costs were approximately 2 KSh/kg higher than those for conventional rice. The difference between the costs for S2 and conventional rice was approximately 17 KSh/kg. The S1 net profit, about 73% of gross profit, was around 33 KSh/kg higher than the net profit for conventional rice. The S2 net profit was around 18 KSh/kg higher than that for conventional rice, and the production cost difference was not exceeded.
The production costs for S1 japonica rice were slightly higher than those for conventional rice, but the net profit was much higher than that difference. This fact is likely to provide an incentive for producers to select the S1 variety, with the expectation of greater profits, when growing japonica rice in the future.
4. Conclusions
The experimental cultivation of japonica rice showed that a higher unit yield can be obtained with this rice than with conventional rice (6.44 tons/ha for japonica rice compared with 6.07 tons/ha for conventional rice), depending on the variety. The production costs of high-yielding varieties of japonica rice are slightly higher than the costs of conventional rice (24.46 KSh/kg for japonica rice compared with 22.63 KSh/kg for conventional rice), but the net profit that can be generated by japonica rice is almost twice as high (65.54 KSh/kg for japonica rice compared with 32.37 KSh/kg for conventional rice). Therefore, selecting and cultivating a comparatively high-yielding variety of japonica rice could provide increased benefits to producers.
Within the materials’ costs (included in production costs), agricultural machinery service charges accounted for the largest proportion of the total cost for both japonica rice and conventional rice. Agricultural machinery service charges are problematic because of a shortage of tractors and combine harvesters. Therefore, it would be desirable if strategies and support could be put in place by the government and aid agencies to increase the number of machines owned by individual farmers and the number available from the MRGM, as this would lower the service charge unit price.
Within labor costs, the main rice cultivation tasks (land preparation, transplantation, weeding, and bird scaring) are carried out by hired laborers. As this trend is the same as in the case of Tanzania, it is possible that this is a hired-labor trend common to the East Africa region. An increase in the wages of these laborers is cause for concern; therefore, promotion of mechanization of those tasks to improve efficiency is necessary, and relevant investigation, in conjunction with strategies and support aimed at increasing the number of machines available, is expected.
This test cultivation was conducted at the MIAD test farm. However, to determine the cost of production when farmers grow japonica rice, it is necessary to carry out trials in farmers’ field using their management practices. This is one of the issues that needs to be addressed in the future.
Initiatives to ameliorate the problems faced in these stages of production would make the production of both japonica rice and conventional rice more economically viable and efficient. Expansion of irrigated acreage in the Mwea region is currently being pursued as a Yen loan project, so any production stage improvements can be expected to have a synergetic effect. We believe that such initiatives in Kenya’s largest rice-growing region represent a route toward strengthening the overall domestic rice production.
Assuming an increase in rice consumption, the demand for japonica rice can be expected to increase, and the relevant value chain must be ready to adapt as transaction volume increases. To ensure that an appropriately flexible value chain is in place, we believe that it is important to examine the entire value chain of japonica rice based on the production costs and benefits identified in this study as well as to analyze the roles of each stakeholder at each stage of processing, distribution, and consumption, as well as the price and profits along the value chain, competition with conventional varieties, consumer acceptability of japonica rice, and the potential for market expansion.
Author Contributions
Conceptualization, M.W.; methodology, M.W. and Y.S.; formal analysis, M.W.; investigation, M.W. and Y.S.; resources, M.W. and Y.S.; writing—original draft preparation, M.W.; writing—review and editing, K.N., I.A., and K.I.; visualization, M.W.; supervision, K.N.; project administration, M.W. and Y.S. All authors have read and agreed to the published version of the manuscript.
Funding
This study was funded by the Ministry of Agriculture, Fisheries, and Forestry, Japan, “Study on Rural and Agricultural Development considering Establishment of Food Value Chain (Africa Region)”.
Institutional Review Board Statement
Not applicable.
Informed Consent Statement
Not applicable.
Acknowledgments
The authors would like to thank the farmers of Mwea and the representatives of Japanese food store A in Nairobi for their interviews, and to the staff of MIAD for their cooperation in the experimental cultivation of japonica rice. This study commissioned by the Ministry of Agriculture, Forestry, and Fisheries, Japan (MAFF), was conducted by the Japanese Institute of Irrigation and Drainage (JIID), to which one of the authors belonged. We would also like to express our gratitude to JIID and MAFF.
Conflicts of Interest
The authors declare no conflict of interest.
References
- Ministry of Agriculture, Livestock and Fisheries, Government of Kenya. National Rice Development Strategy (2008–2013) Revised Edition 2014; Ministry of Agriculture, Livestock and Fisheries, Government of Kenya: Nairobi, Kenya, 2014; pp. 1–44.
- Atera, E.A.; Onyancha, F.N.; Majiwa, E.B.O. Production and marketing of rice in Kenya: Challenges and opportunities. J. Dev. Agric. Econ. 2018, 10, 64–70. [Google Scholar]
- Ndirangu, S.N.; Oyange, W.A. Analaysis of Millers in Kenya’s Rice Value Chain. IOSR J. Agric. Vet. Sci. (IOSR-JAVS) 2019, 12, 38–47. [Google Scholar]
- USDA_PS&D Online, PSD Data Sets, Last Updated Aug/12/2020. Available online: https://apps.fas.usda.gov/psdonline/app/index.html#/app/downloads (accessed on 13 August 2020).
- Muhunyu, J.G. Is Doubling Rice Production in Kenya by 2018 Achievable? J. Dev. Sustain. Agric. 2012, 7, 46–54. [Google Scholar]
- Mwangi, M.K. Transformation in Mwea Rice Sector. Available online: https://www.maff.go.jp/primaff/koho/seminar/2017/attach/pdf/171030_03.pdf (accessed on 1 November 2017).
- Oyange, W.A.; Chemining’wa, G.N.; Kanya, J.I.; Njiruh, P.N. Azolla Fern in Mwea irrigation scheme and its potential nitrogen contribution in paddy rice production. J. Agric. Sci. 2019, 11, 30–44. [Google Scholar] [CrossRef] [Green Version]
- Narita, D.; Sato, I.; Ogawada, D.; Matsumura, A. Integrating economic measures of adaption effectiveness into climate change interventions: A case study of irrigation development in Mwea, Kenya. PLoS ONE 2020, 15, e0243779. [Google Scholar] [CrossRef]
- Kondo, M.; Ota, T.; Wanjogu, R. Physical and chemical properties of Vertisols and soil nutrient management for intensive rice cultivation in the Mwea area in Kenya. Jpn. J. Trop. Agr. 2001, 45, 126–132. [Google Scholar]
- Tomizuka, T.; Mwithia, D.; Koskei, V. Secondary horticultural cropping in a paddy field in the Mwea irrigation scheme, Kenya: Different drainage techniques and effect on selected crop yields. Trop. Agr. Develop. 2019, 63, 61–68. [Google Scholar]
- Japan International Cooperation Agency, [Singing of a Yen Loan Agreement for the Republic of Kenya (17 August 2010)] Kenya Kyowakoku Muke Ensyakkan Kashitsuke no Choin. Available online: https://www.jica.go.jp/press/2010/20100817_01.html (accessed on 8 April 2020). (In Japanese).
- Samejima, H.; Katsura, K.; Kikuta, M.; Njinju, S.M.; Kimani, J.M.; Yamaguchi, A.; Makihara, D. Analysis of rice yield response to various cropping seasons to develop optimal cropping calendars in Mwea, Kenya. Plant Prod. Sci. 2020, 23, 297–305. [Google Scholar] [CrossRef] [Green Version]
- Kihoro, J.; Bosco, N.J.; Murage, H.; Ateka, E.; Makihara, D. Investigating the impact of rice blast disease on the livelihood of the local farmers in greater Mwea region of Kenya. SpringerPlus 2013, 308, 1–13. [Google Scholar] [CrossRef] [PubMed] [Green Version]
- RiceMAPP, Japan International Cooperation Agency Technical Cooperation Project. Guideline of Water Saving Rice Culture for Mwea Irrigation Scheme Ver.2, Rice Based & Market Oriented Agriculture Promotion Project (RiceMAPP); Japan International Cooperation Agency Technical Cooperation Project: Mwea, Kenya, 2016; pp. 1–30.
- Koskei, V.; Wanjogu, R.; Muthoni, J.; Tomizuka, T.; Goto, A. International Report on Purification and Multiplication of Japonica Rice at MIAD for Commercial Production and Marketing, Rice Based & Market Oriented Agriculture Promotion Project (RiceMAPP); Japan International Cooperation Agency Technical Cooperation Project: Mwea, Kenya, 2016; pp. 1–19.
- Yamada, R. [A study on employment of rice farming labor in Tanzania] Tanzania ni okeru inasaku roudoukoyou ni kansuru kousatsu. Agric. Manag. Res. Nougyou Keiei Kenkyu 1977, 35, 11–23. (In Japanese) [Google Scholar]
- Mofokeng, M.A.; Shargie, N.G. Bird damage and control strategies in grain sorghum production. Int. J. Agric. Environ. Res. 2016, 2, 264–269. [Google Scholar]
Figure 1.
Location map of Nairobi and the Mwea region.
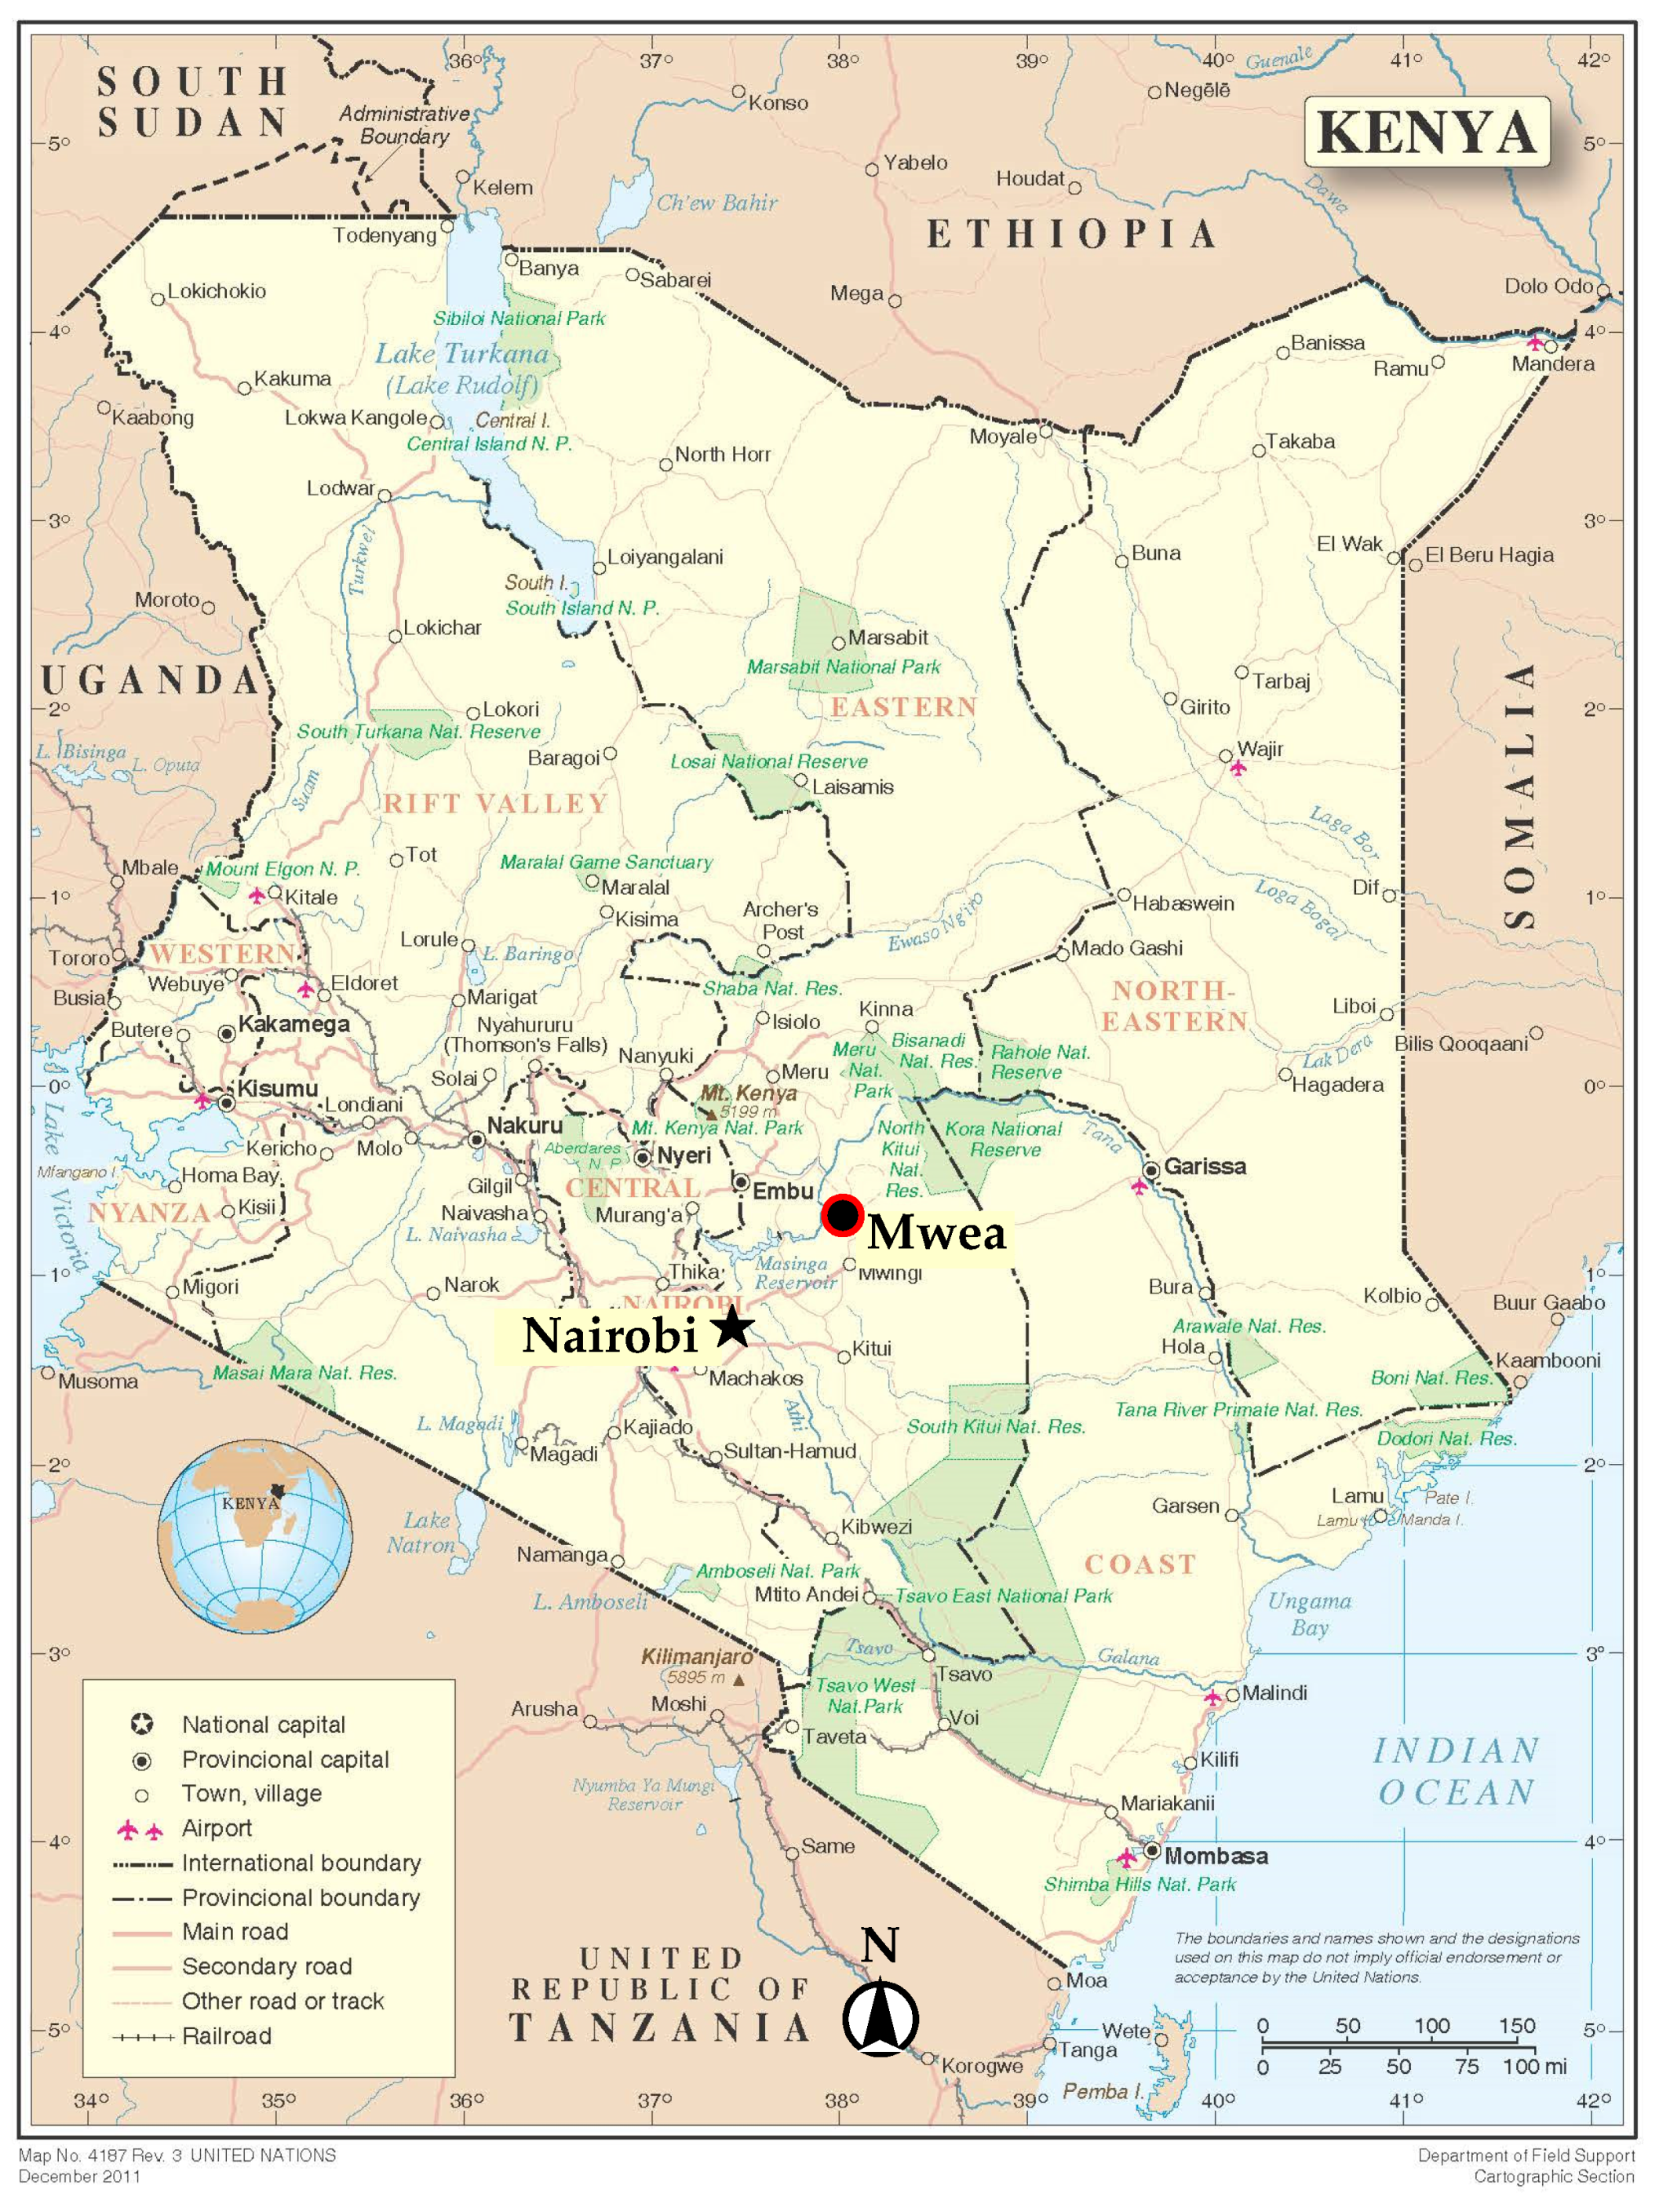
Figure 2.
Harvesting of japonica rice.

Table 1.
Yield and unit yield of each plot.
| Type of Plot | Area of Plot (ha) | Yield (tons) | Unit Yield (tons/ha) | Average Unit Yield (tons/ha) | Standard Deviation | |
|---|---|---|---|---|---|---|
| S1 | (1) | 0.32 | 2.14 | 6.74 | 6.44 * | 0.82 |
| (2) | 0.32 | 2.34 | 7.43 | |||
| (3) | 0.35 | 1.90 | 5.45 | |||
| S2 | (1) | 0.32 | 1.38 | 4.37 | 3.77 * | 0.45 |
| (2) | 0.31 | 1.14 | 3.64 | |||
| (3) | 0.35 | 1.17 | 3.31 | |||
| Total value or average unit yield | 1.97 | 10.07 | 5.11 | |||
* Significance at the 0.05 level by t-test.
Table 2.
Comparison of production costs between japonica rice and conventional rice (unit: KSh/kg).
| Japonica Rice | Conventional Rice | |||||
|---|---|---|---|---|---|---|
| S1 | S2 | |||||
| Gross profit | 90.00 | (100) | 90.00 | (100) | 55.00 | (100) |
| Production costs | 28.75 | (32) | 57.23 | (64) | 22.63 | (41) |
| Material costs | 9.39 | (33) | 16.04 | (28) | 9.76 | (43) |
| Labor costs | 19.36 | (67) | 41.19 | (72) | 12.87 | (57) |
| Net profit | 61.25 | (68) | 32.77 | (36) | 32.37 | (59) |
The numbers in parentheses for production costs and net profit indicate the percentage of gross profit. The numbers in parentheses for material costs and labor costs indicate the percentage of production costs.
Table 3.
Comparison of material costs between japonica rice and conventional rice (unit: KSh/kg).
| Japonica Rice | Conventional Rice | |||||
|---|---|---|---|---|---|---|
| S1 | S2 | |||||
| Total material costs | 9.39 | (100) | 16.04 | (100) | 9.76 | (100) |
| Seeds | 0.78 | (8) | 1.33 | (8) | 0.82 | (8) |
| Fertilizer | 3.02 | (32) | 5.15 | (32) | 1.85 | (19) |
| Pesticide | 1.41 | (15) | 2.41 | (15) | 2.24 | (23) |
| Materials | 0.74 | (8) | 1.27 | (8) | 0.72 | (7) |
| Agricultural machinery service charges | 3.45 | (37) | 5.89 | (37) | 4.12 | (42) |
The numbers in parentheses for seeds, fertilizer, pesticide, materials, and agricultural machinery service charges indicate the percentage of material costs.
Table 4.
Comparison of labor costs between japonica rice and conventional rice (unit: KSh/kg).
| Japonica Rice | Conventional Rice | |||||
|---|---|---|---|---|---|---|
| S1 | S2 | |||||
| Total labor costs | 19.36 | (100) | 41.19 | (100) | 12.87 | (100) |
| Land preparation | 4.33 | (22) | 7.40 | (18) | 1.54 | (12) |
| Seedbed preparation | 0.41 | (2) | 0.70 | (2) | 0.41 | (3) |
| Transplanting | 3.15 | (16) | 5.38 | (13) | 2.88 | (22) |
| Pesticide application | 0.05 | (0) | 0.08 | (0) | 0.58 | (4) |
| Supplementary planting | 0.09 | (0) | 0.16 | (0) | 0.58 | (4) |
| Fertilizer application | 0.16 | (1) | 0.28 | (1) | 0.29 | (2) |
| Weeding | 3.04 | (16) | 5.19 | (13) | 4.04 | (31) |
| Maintenance and other costs | 7.68 | (40) | 21.23 | (52) | 2.06 | (16) |
| Harvesting | 0.45 | (2) | 0.76 | (2) | 0.49 | (4) |
The numbers in parentheses for land preparation, seedbed preparation, transplanting, pesticide application, supplementary planting, fertilizer application, weeding, maintenance and other costs, and harvesting costs indicate the percentage of labor costs.
Table 5.
Comparison of “maintenance and other costs” between japonica rice and conventional rice (unit: KSh/kg).
Table 5.
Comparison of “maintenance and other costs” between japonica rice and conventional rice (unit: KSh/kg).
| Japonica Rice | Conventional Rice | |||||
|---|---|---|---|---|---|---|
| S1 | S2 | |||||
| Total maintenance and other costs | 7.68 | (100) | 21.23 | (100) | 2.07 | (100) |
| Levee maintenance | 0.16 | (2) | 0.28 | (1) | 1.25 | (60) |
| Water canal cleaning | 0.11 | (1) | 0.19 | (1) | ||
| Night watering | 0.92 | (12) | 1.58 | (7) | ||
| Bird scaring | 6.48 | (84) | 19.18 | (90) | 0.28 | (40) |
The numbers in parentheses for levee maintenance, water canal cleaning, night watering, and bird scaring costs indicate the percentage of the maintenance and other costs.
Table 6.
Comparison of production costs between japonica rice and conventional rice under the same condition for bird scaring (unit: KSh/kg).
Table 6.
Comparison of production costs between japonica rice and conventional rice under the same condition for bird scaring (unit: KSh/kg).
| Japonica Rice | Conventional Rice | |||||
|---|---|---|---|---|---|---|
| S1 | S2 | |||||
| Gross profit | 90.00 | (100) | 90.00 | (100) | 55.00 | (100) |
| Production costs | 24.46 | (27) | 39.38 | (44) | 22.63 | (41) |
| Material costs | 9.96 | (41) | 16.04 | (41) | 9.76 | (43) |
| Labor costs | 14.49 | (59) | 23.33 | (59) | 12.87 | (57) |
| Net profit | 65.54 | (73) | 50.62 | (56) | 32.37 | (59) |
The numbers in parentheses for production costs and net profit indicate the percentage of gross profit. The numbers in parentheses for material costs and labor costs indicate the percentage of production costs.
Publisher’s Note: MDPI stays neutral with regard to jurisdictional claims in published maps and institutional affiliations. |
© 2021 by the authors. Licensee MDPI, Basel, Switzerland. This article is an open access article distributed under the terms and conditions of the Creative Commons Attribution (CC BY) license (https://creativecommons.org/licenses/by/4.0/).
Share and Cite
MDPI and ACS Style
Watanabe, M.; Sumita, Y.; Azechi, I.; Ito, K.; Noda, K. Production Costs and Benefits of Japonica Rice in Mwea, Kenya. Agriculture 2021, 11, 629. https://0-doi-org.brum.beds.ac.uk/10.3390/agriculture11070629
AMA Style
Watanabe M, Sumita Y, Azechi I, Ito K, Noda K. Production Costs and Benefits of Japonica Rice in Mwea, Kenya. Agriculture. 2021; 11(7):629. https://0-doi-org.brum.beds.ac.uk/10.3390/agriculture11070629
Chicago/Turabian StyleWatanabe, Mamoru, Yutaka Sumita, Issaku Azechi, Kengo Ito, and Keigo Noda. 2021. "Production Costs and Benefits of Japonica Rice in Mwea, Kenya" Agriculture 11, no. 7: 629. https://0-doi-org.brum.beds.ac.uk/10.3390/agriculture11070629
Note that from the first issue of 2016, this journal uses article numbers instead of page numbers. See further details here.