
Effect of Zinc Oxide Nanoparticles on Nitrous Oxide Emissions in Agricultural Soil

1
Research Center for Environmental Ecology and Engineering, School of Environmental Ecology and Biological Engineering, Wuhan Institute of Technology, 206 Guanggu 1st Road, Wuhan 430205, China
2
Key Laboratory of Urban Environment and Health, Institute of Urban Environment, Chinese Academy of Sciences, 1799 Jimei Road, Xiamen 361021, China
3
Zhejiang Key Laboratory of Urban Environmental Processes and Pollution Control, Ningbo Urban Environment Observation and Research Station, Chinese Academy of Sciences, 88 Zhongke Road, Ningbo 315800, China
*
Author to whom correspondence should be addressed.
Agriculture 2021, 11(8), 730; https://0-doi-org.brum.beds.ac.uk/10.3390/agriculture11080730
Submission received: 26 May 2021
/
Revised: 21 July 2021
/
Accepted: 29 July 2021
/
Published: 31 July 2021
(This article belongs to the Special Issue Soil Carbon and Nitrogen in Agricultural Systems)
Abstract
:Zinc oxide nanoparticles (ZnO NPs) are widely used and exposed to the soil environment, but their effect on soil nitrous oxide (N2O) emissions remains unclear. In this study, a microcosm experiment was conducted to explore the effects of different ZnO NPs concentrations (0, 100, 500, and 1000 mg kg−1) on N2O emissions and associated functional genes related to N2O amendment with carbon (C) or nitrogen (N) substrates. Partial least squares path modeling (PLS-PM) was used to explore possible pathways controlling N2O emissions induced by ZnO NPs. In the treatment without C or N substrates, 100 and 500 mg kg−1 ZnO NPs did not affect N2O production, but 1000 mg kg−1 ZnO NPs stimulated N2O production. Interestingly, compared with the soils without ZnO NPs, the total N2O emissions in the presence of different ZnO NPs concentrations increased by 2.36–4.85-, 1.51–1.62-, and 6.28–8.35-fold following C, N and both C & N substrate amendments, respectively. Moreover, ZnO NPs increased the functional genes of ammonia-oxidizing bacteria (AOB amoA) and nitrite reductase (nirS) and led to the exhaustion of nitrate but reduced the gene copies of ammonia-oxidizing archaea (AOA amoA). In addition, the redundancy analysis results showed that the AOB amoA and nirS genes were positively correlated with total N2O emissions, and the PLS-PM results showed that ZnO NPs indirectly affected N2O emissions by influencing soil nitrate content, nitrifiers and denitrifiers. Overall, our results showed that ZnO NPs increase N2O emissions by increasing nitrification (AOB amoA) and denitrification (nirS), and we highlight that the exposure of ZnO NPs in agricultural fields probably results in a high risk of N2O emissions when coupled with C and N substrate amendments, contributing to global climate warming.
1. Introduction
In the past few decades, engineered nanoparticles (NPs) have been widely used in industrial, agricultural, and consumer production due to their unique properties (such as antibacterial properties) [1,2]. Meanwhile, most consumed NPs are exposed to the soil environment through the application of wastes and sewage sludge, which causes potential risks for microorganisms due to their toxic effects [3,4]. The presence of NPs in the soil environment affects the activities of nitrifiers and denitrifiers [5,6,7], which probably influences the release of nitrous oxide (N2O) from the soil to the atmosphere and contributes to global warming and ozone destruction. However, recent publications have reported that the effect of NPs on soil N2O emissions depends on their types [8,9,10,11]. For example, copper oxide (CuO) [8], silver sulfide (Ag2S) [9], and high-dose lithium oxide (Li2O) [10] and iron oxide (Fe2O3) [11] NPs could reduce, increase, and not affect soil N2O emissions, respectively.
Zinc oxide (ZnO) NPs are the third most used type of nanomaterial [4] and can potentially influence N2O production through at least two distinct mechanisms. First, the toxic action of ZnO NPs or the dissolution of Zn2+ can decrease soil microbial activity related to nitrogen (N) cycling [12,13,14,15] and N mineralization efficiency [14], which then indirectly reduces N2O emissions. Second, ZnO NPs inhibited glucose metabolism enzymes and then reduced the electrons and power for denitrifiers to produce N2O [16,17,18]. In a mineral medium, Zheng et al. [16] found that ZnO NPs largely inhibited the expression of the nosZ gene related to N2O reductase in the denitrification pathway and then increased N2O emissions. In a synthetic wastewater system, Ye et al. [18] observed that ZnO NPs reduce N2O emissions by enhancing N2O reduction. In the soil environment, few studies have focused on the impact of ZnO NPs on N2O emissions. Durenkamp et al. [19] observed that combining ZnO and Ag NPs has a minimal impact on N2O emissions in soil/sewage sludge mixtures. Rashid et al. [14] found that ZnO NPs reduced the nitrogen mineralization of leaf litter in sandy soil and then probably reduced the release of N2O.
In agricultural fields, the input of additional carbon (C) and N substrates from management practices (such as the application of manure or crop residue) [20,21,22,23] has the potential to enlarge N2O emissions, which probably changes the impact of NPs on N2O production. However, amendment with a C substrate temporarily creates an anaerobic environment, which further limits the last step of denitrification in soils polluted with ZnO NPs [24,25] and probably results in a high risk of N2O. In addition, the amendment of C could partly supply electrons and power for denitrifiers and likely offset the negative effect of ZnO NPs on soil nitrifiers and denitrifiers [23]. Meanwhile, the amendment of N fertilizer would increase the nosZ gene, which probably mediates the effect of ZnO NPs on N2O reduction [26]. In this study, microcosm experiments were conducted to explore the effect of ZnO NPs on N2O emissions and functional genes related to nitrification and denitrification. We hypothesize that: (1) the incorporation of ZnO NPs into soil inhibits the release of N2O from soil in the absence of C or N substrates and (2) the exposure of ZnO NPs would increase N2O emissions after C and N substrate amendments.
2. Materials and Methods
2.1. Materials and Experimental Design
Soil samples were collected from farmland without known nanomaterial pollution in the suburbs of Wuhan, China (114°26′ N, 30°19′ E, 25.89 m altitude). Soils in the 0–20 cm layer were sampled at three random sites and then mixed. The sampled soils were passed through a 2-mm sieve and then stored at 4 °C. The soil organic carbon, total nitrogen, pH, and bulk density were 12.4 g kg−1, 1.4 g kg−1, 6.8 and 1.26 g cm−3, respectively.
Four ZnO NPs concentrations and four substrate amendments were conducted in this experiment. Four ZnO NPs levels were 0, 100, 500, and 1000 mg kg−1 soil, which was based on the nominal range of ZnO NPs concentrations (100–6400 mg kg−1) in soil [27]. The four amendments included a control (CT), carbon as glucose (C), nitrogen as ammonium (N), and glucose plus ammonium (C AND N). Each treatment included 3 replicates. Deionized water was added to all the soils to achieve 60% water holding capacity, and the soils were then incubated at 25 °C. ZnO NPs (purity > 99% and particle size < 100 nm) were purchased from Aladdin (Shanghai, China). ZnO NPs (0, 1.5, 7.5, and 15 mg) were incorporated into 15 g of air-dried equivalent soil to achieve 0, 100, 500, and 1000 mg kg−1 concentrations and then added to 120-mL brown serum bottles. Additionally, 600 mg C glucose per 1 kg air-dried soil was added as the C substrate; the selected quantity equaled 100% of the microbial biomass C of this sampled soil, as suggested by Tian et al. [28]. Nitrogen was added as ammonium sulfate at 56.4 mg N kg−1 (equal to 140 kg N ha−1) based on the application amount of nitrogen fertilizer according to local farmers’ practices.
2.2. N2O Emission Measurements
Before N2O measurement, all bottles were opened and placed in a fuming cupboard for 5 min, which was a sufficient duration for the N2O in the bottle to adjust to the background value in the atmosphere (Figure S1); afterwards, the bottles were sealed with silicone plugs and incubated for 1 day to allow N2O to accumulate in the bottle. Meanwhile, four empty bottles were used to measure the initial N2O concentrations. On days 1, 2, 3, 5, and 8, 50 µL of sampled gas in the headspace was collected, and the N2O concentration was analyzed by using a gas chromatography instrument (Agilent 7890B, Agilent, Palo Alto, CA, USA) equipped with an electron capture detector, which attained ±0.1% precision of the measured N2O. The sampling frequency decreased with incubation days because the peak N2O emissions occurred in the early period, and 8 days was sufficient for N2O emissions to decrease to a stable level based on our preliminary experiment. The cumulative N2O emissions under different treatments were calculated by linear interpolation between daily emissions and the corresponding time [25].
2.3. Soil DOC, NH4+ and NO3− Measurements
At the end of the experiment, all soils were destructively sampled and divided into two parts. Fresh soil (first portion) was used to determine soil chemical properties. Briefly, 3 g soil was mixed with 2 M KCl (15 mL) and shaken for 60 min. Afterwards, the mixture was filtered with a qualitative filter, and then the ammonium (NH4+) and nitrate (NO3−) concentrations were measured using a continuous flow analyzer (Skalar SAN++ System, Skalar Analytical B.V., Breda, The Netherlands). Another 3 g of fresh soil was added to 15 mL of K2SO4, shaken for 1 h, and filtered with a quantitative filter. These filtered solutions were used to detect dissolved organic carbon (DOC) using a total organic carbon analyzer (Multi-N/C 2100S; Analytik Jena, Jena, Germany).
2.4. DNA Extraction and qPCR Analysis
Another part of the soil was freeze-dried at −80 °C for 2 days, and then 0.5 g of soil was used to extract DNA using the FastDNA™ Spin Kit for Soil (MP Biomedicals, Santa Ana, CA, USA) according to the instruction manual. DNA quantification and quality assessment were carried out using a NanoDrop 2000 Spectrophotometer (Thermo Scientific®, Wilmington, DE, USA). The extracted DNA was used to determine the abundances of nitrification (ammonia-oxidizing archaea (AOA amoA) and ammonia-oxidizing bacteria (AOB amoA) and denitrification functional genes (nirK/nirS- and nosZ-encoded nitrite and nitrous oxide reductases, respectively) by the qPCR method using a LightCycler® 480 II (Roche Diagnostics, Basel, Switzerland) [20]. The 20 μL reaction mixture for qPCR contained 2.0 μL template DNA, 0.5 μL of each primer, 10 μL GoTaq® qPCR Master Mix 2× (Promega, Madison, WI, USA) and 7 μL nuclease-free water (Promega, Madison, WI, USA). The primers and thermal cycling conditions of these genes are listed in Table S1.
2.5. Statistical Analysis
The differences in cumulative N2O emissions, soil chemical properties (DOC, NH4+, and NO3−), and functional genes related to N2O (AOA and AOB amoA, nirK, nirS and nosZ) among the four ZnO NPs levels were tested by one-way analysis of variance (ANOVA) using the least significant difference (LSD) test at the level of p < 0.05. All statistical analyses were conducted using SPSS 20.0 (SPSS Inc., Chicago, IL, USA). Redundancy analysis (RDA) was applied with CANOCO 4.5 (Microcomputer Power, Ithaca, NY, USA) to analyze the correlations of N2O emissions and environmental variables (DOC, NH4+ and NO3−) with functional genes related to nitrification (AOA and AOB amoA) and denitrification (nirK, nirS, and nosZ). Partial least squares path modeling (PLS-PM) was used to explore possible pathways controlling N2O emissions induced by ZnO NPs addition.
3. Results
3.1. Effect of N2O Emission
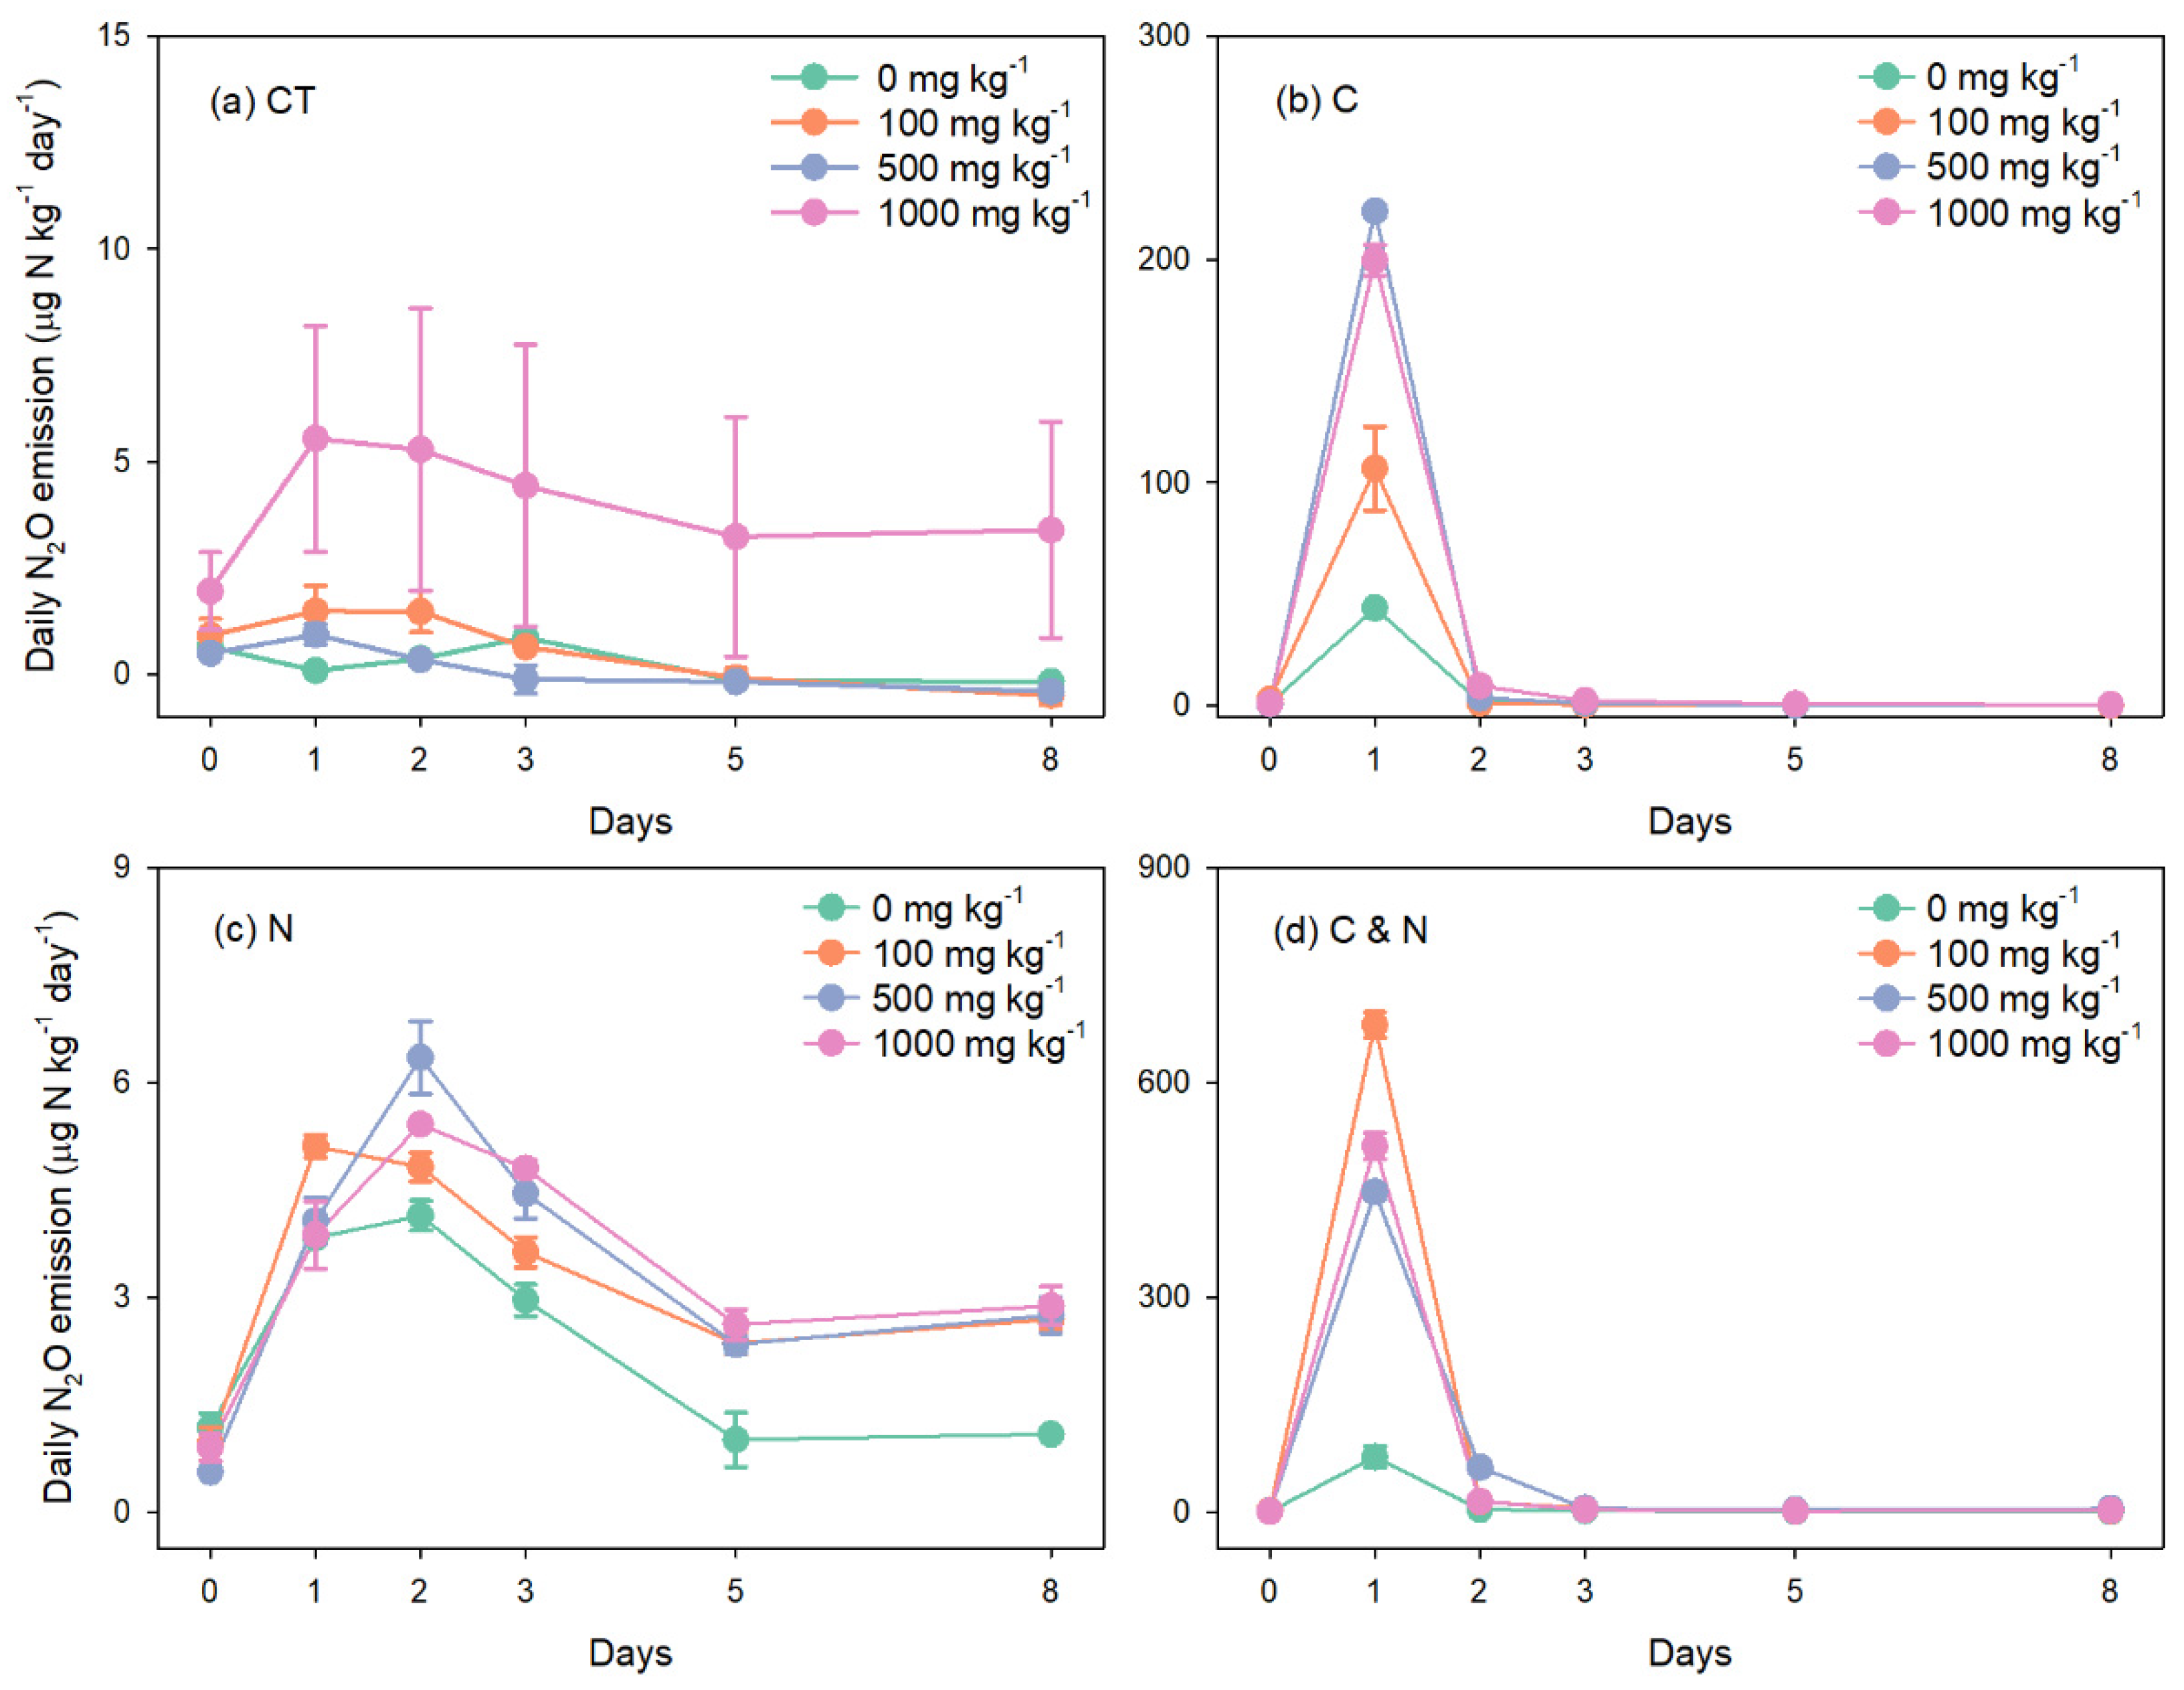
In the CT treatment, low daily N2O emissions (<1.48 μg N kg−1 day−1) were detected at ZnO NPs concentrations below 500 mg kg−1, but these values ranged from 1.95 to 5.54 μg N kg−1 day−1 at the 1000 mg kg−1 ZnO NPs level (Figure 1a). The presence of ZnO NPs accelerated the production of N2O in the C treatment, and the peaks of N2O emission were 43.67, 106.24, 221.59 and 199.61 μg N kg−1 day−1 for 0, 100, 500, and 1000 mg kg−1 ZnO NPs concentrations, respectively (Figure 1b). However, incorporating ZnO NPs into soils slightly stimulated the effect of N addition on N2O emissions, resulting in daily emissions of 1.02–4.14 μg N kg−1 day−1 in the treatment without ZnO NPs and 2.36–6.35 μg N kg−1 day−1 in the soils under different ZnO NPs levels (Figure 1c). ZnO NPs amendment considerably stimulated N2O emissions following both C and N addition; the peaks of N2O emissions ranged from 459.39 to 680.41 μg N kg−1 day−1 in the treatment with ZnO NPs, while this variable was 77.07 μg N kg−1 day−1 without ZnO NPs (Figure 1d).
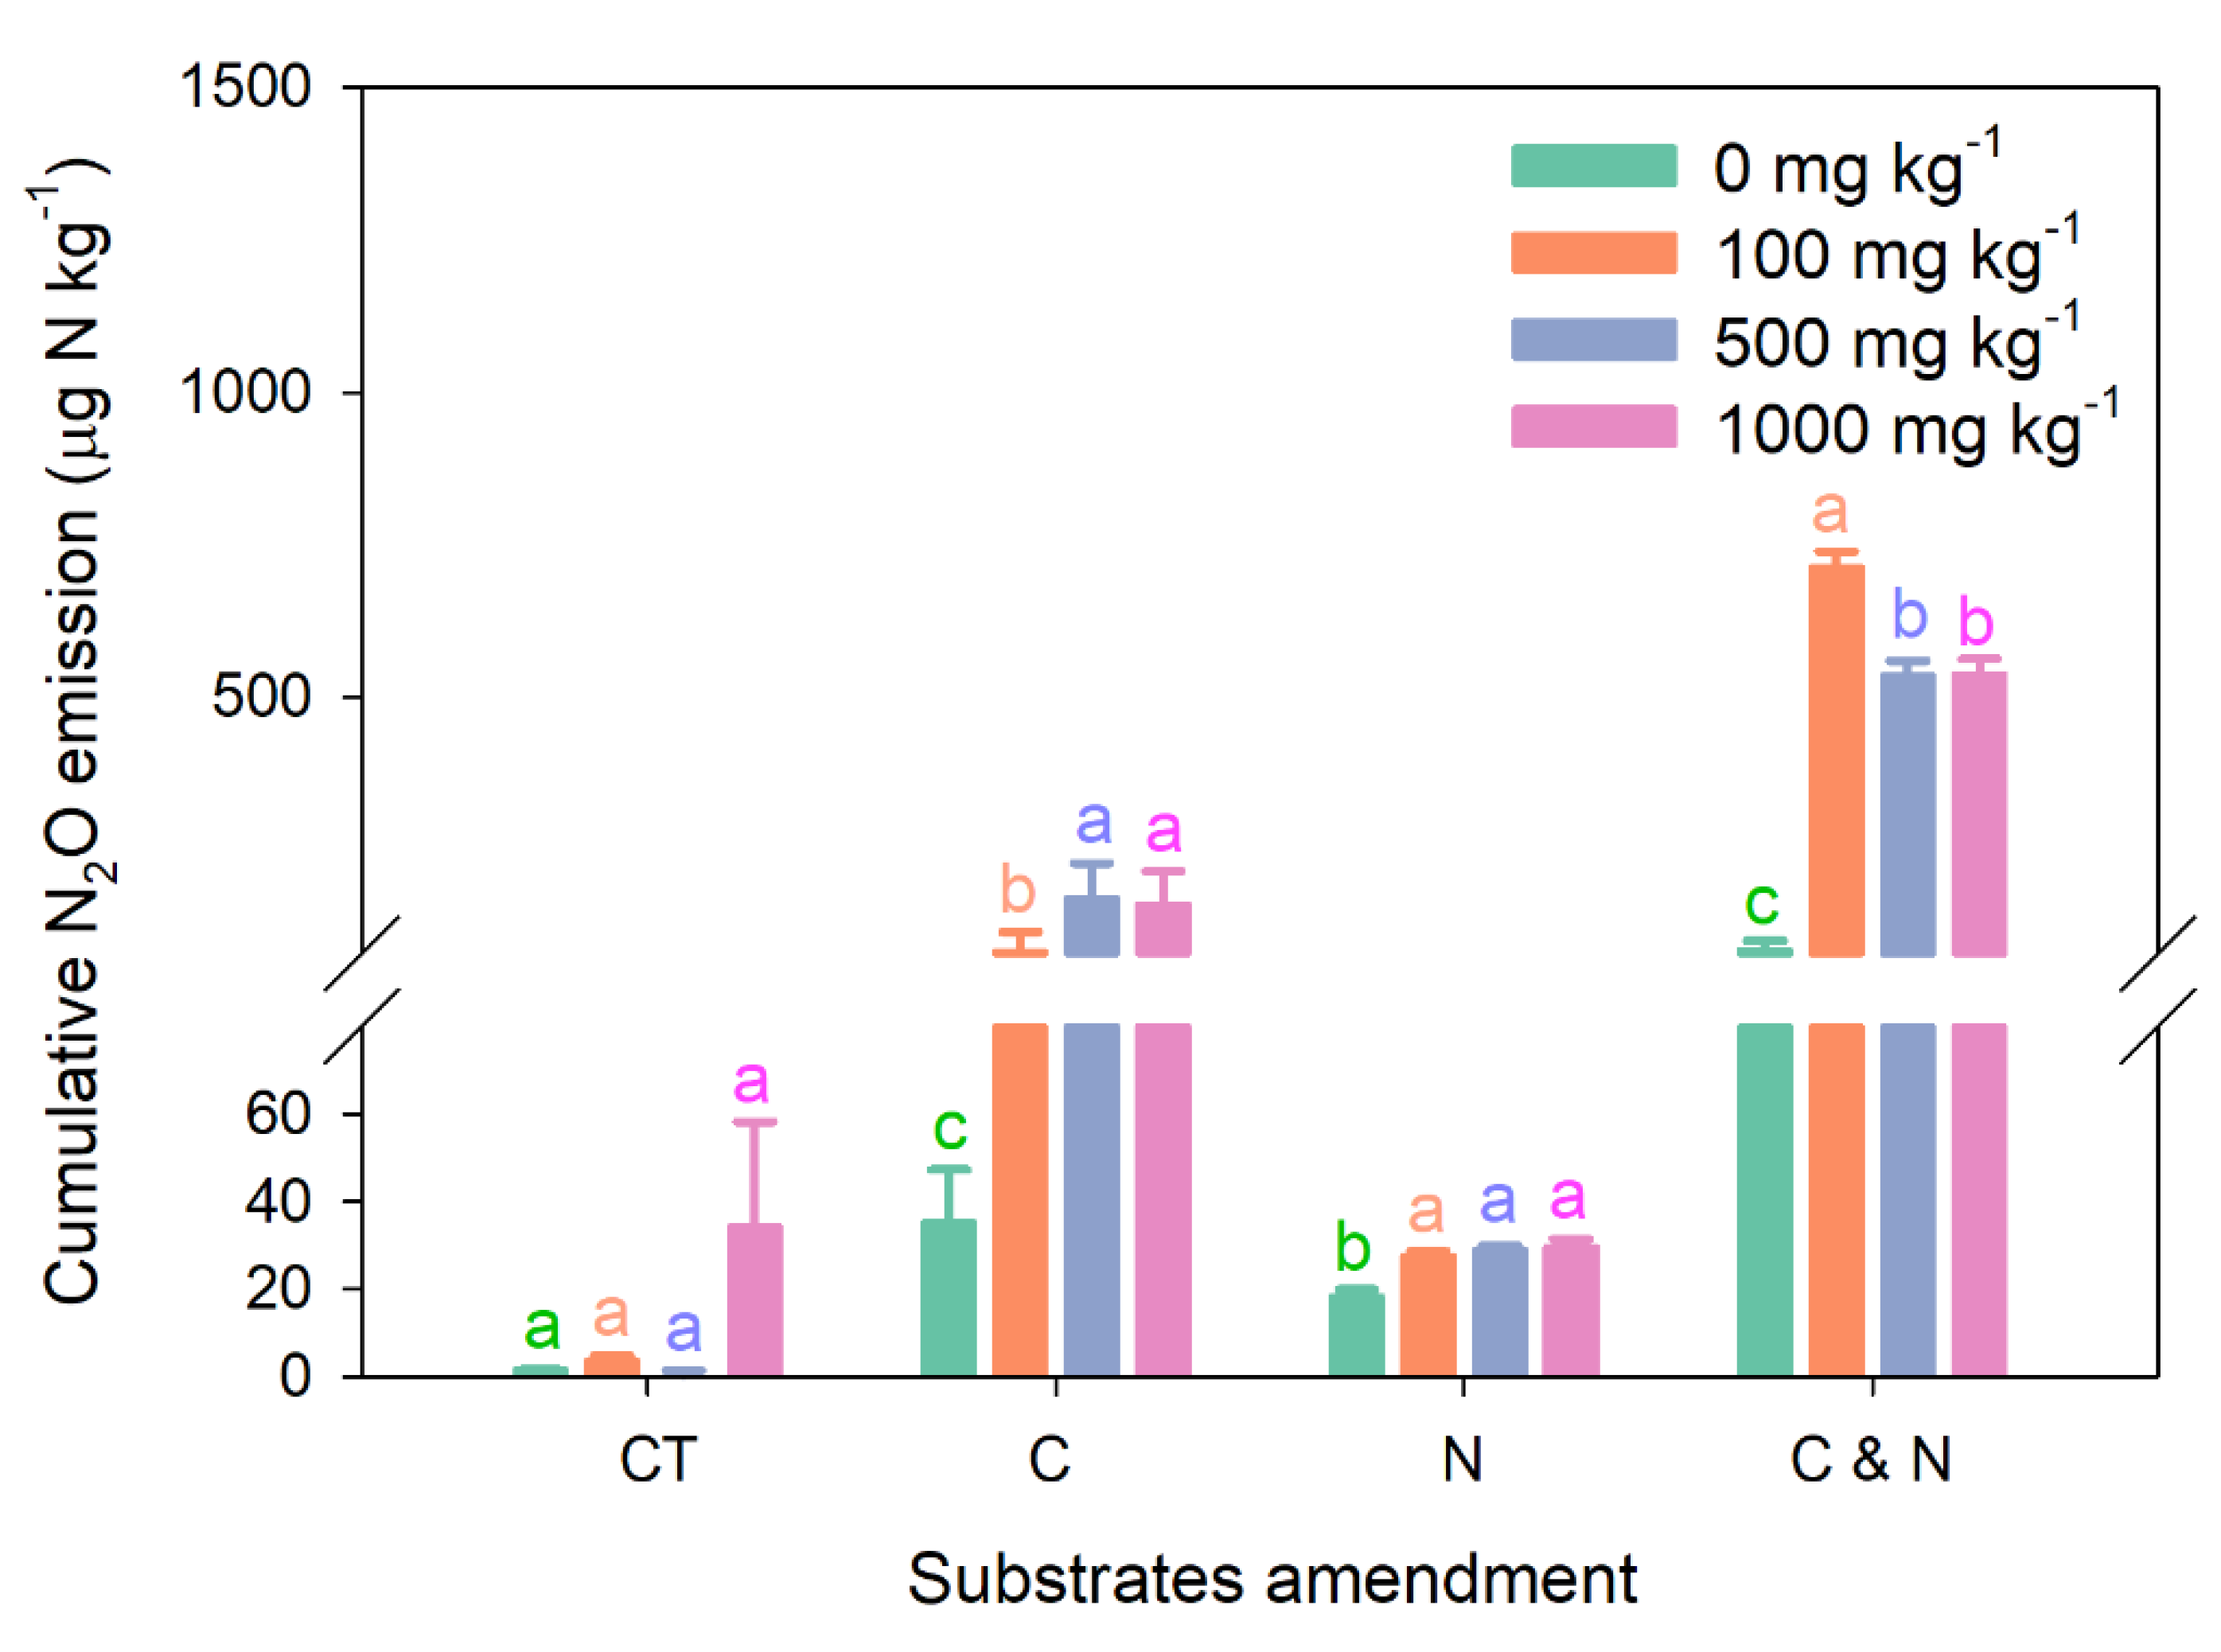
In the absence of C or N substrates, there were no significant differences in cumulative N2O emissions among the four ZnO NPs concentrations, although these values were greater at the 1000 mg kg−1 level (34.27 μg N kg−1) than at low concentrations (Figure 2). The presence of ZnO NPs significantly increased N2O emissions after C or N addition (Figure 2), and we found that C, N and their interactions significantly (p < 0.01) affected total N2O emissions (Table 1). Compared with the soils without ZnO NPs, the total N2O emissions in the presence of different ZnO NPs concentrations increased by 2.36–4.57, 1.51–1.62, and 6.24–8.30 times in the soil amendment with C, N, and C AND N substrates, respectively.
3.2. Soil DOC, Mineral N Content and Functional Genes Related to N2O
In the CT, C, and N treatments, ZnO NPs did not significantly (p < 0.01) affect the DOC content, there were no significant trends in the NH4+ content with increasing ZnO NPs concentration, and the NO3− content significantly (p < 0.01) decreased with increasing ZnO NPs concentration (Table 2 and Table 3). After both C and N addition, ZnO NPs significantly (p < 0.01) affected these variables, as DOC and NO3− contents decreased but NH4+ increased with increasing ZnO NPs concentrations (Table 2 and Table 3).
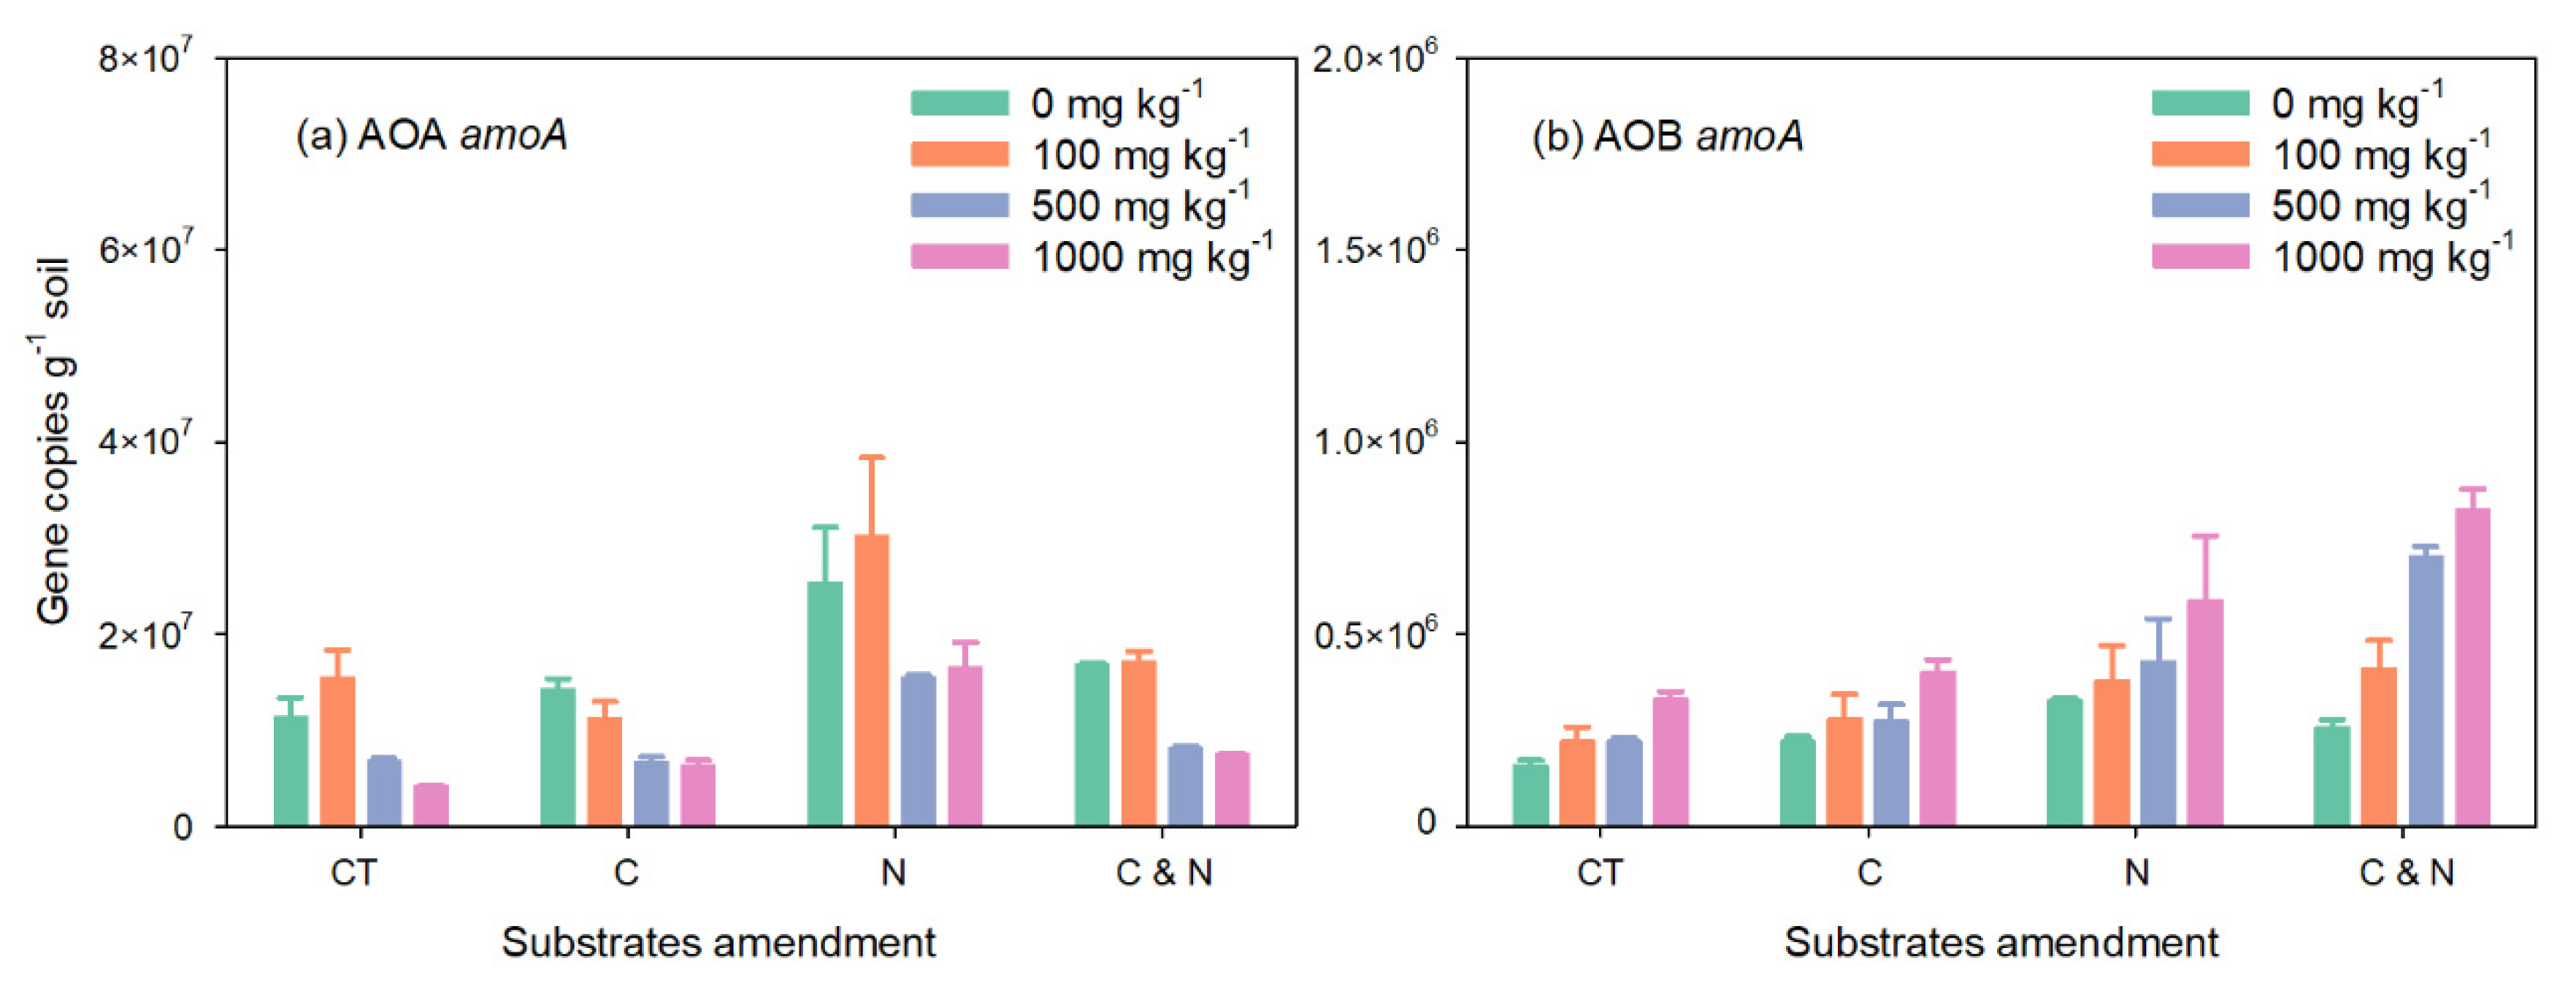
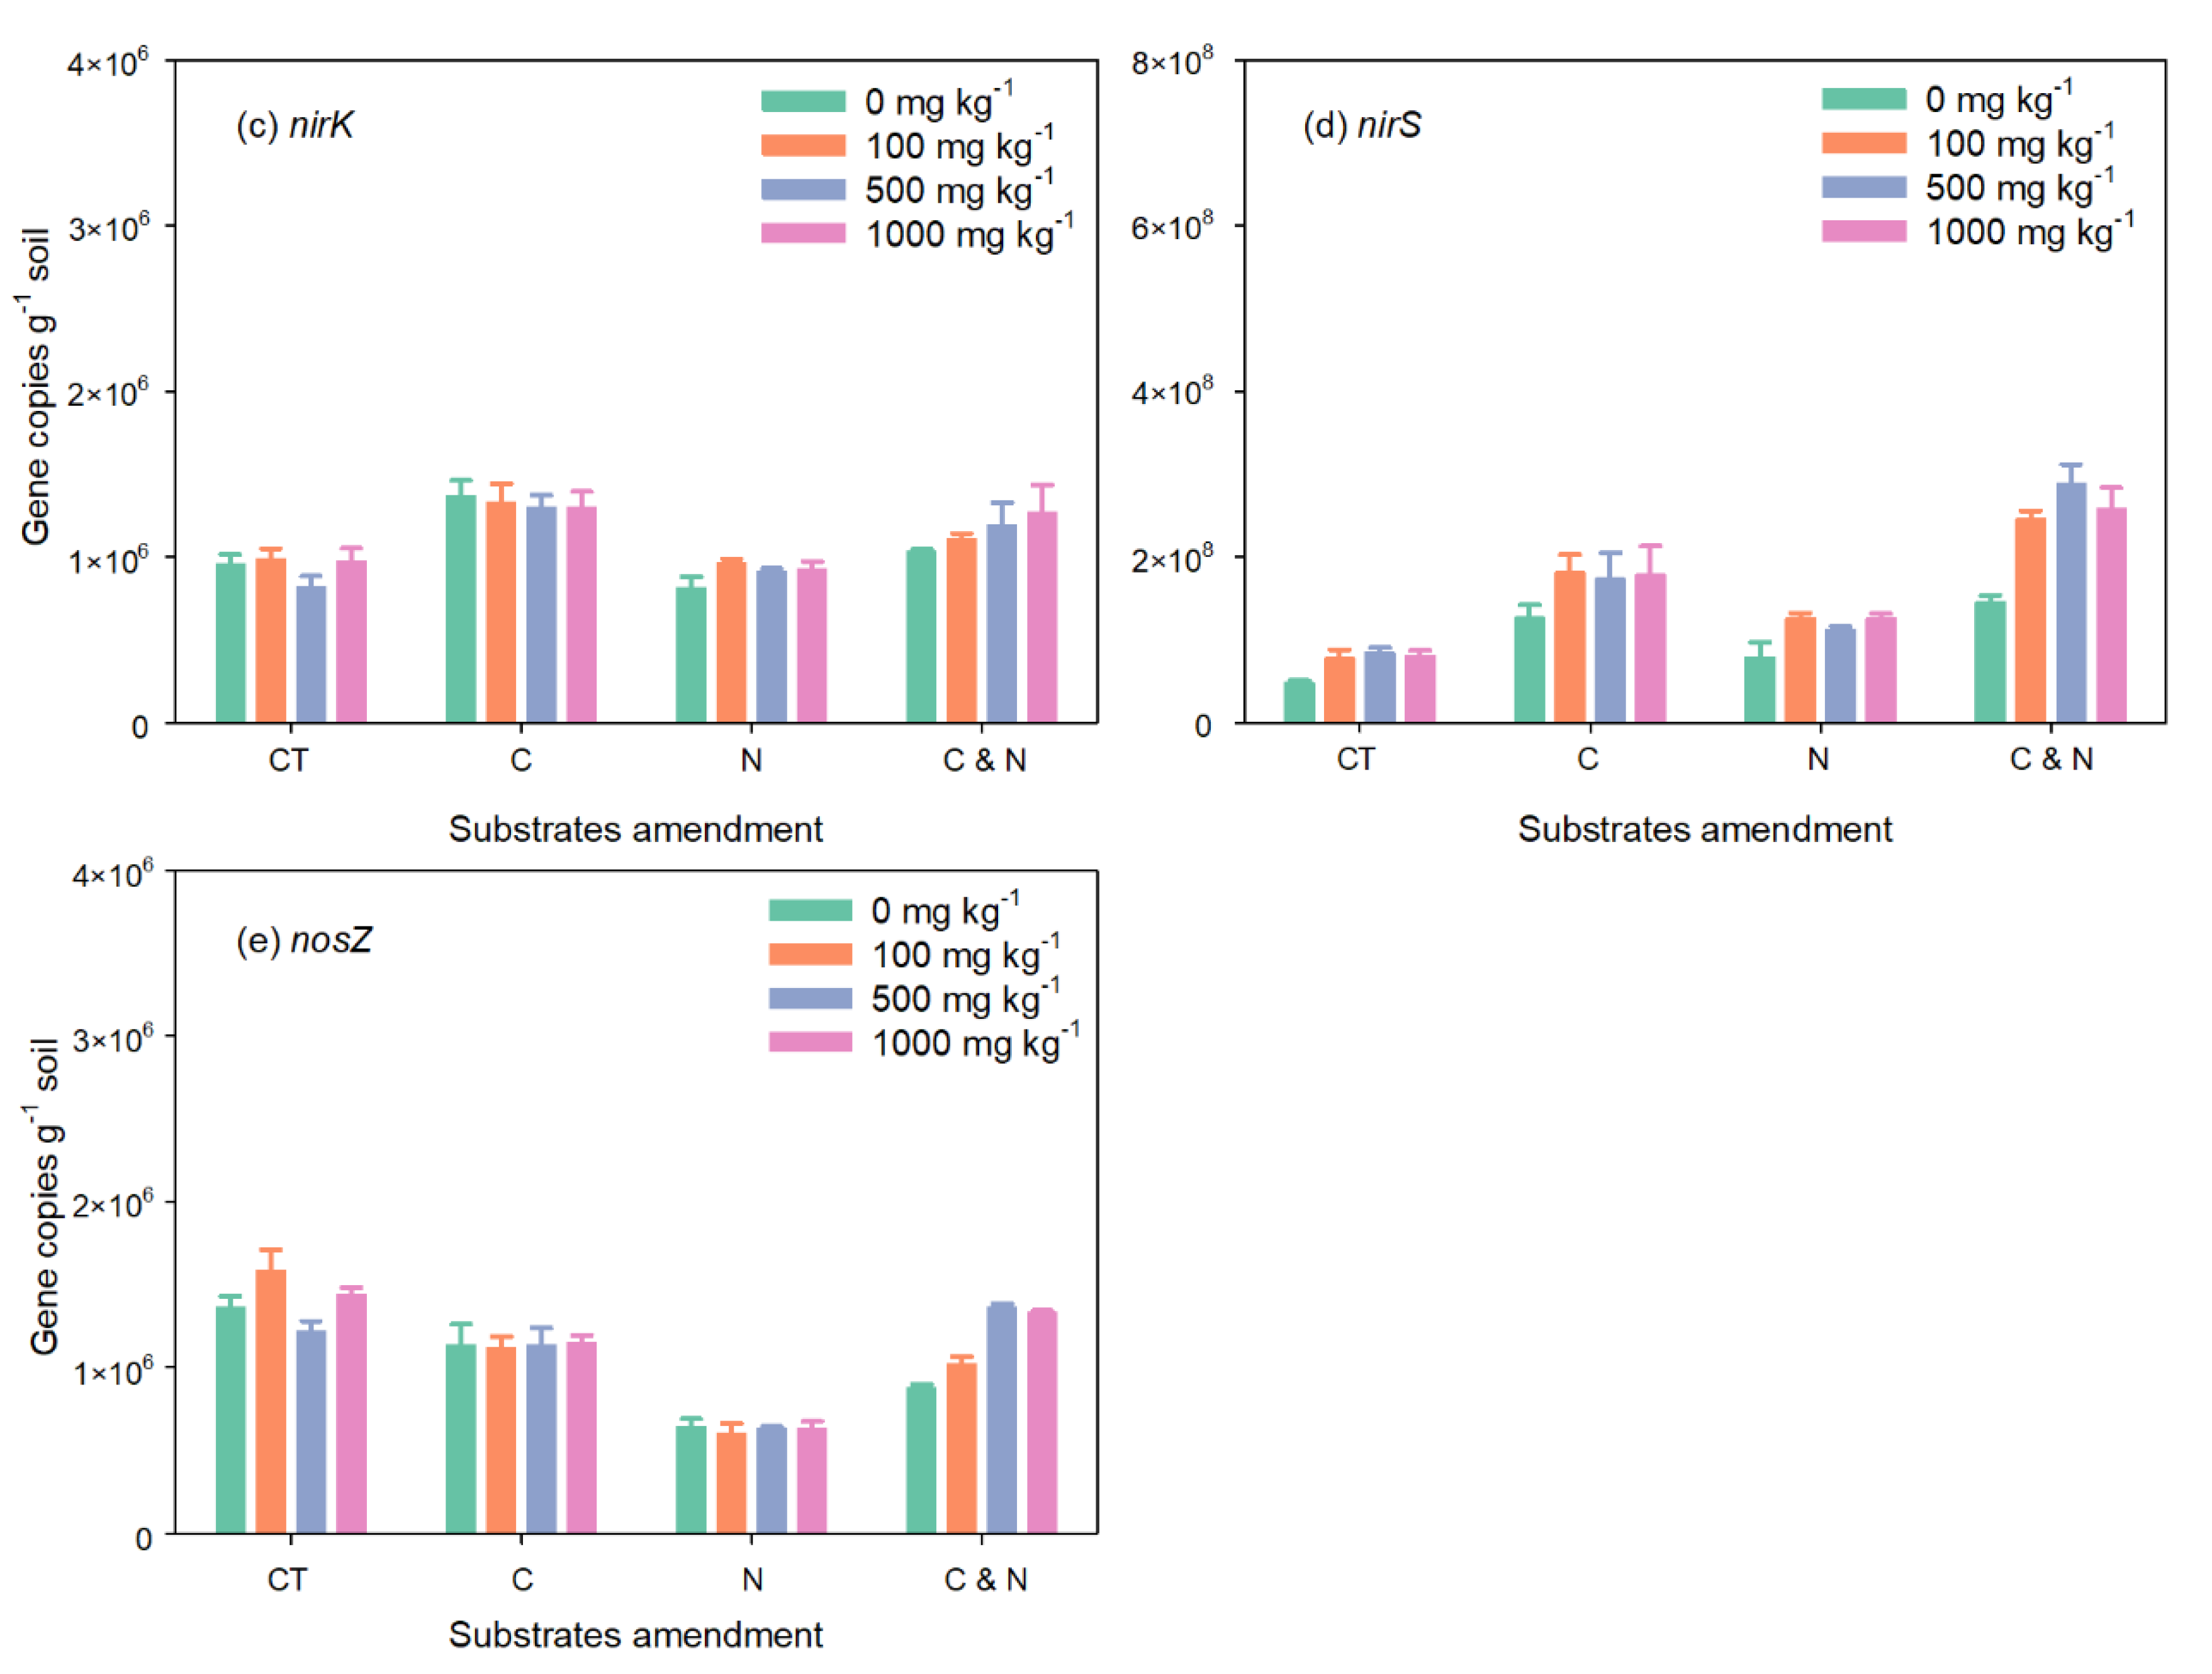
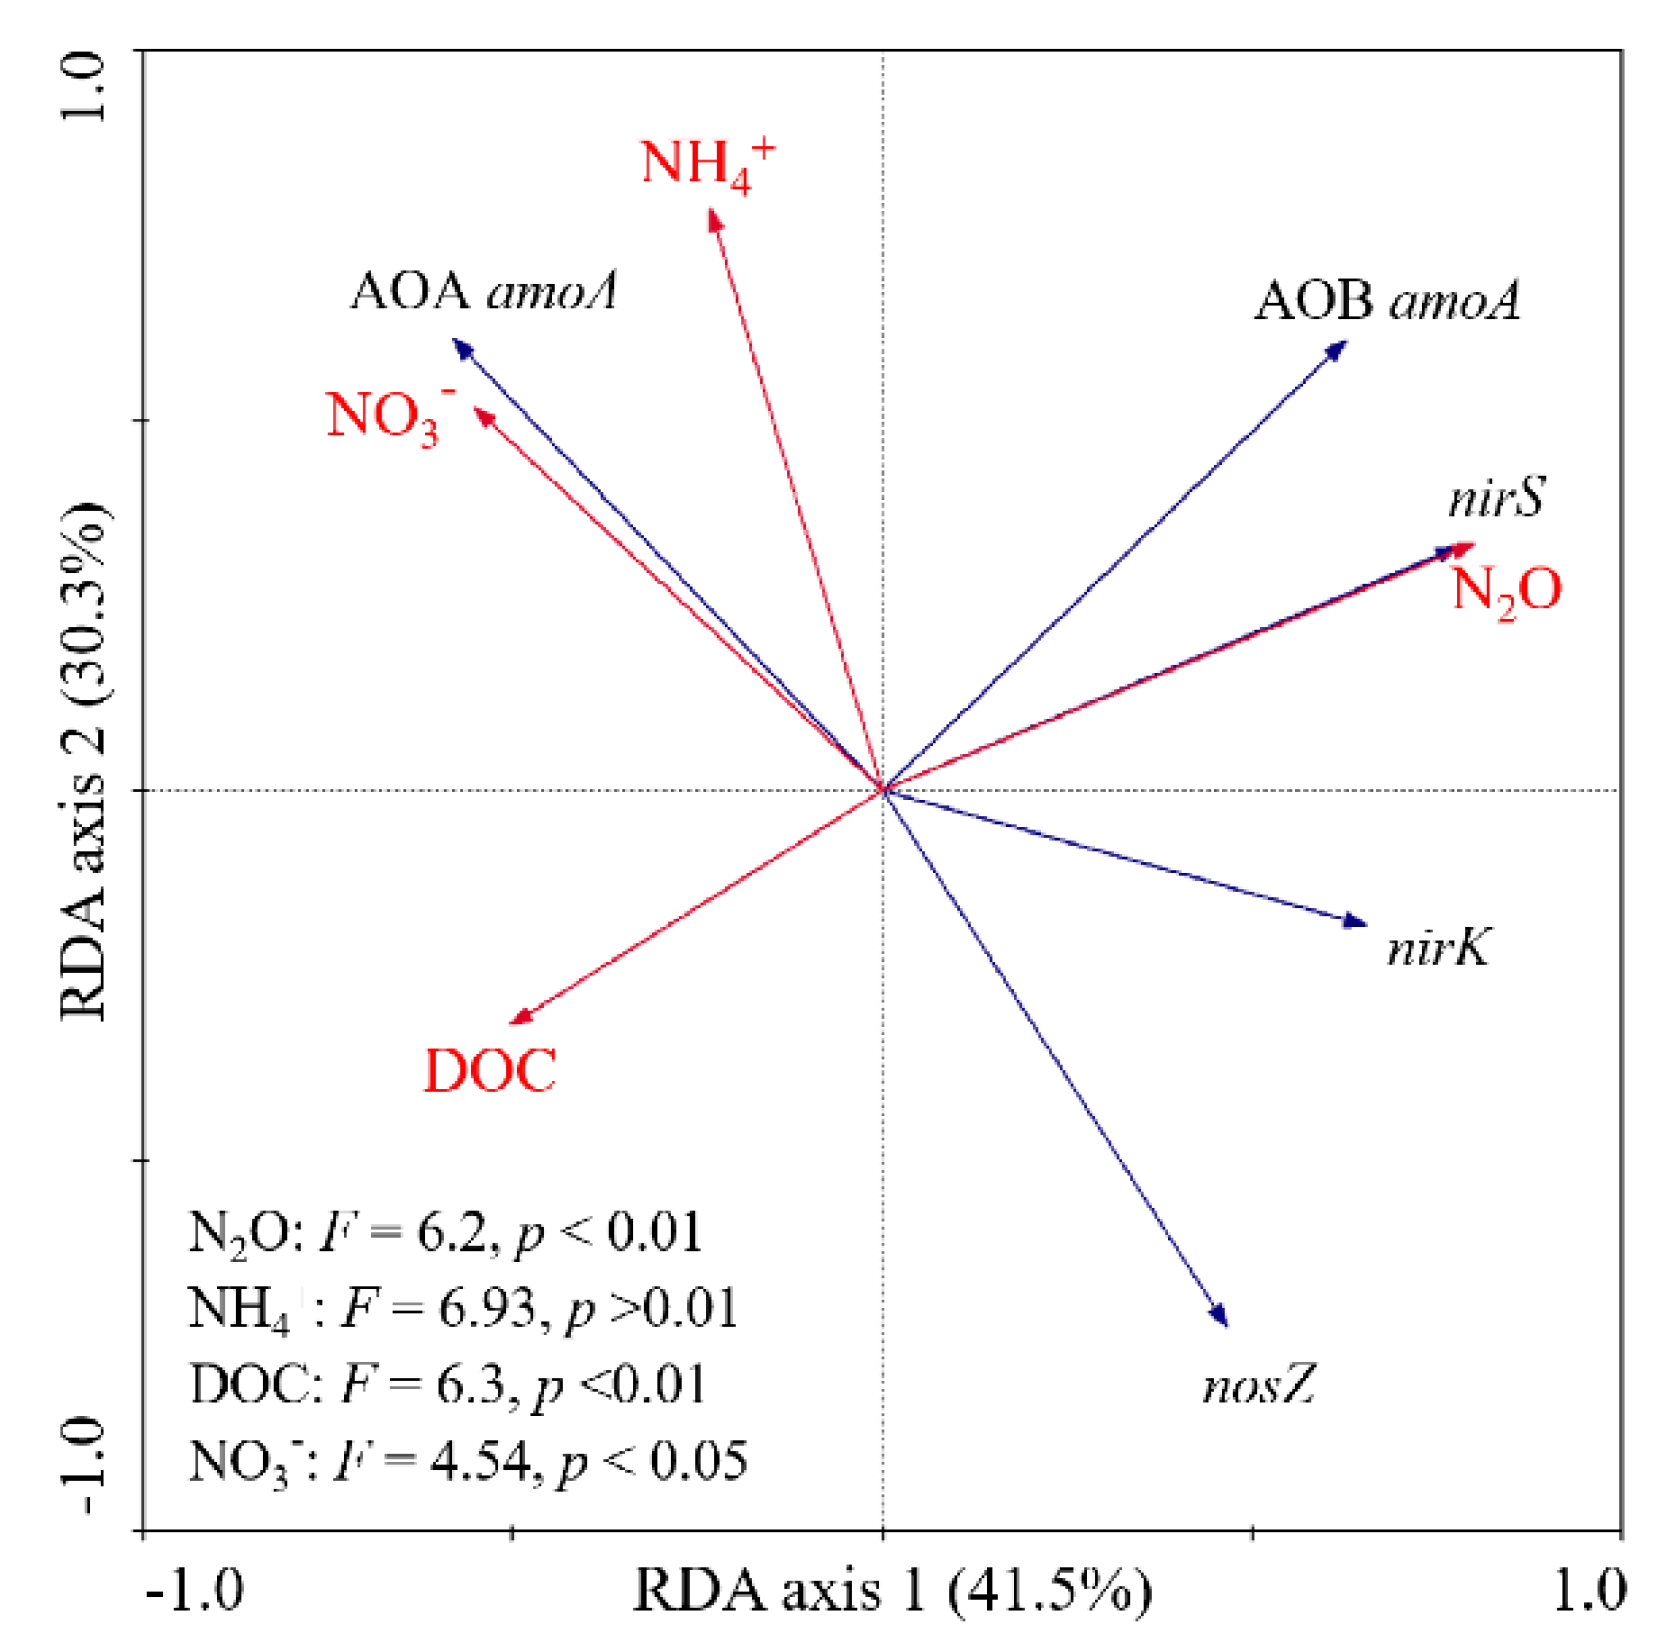
Across all treatments, the functional gene copies related to N2O followed the order: nirS (from 2.53 × 10⁶ to 1.51 × 10⁷) > AOA amoA (from 2.02 × 10⁵ to 1.46 × 10⁶) > AOB amoA, nirK and nosZ (×104) (Figure 3). Increasing ZnO NPs levels tended to decrease the abundance of AOA amoA (Figure 3a) but increase AOB amoA and nirS gene copies (Figure 3b,d). The nirK and nosZ genes were not significantly affected by ZnO NPs in the CT, C, and N treatments, but nosZ significantly increased with increasing ZnO NPs concentrations after amendment with both C and N substrates. In addition, in the presence of ZnO NPs, C, N and their interaction significantly influenced AOA amoA, nirS and nosZ gene copies (Table 1). The RDA results showed that the nirS and AOB amoA genes were negatively related to DOC on the first redundancy analysis axis, and NH4+ and NO3− were positively rel’ated to the AOA amoA gene but negatively associated with nosZ on the second redundancy analysis axis (Figure 4).
3.3. Effect of ZnO NPs on N2O Emission
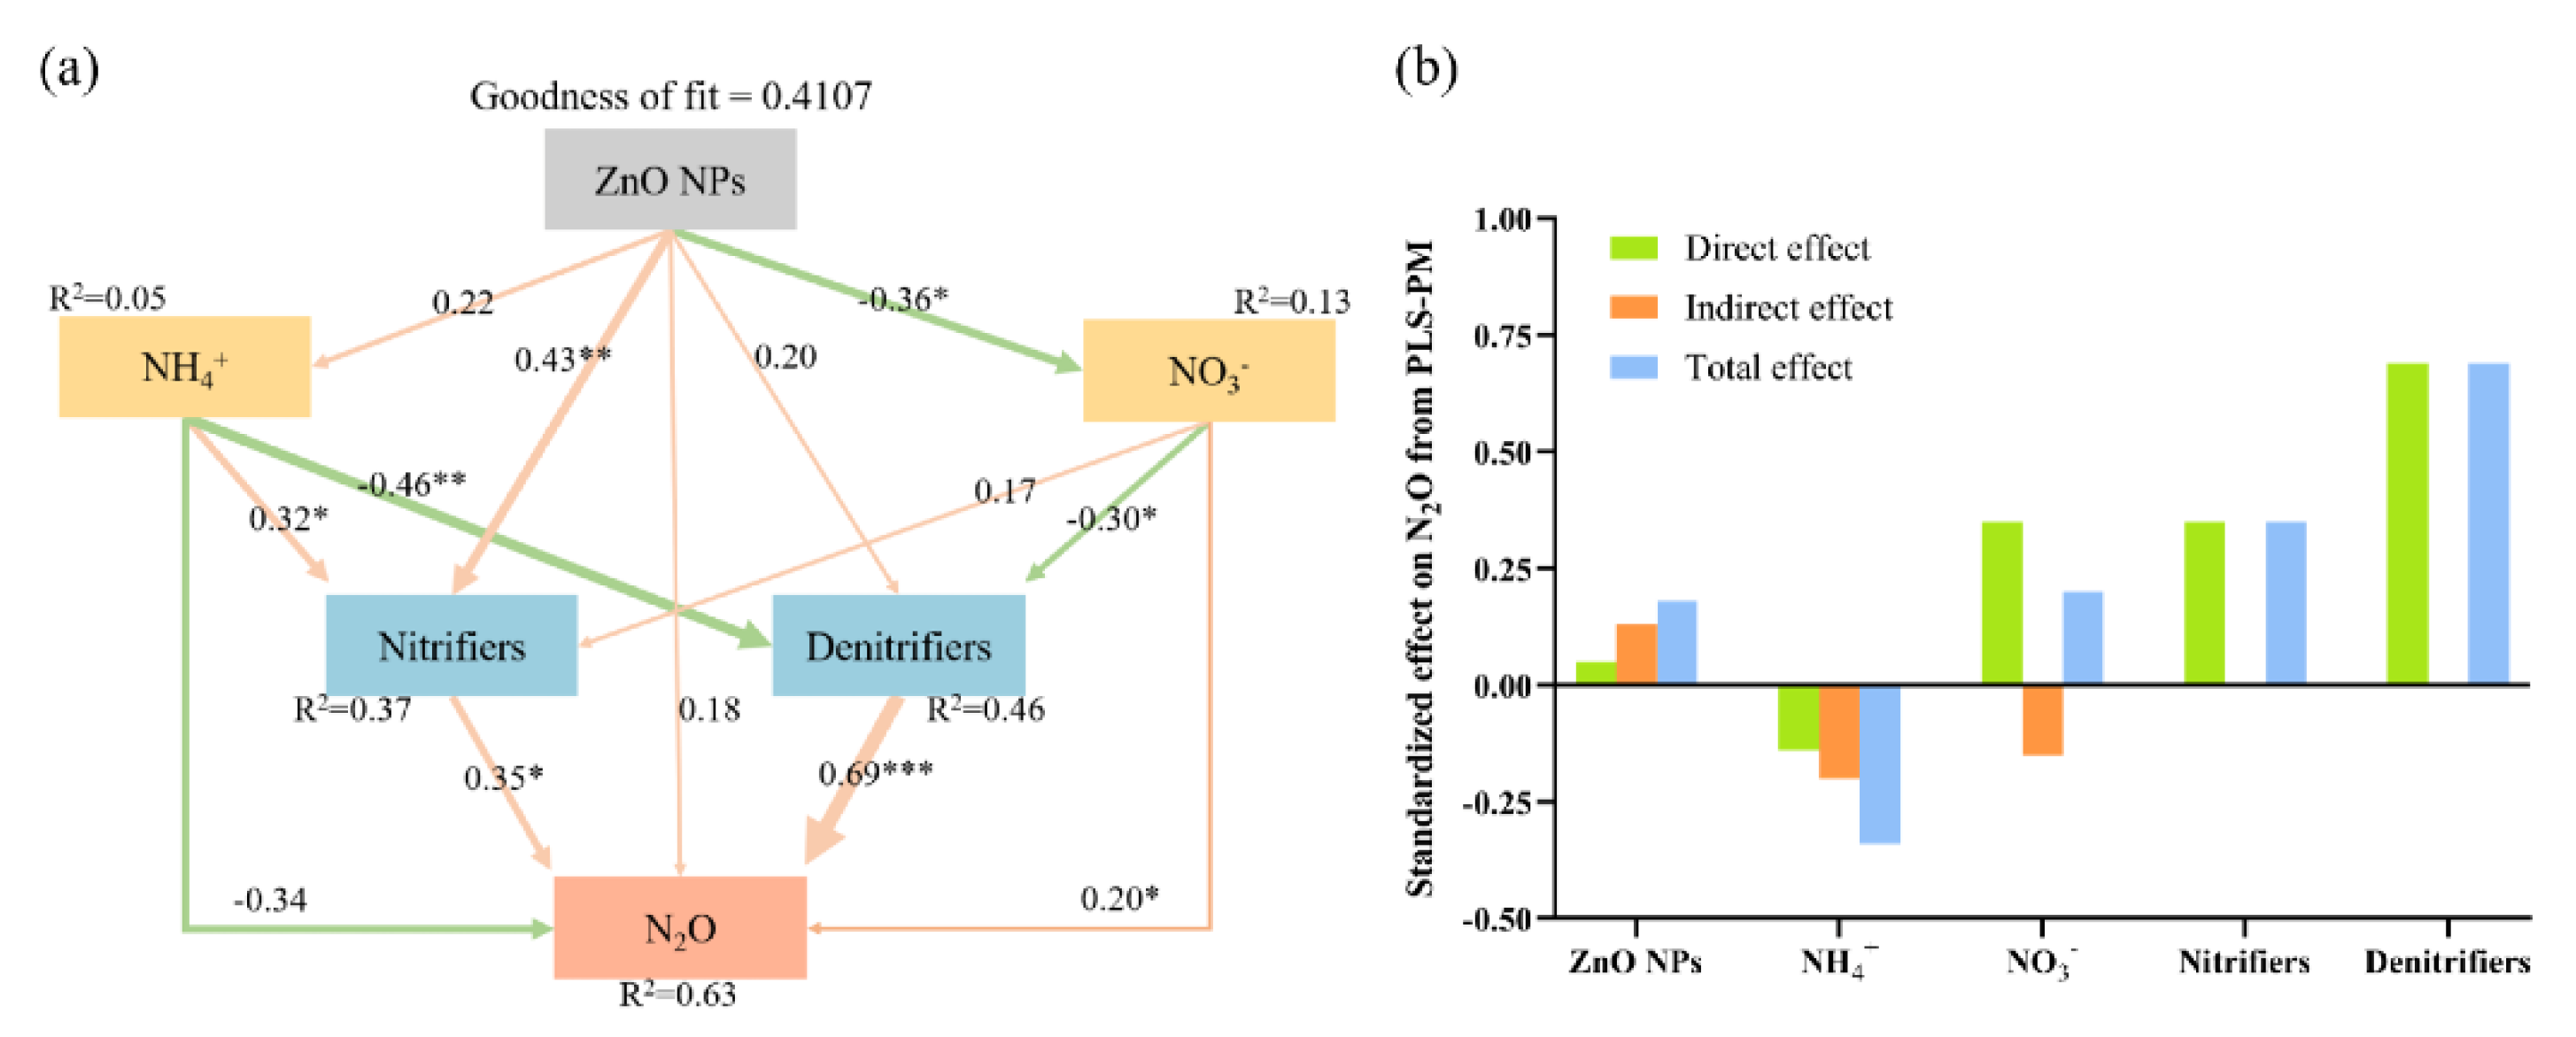
The RDA results showed that the nirS and AOB amoA genes were positively correlated with cumulative N2O emissions on the first redundancy analysis axis (Figure 4). PLS-PM showed that changes in soil NO3− content, nitrifiers (AOB amoA) and denitrifiers (nirS) induced by ZnO NPs addition significantly affected N2O emissions (Figure 5a). Both nitrifiers (0.35) and denitrifiers (0.69) had significant positive direct effects on N2O emissions, while NO3− had both positive direct (0.35) and negative indirect (−0.15) effects on N2O emissions, resulting in a total effect of NO3− on N2O emissions of 0.20 (Figure 5b).
4. Discussion
In the present study, ZnO NPs affected N2O emissions by controlling nitrification and denitrification pathways. Increasing ZnO NPs levels decreased the amoA gene copy number of AOA, which probably reduced the production of N2O through nitrification. However, this nanomaterial increased the abundances of AOB amoA and nirS, which induced more N2O production in the soils. This result disagreed with Phan et al. [29], who found that the presence of ZnO NPs reduced the gene expression levels of AOB amoA and nirK in a wastewater system. Cumulative N2O emissions were closely correlated with the nirS gene, and the NO3− content also decreased with increasing ZnO NPs concentration, indicating that ZnO NPs affect N2O emissions probably by enhancing nitrite reduction in the denitrification process. However, Durenkamp et al. [19] observed that ZnO NPs did not significantly affect N2O emissions from soil/sewage sludge mixtures. In a biological nitrogen removal system, Ye et al. [17] showed that the presence of ZnO NPs inhibited N2O production by largely reducing the functional genes related to nitrite or nitrate reduction rather than the reduction of N2O. These different results are probably due to the impact of ZnO NPs on nitrifiers and denitrifiers related to N2O depending on different environmental conditions. In the soil environment, N2O is produced through both nitrification and denitrification [23], whereas in other conditions (such as biological nitrogen removal systems), denitrification is the major pathway for N2O production [17,18].
The impact of NPs on N2O emissions also depends on their types in the soil environment [8,9,10,11,19,30,31,32,33]. Zhao et al. [8] observed that CuO NPs (ranging from 10–500 mg kg−1) continuously reduced soil N2O emissions. Low-dose silver (Ag) NPs unaffected or stimulated N2O production, but a high dose of this material would inhibit N2O emission due to toxicity [30,31,32,33]. Our results disagree with these studies, and we observed that 100 and 500 mg kg−1 ZnO NPs did not affect N2O production, but 1000 mg kg−1 ZnO NPs stimulated N2O production in the treatment without C and N amendments. This result was consistent with Avila-Arias et al. [10], who found that high-dose Li2O NPs (1000 mg kg−1) increased soil N2O emissions, and Wu et al. [9] found that the application of sludge with Ag2S NPs to soil significantly enhanced the release of N2O from soils. However, Durenkamp et al. [19] showed that the addition of sewage sludge into soil enriched with both ZnO and Ag NPs did not affect N2O emissions. Yang et al. [11] also observed no significant effect of Fe2O3 NPs (0.5–500 mg kg−1) on N2O emissions in paddy soils.
The inconsistent effect of these NPs on N2O emissions is probably due to the different responses of soil nitrification and denitrification processes to nanomaterials. Zhao et al. [8] found that the negative effect of CuO NPs on N2O emissions was mainly due to this nanoparticle inhibiting the ability of denitrification to accept electrons and then reducing the reductase activities of both nitrate and nitric oxide. Ag NPs decreased soil N2O production, probably by inhibiting urease activity [34] or functional genes related to nitrification [35,36,37] and denitrification [38]. However, Ag2S NPs could improve functional gene-encoded nitrification and denitrification and then increase N2O emissions in saline soil [9]. In addition, Yang et al. [11] found that Fe2O3 NPs did not significantly change the abundances of functional genes related to N2O production and reduction.
As expected, the amendment of the C substrate significantly stimulated the production of N2O in the presence of ZnO NPs due to the following: (1) ZnO NPs inhibited the key enzymes of glucose degradation and then reduced the electrons and energy for denitrifiers [16]. However, the addition of glucose probably partly compensates for the negative effect of ZnO NPs on the power available for denitrifiers and then stimulates N2O production in denitrification. (2) The effect of ZnO NPs on N2O produced via denitrification pathways relies on O2 availability, whereas the addition of a C substrate consumes O2 in the soil through heterotrophic respiration and then temporarily creates an anaerobic environment for denitrification to produce N2O [23,24,25,39]. Indeed, in the present study, the amendment of C substrate increased the abundance of nirK, which probably stimulated N2O production through enhanced nitrite reduction.
Our results indicated that in fields polluted by ZnO NPs, some management practices, such as the application of organic manure or crop residue that supply labile C and N substrates probably cause a high risk of N2O emissions and then contribute to global climate warming. However, two limitations should be noted in this experiment. First, ZnO NPs could dissolve in the soil environment and be consumed by microorganisms [14], which probably resulted in the positive effect of ZnO NPs on N2O emissions. Indeed, Wu et al. [40] observed a rapid dissolution of ZnO NPs in neutral soil and solubilized them in Zn2+. Further study should be conducted to analyze Zn2+ originating from ZnO NPs in the soil and separate the contribution of ZnO NPs and Zn2+ to N2O production and reduction. Second, Zn2+ dissolved in the soil could be taken up by plants as a micronutrient, which could increase the nitrogen use efficiency and then indirectly reduce the substrate for nitrification and denitrification processes [4]. In addition, the use of NPs is a useful method to support plant growth [2], which could indirectly affect nitrification and denitrification processes by regulating the N substrate. Future studies will need to determine the impact of ZnO NPs on N2O production in the presence of crops.
5. Conclusions
Our findings showed that ZnO NPs accelerated the release of N2O from soils after C or N substrate amendment. The interaction of C and N caused the total N2O emissions to substantially increase by 6.28–8.35 times compared with the control treatment without ZnO NPs. Moreover, this stimulatory effect was greater for soils with low ZnO NPs concentrations (100 mg kg−1) than for soils with 500 and 1000 mg kg−1 ZnO NPs. Although ZnO NPs reduced the N2O production rate by decreasing the abundances of AOA amoA functional genes, the increase in total N2O emissions was mainly attributed to ZnO NPs increasing the abundances of functional genes related to AOB and nitrite reductase. This result indicated that ZnO NPs probably induced greater N2O production than N2O reduction and thus stimulated the release of N2O from soils. Overall, our results demonstrate that the amendment of available C and N substrates probably results in a high risk of N2O emissions from soils in the presence of ZnO NPs, contributing to global warming and ozone depletion.
Supplementary Materials
The following are available online at https://0-www-mdpi-com.brum.beds.ac.uk/article/10.3390/agriculture11080730/s1, Figure S1: The change in N2O concentration after all bottles were opened and placed in a fuming cupboard for 5 minutes. The N2O concentration at 1 min indicated the initial concentration, Table S1: Primers and the thermal cycling conditions of functional genes related to N2O.
Author Contributions
Conceptualization, Z.F., Y.Y., H.Y. and C.G.; methodology, Z.F., Y.Y., H.Y. and C.G.; software, Z.F., Y.Y., H.Y. and C.G.; validation, Z.F., Y.Y., H.Y and C.G.; formal analysis, Z.F., Y.Y., H.Y. and C.G.; investigation, Z.F., Y.Y., H.Y. and C.G.; data curation, Z.F. and Y.Y.; writing—original draft preparation, Z.F.; writing—review and editing, Z.F. and Y.Y.; supervision, H.Y. and C.G. All authors have read and agreed to the published version of the manuscript.
Funding
This work was funded by the National Key R & D Program of China (2020YFC1806900) and the National Natural Science Foundation of China (41807040, 42077036, 42021005).
Institutional Review Board Statement
Not applicable.
Informed Consent Statement
Not applicable.
Data Availability Statement
The data presented in this study are available in the article.
Conflicts of Interest
The authors declare no conflict of interest.
References
- Lewis, R.W.; Bertsch, P.M.; McNear, D.H. Nanotoxicity of engineered nanomaterials (ENMs) to environmentally relevant beneficial soil bacteria—A critical review. Nanotoxicology 2019, 13, 392–428. [Google Scholar] [CrossRef]
- Rajput, V.D.; Minkina, T.; Kumari, A.; Harish; Singh, V.K.; Verma, K.K.; Mandzhieva, S.; Sushkova, S.; Srivastava, S.; Keswani, C. Coping with the challenges of abiotic stress in plants: New dimensions in the field application of nanoparticles. Plants 2021, 10, 1221. [Google Scholar] [CrossRef] [PubMed]
- Ma, H.; Williams, P.L.; Diamond, S.A. Ecotoxicity of manufactured ZnO nanoparticles—A review. Environ. Pollut. 2013, 172, 76–85. [Google Scholar] [CrossRef]
- Rajput, V.D.; Minkina, T.M.; Behal, A.; Sushkova, S.N.; Mandzhieva, S.; Singh, R.; Gorovtsov, A.; Tsitsuashvili, V.S.; Purvis, W.O.; Ghazaryan, K.A.; et al. Effects of zinc-oxide nanoparticles on soil, plants, animals and soil organisms: A review. Environ. Nanotechnol. Monit. Manag. 2018, 9, 76–84. [Google Scholar] [CrossRef]
- Luo, Z.; Qiu, Z.; Chen, Z.; Du Laing, G.; Liu, A.; Yan, C. Impact of TiO2 and ZnO nanoparticles at predicted environmentally relevant concentrations on ammonia-oxidizing bacteria cultures under ammonia oxidation. Environ. Sci. Pollut. Res. 2015, 22, 2891–2899. [Google Scholar] [CrossRef] [PubMed]
- Parada, J.; Rubilar, O.; Sousa, D.Z.; Martinez, M.; Fernandez-Baldo, M.A.; Tortella, G.R. Short term changes in the abundance of nitrifying microorganisms in a soil-plant system simultaneously exposed to copper nanoparticles and atrazine. Sci. Total. Environ. 2019, 670, 1068–1074. [Google Scholar] [CrossRef]
- Simonin, M.; Cantarel, A.A.M.; Crouzet, A.; Gervaix, J.; Martins, J.M.F.; Richaume, A. Negative effects of copper oxide nanoparticles on carbon and nitrogen cycle microbial activities in contrasting agricultural soils and in presence of plants. Front. Microbiol. 2018, 9, 3102. [Google Scholar] [CrossRef]
- Zhao, S.; Su, X.; Wang, Y.; Yang, X.; Bi, M.; He, Q.; Chen, Y. Copper oxide nanoparticles inhibited denitrifying enzymes and electron transport system activities to influence soil denitrification and N2O emission. Chemosphere 2020, 245, 125394. [Google Scholar] [CrossRef]
- Wu, J.; Bai, Y.; Lu, B.; Li, C.; Menzies, N.W.; Bertsch, P.M.; Wang, Z.; Wang, P.; Kopittke, P.M. Application of sewage sludge containing environmentally-relevant silver sulfide nanoparticles increases emissions of nitrous oxide in saline soils. Environ. Pollut. 2020, 265, 114807. [Google Scholar] [CrossRef]
- Avila-Arias, H.; Nies, L.F.; Gray, M.B.; Turco, R.F. Impacts of molybdenum-, nickel-, and lithium- oxide nanomaterials on soil activity and microbial community structure. Sci. Total Environ. 2019, 652, 202–211. [Google Scholar] [CrossRef] [PubMed]
- Yang, H.; Zhang, X.; Dang, D.; Zheng, L.; Yang, Q.; Yu, Y. Effects of iron oxide nanoparticles on CH4 and N2O emissions and microbial communities in two typical paddy soils. Chin. J. Appl. Environ. Biol. 2021, 7, 725–733. [Google Scholar] [CrossRef]
- Ge, Y.; Schimel, J.P.; Holden, P.A. Evidence for negative effects of TiO2 and ZnO nanoparticles on soil bacterial communities. Environ. Sci. Technol. 2011, 45, 1659–1964. [Google Scholar] [CrossRef] [PubMed]
- Chai, H.; Yao, J.; Sun, J.; Zhang, C.; Liu, W.; Zhu, M.; Ceccanti, B. The effect of metal oxide nanoparticles on functional bacteria and metabolic profiles in agricultural soil. Bull. Environ. Contam. Toxicol. 2015, 94, 490–495. [Google Scholar] [CrossRef] [PubMed]
- Rashid, M.I.; Shahzad, T.; Shahid, M.; Ismail, I.M.; Shah, G.M.; Almeelbi, T. Zinc oxide nanoparticles affect carbon and nitrogen mineralization of Phoenix dactylifera leaf litter in a sandy soil. J. Hazard. Mater. 2017, 324, 298–305. [Google Scholar] [CrossRef]
- Du, W.; Sun, Y.; Ji, R.; Zhu, J.; Wu, J.; Guo, H. TiO2 and ZnO nanoparticles negatively affect wheat growth and soil enzyme activities in agricultural soil. J. Environ. Monit. 2011, 13, 822–828. [Google Scholar] [CrossRef]
- Zheng, X.; Su, Y.; Chen, Y.; Wan, R.; Liu, K.; Li, M.; Yin, D. Zinc oxide nanoparticles cause inhibition of microbial denitrification by affecting transcriptional regulation and enzyme activity. Environ. Sci. Technol. 2014, 48, 13800–13807. [Google Scholar] [CrossRef]
- Ye, J.; Gao, H.; Domingo-Felez, C.; Wu, J.; Zhan, M.; Yu, R.; Smets, B.F. Insights into chronic zinc oxide nanoparticle stress responses of biological nitrogen removal system with nitrous oxide emission and its recovery potential. Bioresour. Technol. 2021, 327, 124797. [Google Scholar] [CrossRef]
- Ye, J.; Gao, H.; Wu, J.; Chang, Y.; Chen, Z.; Yu, R. Responses of nitrogen transformation processes and N2O emissions in biological nitrogen removal system to short-term ZnO nanoparticle stress. Sci. Total. Environ. 2020, 705, 135916. [Google Scholar] [CrossRef]
- Durenkamp, M.; Pawlett, M.; Ritz, K.; Harris, J.A.; Neal, A.L.; McGrath, S.P. Nanoparticles within WWTP sludges have minimal impact on leachate quality and soil microbial community structure and function. Environ. Pollut. 2016, 211, 399–405. [Google Scholar] [CrossRef]
- Yu, Y.; Zhao, C.; Zheng, N.; Jia, H.; Yao, H. Interactive effects of soil texture and salinity on nitrous oxide emissions following crop residue amendment. Geoderma 2019, 337, 1146–1154. [Google Scholar] [CrossRef]
- Muhammad, W.; Vaughan, S.M.; Dalal, R.C.; Menzies, N.W. Crop residues and fertilizer nitrogen influence residue decomposition and nitrous oxide emission from a Vertisol. Biol. Fertil. Soils 2010, 47, 15–23. [Google Scholar] [CrossRef]
- Chen, H.; Li, X.; Hu, F.; Shi, W. Soil nitrous oxide emissions following crop residue addition: A meta-analysis. Glob. Chang. Biol. 2013, 19, 2956–2964. [Google Scholar] [CrossRef]
- Daly, E.J.; Hernandez-Ramirez, G. Sources and priming of soil N2O and CO2 production: Nitrogen and simulated exudate additions. Soil Biol. Biochem. 2020, 149, 107942. [Google Scholar] [CrossRef]
- Morley, N.; Baggs, E.M. Carbon and oxygen controls on N2O and N2 production during nitrate reduction. Soil Biol. Biochem. 2010, 42, 1864–1871. [Google Scholar] [CrossRef]
- Liang, L.L.; Grantz, D.A.; Jenerette, G.D. Multivariate regulation of soil CO2 and N2O pulse emissions from agricultural soils. Glob. Chang. Biol. 2016, 22, 1286–1298. [Google Scholar] [CrossRef]
- Ouyang, Y.; Evans, S.E.; Friesen, M.L.; Tiemann, L.K. Effect of nitrogen fertilization on the abundance of nitrogen cycling genes in agricultural soils: A meta-analysis of field studies. Soil Biol. Biochem. 2018, 127, 71–78. [Google Scholar] [CrossRef]
- Waalewijn-Kool, P.L.; Diez Ortiz, M.; van Gestel, C.A. Effect of different spiking procedures on the distribution and toxicity of ZnO nanoparticles in soil. Ecotoxicology 2012, 21, 1797–1804. [Google Scholar] [CrossRef] [Green Version]
- Tian, Q.; Yang, X.; Wang, X.; Liao, C.; Li, Q.; Wang, M.; Wu, Y.; Liu, F. Microbial community mediated response of organic carbon mineralization to labile carbon and nitrogen addition in topsoil and subsoil. Biogeochemistry 2016, 128, 125–139. [Google Scholar] [CrossRef]
- Phan, D.C.; Pasha, A.B.M.T.; Carwile, N.; Kapoor, V. Effect of zinc oxide nanoparticles on physiological activities and gene expression of wastewater nitrifying bacteria. Environ. Eng. Sci. 2020, 37, 328–336. [Google Scholar] [CrossRef]
- Li, Y.; Zhao, R.; Wang, L.; Niu, L.; Wang, C.; Hu, J.; Wu, H.; Zhang, W.; Wang, P. Silver nanoparticles and Fe(III) co-regulate microbial community and N2O emission in river sediments. Sci. Total. Environ. 2020, 706, 135712. [Google Scholar] [CrossRef]
- Zheng, Y.; Hou, L.; Liu, M.; Newell, S.E.; Yin, G.; Yu, C.; Zhang, H.; Li, X.; Gao, D.; Gao, J.; et al. Effects of silver nanoparticles on nitrification and associated nitrous oxide production in aquatic environments. Sci. Adv. 2017, 3, e1603229. [Google Scholar] [CrossRef] [Green Version]
- Beddow, J.; Stolpe, B.; Cole, P.A.; Lead, J.R.; Sapp, M.; Lyons, B.P.; Colbeck, I.; Whitby, C. Nanosilver inhibits nitrification and reduces ammonia-oxidising bacterial but not archaeal amoA gene abundance in estuarine sediments. Environ. Microbiol. 2017, 19, 500–510. [Google Scholar] [CrossRef] [Green Version]
- Samarajeewa, A.D.; Velicogna, J.R.; Princz, J.I.; Subasinghe, R.M.; Scroggins, R.P.; Beaudette, L.A. Effect of silver nano-particles on soil microbial growth, activity and community diversity in a sandy loam soil. Environ. Pollut. 2017, 220, 504–513. [Google Scholar] [CrossRef]
- McGee, C.F.; Storey, S.; Clipson, N.; Doyle, E. Concentration-dependent responses of soil bacterial, fungal and nitrifying communities to silver nano and micron particles. Environ. Sci. Pollut. Res. 2018, 25, 18693–18704. [Google Scholar] [CrossRef]
- Masrahi, A.; VandeVoort, A.R.; Arai, Y. Effects of silver nanoparticle on soil-nitrification processes. Arch. Environ. Contam. Toxicol. 2014, 66, 504–513. [Google Scholar] [CrossRef] [PubMed]
- Yan, C.; Huang, J.; Cao, C.; Li, R.; Ma, Y.; Wang, Y. Effects of PVP-coated silver nanoparticles on enzyme activity, bacterial and archaeal community structure and function in a yellow-brown loam soil. Environ. Sci. Pollut. Res. 2020, 27, 8058–8070. [Google Scholar] [CrossRef]
- Wang, J.; Shu, K.; Zhang, L.; Si, Y. Effects of silver nanoparticles on soil microbial communities and bacterial nitrification in suburban vegetable soils. Pedosphere 2017, 27, 482–490. [Google Scholar] [CrossRef]
- Wu, L.; Zhu, G.; Zhang, X.; Si, Y. Silver nanoparticles inhibit denitrification by altering the viability and metabolic activity of Pseudomonas stutzeri. Sci. Total. Environ. 2020, 706, 135711. [Google Scholar] [CrossRef]
- Cheng, Y.-F.; Zhang, Q.; Li, G.-F.; Xue, Y.; Zheng, X.-P.; Cai, S.; Zhang, Z.-Z.; Jin, R.-C. Long-term effects of copper nanoparticles on granule-based denitrification systems: Performance, microbial communities, functional genes and sludge properties. Bioresour. Technol. 2019, 289, 121707. [Google Scholar] [CrossRef] [PubMed]
- Wu, P.; Cui, P.; Du, H.; Alves, M.E.; Zhou, D.; Wang, Y. Long-term dissolution and transformation of ZnO in soils: The roles of soil pH and ZnO particle size. J. Hazard. Mater. 2021, 415, 125604. [Google Scholar] [CrossRef]
Figure 1.
N2O emissions in the treatments with no addition (a), C addition (b), N addition (c), and C and N addition (d) at different ZnO NPs concentrations (0, 100, 500 and 1000 mg kg−1). Error bars represent the standard error of the mean (n = 3).
Figure 1.
N2O emissions in the treatments with no addition (a), C addition (b), N addition (c), and C and N addition (d) at different ZnO NPs concentrations (0, 100, 500 and 1000 mg kg−1). Error bars represent the standard error of the mean (n = 3).

Figure 2.
Cumulative N2O emissions in the treatments with no addition, C addition, N addition and C and N addition at different ZnO NPs concentrations (0, 100, 500 and 1000 mg kg−1). Error bars represent the standard error of the mean (n = 3).
Figure 2.
Cumulative N2O emissions in the treatments with no addition, C addition, N addition and C and N addition at different ZnO NPs concentrations (0, 100, 500 and 1000 mg kg−1). Error bars represent the standard error of the mean (n = 3).

Figure 3.
AOA amoA (a), AOB amoA (b), nirK (c), nirS (d) and nosZ (e) genes under no addition, C addition, N addition, and C and N addition at different ZnO NPs concentrations (0, 100, 500 and 1000 mg kg−1). Error bars represent the standard error of the mean (n = 3).
Figure 3.
AOA amoA (a), AOB amoA (b), nirK (c), nirS (d) and nosZ (e) genes under no addition, C addition, N addition, and C and N addition at different ZnO NPs concentrations (0, 100, 500 and 1000 mg kg−1). Error bars represent the standard error of the mean (n = 3).


Figure 4.
RDA ordination diagram of the relationships between cumulative N2O emissions and soil chemical variables (DOC, NH4+, and NO3−) with functional genes related to N2O (AOA amoA, AOB amoA, nirK, nirS, and nosZ).
Figure 4.
RDA ordination diagram of the relationships between cumulative N2O emissions and soil chemical variables (DOC, NH4+, and NO3−) with functional genes related to N2O (AOA amoA, AOB amoA, nirK, nirS, and nosZ).

Figure 5.
Direct and indirect effects of ZnO NPs on N2O emissions in PLS-PM. The left figure (a) describes the relationships among ZnO NPs, soil NH4+, NO3−, nitrifiers and denitrifiers with respect to N2O emissions. Wider arrows indicate higher path coefficients, and orange and green colors indicate positive and negative effects, respectively. *, ** and *** indicate significance at p < 0.05, p < 0.01, and p < 0.001, respectively. The right figure (b) describes the standardized direct, indirect and total effects derived from the PLS-PM.


Table 1.
Main and interactive effects of C and N substrate amendments on soil N2O emission, DOC, NH4+ and NO3− contents and functional genes (AOA and AOB amoA, nirK, nirS and nosZ) related to N2O in the presence of ZnO NPs.
Table 1.
Main and interactive effects of C and N substrate amendments on soil N2O emission, DOC, NH4+ and NO3− contents and functional genes (AOA and AOB amoA, nirK, nirS and nosZ) related to N2O in the presence of ZnO NPs.
| Treatments | N2O Emission | DOC | NH4+ | NO3− | AOA amoA | AOB amoA | nirK | nirS | nosZ |
|---|---|---|---|---|---|---|---|---|---|
| C | *** | ** | * | *** | * | * | *** | *** | ** |
| N | *** | ns | ** | ** | ** | *** | ns | *** | *** |
| C × N | *** | ** | *** | *** | * | ns | ns | * | ** |
* p < 0.05, ** p<0.01, *** p < 0.001.
Table 2.
Soil DOC, NH4+, and NO3− contents at different ZnO NPs concentrations (0, 100, 500, and 1000 mg kg−1) in the treatments with no addition, C addition alone, N addition alone, and both C and N addition. Different letters indicate statistically significant differences (LSD, 5%).
Table 2.
Soil DOC, NH4+, and NO3− contents at different ZnO NPs concentrations (0, 100, 500, and 1000 mg kg−1) in the treatments with no addition, C addition alone, N addition alone, and both C and N addition. Different letters indicate statistically significant differences (LSD, 5%).
| Substrates | ZnO NPs Levels | DOC (mg C kg−1) | NH4+ (mg N kg−1) | NO3− (mg N kg−1) |
|---|---|---|---|---|
| No addition | 0 mg kg−1 | 34.13 ± 5.54 a | 1.43 ± 0.08 ab | 61.30 ± 1.56 a |
| 100 mg kg−1 | 41.65 ± 1.26 a | 1.15 ± 0.12 bc | 43.22 ± 0.35 b | |
| 500 mg kg−1 | 31.33 ± 2.38 a | 1.03 ± 0.10 c | 44.45 ± 0.64 b | |
| 1000 mg kg−1 | 34.08 ± 5.97 a | 1.55 ± 0.06 a | 37.43 ± 0.27 c | |
| C addition | 0 mg kg−1 | 45.68 ± 2.49 a | 1.57 ± 0.05 b | 31.03 ± 1.13 a |
| 100 mg kg−1 | 40.72 ± 1.46 a | 1.23 ± 0.11 b | 15.98 ± 0.05 c | |
| 500 mg kg−1 | 45.30 ± 10.26 a | 1.22 ± 0.16 b | 16.95 ± 0.25 c | |
| 1000 mg kg−1 | 40.88 ± 5.15 a | 2.23 ± 0.03 a | 19.70 ± 0.26 b | |
| N addition | 0 mg kg−1 | 33.97 ± 1.96 a | 24.78 ± 1.58 ab | 69.57 ± 0.38 a |
| 100 mg kg−1 | 35.85 ± 1.76 a | 17.18 ± 1.32 c | 65.52 ± 1.03 ab | |
| 500 mg kg−1 | 26.43 ± 3.80 a | 22.73 ± 1.38 bc | 58.55 ± 3.29 b | |
| 1000 mg kg−1 | 36.02 ± 3.64 a | 30.03 ± 1.95 a | 49.43 ± 0.62 c | |
| C and N addition | 0 mg kg−1 | 41.42 ± 3.51 a | 2.80 ± 0.12 bc | 64.45 ± 0.09 a |
| 100 mg kg−1 | 31.18 ± 3.63 a | 1.53 ± 0.08 c | 57.08 ± 0.31 b | |
| 500 mg kg−1 | 17.88 ± 2.83 b | 3.97 ± 0.24 b | 47.22 ± 0.54 c | |
| 1000 mg kg−1 | 12.87 ± 1.92 b | 15.10 ± 1.11 a | 43.62 ± 0.64 d |
Table 3.
Effect of ZnO NPs on soil DOC, NH4+, and NO3− contents and functional genes (AOA and AOB amoA, nirK, nirS and nosZ) related to N2O amendment with different substrates.
Table 3.
Effect of ZnO NPs on soil DOC, NH4+, and NO3− contents and functional genes (AOA and AOB amoA, nirK, nirS and nosZ) related to N2O amendment with different substrates.
| Treatments | DOC | NH4+ | NO3− | AOA amoA | AOB amoA | nirK | nirS | nosZ |
|---|---|---|---|---|---|---|---|---|
| No addition | Ns | * | *** | * | ** | ns | * | Ns |
| C addition | Ns | ** | ** | ** | ns | ns | ns | Ns |
| N addition | Ns | * | *** | ns | ns | ns | * | Ns |
| C AND N addition | ** | *** | *** | *** | *** | ns | ** | *** |
* p < 0.05, ** p < 0.01, *** p < 0.001.
Publisher’s Note: MDPI stays neutral with regard to jurisdictional claims in published maps and institutional affiliations. |
© 2021 by the authors. Licensee MDPI, Basel, Switzerland. This article is an open access article distributed under the terms and conditions of the Creative Commons Attribution (CC BY) license (https://creativecommons.org/licenses/by/4.0/).
Share and Cite
MDPI and ACS Style
Feng, Z.; Yu, Y.; Yao, H.; Ge, C. Effect of Zinc Oxide Nanoparticles on Nitrous Oxide Emissions in Agricultural Soil. Agriculture 2021, 11, 730. https://0-doi-org.brum.beds.ac.uk/10.3390/agriculture11080730
AMA Style
Feng Z, Yu Y, Yao H, Ge C. Effect of Zinc Oxide Nanoparticles on Nitrous Oxide Emissions in Agricultural Soil. Agriculture. 2021; 11(8):730. https://0-doi-org.brum.beds.ac.uk/10.3390/agriculture11080730
Chicago/Turabian StyleFeng, Ziyi, Yongxiang Yu, Huaiying Yao, and Chaorong Ge. 2021. "Effect of Zinc Oxide Nanoparticles on Nitrous Oxide Emissions in Agricultural Soil" Agriculture 11, no. 8: 730. https://0-doi-org.brum.beds.ac.uk/10.3390/agriculture11080730
Note that from the first issue of 2016, this journal uses article numbers instead of page numbers. See further details here.