Article

Light Interception and Radiation Use Efficiency of Cassava under Irrigated and Rainfed Conditions and Seasonal Variations

by
Supattra Mahakosee
1,
Sanun Jogloy
1,2,
Nimitr Vorasoot
1,
Piyada Theerakulpisut
3,
Carl Corley Holbrook
4,
Craig K. Kvien
5 and
Poramate Banterng
1,*
1
Department of Agronomy, Faculty of Agriculture, Khon Kaen University, Khon Kaen 40002, Thailand
2
Peanut, Jerusalem Artichoke, and Cassava Improvement Research Group, Khon Kaen 40002, Thailand
3
Department of Biology, Faculty of Science, Khon Kaen University, Khon Kaen 40002, Thailand
4
USDA-ARS, Crop Genetics and Breeding Research Unit, Coastal Plain Experimental Station, Tifton, GA 31793, USA
5
Crop & Soil Sciences, The University of Georgia, Tifton, GA 31793, USA
*
Author to whom correspondence should be addressed.
Submission received: 28 April 2022 / Revised: 14 May 2022 / Accepted: 20 May 2022 / Published: 21 May 2022

Abstract

:
Determining the effect of irrigated and rainfed conditions on light interception, light extinction coefficient (k), radiation use efficiency (RUE), biomass, and storage root accumulation of cassava was the objective of this study. The field experiment was arranged in a randomized complete block design (RCBD) with four replications. The effect of irrigated and rainfed water conditions in cassava were evaluated under two planting dates for two years. Light interception depended on k and LAI which affected solar radiation accumulation and thus biomass production for cassava. The k values ranged from 0.49 to 0.93 a nd 0.46 to 0.86 for irrigated and rainfed crops, respectively. The RUEbi and RUEsr depended on water conditions and crop growth stages and seasons, whereas rainfed crops in the May planting were slightly lower in RUEbi than irrigated crops. RUEbi of the crop planted in November was not significantly different for irrigated and rainfed crops. Irrigation at the late growth stage could maintain higher LAI, light interception, and RUE for the crop planted in May, whereas those in November planting were not significantly different.

1. Introduction

Radiation use efficiency (RUE) relates biomass accumulation to the amount of intercepted photosynthetically active radiation (PAR) [1] and is often used to estimate biomass accumulation in crops such as maize and soybean [2,3], wheat [4], rice [5], cotton [6], and cassava [7,8]. RUE is dependent on light intensity which varies by season, latitude, cloud cover, and plant canopy architecture (leaf position, leaf shape, leaf size, leaf arrangement, LAI, and leaf angle) [9].
Another useful measurement related to energy capture is the light interception of a crop-stand. The distribution of leaf angle and leaf arrangement are important for light interception of crop-stands, which is determined by the extinction coefficient (k). The k takes values in term of leaf angle; a horizontal leaf implies a high k value (>0.5), whereas erectofila distribution implies a low value of k [10]. Variation in both RUE and k is dependent on crop species, location, and growing environment including temperature, nutrients, and water status [10,11]. RUE values have been measured in oil crops (1.3–1.6 g MJ−1), legumes (1.0–1.2 g MJ−1), and tuber and root crops (1.6–1.9 g MJ−1) [12,13,14,15].
Cassava (Manihot esculenta Crantz) is a root crop rich in carbohydrates, most often grown in the tropical and sub-tropical regions (∼30° N to ∼30° S) of the world including Africa, Asia, and Latin America. Although cassava can be grown all months of the year in Southeast Asia, the most popular planting dates are in the early rainy season (April–June, approximately 70%), and the late rainy season (October–December, 30%) [16]. Cassava production in Southeast Asia is generally under rainfed conditions and suboptimal in rainfall amounts and distribution. Typically, the soils are sandy with low soil fertility. Therefore, crops planted at different planting dates are subjected to drought in the different growth stages which cause yields loss in cassava [17,18]. Previous reports demonstrated that irrigation could increase crop yield by helping maintain the plant canopy [17,18,19]. The different climatic factors and drought during the crop growing cycle affect canopy development, leaf size, and the rate of leaf emergence, and might also affect light interception, k, RUE, and crop yield of cassava [7,17,20,21,22,23]. However, the appropriate canopy with good leaf position and leaf arrangement allows light to penetrate to the lower part of the canopy, and this increases the intercepted light area and the amount of light interception. In cassava, k values, which refer to leaf arrangement in the canopy, have been reported as 0.50–0.78 depending on variety and fertilizer management [7]. k values ranging from 0.60 to 0.88 have been reached with a full canopy [23,24,25]. The difference in k values is an important reason for the difference in available light in the canopy and the ability of the crop canopy to intercept light, which affects the variation in RUE [10,11]. However, most reports for RUE in cassava are related to fertilizer applications. Pellet and El-Sharkawy [7], reported that the RUE increased from 1.15 to 2.30 g MJ−1 after the application of fertilizer. Ezui et al. [26] showed that potassium applications could increase the RUE in cassava, and the average RUE across the cropping season was reported as 1.16 g MJ−1. However, there are very few reports on the response of cassava to light interception, RUE, and k with different planting dates and water conditions. The aim of this study was to determine the effect of irrigated and rainfed conditions on light interception, k, and RUE of cassava under seasonal variations. The information created in this study will help producers select the best planting dates and water management strategies for light interception, RUE, and yield.

2. Materials and Methods

2.1. Experimental Design and Study Sites

Field experiments were conducted at the Field Crop Research Station of Khon Kaen University, Thailand (lat. 16°28′ N, long. 102°48′ E, 200 m above mean sea level) from 2015 to 2016 and 2016 to 2017. Rayong 9, a non-forking cassava variety from the Department of Agriculture Thailand was used in this study. A randomized complete block design (RCBD) with four replications was conducted for testing the effects of rainfed and irrigated water conditions under seasonal variations (two growing seasons (planting dates) in two years). The May planting dates represent the early rainy season, and the November plantings represent the dry season. Plot size was 7 × 28 m2, plant spacing was 1 m between rows, and 1 m between plants within rows. Before planting, soil hardpans were broken at 30–60 cm depth using a deep chisel plow and then ridged with 1 m between rows. Sunn hemp (Crotalaria juncea L.) was grown as green manure in the season before planting, and cattle manure at the rate of 6250 kg ha−1 was applied prior to planting.
Cassava stems were selected for health and uniformity from a multiplication field, cut into 20 cm long sections, and then soaked in thiamethoxam (3-(2-chloro-thiazol-5-ylmethyl)-5-methyl-(1,3,5)-oxadiazinan-4-ylidene-N-nitroamine 25% WG) at the rate of 4 g 20 L−1 water, for 20 min, to prevent pink mealybug (Phenacoccus manihoti Matile-Ferrero) infestations. The stalks were then incubated in a gunnysack for 3 days before planting. During planting, single stalks were buried to half their length on the ridge row. An overhead sprinkler irrigation system supplied water during early crop establishment (the first 30 days after planting) in both irrigated and rainfed conditions. Tensiometers were installed in the experimental field at 20 and 40 cm soil depth for monitoring soil suction in the field. The crops under irrigated conditions were maintained at soil suction above −30 kPa from planting until harvest. Irrigation was stopped when the level of water tension at 20 cm was between −10 and 0 kPa. The frequency and amount of water supplied in each time and each crop were different. The amount of water in each time were measured by the catch-can method and calculated in mm units. Weeds were controlled by hand weeding at 1 and 2 months after planting (MAP). Fertilizers were applied twice during the growing season, and were based on soil analysis as recommended by Howeler [27] at 1 MAP and fertilizer formula 15:7:18 of N:P2O5:K2O was applied at the rate of 312.5 kg ha−1 at 2 MAP. Plots were treated for pests and disease control as necessary.

2.2. Data Collection

2.2.1. Weather Conditions

Weather data collected included, minimum and maximum temperature, daily rainfall, relative humidity, and photosynthetically active radiation (PAR, 400–700 nm). These data were recorded using an automatic data logger (Watch Dog 2700) (Watchdog, PCE group, PCE Germany, Meschede, Germany) that was installed in the experimental field. Daily solar radiation was calculated by daily PAR multiplied by 2 and converted to MJ m−2 day−1 [28]. Maximum and minimum temperatures for cassava planted in May 2015 ranged from 16.4 to 43.9 °C, and from 8.9 to 29.5 °C, respectively, and relative humidity ranged from 22.9 to 92.8%. For November 2015, the minimum temperature was 8.9 to 29.5 °C, the maximum temperature was 16.8 to 43.9 °C, and relative humidity ranged from 22.9 to 92.3%.
For the May 2016 planting date, the maximum and minimum temperatures ranged from 24.5 to 39.8 °C, and from 14.0 to 27.3 °C, respectively. Relative humidity was 33.0 to 92.3%. For the November 2016 planting date, the maximum and minimum temperatures ranged from 24.5 to 39.8 °C, and 14.0 to 27.3 °C, respectively, and relative humidity ranged from 33.0 to 99.6%. The average of each climatic factor is presented in Table 1.
The total amounts of rainfall for the crops planted in May 2015 and 2016 were 883 mm and 1176 mm, respectively (Table 1). However, the true rainy season started in mid-May and stopped in mid-October. The dry period occurred from October to mid-May (7–12 MAP) with total rainfall of 151.4 mm for the May 2015 planting. The amount of rain during the dry season for the May 2016 planting was 195.0 mm. Water supplied to the crops planted in May 2015 and 2016 was 25.5 and 44.8 mm, respectively.
The crops planted in November 2015 and 2016 were subjected to dry periods at the early growth stage (1–6 MAP), with rainfall during dry season being 116.6 and 86.8 mm, respectively. The amount of rainfall throughout the crop cycles was 1122 mm and 1469.3 mm, respectively. Water supply to the crops planted in November 2015 and 2016 was 37.7 and 46.9 mm, respectively.
The solar radiation from planting to harvest in May 2015 ranged from 6.4 to 25.4 MJ m−2 d−1, and total solar radiation was 6268.7 MJ m−2. For the crops planted in November 2015, solar radiation ranged from 5.4 to 24.5 MJ m−2 d−1 with a total of 6093.0 MJ m−2. In 2016, the May planting solar radiation ranged from 5.4 to 24.5 MJ m−2 d−1 and the total solar radiation was 6120.0 MJ m−2 and the November planting ranged from 7.7 to 24.8 MJ m−2 d−1, the total amount of solar radiation was 5974.5 MJ m−2.

2.2.2. Soil Physical and Chemical Properties

The soil samples (taken from the top 30 cm) were analyzed for soil physical and chemical properties. All experimented plots were in the Yasothon soil series (Oxic Paleustult), which is loamy sand and sandy loam. Soil pH ranged from 7.01 to 7.41 except for the November 2015 planting date where the soil pH ranged from 6.27 to 6.50. The soil of the four planting dates had low organic matter (0.44–0.53%), total nitrogen (0.013–0.037%) and exchangeable potassium (30.8–54.6 mg kg−1). Available phosphorus in all field experiments ranged from 51.6 to 88.5 mg kg−1, which was higher than the critical level of available phosphorus (4–6 mg kg−1) for cassava [27].

2.2.3. Light Interception and Cumulative Solar Radiation

Light interception is defined by light penetration through the plant canopy. PAR was measured above and below the canopy (under the plant and between row) using a 1.0 m line quantum sensor (Licor 191) and data logger (LI-1500, LI-COR). A set of data consisted of three measurements taken three times per plot. The data were recorded under clear sky conditions at near-noon (11.30 am–1.00 pm) at monthly intervals beginning 1 MAP until harvest (12 MAP). Light interception percentages were calculated as (PAR (at above canopy)–PAR (average below the canopy)) × 100 divided by PAR (at above canopy).
Solar radiation interception was calculated by the amount of solar radiation (MJ m−2), recorded by the weather station, multiplied by the light interception percentage in each month’s measurement. The cumulative solar radiations were summarized from planting to harvesting date in each planting date.

2.2.4. Leaf Area Index (LAI) and Extinction Coefficient (k)

LAI in each plot was measured in one-month intervals within a 6 × 7 m2 central area of the plot using the LAI-2000 Plant Canopy Analyzer (LI-COR, Lincoln, NE) under overcast and/or clear sky conditions three times in each plot, and then data from three values for each plot were averaged according to the instructions described in the LAI-2000 user manual [29]. The relationships between LAI and light penetration were used to determine the k of crop canopy using the equation proposed by Monsi and Saeki [30].
I = Io × ek× LAI
where I is the PAR light received at below canopy, Io is the PAR light above the crop canopy, and k is the extinction coefficient, which indicates the arrangement of the leaves in a canopy [10,31].

2.2.5. Total Biomass and Storage Root Dry Weight

Biomass and storage root dry weights were recorded from six plants in the sampling area (6 m2) of each plot at one-month intervals beginning one month after planting and continuing to harvest for the 2015 crops planted in May and November. However, for both planting dates in 2016, the data for biomass and storage root dry weight were recorded eight times at 1, 3, 4, 6, 8, 9, 10, and 12 MAP. At the final harvest (12 MAP), the data were recorded from 18 plants (18 m2) in each plot. The plant samples in each sampling date were separated into leaf, petioles, stems, and storage roots. The total fresh weight of each plant part was recorded immediately and then a subsample of more than 10% for each plant part was oven-dried at 80 °C for 72 h or until the weight was constant, to determine dry weight. Storage root dry weight of each plot was recorded and total biomass in each plot was calculated.

2.2.6. Radiation Use Efficiency (RUE)

The RUE for both biomass and storage root dry weight in each growth stage was considered. The RUE of each subplot, in 3 month intervals, represents the beginning of shoot and root (0–3 MAP), canopy development (4–6 MAP), storage root accumulation (7–9 MAP), and dormancy (10–12 MAP) [32]. RUE was calculated as biomass or storage root dry weight (g m−2) divided by the amount of solar radiation intercepted (MJ m−2) by the canopy of each subplot in each sampling time.

2.3. Statistical Analysis

The data of RUE for each planting date and each year were analyzed following an RCBD and combined analyses with homogeneity of error variance were tested for all growth stages, planting dates, and years. Mean comparisons based on the least significant difference (LSD) were conducted for all growth stages, planting dates, and years, using Statistix 10. Regression analysis was carried out to determine the relationship between light interception and LAI. The k was determined by the relationship between ln(I/Io) and LAI.

3. Results

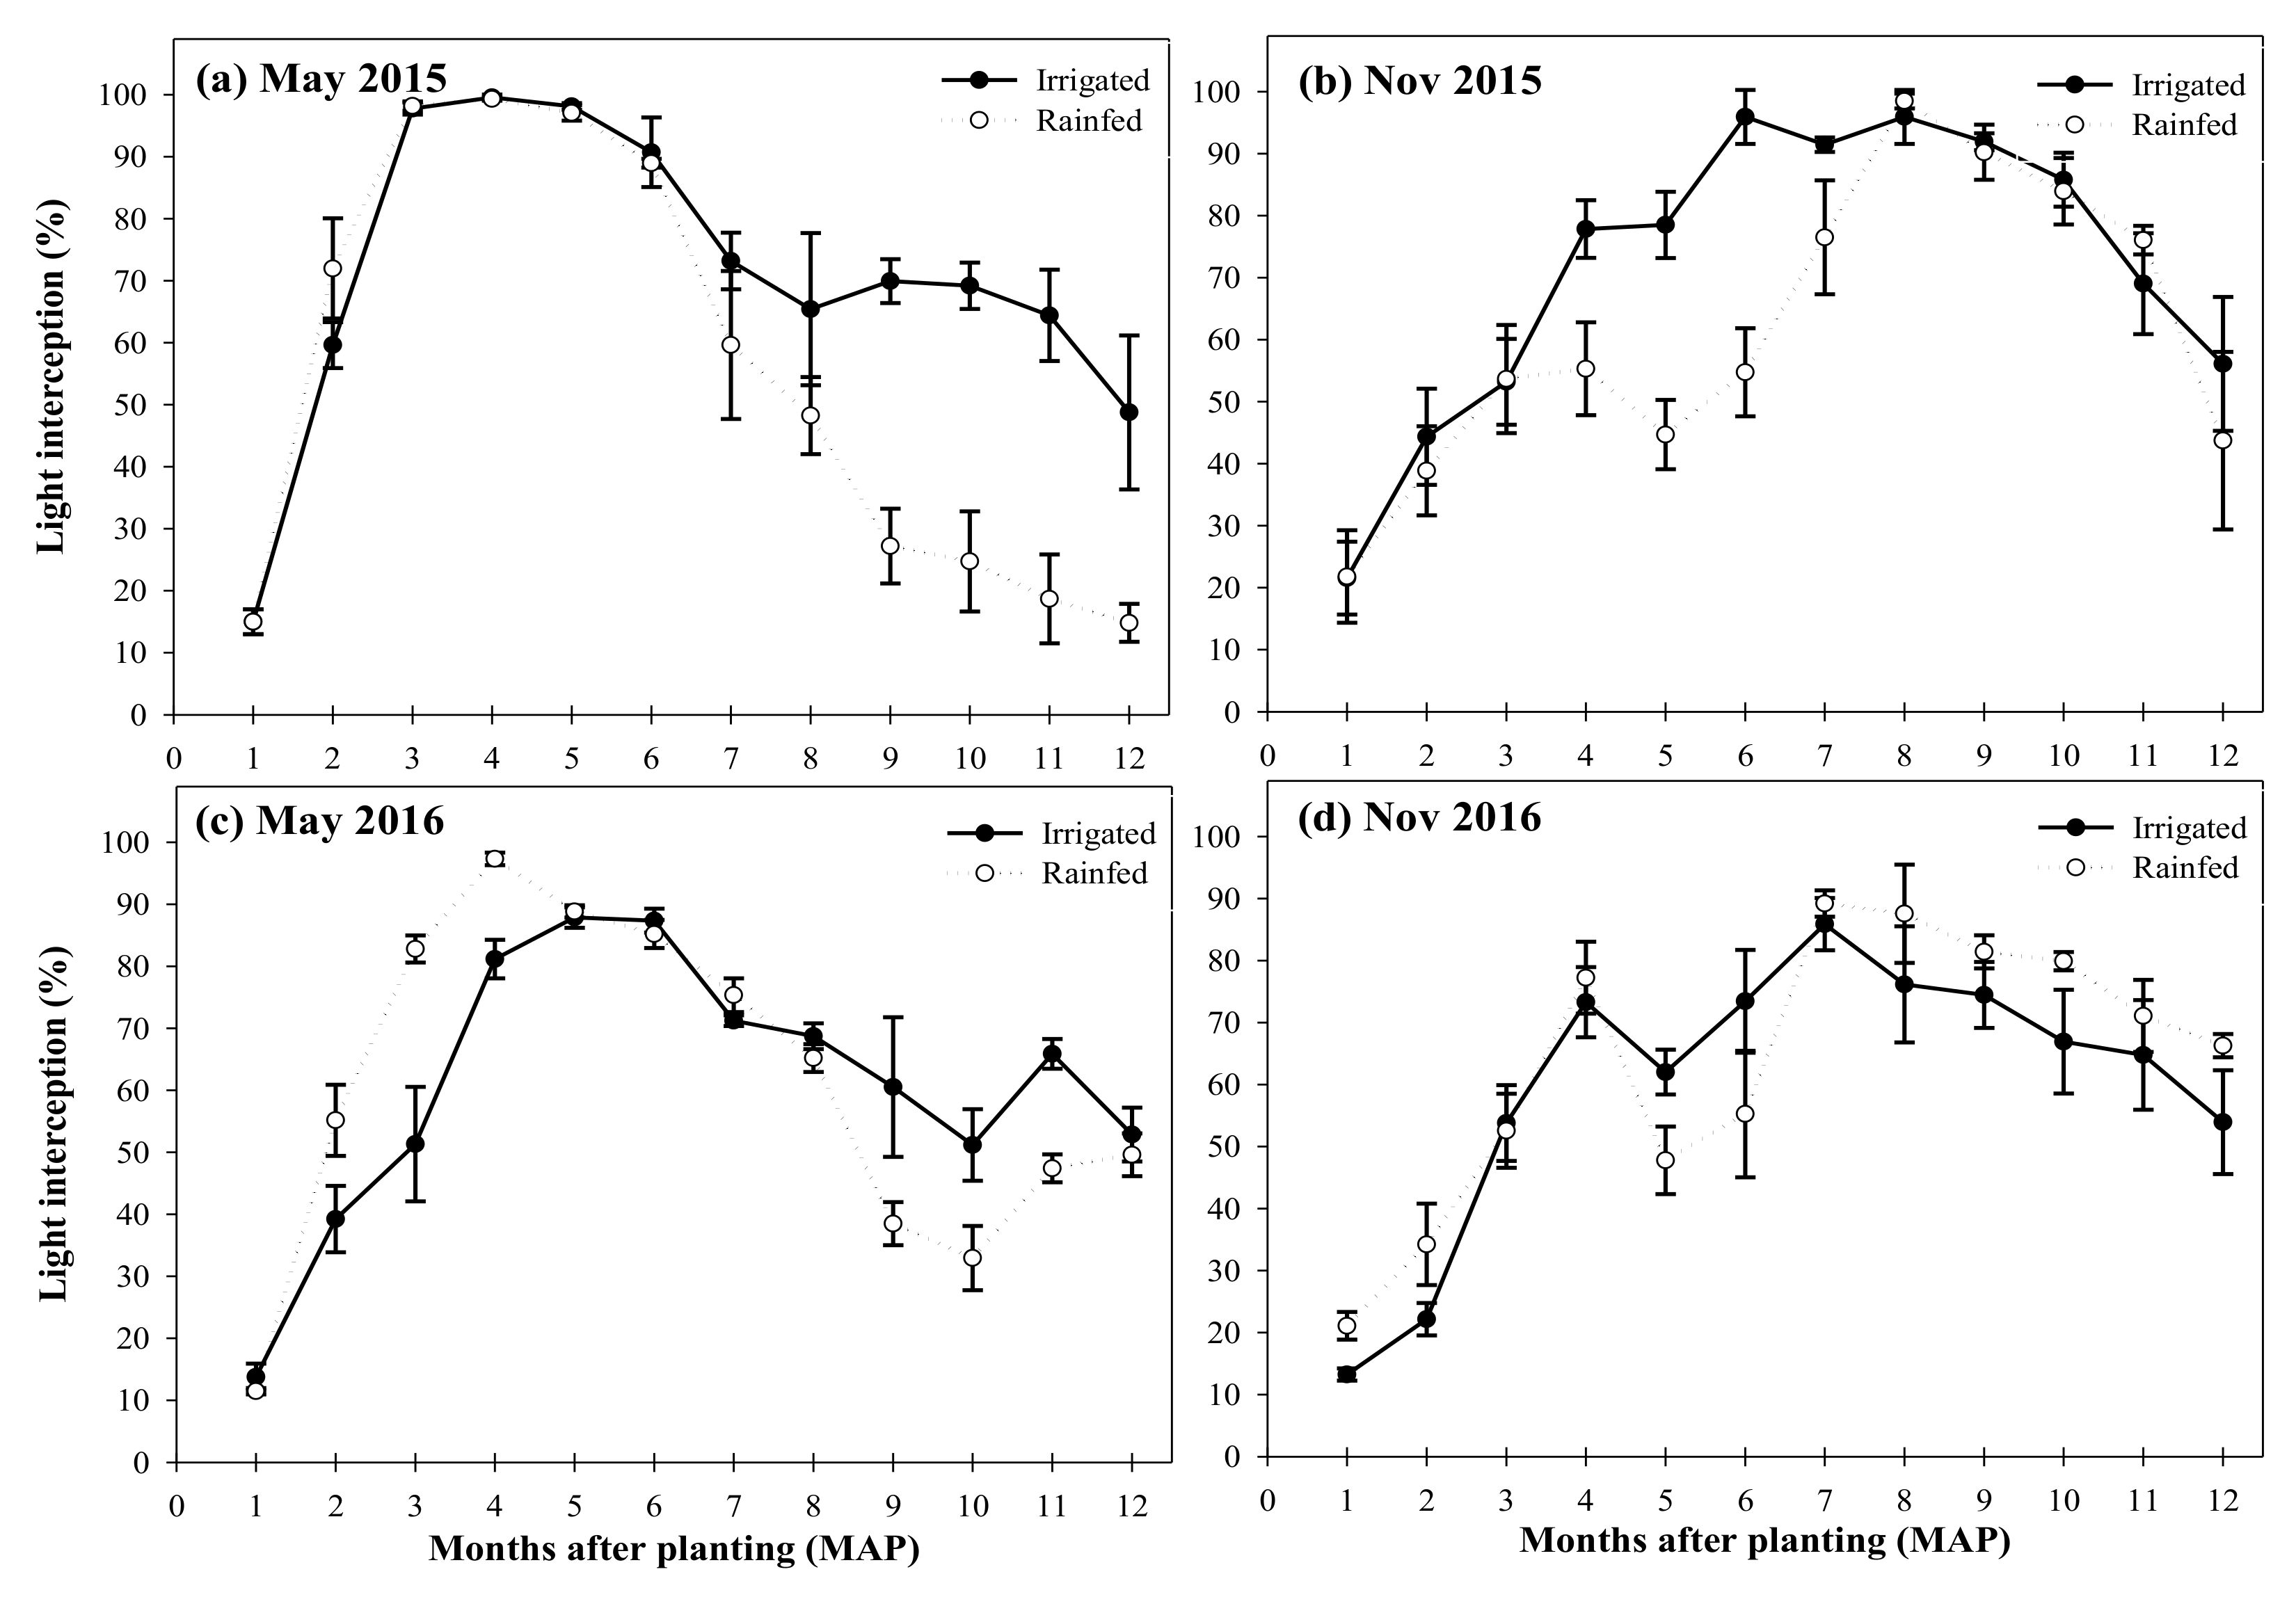
3.1. Light Interception

Light interception (defined as light penetration through the plant canopy) within the rainfed and irrigated crops had similar patterns for May and November plantings exclusive of the dry periods. For the crops planted in May 2015, the light interception both of rainfed and irrigated crops peaked at 3–5 MAP and declined after 6 MAP (Figure 1a). Yet for the crops planted in May, decline in light interception for crops under irrigated conditions was significantly slower than for crops planted in rainfed conditions after 6 MAP. For the crops planted in November 2015, both rainfed and irrigated crops increased in light interception from 1 MAP until 8 MAP, whereas rainfed crops had lower light interception than irrigated crops during the dry season (4–7 MAP) (Figure 1b). However, the percentage of light interception of both rainfed and irrigated crops in the November plantings was not significantly different during the rainy season (8–12 MAP). The pattern of light interception of the crops planted in May 2016 was similar to that of the crops planted in May 2015; the highest percentage of light interception for rainfed crops was found at 4 MAP, while for the irrigated crops, it was shown at 5–6 MAP (Figure 1c). The rainfed crops showed lower light interception than the irrigated crops during 9–11 MAP. For the crops planted in November 2016, light interception of rainfed crops was lower than that of irrigated crops at 5–6 MAP. After that, during the rainy season, rainfed crops seemed to have higher light interception than irrigated crops until harvest (Figure 1d).

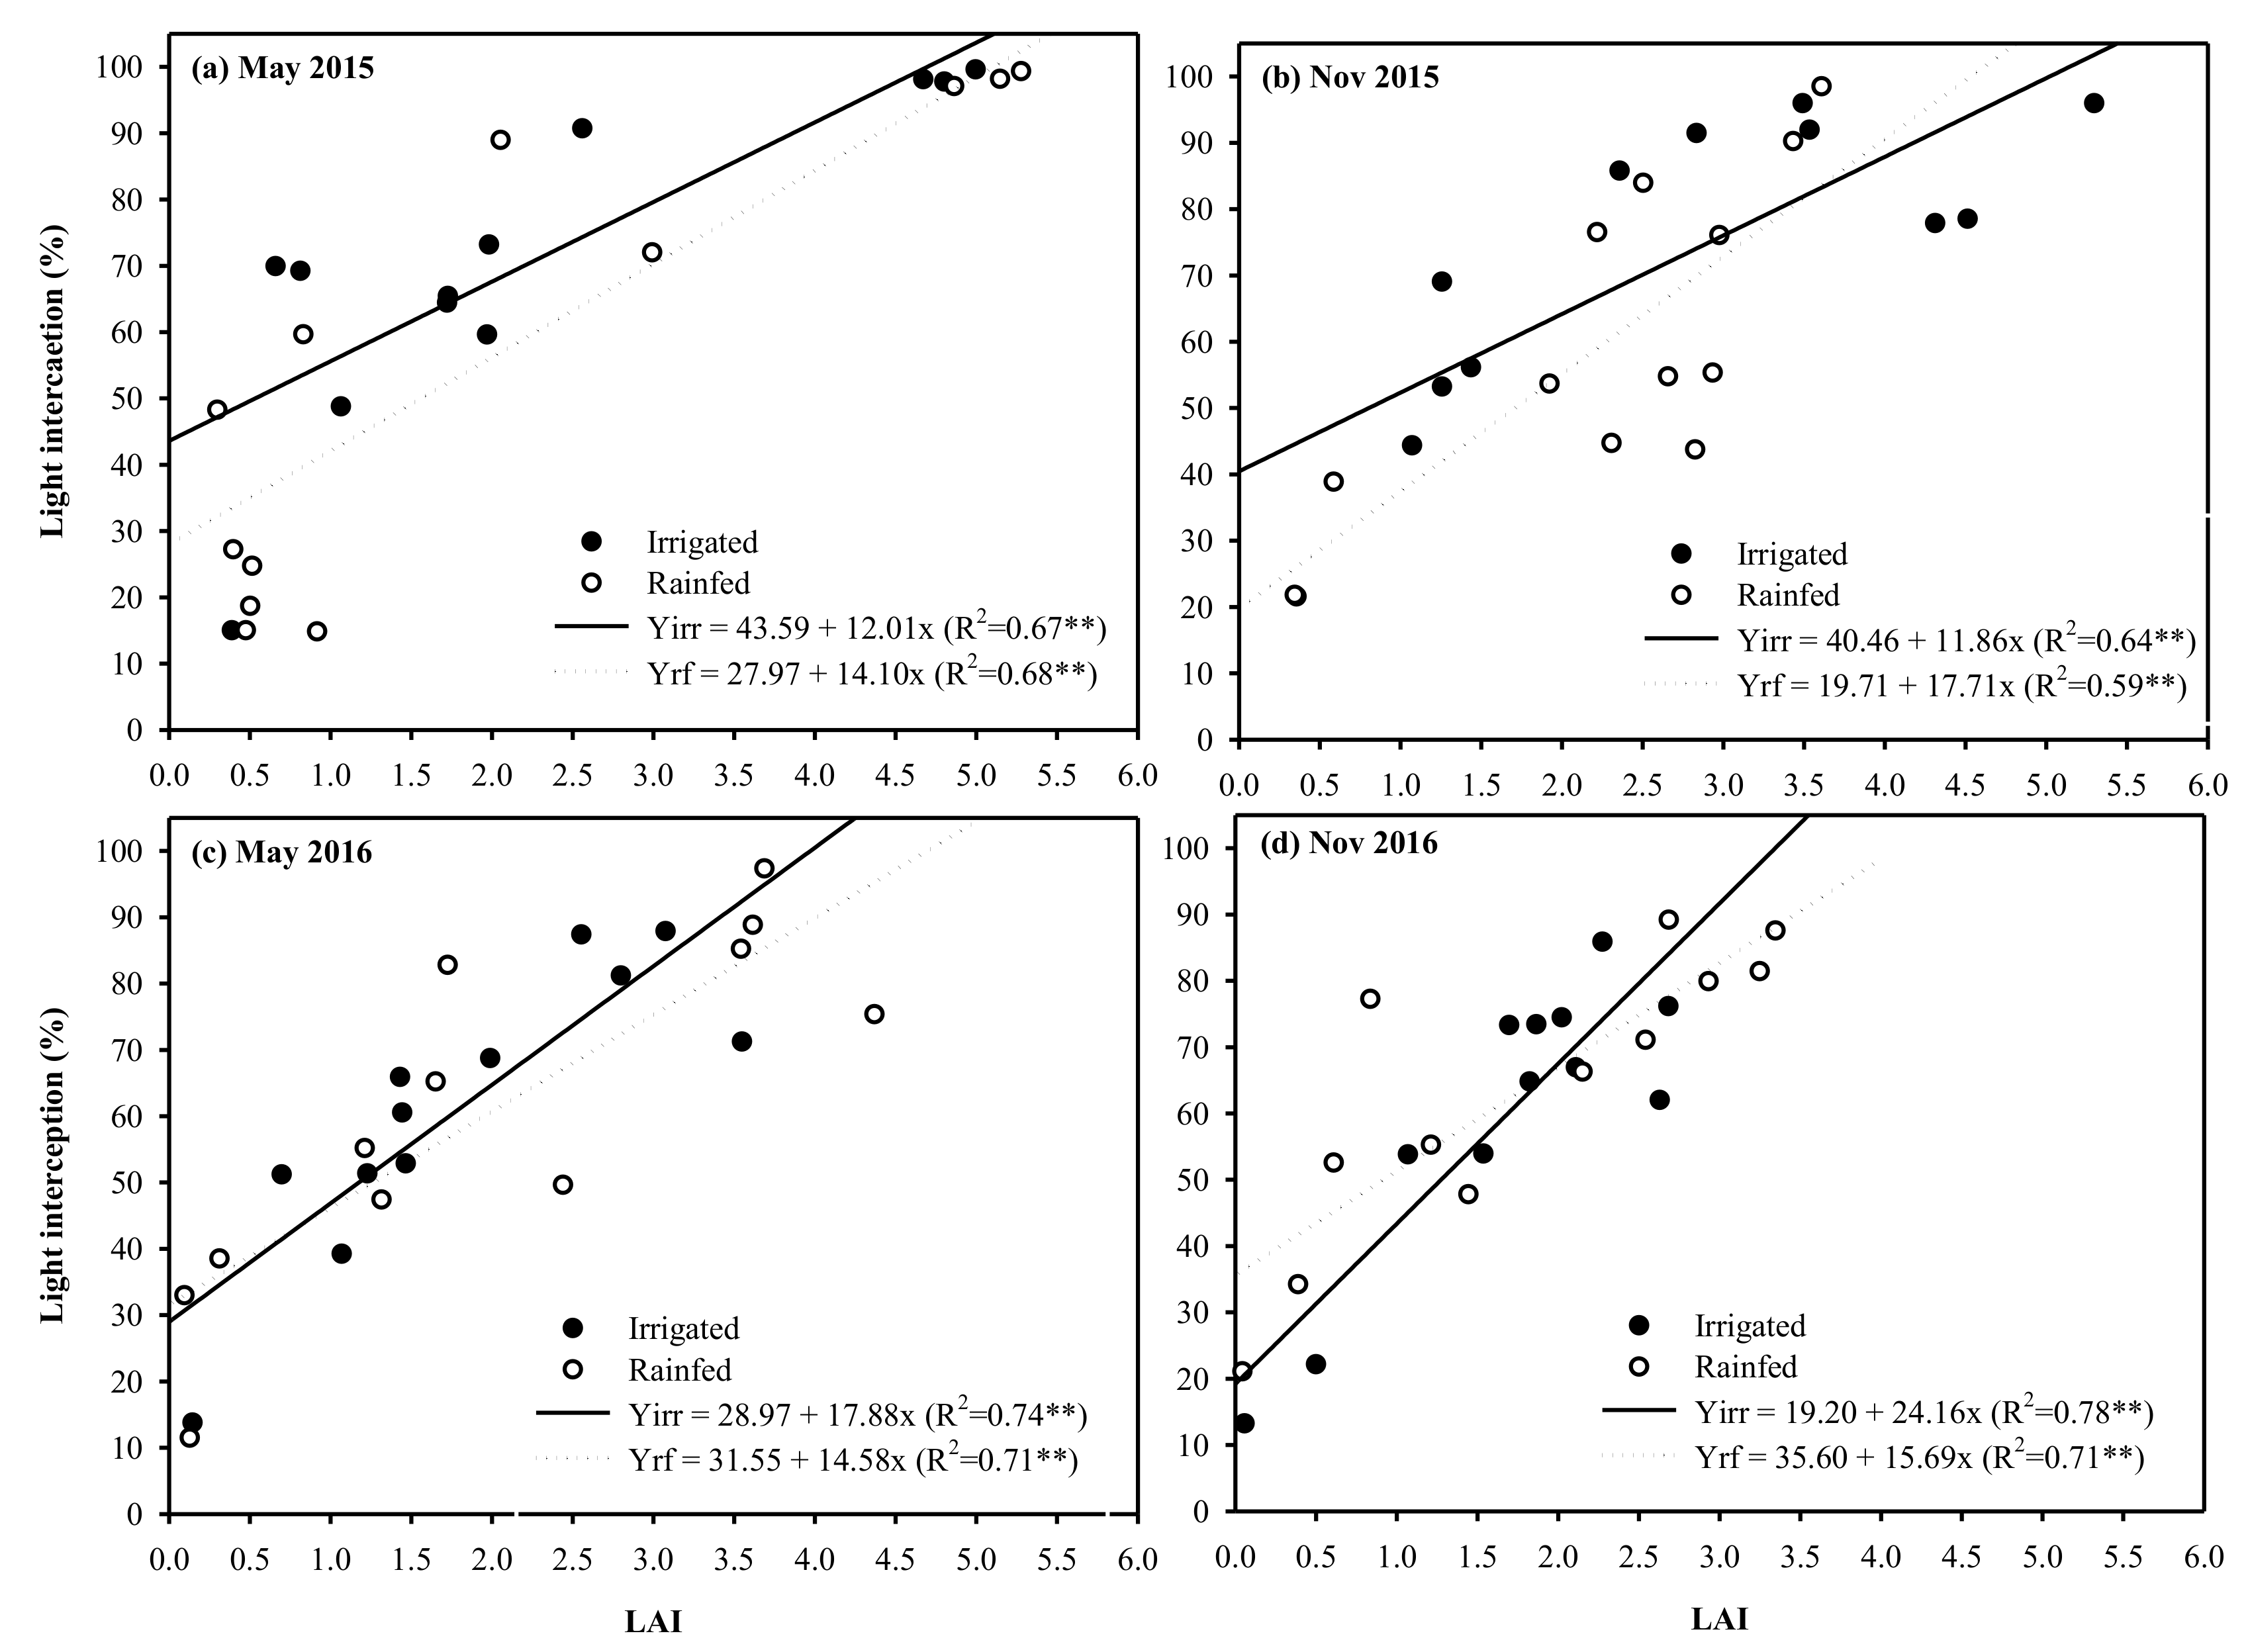
3.2. Leaf Area Index and Light Interception

Linear regressions were performed to explain the relationship between LAI and light interception (Figure 2a–d). Light interception increased with increase in LAI—in May 2015, LAI was increased by 1 unit and light interception was increased by 12.01% for irrigated crops and 14.10% for rainfed crops. In addition, in the November 2015 planting, crops under rainfed conditions had a higher light interception percentage (17.71%) than the irrigated crops (11.86%) when LAIs increased by 1 unit. However, in both May 2016 and November 2016 plantings, the irrigated crops had a higher light interception percentage than the rainfed crops when LAIs increased 1 unit.

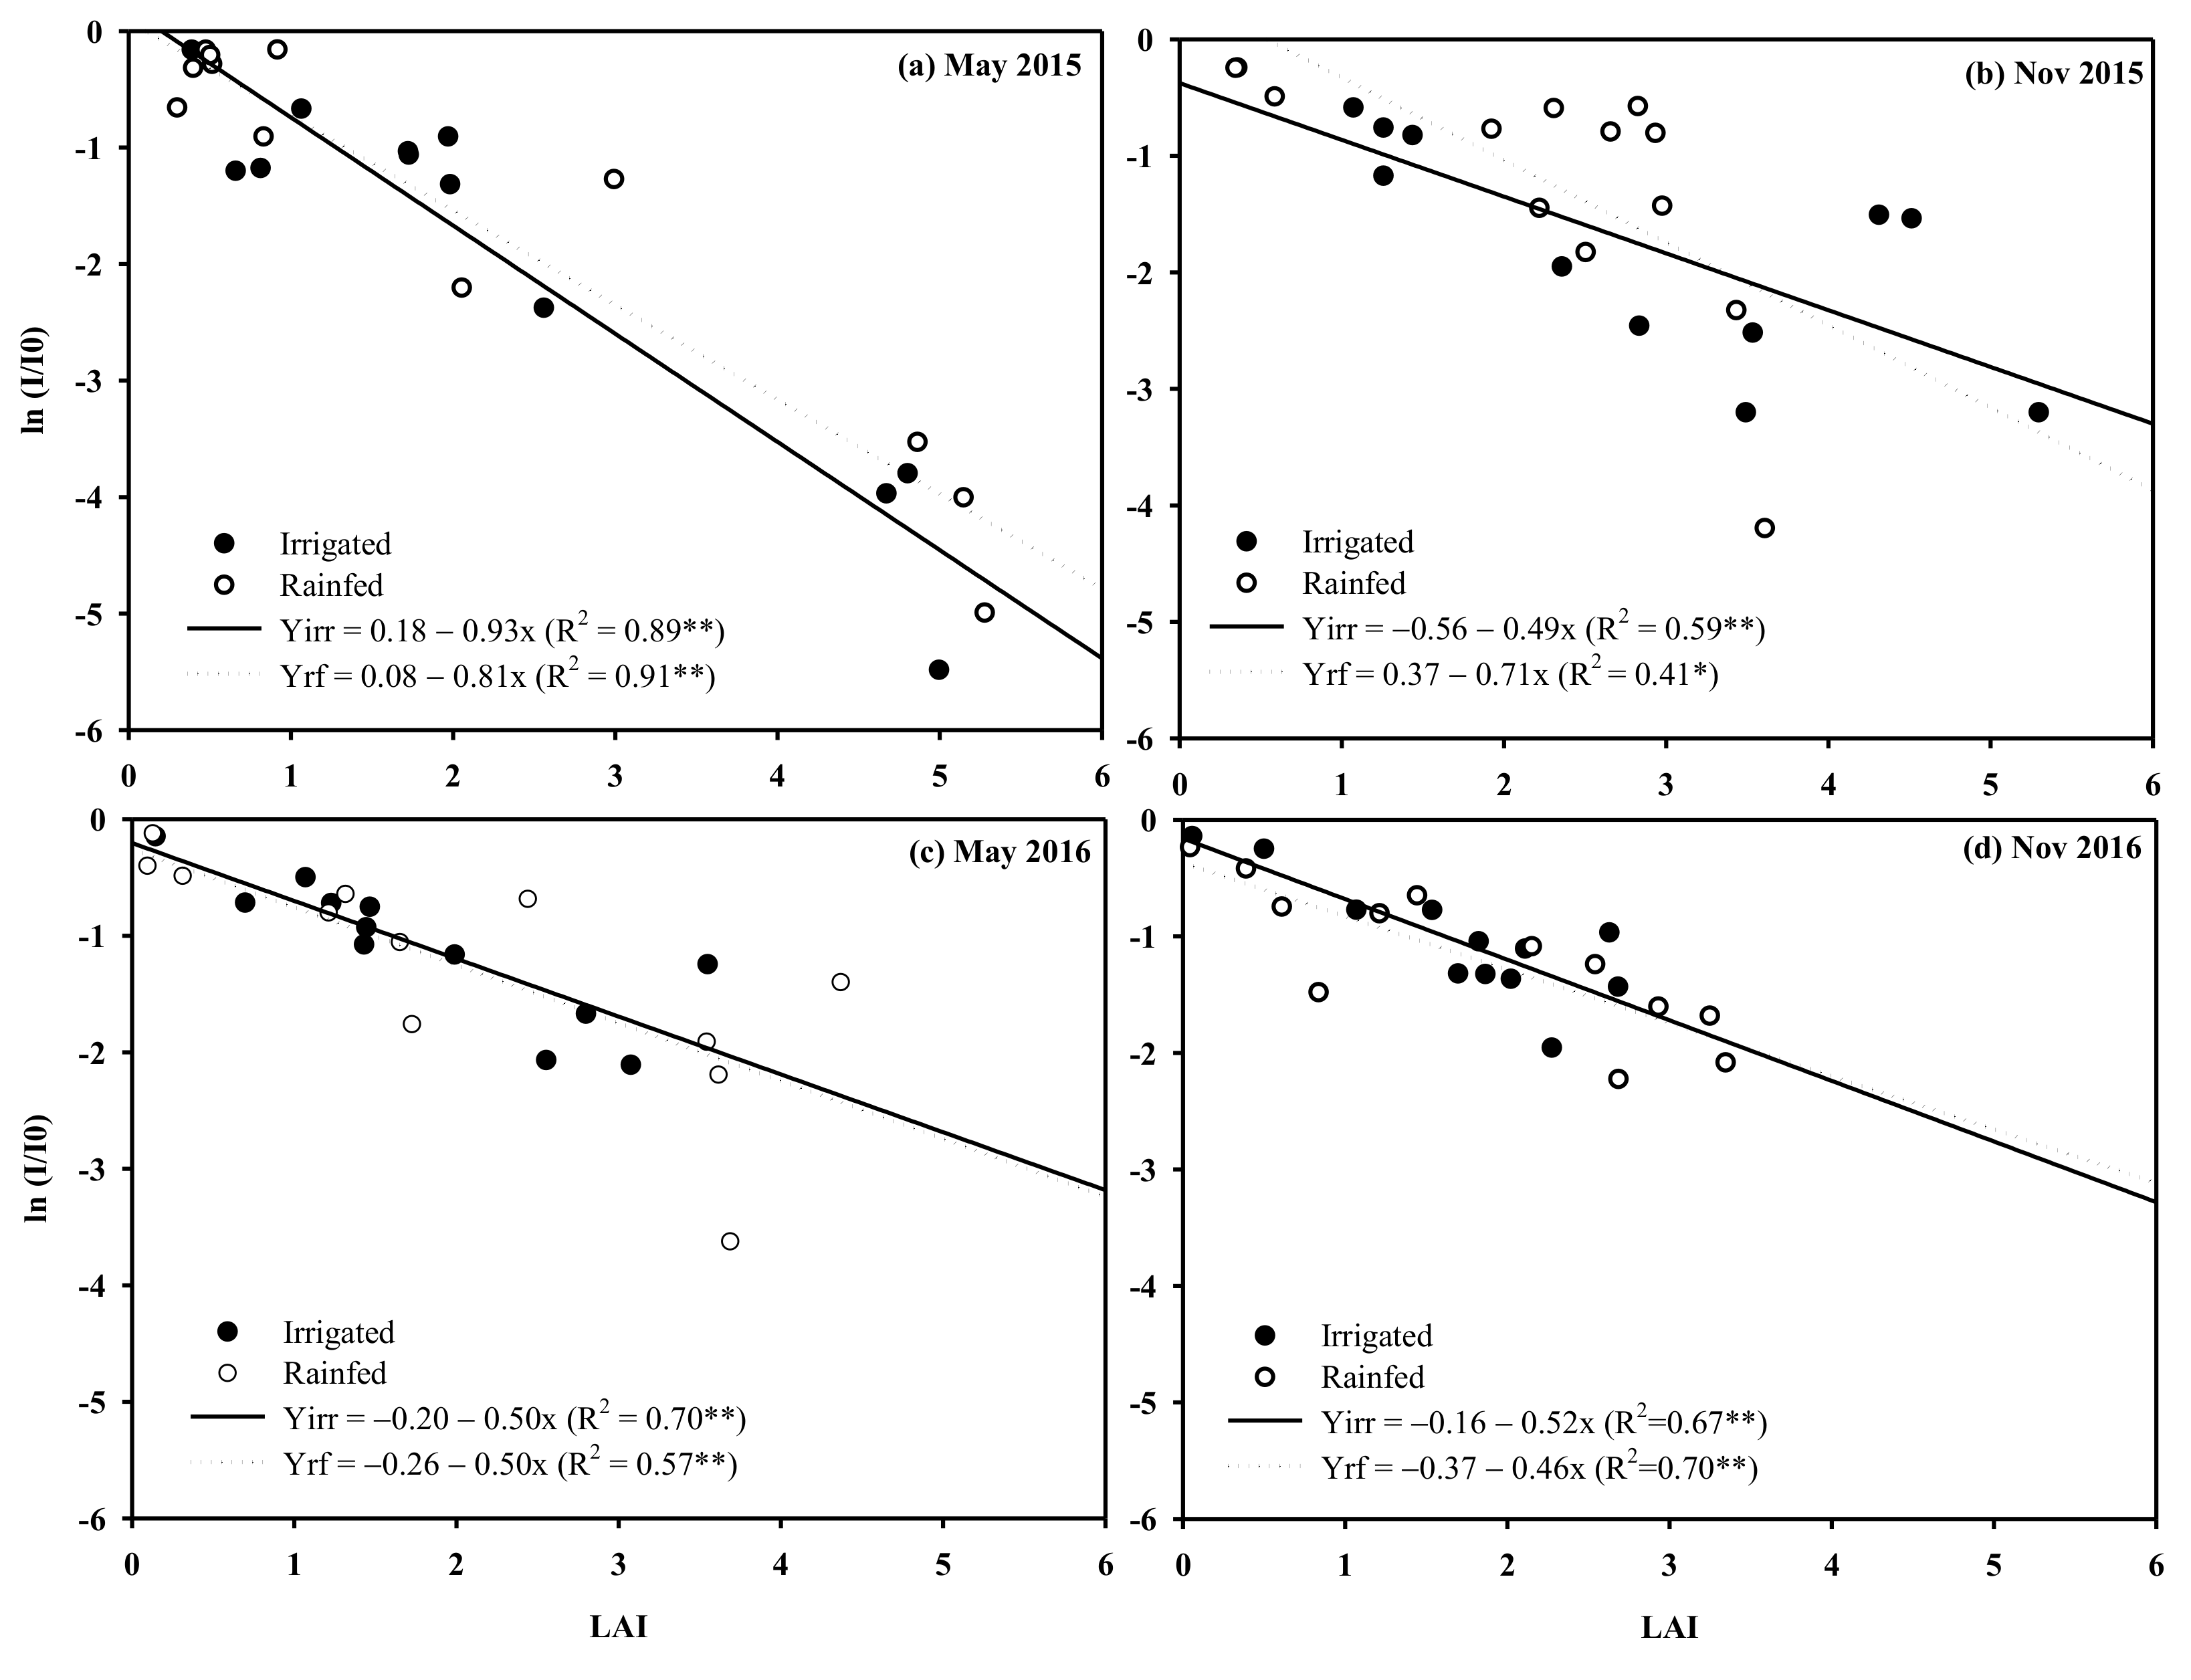
3.3. Extinction Coefficient (k)

The relationships between LAI and ln(I/Io) were used to determine the k of crop canopy and the slope of regression explained the distributions of leaf angles. In this study, the k ranged from 0.46 to 0.93. For the crops planted in May 2015, the estimated k values were 0.93 and 0.81 for irrigated and rainfed crops, respectively, with a high R2 (0.89–0.91) (Figure 3a). However, the crops planted in November under irrigated conditions showed a smaller k value (0.49) than the crops under rainfed conditions (0.71) (Figure 3b). In the May 2016 crops, the k values of the irrigated and rainfed crops were not significantly different, both conditions had 0.5 values (Figure 3c). Similar to the May 2016 crops, the November 2016 crops under both irrigated and rainfed conditions showed slightly different k values, with 0.52 for irrigated crops and 0.46 for rainfed crops (Figure 3d).

3.4. Cumulative Solar Radiation Interception

The solar radiation intercepted by the crops planted under irrigated and rainfed conditions for each growth stage (three-month intervals) at the different planting dates is shown in Table 2. Solar radiation interception ranged from 314 to 1434 MJ m−2. Among seasons and water variation, solar radiation interception had no significant difference for almost all the crop growth stages except for 10–12 MAP, whereas the crops planted in November under rainfed conditions in both 2015 and 2016 had the highest solar radiation interception (1264 and 1236 MJ m−2, respectively). Significant differences among growth stages within irrigated and rainfed crops for all planting dates were observed. The crops planted in May 2015 and 2016 showed the highest solar radiation interception during 4–6 MAP for both irrigated and rainfed conditions. In the November plantings, both rainfed and irrigated conditions had higher solar radiation interception during the storage root accumulation stage (7–9 MAP), and the crops under rainfed conditions also maintained higher solar radiation interception continuing to 10–12 MAP.

3.5. Radiation Use Efficiency for Total Biomass (RUEbi)

Radiation use efficiency for biomass (RUEbi) was calculated as total dry matter accumulation at 0–3, 4–6, 7–9, and 10–12 MAP divided by cumulative solar radiation during that time. RUEbi ranged from 0.22 to 1.64 g MJ−1 for irrigated crops and 0.19 to 1.60 g MJ−1 for rainfed crops (Table 3). Among seasons and water conditions, RUEbi was significantly different during 4–6 and 7–9 MAP, whereas, during 0–3 and 10–12 MAP, RUEbi was not significantly different. During 4–6 MAP, the crops planted in May 2016 showed the highest RUEbi for both irrigated and rainfed conditions. However, only the November 2015 planting date showed a significant difference for RUEbi between irrigated and rainfed crops, whereas irrigated crops (1.29 g MJ−1) had higher RUEbi than the crops under rainfed condition (0.68 g MJ−1). For the crops planted in May 2015, during 7–9 MAP the irrigated crop had higher RUEbi than the rainfed crops.
Among crop growth stages, a significant difference in RUEbi was observed in both irrigated and rainfed conditions and planting dates except for the crop growth stage under irrigated conditions in the November 2016 planting. For the crops planted in May 2015, the highest RUEbi, 1.54 g MJ−1, was found at 7–9 MAP, whereas rainfed crops had the highest RUEbi, 1.02 g MJ−1, at 4–6 MAP, and after that RUEbi of rainfed crops declined until harvest. The pattern of RUEbi of the crops planted in May 2016 was similar to those planted in May 2015, but the highest RUEbi, 1.19 and 1.22 g MJ−1, were observed at 4–6 MAP for both irrigated and rainfed crops, respectively. For the crops planted in November 2015, irrigated crops had higher RUEbi than rainfed crops during 4–6 MAP, and the highest performance of both conditions was observed during 10–12 MAP. For the November 2016 planting, the RUEbi for the irrigated crops was not significantly different among the crop growth stages, whereas the highest RUEbi, 1.33 g MJ−1, under rainfed conditions was observed during 7–9 MAP.

3.6. Radiation Use Efficiency for Storage Root Dry Weight (RUEsr)

The comparisons for all planting dates and water conditions in each growth stage showed significantly different RUEsr only at the 4–6 MAP stage (Table 4). The comparisons between water conditions in each planting date showed that for the RUEsr during the 4–6 MAP growth stage, irrigated and rainfed crops in each planting date were significantly different except for cassava crops planted in May and November 2016. Irrigated crops in planted in November 2015 and irrigated and rainfed crops planted in May 2016 showed the highest RUEsr.
Among crop growth stages, in May 2015, the highest RUEsr was found in 7–9 MAP for the irrigated crops (0.84 g MJ−1), whereas for the rainfed crops the highest RUEsr was recorded in 4–6 MAP (0.58 g MJ−1) and 10–12 MAP (0.48 g MJ−1). In November 2015, the patterns of RUEsr for both irrigated and rainfed conditions were similar,; the highest RUEsr observed during 4–6 and 10–12 MAP, and the values of RUEsr for the irrigated conditions were higher than the rainfed conditions during 4–6 MAP crop growth stage. In May 2016, the RUEsr for irrigated and rainfed conditions were not significantly different, however, the highest RUEsr for both conditions were observed at 4–6 MAP. The RUEsr for irrigated crops planted in November 2016 was not significant in all growth stages, whereas the highest RUEsr was observed during 7–9 MAP (0.89 g MJ−1) and 10–12 MAP, 0.54 g MJ−1, for rainfed crops.

4. Discussion

4.1. Light Interception and k

In this study, the Rayong 9 cassava genotype was planted under irrigated and rainfed conditions in May and November for two years. As shown in Figure 1, the May plantings reached high light interception earlier than the crops planted in November in both years. May plantings had higher temperatures, solar radiation, longer photoperiods, and more rainfall in the early growth stages than the November plantings. Veltkamp [25], El-Sharkawy et al. [8], and Mahakosee et al. [33], noted that high temperatures, solar radiation, and long photoperiods promoted large canopies in cassava. The climatic factors had an impact by causing variation of dynamic canopy development, which affected light-capturing capacity that is essential for the photosynthetic process, and subsequently, assimilate partitioning and assimilate accumulation [18,32,34].
Drought in the early and mid-growth stages delays cassava canopy development [17]. Yet, newly expanded leaves of previously stressed cassava plants often show higher photosynthetic rates than those of unstressed cassava [35]. In this study, the May 2015 planting’s light interception reached more than 90% when LAI was 4.5–5.0, whereas the maximum light interception in the other three planting dates appeared when LAI was 3.0–3.5. A higher LAI in the May 2015 planting was found during 3–5 MAP. It was due to the crops being subjected to high temperature, high solar radiation, and long day length, which induced rapid canopy growth with canopy height reaching up to 200 cm [21]. The highest LAI in that period provides the highest light interception percentage. However, the relationship between LAI and light interception was only moderate, having R2 of 0.59–0.78. This moderate relationship may be due to variation in leaf position and leaf arrangement in the canopy [7]. Leaf position, leaf arrangement, and leaf angle are important parameters that influence light penetration into the lower parts of the plant canopy. In general, leaf angle can be estimated by the k values, ranging from 0.3 to 1.0 [36,37,38]. The higher k values indicate a more horizontal position [10,39]. The k values in this study ranged from 0.46 to 0.93 depending on year, planting date, and water conditions. Similarly, Pellet and El-Sharkawy [7], have reported k values in cassava ranging from 0.50 to 0.78 depending on variety and rate of fertilization. Likewise, Fukai et al. [23], reported k values for cassava of 0.59–0.76. In this study, the larger estimate of k in May 2015 was due to the larger canopy size which might have altered leaf angle, resulting in a reduction in solar radiation penetrating to the under canopy. Normally, a large leaf size and horizontal leaf position could receive higher solar radiation than a small leaf and vertical position leaf [40]. Nevertheless, only the top of the canopy can intercept solar radiation, while the lower parts of the canopy cannot intercept solar radiation. The effect of shading on the lower parts of the canopy could lead to a low light interception, which could cause low leaf photosynthesis [41]. However, the cassava leaves and petioles could move to track solar radiation (heliotropism) or avoid direct solar radiation (paraheliotropism) at midday, when there is high solar intensity and leaves can overheat [42]. In addition, water stress reduced canopy size by reducing leaf emergence, leaf size, and increasing leaf drooping and leaf fall which influenced light interception.

4.2. Solar Radiation Interception and RUE

The amount of solar radiation absorbed by a crop’s canopy depends on the canopy’s characteristics, including LAI, leaf shape, thickness, and leaf orientation and it also depends on incoming solar radiation. In this study, incoming solar radiation differed among seasons and years. Crops planted in May were subjected to higher solar radiation (>500 MJ m−2 month−1) in the early growth stage (1–4 MAP), and during the middle growth stage (5–10 MAP), the crops were subjected to lower solar radiation (<500 MJ m−2 month−1). In contrast, the crops planted in November for both years were subjected to lower solar radiation from planting to 5 MAP, however, in the middle growth stage, the crops planted in November 2015 were subjected to higher solar radiation (>500 MJ m−2 month−1) than the crops planted in November 2016. The variation in incoming solar radiation and canopy size in different crop growth stages and planting dates affected cumulative solar radiation interception.
In the May planting for both years, the greatest RUEbi for both irrigated and rainfed crops was found during the canopy-development stage (4–6 MAP). Nevertheless, during the accumulation stage (7–10 MAP), the crops planted in May were subjected to cool and dry conditions and the irrigated crops would have higher RUEbi than that of the rainfed crops. Due to irrigation during low temperature and dry conditions, higher leaf longevity and canopy size could be maintained for cassava; therefore, the crops could intercept more solar radiation and provide higher photo-assimilation than rainfed crop in this crop growth stage. However, in the November planting, for both years, the irrigated crops had higher RUEbi than the rainfed crops for most growth stages, but during the storage root accumulation stage the rainfed crops had higher RUEbi than the irrigated crops. Once receiving rainfall during the rainy season, the canopy development of the rainfed crops could recover faster than the irrigated crops, and the newly expanded leaves could provide higher photosynthetic capacity [42]. However, the canopy development responses were different for each planting dates and year. Therefore, the light interception, amount of solar radiation intercepted by canopy, and RUE were different, contributing to differences in yield.
However, the average RUEbi in our study ranged from 0.56 to 1.04 g MJ−1, which is considerably lower than the 1.15 to 2.30 g MJ−1 reported by Pellet and El-Sharkawy [7]. The average RUEsr was 0.36–0.52 g MJ−1, with the highest RUEsr being observed during the canopy development and storage root accumulation stages (4–6 and 7–10 MAP), whereas, Veltkamp [25] reported that the higher RUEbi were recorded at 1.34–1.40 g MJ−1 during 1–6 MAP and then declined. Zhu et al. [43] revealed that RUEsr varied by genotype, ranging from 0.69 to 0.94 g MJ−1. A lower RUEbi in this study might have been due to climatic factors and rainfall during growing seasons. The annual rainfalls in this study were recorded at 883.1–1469.3 mm, which is lower than 1800 mm [7]. However, crops planted in different locations and at different times, which subjects them to different in climatic conditions, often have different RUE—especially short-life-cycle crops such as rice [5] and cotton [6]. Ezui et al. [26] found that the study site and seasonal variations influenced to light interception, RUE, and yield in cassava. Since cassava has a long life-cycle, which covers all seasons of the year, the effects of climatic conditions and rainfall on the crop growth stage contributed significantly to canopy development, light interception and efficiency, and crop yields [21].
Cassava planted under rainfed conditions is often subjected to drought stress, which decreases canopy development and consequently reduces light interception and RUE. Subbarao et al. [11] revealed that drought stress during the grain-filling stage in grain legumes reduced RUE by approximately 70%. Cumulative PAR and the amount of PAR during the grain-filling period had a high correlation with grain yield and was the dominant factor contributing to grain yield in corn and soybean [44]. Although cassava has no critical growth stage similar to grain crops, drought stress and extreme environments are major causes of yield loss. Previous reports demonstrated that water availability during first five months are important to determine cassava yield [45]. However, a study of Mahakosee et al. [21] showed that cassava planted under rainfed conditions in November, which subject them to low rainfall during 1–6 MAP, could provide storage root yield and biomass as high as under irrigated conditions. In contrast, for the crops planted in May, which were subjected to dry conditions during 6–12 MAP, the irrigated crops had higher biomass and crop yields than other rainfed crops. Although cassava is a crop that requires high solar radiation to perform more photosynthesis, lower solar radiation and short daylength promote storage root growth higher than shoot growth [8,25]. Several reports demonstrated that low temperature and short day-length could result in storage root and tuber initiation and accumulation in storage root and tuber crops such as potato [46], sweet potato [47], Jerusalem artichoke [48], and cassava [49]. In cassava, roots start to bulk and become storage roots at 45 days after planting [50]. As a result of this study, during 0–3 MAP, the RUEsr for the crops planted in November, especially the irrigated crops, were higher than for crops planted in May indicating that the crops planted in November started to accumulate storage roots earlier than the crops planted in May, contributing to higher storage root yield in the November planting [21].
Overall, the light interception in cassava was positively correlated to LAI and leaf angle, which varied by water conditions and planting dates. The RUEs depended on incoming solar radiation and the light intercepted area in each growth stage. A larger canopy, especially during storage root accumulation, would intercept more solar radiation and contribute to biomass accumulation and storage root yield of cassava.

5. Conclusions

The light interceptions, k values, and RUE depend on water conditions, planting dates, and crop growth stages. The crops under the irrigated condition had higher light interception than those under the rainfed condition during the mid to late growth stage for planting in May. However, in the November planting, light interception of both conditions was slightly different during early growth, whereas at mid to late growth stages there was no significant difference. In terms of RUE, in the May 2015 planting, the crops under irrigated conditions had a better RUEbi than the crops under rainfed conditions during storage root accumulation stages. In the November planting, the crops at the canopy-development stage under irrigated conditions have higher RUEbi than those under rainfed conditions. However, no difference in RUEbi, was found between irrigated and rainfed crops in May and November plantings in 2016, because of the greater amount and distribution of rain. The pattern of RUEsr was similar to that of RUEbi, but RUEsr values were lower than RUEbi values during at the storage root accumulation stage. These pieces of information would be useful for water management for cassava production in the early rainy season and post-rainy season of the tropical Savanna climate.

Author Contributions

Conceptualization, S.J., P.B., P.T., C.C.H., C.K.K. and N.V.; methodology, S.J. and N.V.; formal analysis, S.M.; investigation, S.M.; resources, P.B.; data curation, S.M.; writing—original draft preparation, S.M.; writing—review and editing, S.M., S.J., P.T., C.C.H., C.K.K. and P.B.; supervision, S.J. and P.B. All authors have read and agreed to the published version of the manuscript.

Funding

This project was financially supported by the Thai Royal Golden Jubilee Ph.D. Program (Grant no. PHD/0031/2559) and the National Science and Technology Development Agency (NSTDA) Thailand.

Institutional Review Board Statement

Not applicable.

Informed Consent Statement

Not applicable.

Data Availability Statement

Not applicable.

Acknowledgments

Acknowledgement is extended to the Peanut, Jerusalem Artichoke, and Cassava Improvement Research Group, Khon Kaen University, Thailand.

Conflicts of Interest

The authors declare no conflict of interest.

References

  1. Monteith, J.L. Validity of the correlation between intercepted radiation and biomass. Agric. For. Meteorol. 1994, 68, 213–220. [Google Scholar] [CrossRef]
  2. Lindquist, J.L.; Arkebauer, T.J.; Walters, D.T.; Cassman, K.G.; Dobermann, A. Maize radiation use efficiency under optimal growth conditions. Agron. J. 2005, 97, 72–78. [Google Scholar] [CrossRef] [Green Version]
  3. Liu, X.; Rahman, T.; Yang, F.; Song, C.; Yong, T.; Liu, J.; Zhang, C.; Yang, W. PAR interception and utilization in different maize and soybean intercropping patterns. PLoS ONE 2017, 12, e0169218. [Google Scholar] [CrossRef] [PubMed]
  4. Zhi-qiang, T.; De-mei, W.; Shao-kang, M.; Yu-shuang, Y.; Guang-cai, Z.; Xu-hong, C. Light interception and radiation use efficiency response to tridimensional uniform sowing in winter wheat. J. Integr. Agric. 2018, 17, 566–578. [Google Scholar]
  5. Raghuveera Rao, P.; Sailaja, B.; Desiraju, S.; Nageswara Rao, D.; Voleti, S.R.; Satyanarayana Reddy, P.; Sudarsana Rao, G.V. Variable radiation use efficiency in rice cultures grown at different locations. Indian. J. Plant. Physiol. 2012, 17, 57–60. [Google Scholar]
  6. Gonias, E.D.; Oosterhuis, D.M.; Bibi, A.C.; Roberts, B.A. Radiation use efficiency of cotton in contrasting environments. Am. J. Plant Sci. 2012, 3, 649–654. [Google Scholar] [CrossRef] [Green Version]
  7. Pellet, D.; El-Sharkawy, M.A. Cassava varietal response to fertilization: Growth dynamic and implications for cropping sustainability. Exp. Agric. 1997, 33, 353–365. [Google Scholar] [CrossRef]
  8. El-Sharkawy, M.A.; De Tafur, S.M.; Cadavid, L.F. Potential photosynthesis of cassava as affected by growth conditions. Crop. Sci. 1992, 32, 1336–1342. [Google Scholar] [CrossRef]
  9. Vos, J.; Evers, J.B.; Buck-Sorlin, G.H.; Andrieu, B.; Chelle, M.; De Visser, P.H.B. Functional–structural plant modelling: A new versatile tool in crop science. J. Exp. Bot. 2010, 61, 2101–2115. [Google Scholar] [CrossRef]
  10. Hay, R.; Walker, A. An Introduction to the Physiology of Crop Yield; Longmans: London, UK, 1989. [Google Scholar]
  11. Subbarao, G.V.; Ito, O.; Berry, W. Crop radiation use efficiency and photosynthate formation-avenues for genetic improvement. In Handbook of Photosynthesis, 2nd ed.; Pessarakli, M., Ed.; Taylor and Francis: New York, NY, USA, 2005; pp. 549–576. [Google Scholar]
  12. Gallagher, J.N.; Biscoe, P.V. Radiation absorption, growth and yield of cereal. J. Agric. Sci. Cambr. 1978, 91, 47–60. [Google Scholar] [CrossRef]
  13. Gosse, G.; Varlet-Grancher, C.; Bonhomme, R.; Chartier, M.; Allirand, J.M.; Lemaire, G. Maximum dry matter production and solar radiation intercepted by a canopy. Agronomie 1986, 6, 47–56. [Google Scholar] [CrossRef] [Green Version]
  14. Kiniry, J.R.; Jones, C.A.; O’Toole, J.C.; Blanchet, R.; Cabelguenne, M.; Spanel, D.A. Radiation use efficiency in biomass accumulation prior to grain filling for five grain crop species. Field Crops Res. 1989, 20, 51–64. [Google Scholar] [CrossRef]
  15. Stöckle, C.O.; Kemanian, A.R. Crop radiation capture and use efficiency: A framework for crop growth analysis. In Crop Physiology; Sadras, V., Calderini, D., Eds.; Academic Press: Cambridge, MA, USA; Elsevier Inc.: Amsterdam, The Netherlands, 2009; pp. 145–170. [Google Scholar]
  16. Food and Agriculture Organization of the United Nations. Save and Grow a Guide to Sustainable Production Intensification; Food and Agriculture Organization of the United Nations: Rome, Italy, 2013. [Google Scholar]
  17. El-Sharkawy, M.A.; Cadavid, L.F. Response of cassava to prolonged water stress imposed at different stages of growth. Exp. Agric. 2002, 38, 333–350. [Google Scholar] [CrossRef]
  18. Odubanjo, O.O.; Olufayo, A.A.; Oguntunde, P.G. Water use, growth, and yield of drip irrigated cassava in a humid tropical environment. Soil Water Res. 2011, 6, 10–20. [Google Scholar] [CrossRef]
  19. Werner, C.; Ryel, R.J.; Correia, O.; Beyschlag, W. Structural and functional variability within the canopy and its relevance for carbon gain and stress avoidance. Acta Oecol. 2001, 22, 129–138. [Google Scholar] [CrossRef]
  20. Jones, H.G.; Corlett, J.E. Current topics in drought physiology. J. Agric. Sci. 1992, 119, 291–296. [Google Scholar] [CrossRef]
  21. Mahakosee, S.; Jogloy, S.; Vorasoot, N.; Theerakulpisut, P.; Banterng, P.; Kesmala, T.; Holbrook, C.C.; Kvien, C. Seasonal variations in canopy size and yield of Rayong 9 cassava genotype under rainfed and irrigated conditions. Agronomy 2019, 9, 362. [Google Scholar] [CrossRef] [Green Version]
  22. Phoncharoen, P.; Banterng, P.; Vorasoot, N.; Jogloy, S.; Theerakulpisut, P.; Hoogenboom, G. Growth rates and yields of cassava at different planting dates in a tropical savanna climate. Sci. Agric. 2019, 76, 376–388. [Google Scholar] [CrossRef] [Green Version]
  23. Fukai, S.; Alcoy, A.B.; Llamelo, A.B.; Patterson, R.D. Effects of solar radiation on growth of cassava (Manihot esculenta Crantz). I. Canopy development and dry matter growth. Field Crops Res. 1984, 9, 347–360. [Google Scholar] [CrossRef]
  24. Cock, J.H.; Franklin, D.; Sandoval, G.; Juri, P. The ideal cassava plant for maximum yield. Crop Sci. 1979, 19, 271–279. [Google Scholar] [CrossRef]
  25. Veltkamp, H.J. Physiological Causes of Yield Variation in Cassava (Manihot esculenta Crantz). Ph.D. Thesis, University of Wageningen, Wageningen, NL, USA, 1985; p. 132. [Google Scholar]
  26. Ezui, K.S.; Franke, A.C.; Leffelaar, P.A.; Mando, A.; Van Heerwaarden, J.; Sanabria, J.; Sogbedji, J.; Giller, K.E. Water and radiation use efficiencies explain the effect of potassium on the productivity of cassava. Eur. J. Agron. 2017, 83, 28–39. [Google Scholar] [CrossRef]
  27. Howeler, R.H. Cassava mineral nutrition and fertilization. In Cassava: Biology Production and Utilization; Hillocks, R.J., Thresh, J.M., Bellotti, A.C., Eds.; CAB International: Wallingford, UK, 2002. [Google Scholar]
  28. Monteith, J.L. Solar radiation and productivity in tropical ecosystems. J. Appl. Ecol. 1972, 9, 747–766. [Google Scholar] [CrossRef] [Green Version]
  29. LI-COR Inc. LAI-2000 Plant Canopy Analyzer Instruction/Operating Manual; LI-COR Inc.: Lincoln, NE, USA, 1992. [Google Scholar]
  30. Monsi, M.; Saeki, T. On the factor light in plant communities and its importance for matter production. Ann. Bot. 2005, 95, 549–567. [Google Scholar] [CrossRef] [Green Version]
  31. Cooper, J.P. Photosynthetic efficiency of the whole plant. In Food Production and Consumption: The Efficiency of Human Food Chains and Nutrient Cycles; Duckham, A.N., Jones, J.G.W., Roberts, E.H., Eds.; North-Holland Publishing Company: Amsterdam, The Netherlands, 1976; pp. 107–126. [Google Scholar]
  32. Alves, A.A.C. Cassava botany and physiology. In Cassava: Biology, Production and Utilization; Hillocks, R.J., Thresh, J.M., Bellotti, A.C., Eds.; CABI Publishing: New York, NY, USA, 2002; pp. 67–89. [Google Scholar]
  33. Mahakosee, S.; Jogloy, S.; Vorasoot, N.; Theerakulpisut, P.; Banterng, P.; Holbrook, C.C.; Kvien, C. Seasonal variation in canopy size, light penetration and photosynthesis of three cassava genotypes with different canopy architectures. Agronomy 2020, 10, 1554. [Google Scholar] [CrossRef]
  34. Godin, C. Representing and encoding plant architecture: A review. Ann. For. Sci. 2000, 57, 413–438. [Google Scholar] [CrossRef]
  35. Cayon, M.G.; El-Sharkawy, M.A.; Cadavid, L.F. Leaf gas exchange of cassava as affected by quality of planting material and water stress. Photosynthetica 1997, 34, 409–418. [Google Scholar] [CrossRef]
  36. Zhang, L.; Hu, Z.; Fan, J.; Zhou, D.; Tang, F. A meta-analysis of the canopy light extinction coefficient in terrestrial ecosystems. Front. Earth Sci. 2014, 8, 599–609. [Google Scholar] [CrossRef]
  37. Adeboye, O.B.; Schultz, B.; Adekalu, K.O.; Prasad, K. Impact of water stress on radiation interception and radiation use efficiency of soybeans (Glycine max L. Merr.) in Nigeria. Braz. J. Sci. Technol. 2016, 3, 15. [Google Scholar] [CrossRef] [Green Version]
  38. Pereira, M.D.O.; Lyra, G.B.; Silva, L.D.B.; De Souza, J.L.; Pereira, C.R.; Jorge, M.F. Extinction coefficient and interception efficiency of the photosynthetic photon flux density in cherry tomato under levels of nitrogen in greenhouse conditions. Aust. J. Crop Sci. 2019, 13, 1749–1755. [Google Scholar] [CrossRef]
  39. Matloobi, M. Light harvesting and photosynthesis by the canopy. In Advances in Photosynthesis—Fundamental Aspects; Najafpor, M.M., Ed.; IntechOpen: London, UK, 2012; pp. 235–256. [Google Scholar]
  40. Boote, K.J.; Loomis, R.S. The prediction of canopy assimilation. In Modeling Crop Photosynthesis—From Biochemistry to Canopy; No. 19; Boote, K.J., Loomis, R.S., Eds.; CSSA: Madison, WI, USA, 1991; pp. 109–137. [Google Scholar]
  41. Santanoo, S.; Vongcharoen, K.; Banterng, P.; Vorasoot, N.; Jogloy, S.; Roytrakul, S.; Theerakulpisut, P. Canopy structure and photosynthetic performance of irrigated cassava genotypes growing in different seasons in a tropical savanna climate. Agronomy 2020, 10, 2018. [Google Scholar] [CrossRef]
  42. El-Sharkawy, M.A. Cassava biology and physiology. Plant Mol. Biol. 2004, 56, 481–501. [Google Scholar] [CrossRef] [PubMed]
  43. Zhu, X.G.; Long, S.P.; Ort, D.R. Improving photosynthetic efficiency for greater yield. Annu. Rev. Plant. Biol. 2010, 61, 235–261. [Google Scholar] [CrossRef] [PubMed] [Green Version]
  44. Hatfield, J.L. Radiation use efficiency: Evaluation of cropping and management systems. Agron. J. 2014, 106, 1820–1827. [Google Scholar] [CrossRef]
  45. Connor, D.J.; Cock, J.H.; Parra, G.E. Response of cassava to water shortage. I. Growth and yield. Field Crops Res. 1981, 4, 181–200. [Google Scholar] [CrossRef]
  46. Zhou, Z.; Plauborg, F.; Kristensen, K.; Andersen, M.N. Dry matter production, radiation interception and radiation use efficiency of potato in response to temperature and nitrogen application regimes. Agric. For. Meteorol. 2017, 232, 595–605. [Google Scholar] [CrossRef]
  47. Gajanayake, B.; Reddy, K.R.; Shankle, M.W.; Arancibia, R.A.; Villordon. A.O. Quantifying storage root initiation, growth, and developmental responses of sweet potato to early season temperature. Agron. J. 2014, 106, 1796–1804. [Google Scholar] [CrossRef]
  48. Puangbut, D.; Jogloy, S.; Vorasoot, N.; Patanothai, A. Responses of growth, physiological traits and tuber yield in Helianthus tuberosus to seasonal variations under tropical area. Sci. Hortic. 2015, 195, 108–115. [Google Scholar] [CrossRef]
  49. Lowe, S.B.; Mahon, J.D.; Hunt, L.A. The effect of daylength on shoot growth and formation of root tubers in young plants of cassava (Manihot esculenta Crantz). Plant. Sci. Lett. 1976, 6, 57–62. [Google Scholar] [CrossRef]
  50. Carvalho, L.J.C.B.; Filho, J.F.; Anderson, J.V.; Figueiredo, P.W.; Chen, S. Storage root of cassava: Morphological types, anatomy, formation, growth, development and harvest time. In Cassava; Waisundara, V.Y., Ed.; IntechOpen: London, UK, 2018. [Google Scholar] [CrossRef] [Green Version]
Figure 1. Light interception percentage of Rayong 9 cassava genotype grown under irrigated and rainfed conditions in May 2015 (a) and 2016 (c) November 2015 (b), and 2016 (d).
Agriculture 12 00725 g001
Figure 2. Regression analysis between leaf area index (LAI) and light interception (%) of Rayong 9 cassava genotype grown under irrigated and rainfed conditions in May and November 2015 (a,b) and 2016 (c,d). ** = significant at p < 0.01 probability levels.
Agriculture 12 00725 g002
Figure 3. Regression analysis between ln(I/Io) (where I and Io were PAR light below and above the canopy, respectively) and leaf area index (LAI) to determine extinction coefficient (k) of Rayong 9 cassava genotype grown under irrigated and rainfed conditions in May and November 2015 (a,b) and 2016 (c,d). Extinction coefficient (k) was determined as the slope of the regression. * = significant at p < 0.05 probability levels, ** = significant at p < 0.01 probability levels.
Agriculture 12 00725 g003
Table 1. Monthly solar radiation, average relative humidity, average maximum and minimum temperature, and total rainfall for the crops planted in May and November 2015 and 2016.
May Planting
Sum Solar
Radiation (MJ m−2)
Average Relative Humidity (%RH)Tmax (°C)Tmin (°C)Total
Rainfall (mm)
Sum Solar Radiation (MJ m−2)Average
Relative
Humidity (%RH)
Tmax (°C)Tmin (°C)Total
Rainfall (mm)
MAPMay 2015MAPMay 2016
1656.263.636.225.7130.01592.964.035.625.547.4
2553.366.634.525.4120.22489.675.733.224.6237.5
3512.679.432.724.1254.13527.977.132.824.6189.4
4498.879.032.824.4159.84514.178.332.924.5251.6
5465.877.332.723.363.45461.779.232.023.9197.2
6529.566.534.822.64.26507.973.031.921.858.1
7456.558.033.520.10.07448.561.030.519.40.0
8461.558.434.319.913.38449.460.431.219.72.1
9491.450.932.216.32.79530.049.631.617.20.0
10490.640.137.621.52.510461.152.935.021.413.7
11549.343.639.525.321.611580.861.235.123.428.4
12603.258.537.725.9111.312556.170.835.023.9150.8
Total6268.7 883.1 6120.0 1176.2
November Planting
MAPNovember 2015MAPNovember 2016
1503.862.834.721.83.31486.668.131.120.442.2
2439.055.633.619.10.52449.559.130.318.51.2
3477.659.731.717.715.33469.256.531.319.40.9
4518.942.935.318.70.24486.149.232.718.27.5
5480.242.339.023.710.05507.159.334.722.134.6
6552.248.939.826.782.56594.660.036.524.50.4
7581.064.436.025.561.57542.282.432.624.2173.9
8492.372.433.625.0186.68531.884.433.524.3213.2
9577.675.733.724.5226.69465.087.931.524.1319.7
10519.475.933.024.7175.910457.487.931.424.2311.9
11450.881.732.024.2300.111488.982.833.224.4148.2
12500.275.231.722.760.212496.176.631.822.7215.6
Total6093.0 1122.7 5974.5 1469.3
Table 2. Solar radiation interception (MJ m−2) in difference growth stages under irrigated and rainfed conditions for two planting dates and two years.
Solar Radiation Interception
(MJ m−2)
May 2015November 2015May 2016November 2016F-Test
IrrigatedRainfedIrrigatedRainfedIrrigatedRainfedIrrigatedRainfed
0–3 MAP930C1040B421C508C545C776B417C503Cns
4–6 MAP1434A1419A1084B840B1267A1343A1108AB845Bns
7–9 MAP1051B629C1304A1379A863B641C1217A1268Ans
10–12 MAP1065B ab314D c960B b1264A a919B b878B b940B b1236A a*
F-test** ** ** ** ** ** ** **
Total solar radiation interception4480a3401c3769bc3990b3594bc3637bc3681bc3852b*
ns, *, ** = non-significant and significant at p < 0.05 and p < 0.01 probability levels, respectively. The same capital letters in each column and small letters in each row indicate no significant difference by least significant difference (p < 0.05).
Table 3. Radiation use efficiency (g MJ−1) for biomass of Rayong 9 cassava genotype in different growth stages under irrigated and rainfed conditions for two planting dates and two years.
RUEMay 2015November 2015May 2016November 2016F-Test
IrrigatedRainfedIrrigatedRainfedIrrigatedRainfedIrrigatedRainfed
0–3 MAP0.53B 0.63B 0.63B 0.63B 0.42B 0.46B 0.67 0.34C ns
4–6 MAP0.72Bbc1.02Aab1.29Aa0.68Bbc1.19Aa1.22Aa0.61 c0.58BCc*
7–9 MAP1.54Aa0.19Cd0.59Bcd0.85Bbc0.41Bcd0.46Bcd1.13 ab1.33Aab**
10–12 MAP0.27B 0.49B 1.64A 1.60A 0.22B 0.38B 0.49 0.75B ns
Average0.77 0.58 1.04 0.94 0.56 0.63 0.73 0.75
F-test** ** ** ** ** * ns **
ns, *, ** = non-significant and significant at p < 0.05 and p < 0.01 probability levels, respectively. The same capital letters in each column and small letters in each row indicate no significant difference by least significant difference (p < 0.05).
Table 4. Radiation use efficiency (g MJ−1) for storage root dry weight of Rayong 9 cassava genotype in different growth stages under irrigated and rainfed conditions for two planting dates and two years.
RUEMay 2015November 2015May 2016November 2016F-Test
IrrigatedRainfedIrrigatedRainfedIrrigatedRainfedIrrigatedRainfed
0–3 MAP0.10C0.19B0.23B0.23B0.09C0.16B0.26 0.08Cns
4–6 MAP0.28BC e0.58A bcd0.82A a0.47A cde0.77A ab0.65A abc0.44cde0.42BC de**
7–9 MAP0.84A0.19B0.29B0.40AB0.40B0.47AB0.84 0.89Ans
10–12 MAP0.37B0.48AB0.73A0.56A0.26BC0.26B0.24 0.54ABns
Average0.40 0.36 0.52 0.42 0.38 0.39 0.45 0.48
F-test** * ** * ** * ns *
ns, *, ** = non-significant and significant at p < 0.05 and p < 0.01 probability levels, respectively. The same capital letters in each column and small letters in each row indicate no significant difference by least significant difference (p < 0.05).
Publisher’s Note: MDPI stays neutral with regard to jurisdictional claims in published maps and institutional affiliations.

