Article

Long-Term Fertilization Alters Mycorrhizal Colonization Strategy in the Roots of Agrostis capillaris

1
Department of Microbiology, Faculty of Agriculture, University of Agricultural Sciences and Veterinary Medicine Cluj-Napoca, Calea Mănăştur 3–5, 400372 Cluj-Napoca, Romania
2
Department of Grasslands and Forage Crops, Faculty of Agriculture, University of Agricultural Sciences and Veterinary Medicine Cluj-Napoca, Calea Mănăştur 3–5, 400372 Cluj-Napoca, Romania
*
Authors to whom correspondence should be addressed.
These authors contributed equally to this work.
Submission received: 27 May 2022 / Revised: 9 June 2022 / Accepted: 10 June 2022 / Published: 12 June 2022
(This article belongs to the Special Issue Advanced Research of Rhizosphere Microbial Activity)

Abstract

:
Long-term fertilization targets mycorrhizal fungi adapted to symbiotic exchange of nutrients, thus restricting their colonization potential and re-orienting the colonization strategies. The MycoPatt tool has a high applicability in quantifying the symbiotic process with the identification of mycorrhizal indices and projection of mycorrhizal patterns. Organic treatments increase the symbiotic process, visible in values of colonization frequency and intensity, with about 6% more than the native status of colonization. At the opposite pole, organic-mineral treatments decrease the colonization parameters by up to half of the organic treatment. All of the colonization parameters show significant correlations, except for the arbuscules/vesicle ratio (0.03). All the applied treatments, except for the organic one, record multiple root segments with a colonization degree lower than 10%. The application of treatments changes the strategy of native colonization from a transfer (40%) and storage (37%) to a predominant storage (50%) for organic treatment, and are mainly proliferative between 38–50% in mixed and mineral treatments. The high amount of mineral components increases also the presence of resistance conditions strategies. The use of mycorrhizal pattern maps, with the inclusion of colonization strategies, presents an important direction in understanding the evolution of mutual relations, and to explore in-depth the efficiency of the whole symbiotic process.

1. Introduction

The mountain meadows in Romania are an extraordinary source of biodiversity in Europe [1]. The diversity of biomes is the key to the stability and maintenance of the entire grassland ecosystem [2]. Both above- and below-ground biodiversity are closely linked and are influenced by a cumulative effect of biotic and abiotic factors [3]. The major impact in structuring biotic communities in these ecosystems is the high ratio of outputs versus inputs [4], and so nutrient cycling is of particular importance in the ranking of biomes [5]. As a first consequence of this report, the biodiversity of plant species and soil microorganisms or adapted to the reduced amount of nutrients, a phenomenon called oligotrophy [6] and a slowdown in nutrient cycling processes [7]. In natural and semi-natural meadows, any change in management will drastically disrupt the structure of biotic communities. In principle, different processes can generate negative, positive and neutral relationships between the use of species resources and the richness of species [8]. Due to the relationship between biomes and the diversity of plant communities, it can govern the composition of the soil microbial community and thus the activities carried out by them [9]. Plant species influence soil microbial communities, mainly through their functional traits [10]. The problem that arises is the focus of studies on primary productivity, while the vital processes of soil microbial activity are overshadowed [11]. The soil microbiota carries out most of the vital processes to support plant species. The most dynamic interaction with a major impact on a development of plant species is given by the fusion of mycorrhizal fungi at the roots [12].
Symbiosis between grassland plants and mycorrhizal fungi is the promoter of the stability of grassland ecosystems [13]. Mycorrhizal fungi are key mutualists who succeed in alleviating drastic living conditions from this habitat. These, in exchange for a number of products assimilated by photosynthesis [14], protects against pathogens [15,16,17], limits abiotic stresses [18,19,20,21,22] and restricts the heavy metals of the host species [23,24,25]. In addition, mycorrhizal fungi interconnect with the grassland species through a network of hyphae [26], thus intervening in the dynamics of the plant community [27,28]. It has been shown that the involvement of plants in a symbiotic partnership with mycorrhizal fungi can lead to the dominance of some species, as well as to the exclusion of other plants [29,30,31].
Perennials in oligotrophic ecosystems more easily accept the fungal partnership in order to maintain their cover [32]. Agrostis capillaris is a species of long-day, C3 plant, with an active growth period starting in spring [33]. It has a good development in mesotrophic to oligotrophic conditions, and the species also indicates a low content of phosphorus in the soil [34]. A. capillaris is present in ecosystems with a medium-high plant diversity (50–60 species/100 m2) [35], and has an adaptable competition status from medium to high, depending on the available nutrients. As a peculiarity of the species, it adapts to the stress of the genetic environment and through plasticity, often resulting in distinct forms adapted to the local level [36].
Disruption of mycorrhizal communities is primarily due to the type of management applied to the grassland, especially the type of fertilization [37,38,39]. Organic inputs are considered to increase the mycorrhizal process of plant species [40,41,42] and mineral inputs act differently or promote or slow down the process [43,44]. Nitrogen fertilization enhances the symbiotic process only if the phosphorus is deficient in the soil, whereas if the phosphorus is in the right amount in the soil the nitrogen fertilization leads to a destabilization of the symbiosis [45]. Thus, through nutrients that are directly accessible to plants, they no longer invest in the fungal partner. The suppression of mycorrhizae alters the productivity of plants and the establishment of plants in the spring [46]. Mycorrhizae are primarily influenced by the identity of the host species and its phenology, but also by the phosphorus concentration [47]. For the stability of grassland ecosystems, in addition to studies of floristic biodiversity, emphasis must also be placed on the microscopic part of the soil in the choice of management.
The aim of this research was to analyze in-depth the mycorrhizal colonization in roots of A. capillaris, as shaped by the long-term application of treatments. The step-by-step research protocol followed multiple objectives and hypotheses to completely assess the colonization mechanism and mycorrhizal pattern in roots: (a) treatment is visible in the average value of colonization parameters; (b) visible variations in colonization parameters can be correlated one to each other; (c) arbuscules and vesicles shows a correlated presence in same part of the roots or there is a marginal value for the presence of only one; (d) plant roots exhibit various colonization strategies due to the application of treatments; (e) can the treatment act as a profile shaper for clear colonization strategies?

2. Materials and Methods

2.1. Experimental Design

Root samples were collected in summer of 2020 from a long-term fertilized HNV grassland. The experiment was established in 2001, in Ghețari Village (46.49064 N–22.81418 E, 1130 m above sea level), Apuseni Mountains, Romania, on a terra rosa soil. Grassland soil is characterized by oligotrophy, with an acidic reaction, a low content of humus, medium for N and very low for P an K [48]. Samples were collected at the flowering stage in order to provide multiple images of colonization status due to the extent of roots. A total of 5 variants served as field for the root extraction: V1 (control variant)—untreated; V2—organic (manure) treatment—10 t ha−1 manure; V3—low-mineral organic treatment—10 t ha−1 manure + 50 N 25 P2O5 25 K2O; V4—mineral treatment—100 N 50 P2O5 50 K2O; and V5—high-mineral organic treatment—10 t ha−1 manure + 100 N 50 P2O5 50 K2O. Roots were extracted from each of the 4 replications of the field and the soil was gently removed at the site, prior to being frozen at −20 °C until laboratory processing.

2.2. Laboratory Analysis

Roots from each variant/replication were processed separately in the laboratory for a further microscopic analysis. Cleaning was performed by the immersion of roots in a 10% NaOH solution for a period of 48 h. Staining followed a slightly modified ink-vinegar procedure, with the immersion of roots in a 5% ink + 5% vinegar solution for 48 h. Between the two stages, the roots were washed with tap water to remove the extra cleaning and staining agents [49].
All root samples, cut in 1 cm segments, were analyzed at 40× magnification, with an Optika microscope and images were extracted for each microscopic field for each segment. The overall microscopic images were 15 for each of the analyzed segments and reassembled into one larger image to provide the mycorrhizal colonization base for an entire segment. Images from each segment were coded based on the indexes in the mycorrhizal pattern method [50] in order to be further converted with the MycoPatt tool [50] in colors and to provide the colonization image and patterns [51,52]. From the entire experiment resulted a database of 4500 values for each of the colonization parameters: colonization frequency (%); colonization intensity (%); arbuscules and vesicles abundance (%); the overall colonization degree (%); the share of non-mycorrhizal areas (%) in roots; the report between mycorrhized and non-mycorrhized areas and the report between arbuscules and vesicles.

2.3. Data Analysis

Data analysis was performed with the software R Studio [53], built on an R platform [54]. The database for each of the variants, with 900 data for each parameter, was supposed to constitute the extraction of basic statistics, from which average and standard errors were further used in the assessment of colonization trends, with package “psych” [55]. Differences between variants were analyzed by an ANOVA test and multiple comparison by LSD test, with both functions taken from the “agricolae” package [56]. For each variant, a scatterplot of arbuscules and vesicles was extracted. This graphic method, available in the “stats” package of the R platform [54], ensures an analysis of values corresponding to both structures present in a segment and the value from each one of them to have overcome the other one. Each database for one treatment was further plotted through the “vegan” package [57] with Principal Component Analyzed (PCA) for the detection of data dispersion. Variance explained by axis was extracted for each PCA, and supplementary to each ordination were plotted the isolines of colonization degree and arbuscules/vesicles reports. Both parameters were considered important for the homogeneity/heterogeneity of data dispersion, colonization degree being the volumetric parameter of colonization and arbuscules/vesicles the indicators of colonization strategy. Additionally, to each PCA were inserted the vectors corresponding to each colonization parameter, from which the antagonistic vector—the Intensity-Non-mycorrhizal areas—was considered an analysis guidance vector. Data from each of the segments were further analyzed for the detection of a colonization strategy. This procedure followed the concept proposed by Corcoz et al. [52], the four strategies considered being: resistance, proliferative, transfer, and storage. Changes to the proposed concept were performed to the intensity, arbuscules and vesicles values, which indicates the orientation of each segment toward a clear strategy. For each variant the maps of colonization were extracted separately for each of the colonization strategies in order to provide a visual basis for a comparative analysis between treatments.

3. Results

3.1. Variations Induced by Treatments on General Mycorrhizal Colonization

The use of ANOVA permitted the detection of changes induced by the application of long-term treatments in the value of each mycorrhizal parameter (Table 1). The differences between variants are significant for all parameters, with a maximum in recorded frequency respectively for the two antagonistic parameters—intensity and non-mycorrhizal areas. In both reports, mycorrhizal/non-mycorrhizal areas and arbuscules/vesicles showed reduced, but still significant, differences. The native mycorrhizal colonization frequency potential (V1) is set just above 62%, a value that sustains the existence of fungal structures in more than half of the segments analyzed. Compared to this value, a significantly higher level is recorded in the organically treated variant (V2), with a 6% increase. The low-mineral organic treatment (V3) acts as a reductional factor for colonization frequency, with a significant 20% reduction compared to organic treatment. This trend is followed by mineral treatment (V4—another 10% decrease) and high-mineral organic treatment (V5) at less than half the value. The intensity of colonization varies greatly within 14–38%, with higher values associated with control variants (V1) and organic treated ones (V2). The gradual increase in applied mineral dose (V3-V4-V5) significantly decreases this parameter, with 10% compared to control (V1 vs. V3), and with 4% for each of the next two treatments. Arbuscules and vesicles, as specific structures developed by AM fungi, showed significant differences between variants. The native potential for these structures (V1) are set to almost 3% arbuscules and 1.5% for vesicles. An interesting case was recorded for the organic treated variant, with both of these structures at a value above 2%. Compared to this, both low-mineral organic (V3) and mineral (V4) variants recorded 1.2–1.5% less arbuscules and less than 1% vesicles. Even if the high-mineral organic variant contains both types of treatment, their action reduces drastically the arbuscules to a quarter of the native potential and vesicles by up to only 16% of this potential.
Non-mycorrhizal areas are maintained at lower than 70% in control and organic treatments (V1 and V2) but increase significantly for each variant where mineral inputs are present (Table 1). Colonization degree as the overall volume of roots explored by AM fungi exceeds 30% only in the case of organic treatments (V2). Compared to this value, the native potential is set to be almost 25% (V1). In contrast, the application of mineral treatments reduces this parameter by up to half (V3 and V4) and more than 75% in case of the maximum treatment dose (V5). Both of the synthetic reports, mycorrhizal/non-mycorrhizal areas and arbuscules/vesicles, showed significant differences due to the application of treatments. The only variant where the mycorrhizal/non-mycorrhizal areas exceeds 1 is treated with organic inputs (V2), with a 0.5 reduction in the control and more than 0.7 in the mineral treated variants. The general image of arbuscules/vesicles reports indicates the simultaneous presence of both structures in the roots, with a higher share for arbuscules in control and organic treated variants, and vesicles more than 4 times higher in the mineral treated variants. The only significant differences recorded are between the first two variants (V1 and V2) compared to the highest mineral variants (V4 and V5).

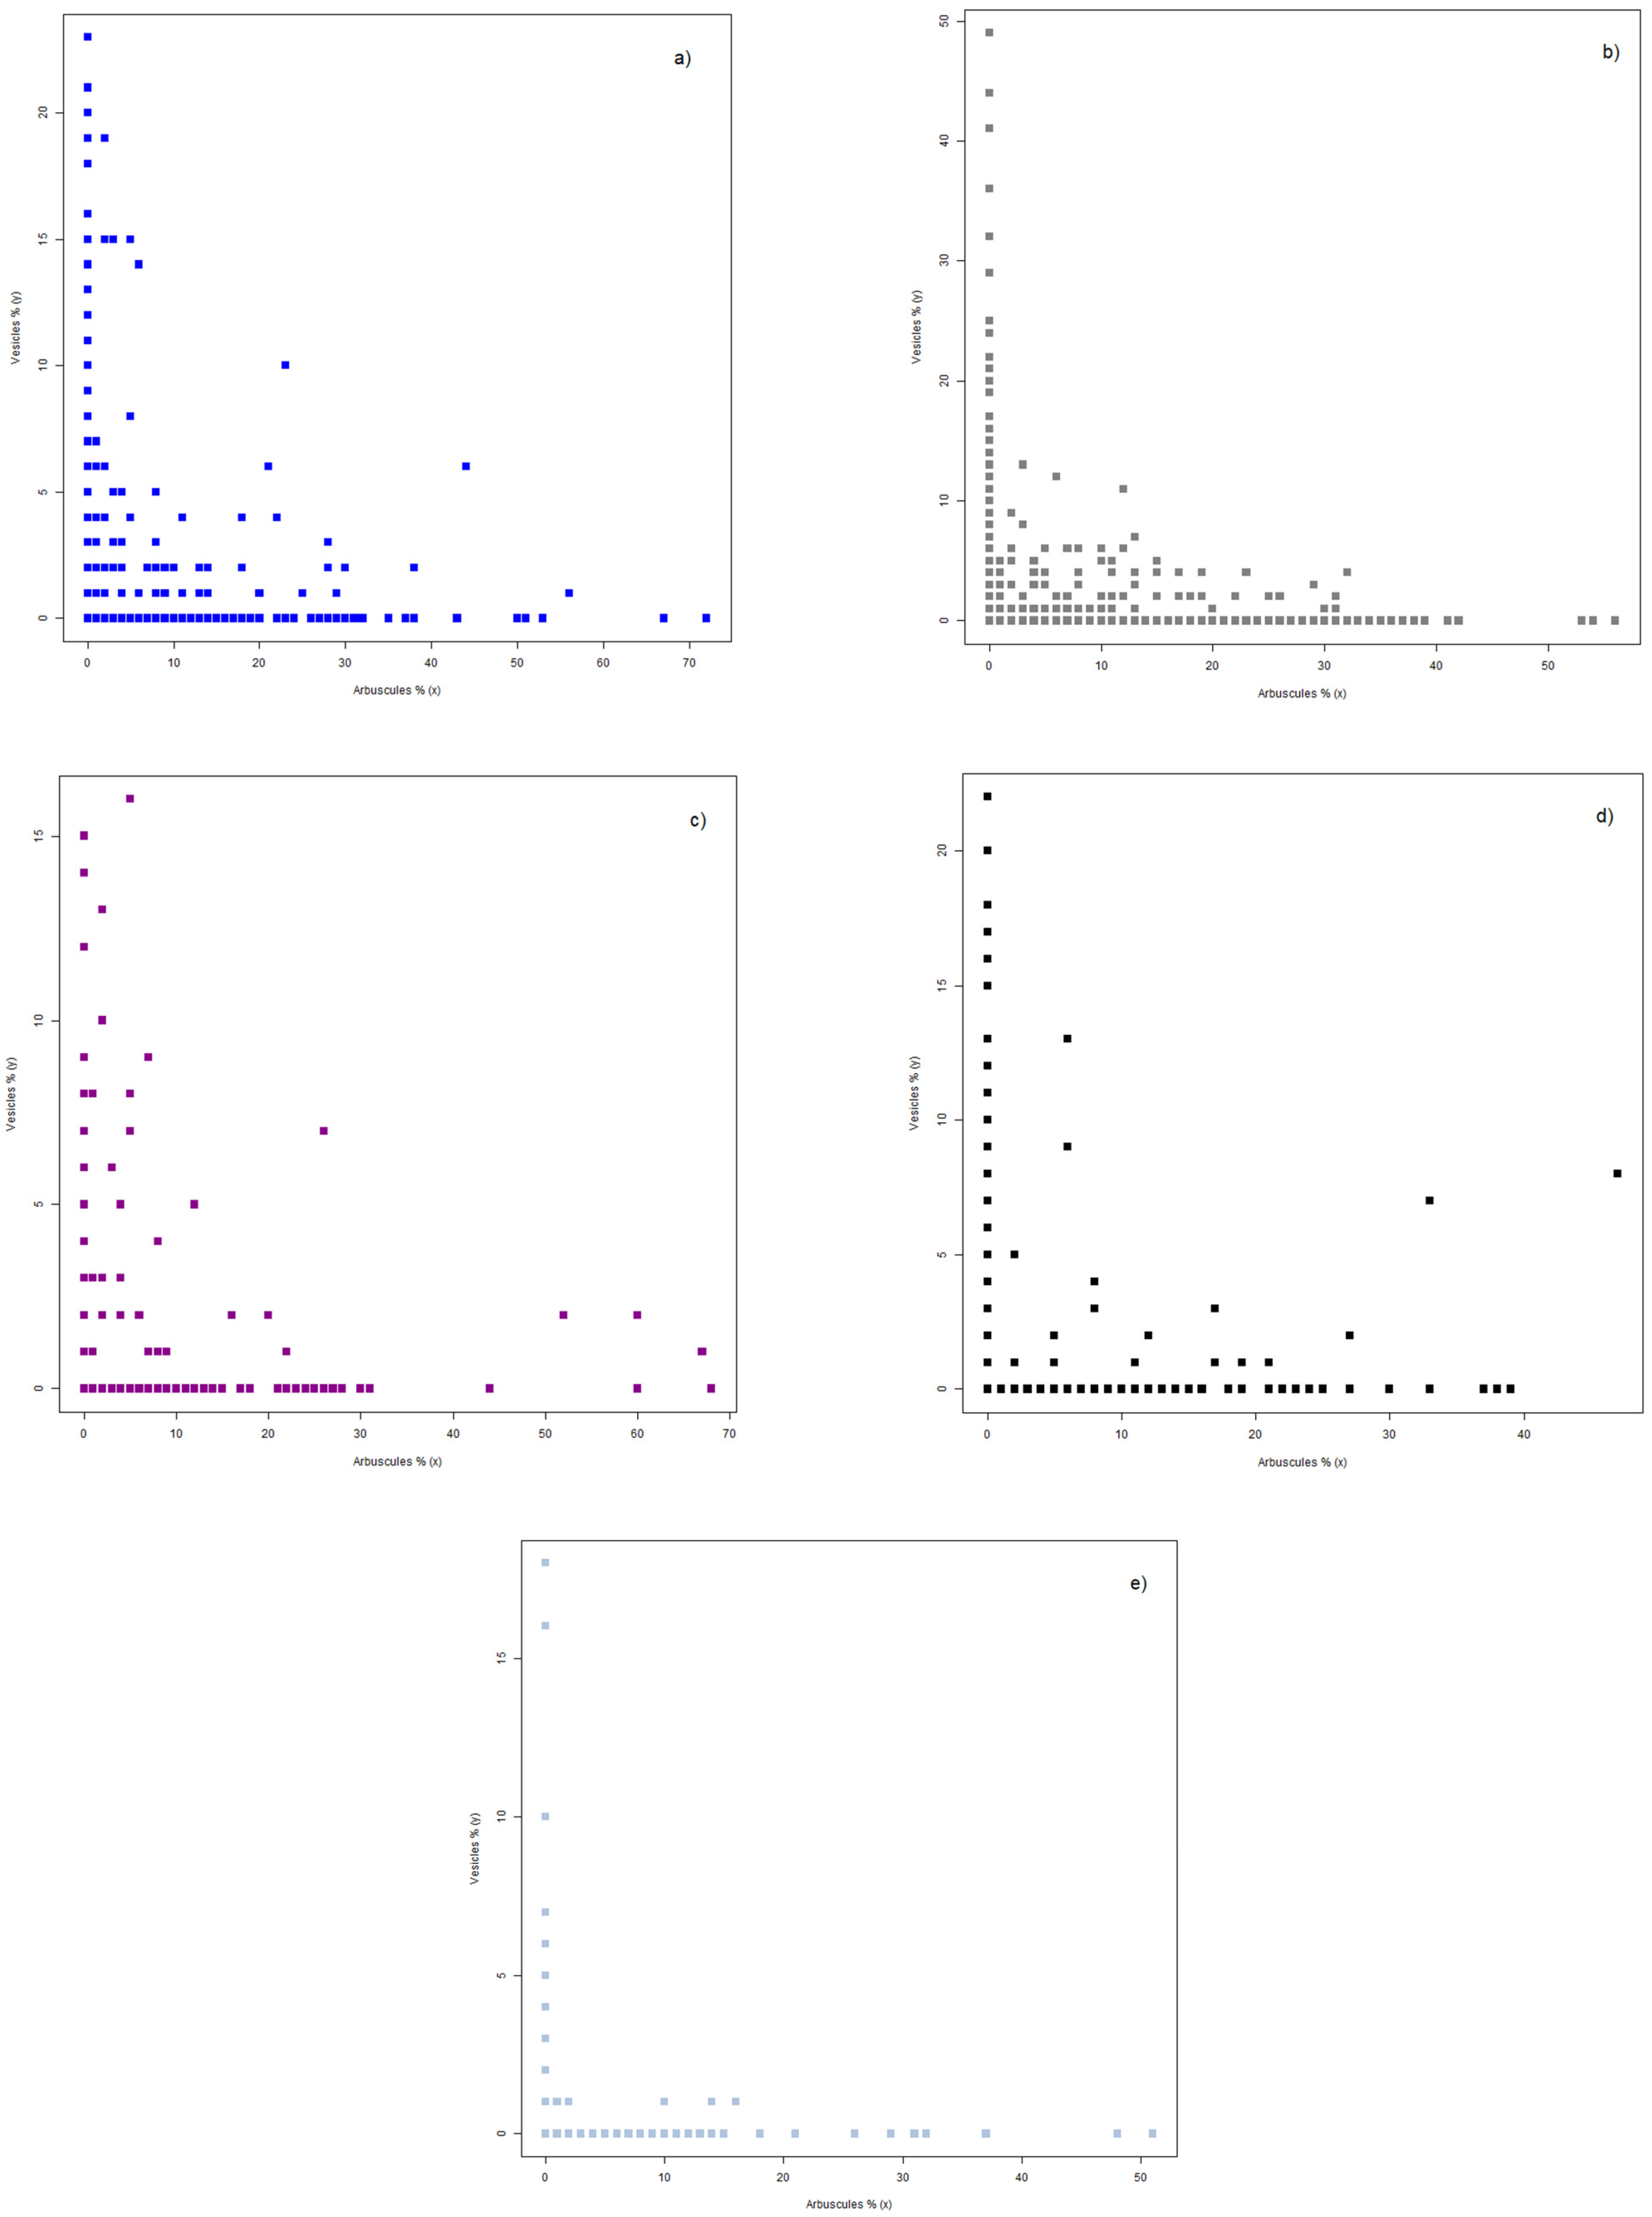
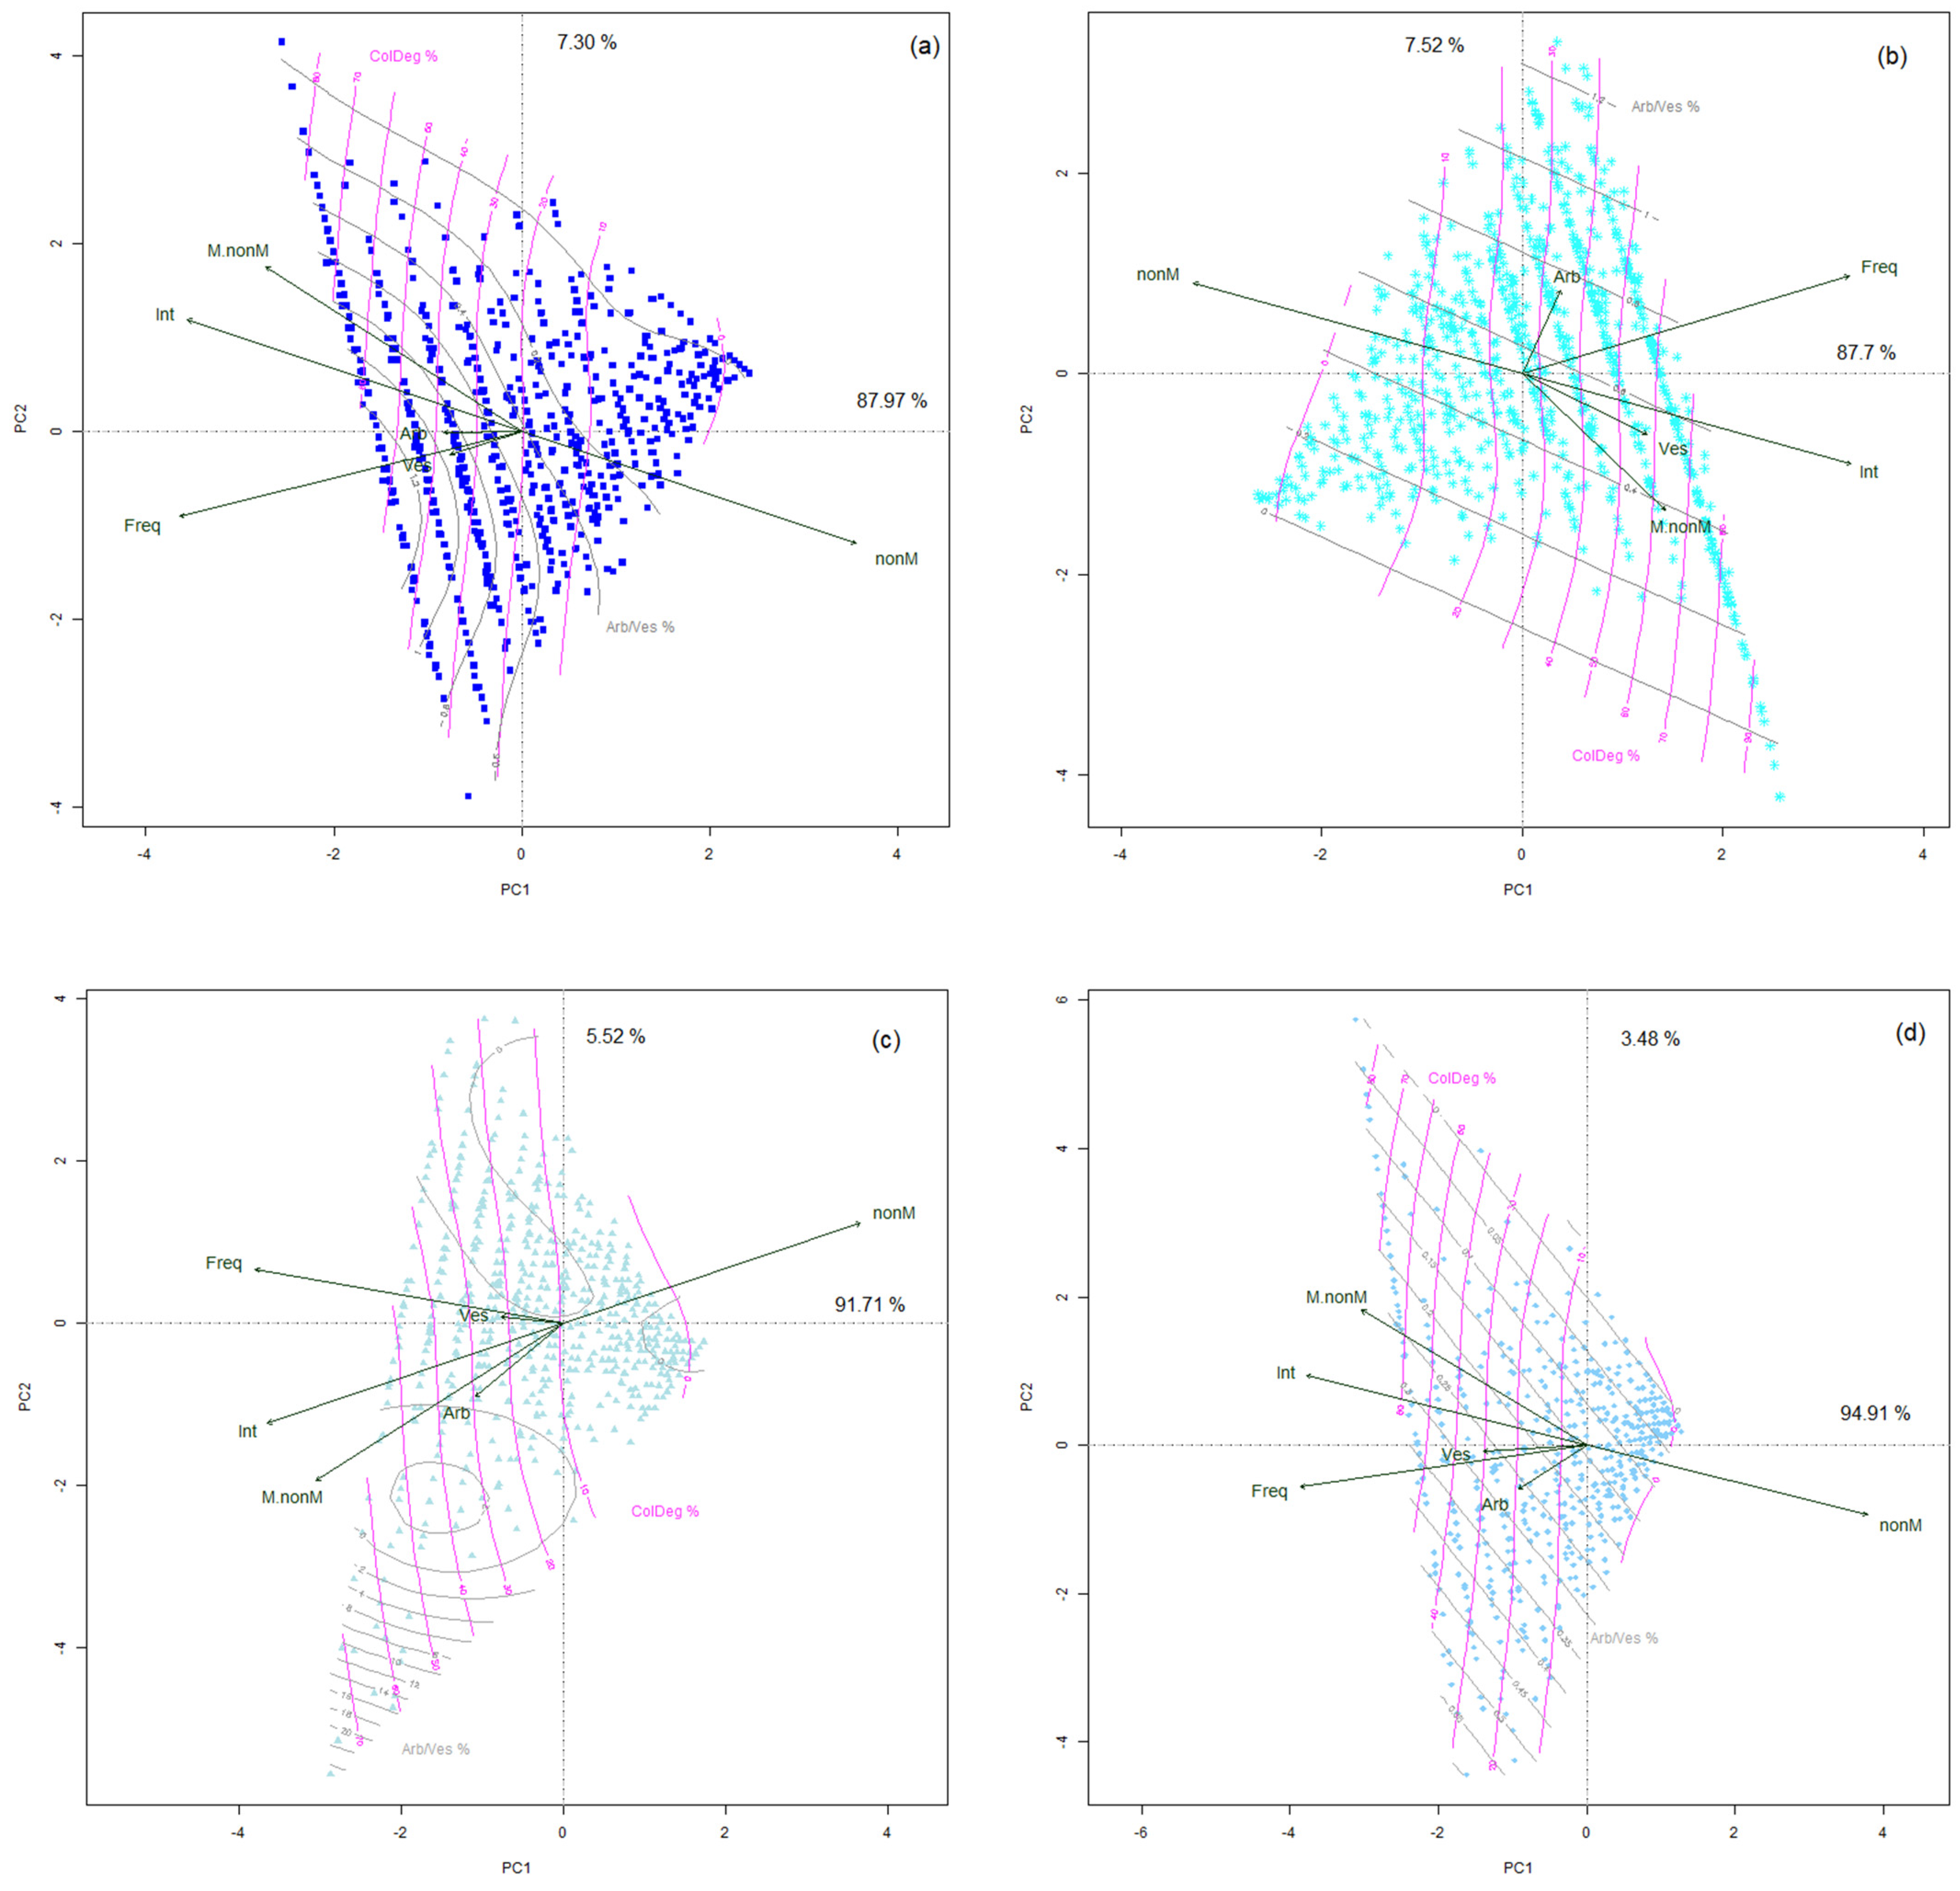
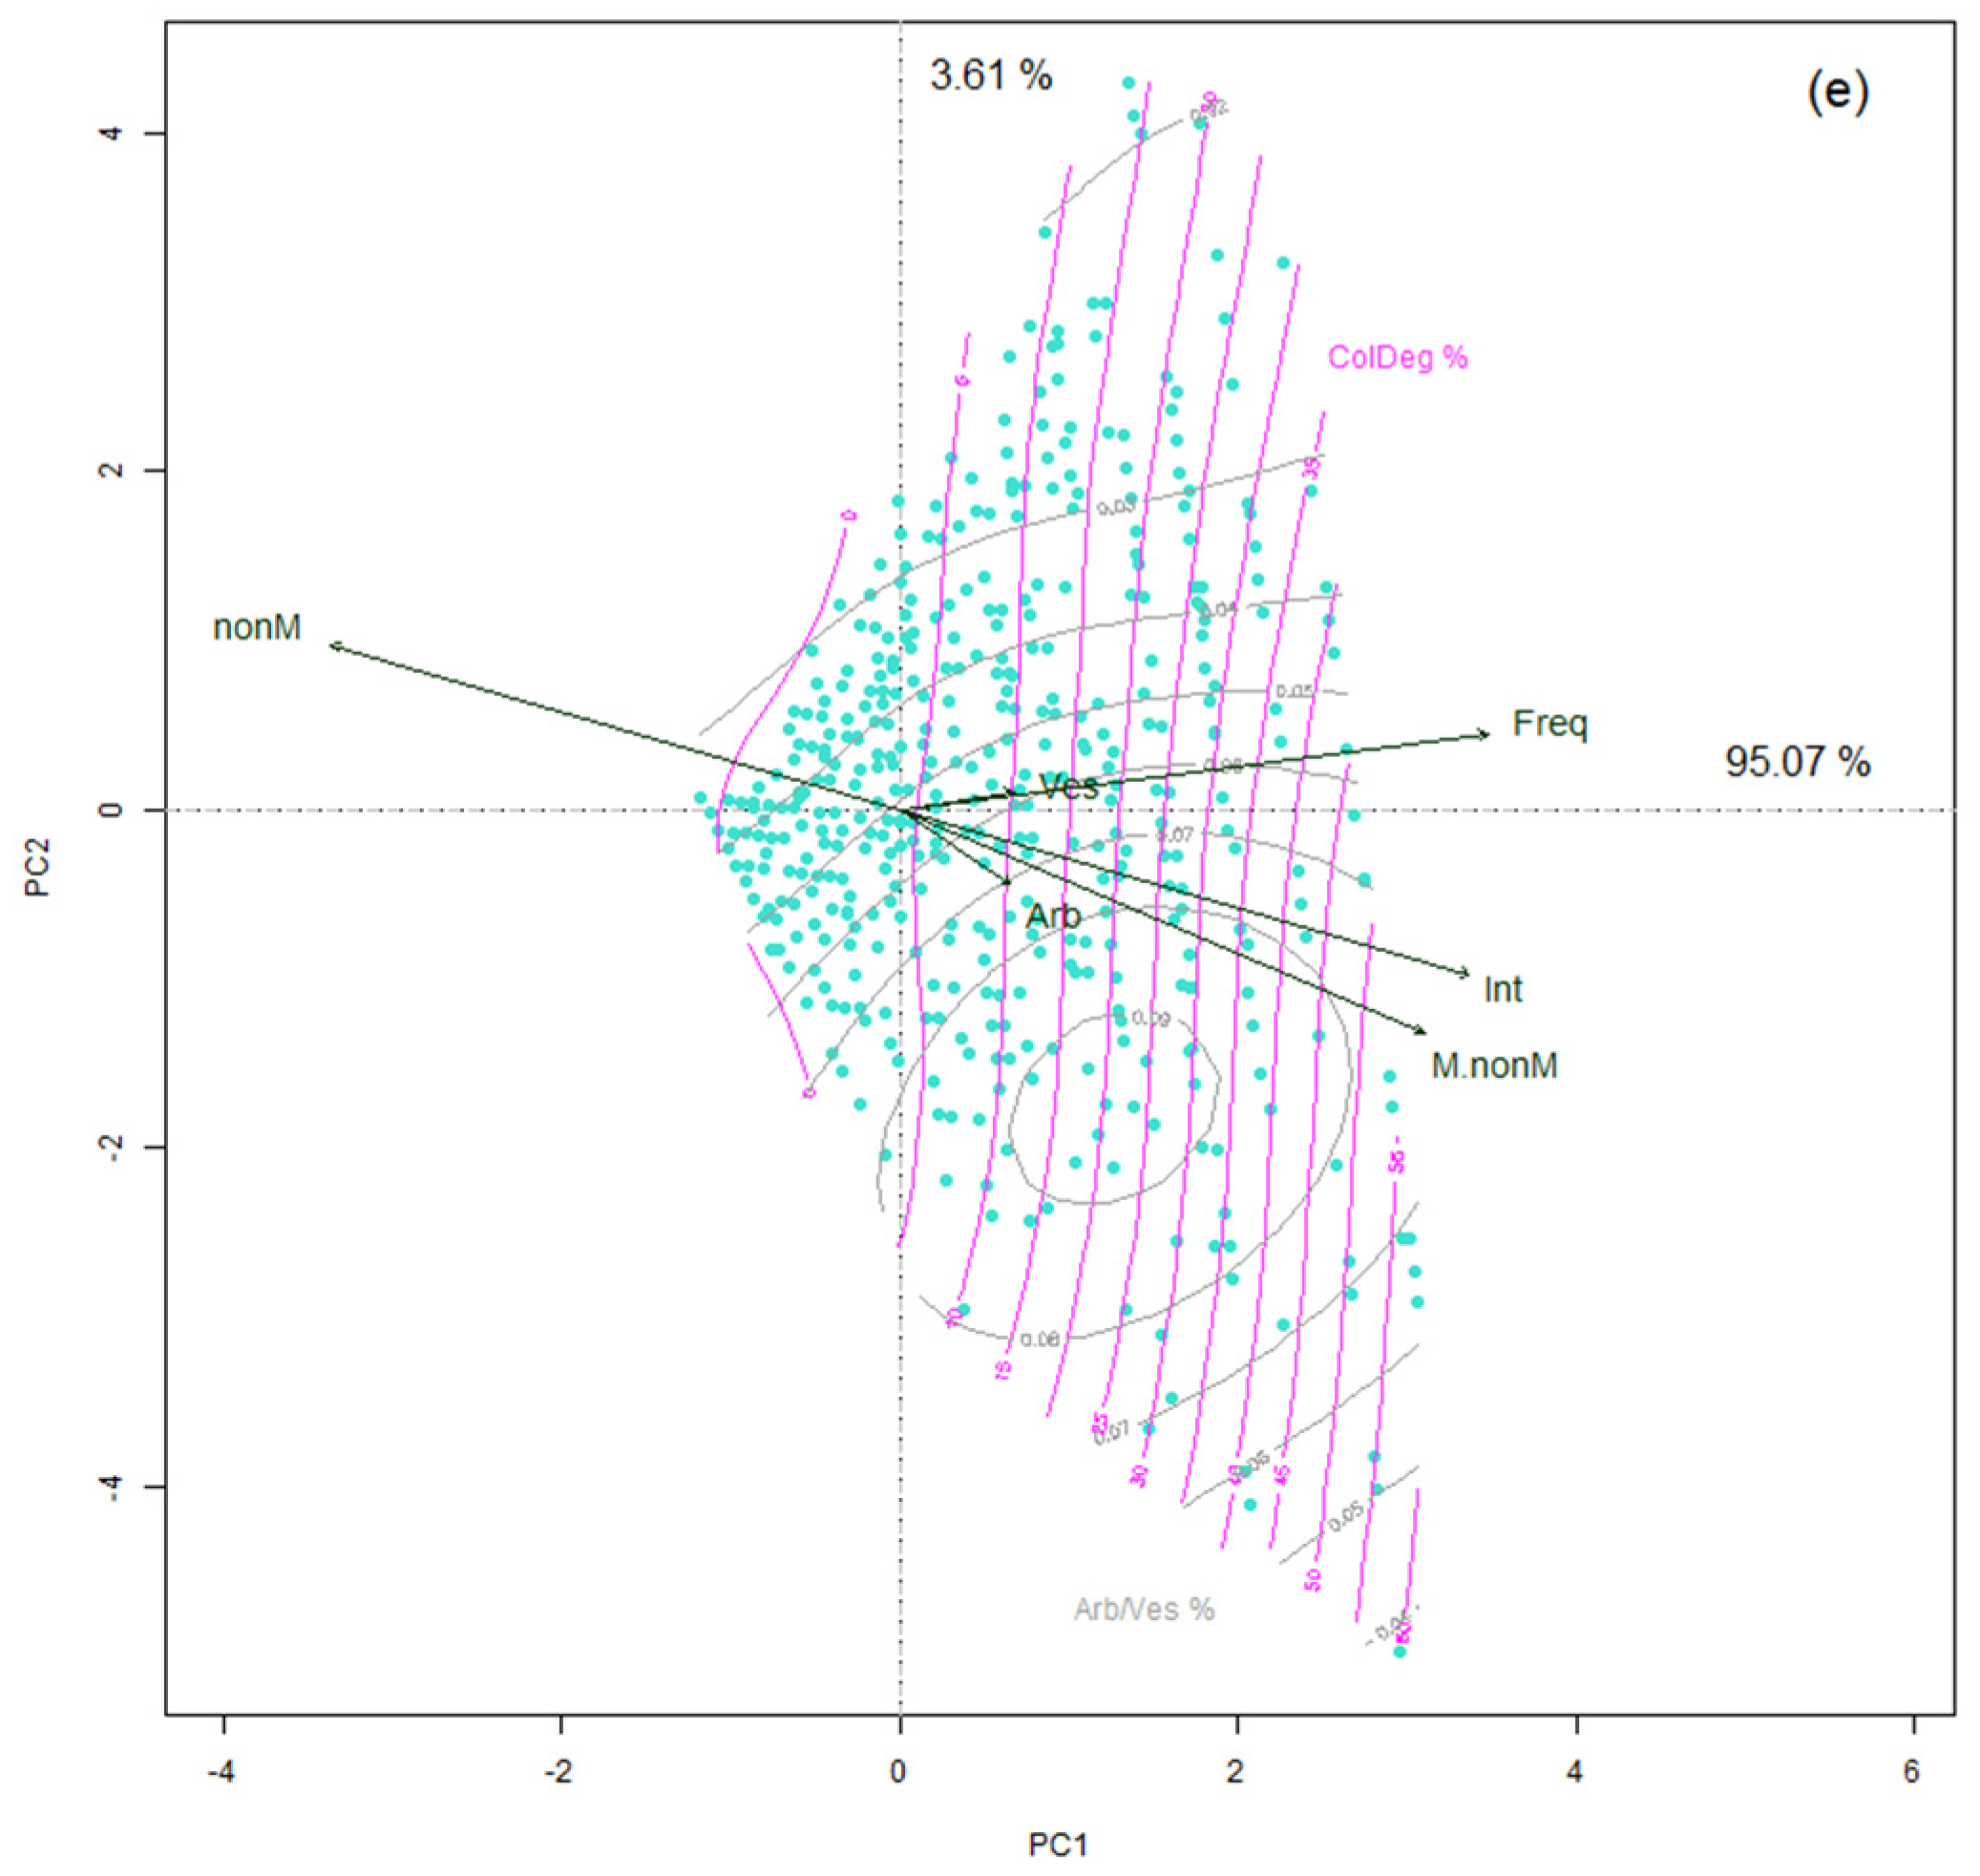
3.2. Interrelations between Colonization Parameters and Their Potential Simultaneous Presence in Colonized Roots

Long-term application of treatments has shaped the inter-relations between colonization parameters (Table 2, Supplementary Table S1). The general correlation coefficients were established based on 4500 sets of observations, which ensures a high stability of the results (Table 2). Only one correlation was considered non-significant, the importance of vesicles in the report of arbuscules/vesicles being set to only 0.03. There are two parameters that have the same maximum (±0.97) antagonistic share in the colonization degree, intensity, and non-mycorrhizal areas. The frequency determines the highest part of the observed intensity (0.9), while for the secondary structures the correlation was similar to the intensity one, with more than 0.20 in the presence of arbuscules and 0.30 for vesicles. Frequency is also highly correlated with colonization degree, while the colonization degree influences both the presence of vesicles and arbuscules. The report between mycorrhizal and non-mycorrhizal areas is more sensitive to the frequency and vesicles than to arbuscules presence, while the report between secondary structures has half of the correlation sum associated with arbuscules.
The analysis of arbuscules and vesicles presence in roots is necessary for the specific action of each treatment and their maximum concomitant presence (Figure 1a–e, Supplementary Table S1). The native potential (V1) of arbuscules and vesicles development (Figure 1a, Supplementary Table S1) shows a maximum recorded of 75% for transfer structures and only 25% for storage ones. Even if the correlation coefficient between the two structures is set to −0.08, its significance indicates a decrease in the structure in favor of the other development. The vesicles can be maintained by up to 5% in the context of a maximum 10% arbuscules, and at 3% up to 30% arbuscules. After 30% of arbuscules, vesicles appear sparsely, and after 50% it completely disappears. The application of organic treatments (V2) induces a different pattern of both structures presence (Figure 1b; Supplementary Table S1). Vesicles can be present in a share of 5% up to a maximum of 30% arbuscules. After this value of arbuscules, vesicles disappear completely. In contrast, arbuscules are present in 10–12% up to a limit of 10–12% for vesicles, and after this point they completely disappear. This phenomenon is associated with a correlation of −0.11 between the two parameters. The presence of mineral inputs in the treatment V3, even at low doses, produces a chaotic distribution of data recorded for both structures (Figure 1c; Supplementary Table S1). The lack of significance between the two structures presence indicates a high symbiotic flexibility of colonized roots. A large number of recorded data presents an interval between 0–30% arbuscules, with no vesicles developed around the same area. The maximum of vesicles reaches 15%, in all these cases arbuscules being present in a 0–10% share. This indicates that the roots of plants organic treatment permits the existence of a dual flux: for storage and transfer in the same area. Arbuscules can reach 70%, with an empty interval between 30 and 40%, but this can also be associated with 2.5% vesicles. The use of only mineral treatments (V4) shows a clear development pattern of either vesicles or arbuscules in most of the recorded data (Figure 1d, Supplementary Table S1). For this treatment, arbuscules reach only 40%, which is 15% higher compared to the maximum recorded vesicles. The −0.01 correlation indicates a lack of interdependence between the two parameters. Their presence is associated with root permissiveness and the punctual nutrient requirements of plants. Vesicles can have 5% in association with 10% arbuscules, a value that decreases to 3% at an increase of arbuscules of up to 20%. In this specific case, there exists the possibility of highly structural colonized root areas, where high values of arbuscules and vesicles can be observed in the same area. The high-mineral organic treatment (V5) acts as a clear structure development separator (Figure 1e; Supplementary Table S1). Vesicles reach almost 20% in some root areas, but are unrelated to arbuscules, which have a maximum of just over 50%. Even the correlation remains non-significant between the two parameters and they do not appear in the same colonized area. For both structures, the increase in their presence is not gradual, with empty intervals in their graphic array. The mechanism implies a different permissiveness in the colonized root, with largely different areas where AM partners develop a hyphae network oriented toward storage or transfer structures.

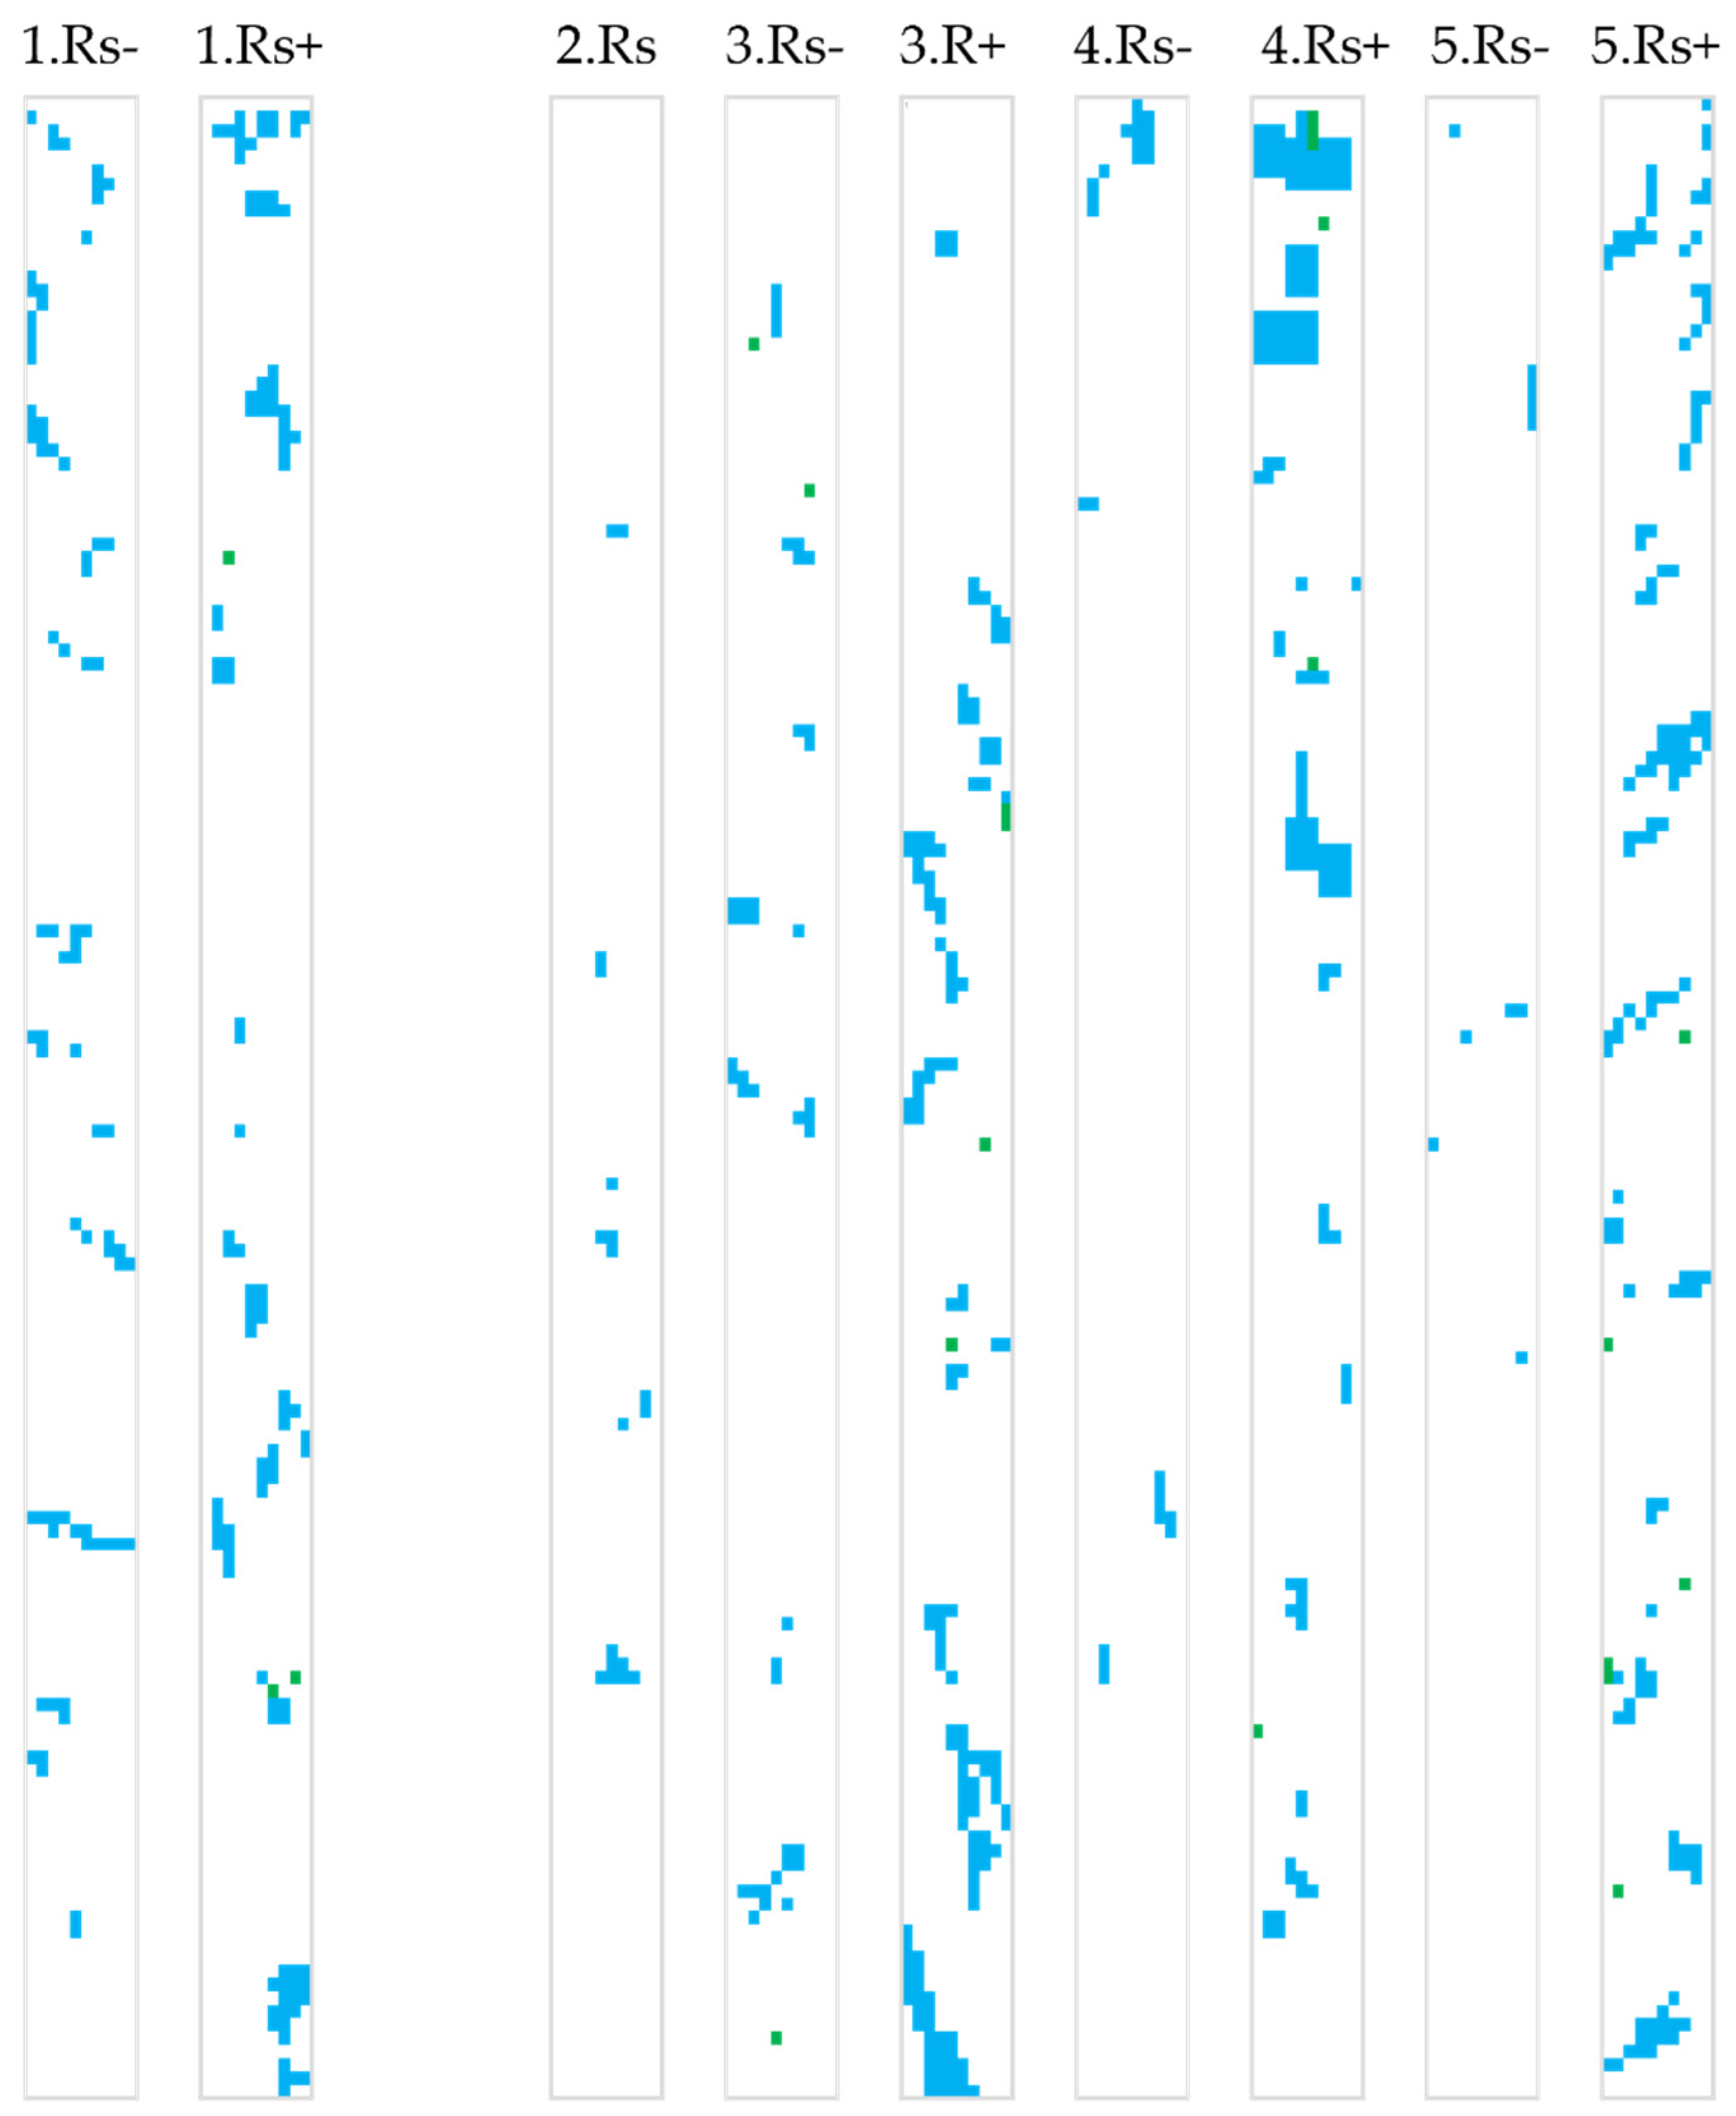
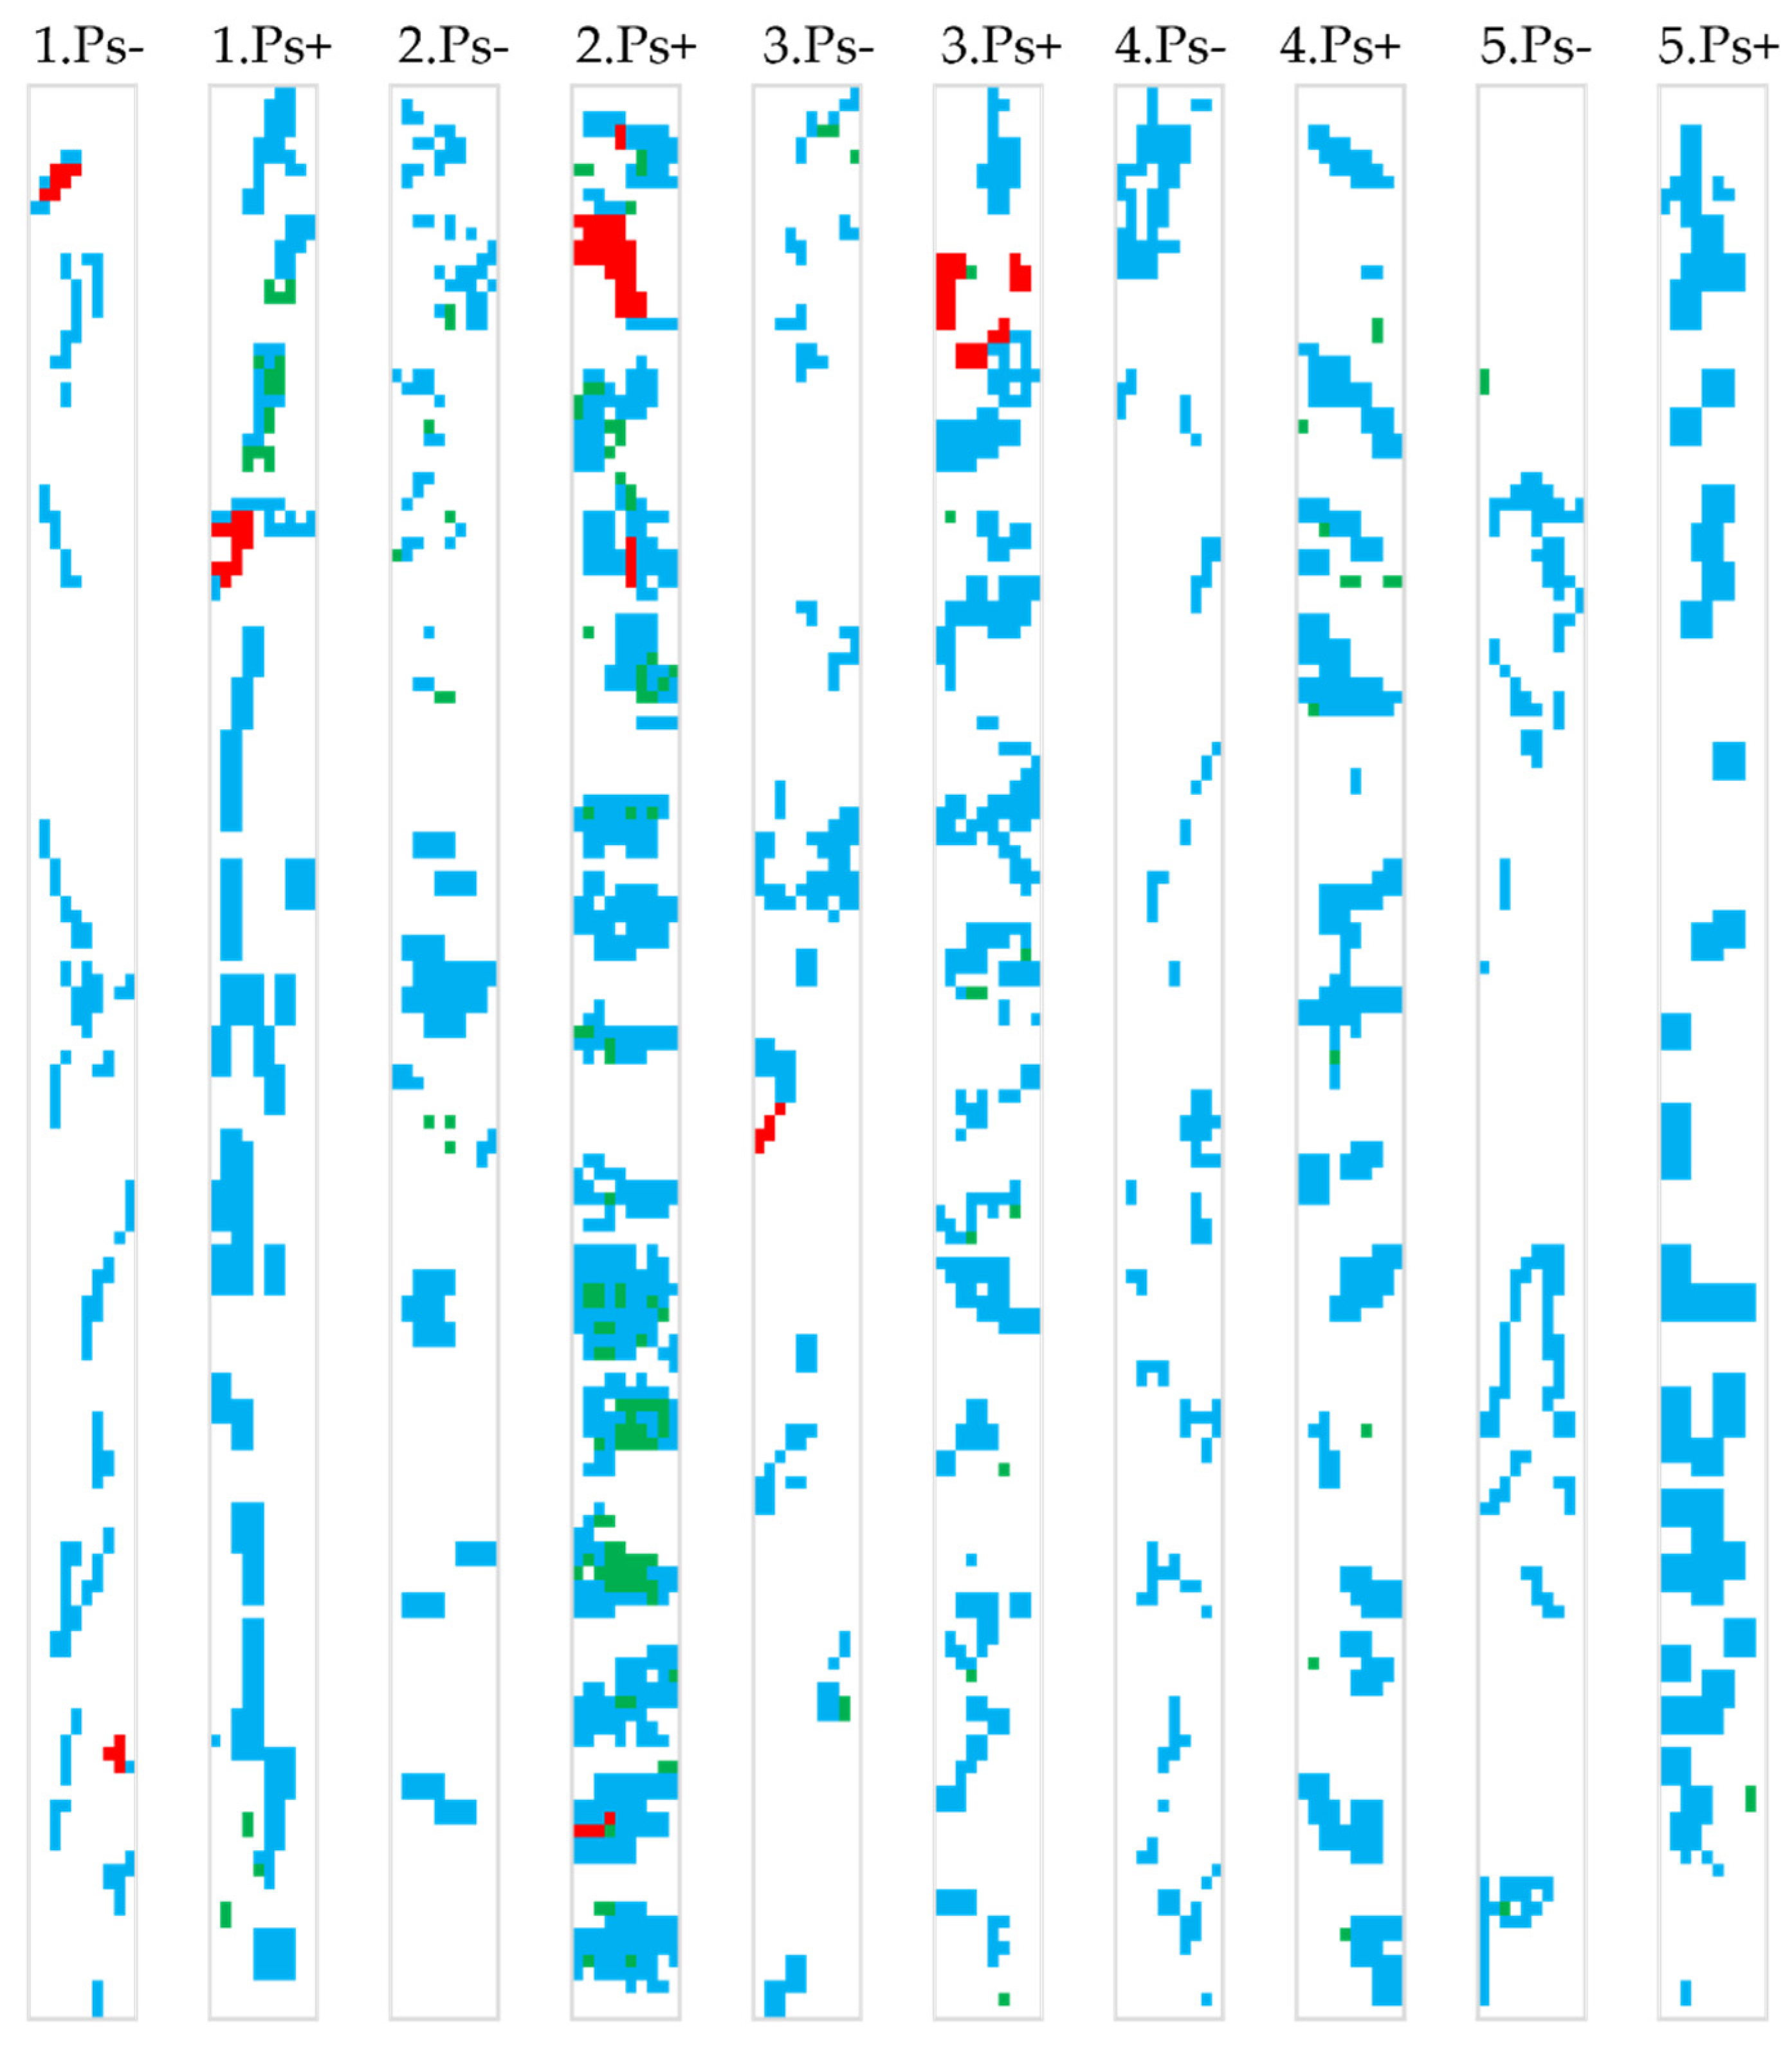
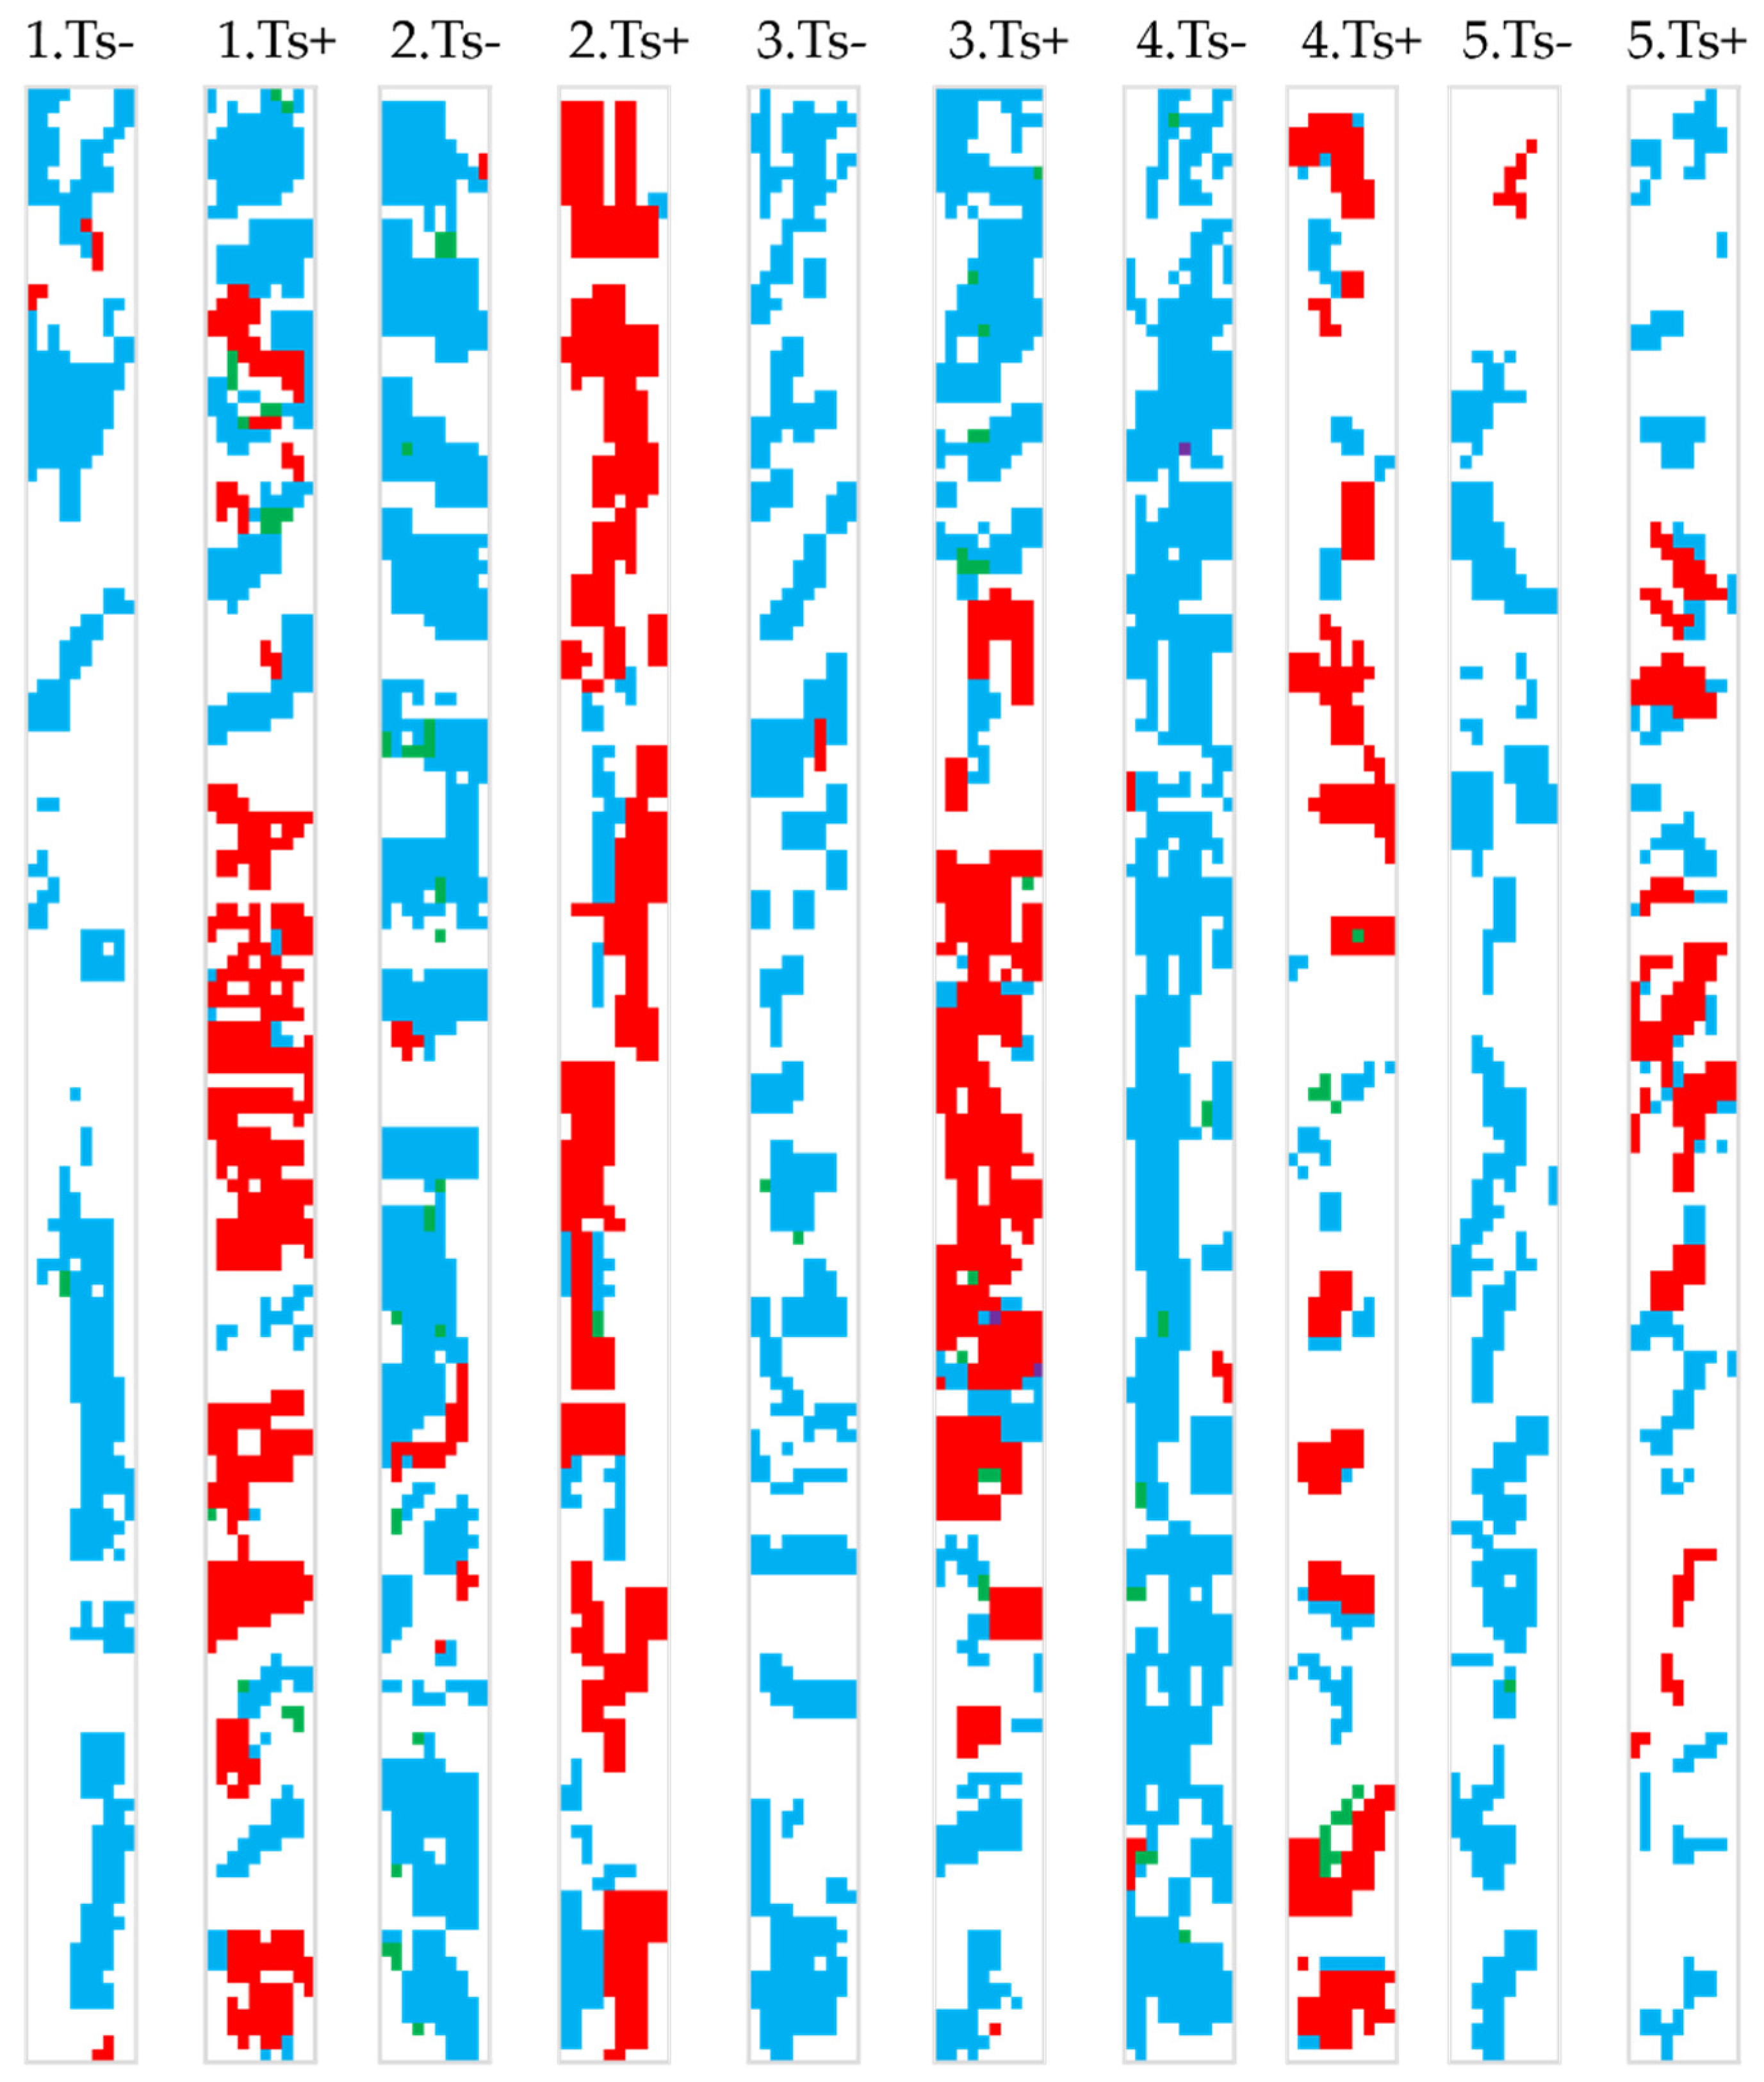
3.3. Dispersion of Mycorrhizal Colonization Data as Shaped by Applied Treatments

Principal component analysis shows with a great fidelity the dispersion of mycorrhizal data in a graphical plan, for each of the treatments providing a unique solution and the projection of parameters as vectors (Figure 2a–e). Control variants (Figure 2a) have a highly dispersed data at colonization degrees within the interval 0–20%, overlapped on an arbuscules/vesicles report in the interval 0–0.2. The total variance explained by the PCA is 95.27%, with the majority of variance allocation to Axis 1. The antagonistic vector Intensity-non-Mycorrhizal areas is oriented diagonally from the − + quadrat to + − one, at the intersection of the two isolines represented by colonization degree and the arbuscules/vesicles report. This position makes the intensity vector go through the middle point of data with a colonization degree higher than 20%. In this ordination, it indicates a stability of colonization at values higher than this point and a stability of the native mycorrhizal potential. The frequency is positioned at 45° compared to intensity, at the idle of the distance between the two being positioned the short arbuscules vector. This indicates a similar influence of both higher vectors for the development of transfer structures, compared to vesicles which are associated with vesicle development. The mycorrhizal/non-mycorrhizal area report is placed near to intensity in the area occupied by the highest colonization degree values, considering those values that can change fastest in terms of the value of this report. The application of organic treatments (V2) changes completely the mycorrhizal potential, the entire PCA graph presenting a highly modified image of data recorded (Figure 2b). Compared to the control, the antagonistic intensity-non-mycorrhizal area vector is oriented at a perfect opposition. Data dispersion is heterogenous only in the interval 0–10% of the colonization degree isoline, with a homogenous linear agglomeration after this value. Both arbuscules and vesicles have short vectors, the arbuscule ones oriented toward the upper area of arbuscules/vesicles isoline reports. The position of this vector in the upper part of the frequency vector, at more than 30° at distance, indicates the possibility of the arbuscules emergence in the early stages of colorization, which is unrelated to a developed hyphal network. The intensity and frequency maintain the same angular distance, with the positioning of vesicles a short vector below the intensity one. This indicates the potential development of vesicles only in the presence of a developed hyphal network. The similarity between variance explained in organic treatment PCA with the control one sustains the reorientation of the ordination graph due to the selective colonization process.
The introduction of mineral treatments (V3), even at low doses, alters drastically the colonization process (Figure 2c). The variance explained by each axis is oriented toward Axis 1 with more than 91%, and the entire dataset is plotted in a reduced space in the upper-center area. The colonization degree isoline maintains the interval 0–70%, but a drastic change is visible in the arbuscules/vesicles report isoline (up to 20). The great majority of the data are associated with lower values of this report, which indicates a reduced presence of these structures. The vesicles vector is associated with frequency, which indicates a potential development of storage structures from the emergence of colonization. At the opposite end, arbuscules have a longer vector, which exceeds the mycorrhizal/non-mycorrhizal area report and is associated with the intensity. Based on this projection, for the development of arbuscules, a good developed hyphal network is required. The antagonistic intensity-non-mycorrhizal area vector shows a one quadrat movement compared to previous PCA. The mineral (V4) treatment shows an orientation of the antagonistic vector intensity-non-mycorrhizal areas that is similar to the control one (Figure 2d). The differences are clearly visible in the great dispersion of data, associated with an alteration of the gradual development of the colonization process, with great differences between different areas of the same colonized roots. Vesicles are still closed to the frequency of colonization, and, at a reduced angle, the arbuscules one too. The position indicates a potential development of both structures from the beginning of the colonization, with a higher vesicles share in conditions of frequency increases. After 20% of the colonization degree vector, the data became highly dispersed along Axis 2. The increase in mineral dose in the organic treatment (V5) produces a reorientation of the PCA. It is the only PCA that has the gradient of non-mycorrhizal areas in the left part of the ordination associated with data between the isolines 0–5% of the colonization degree. All the other vectors are oriented along Axis 1, a projection sustained by the 95.07% variance and explained by this axis. Vesicles are perfectly overlapped on frequency, which indicates an almost 100% possibility of developing vesicles from the beginning of the colonization. The arbuscules vector is oriented toward the heterogenous area in the lower part of the ordination, bellow the intensity vector, which sustains the idea of a hyphal network being necessary before the development of arbuscules.

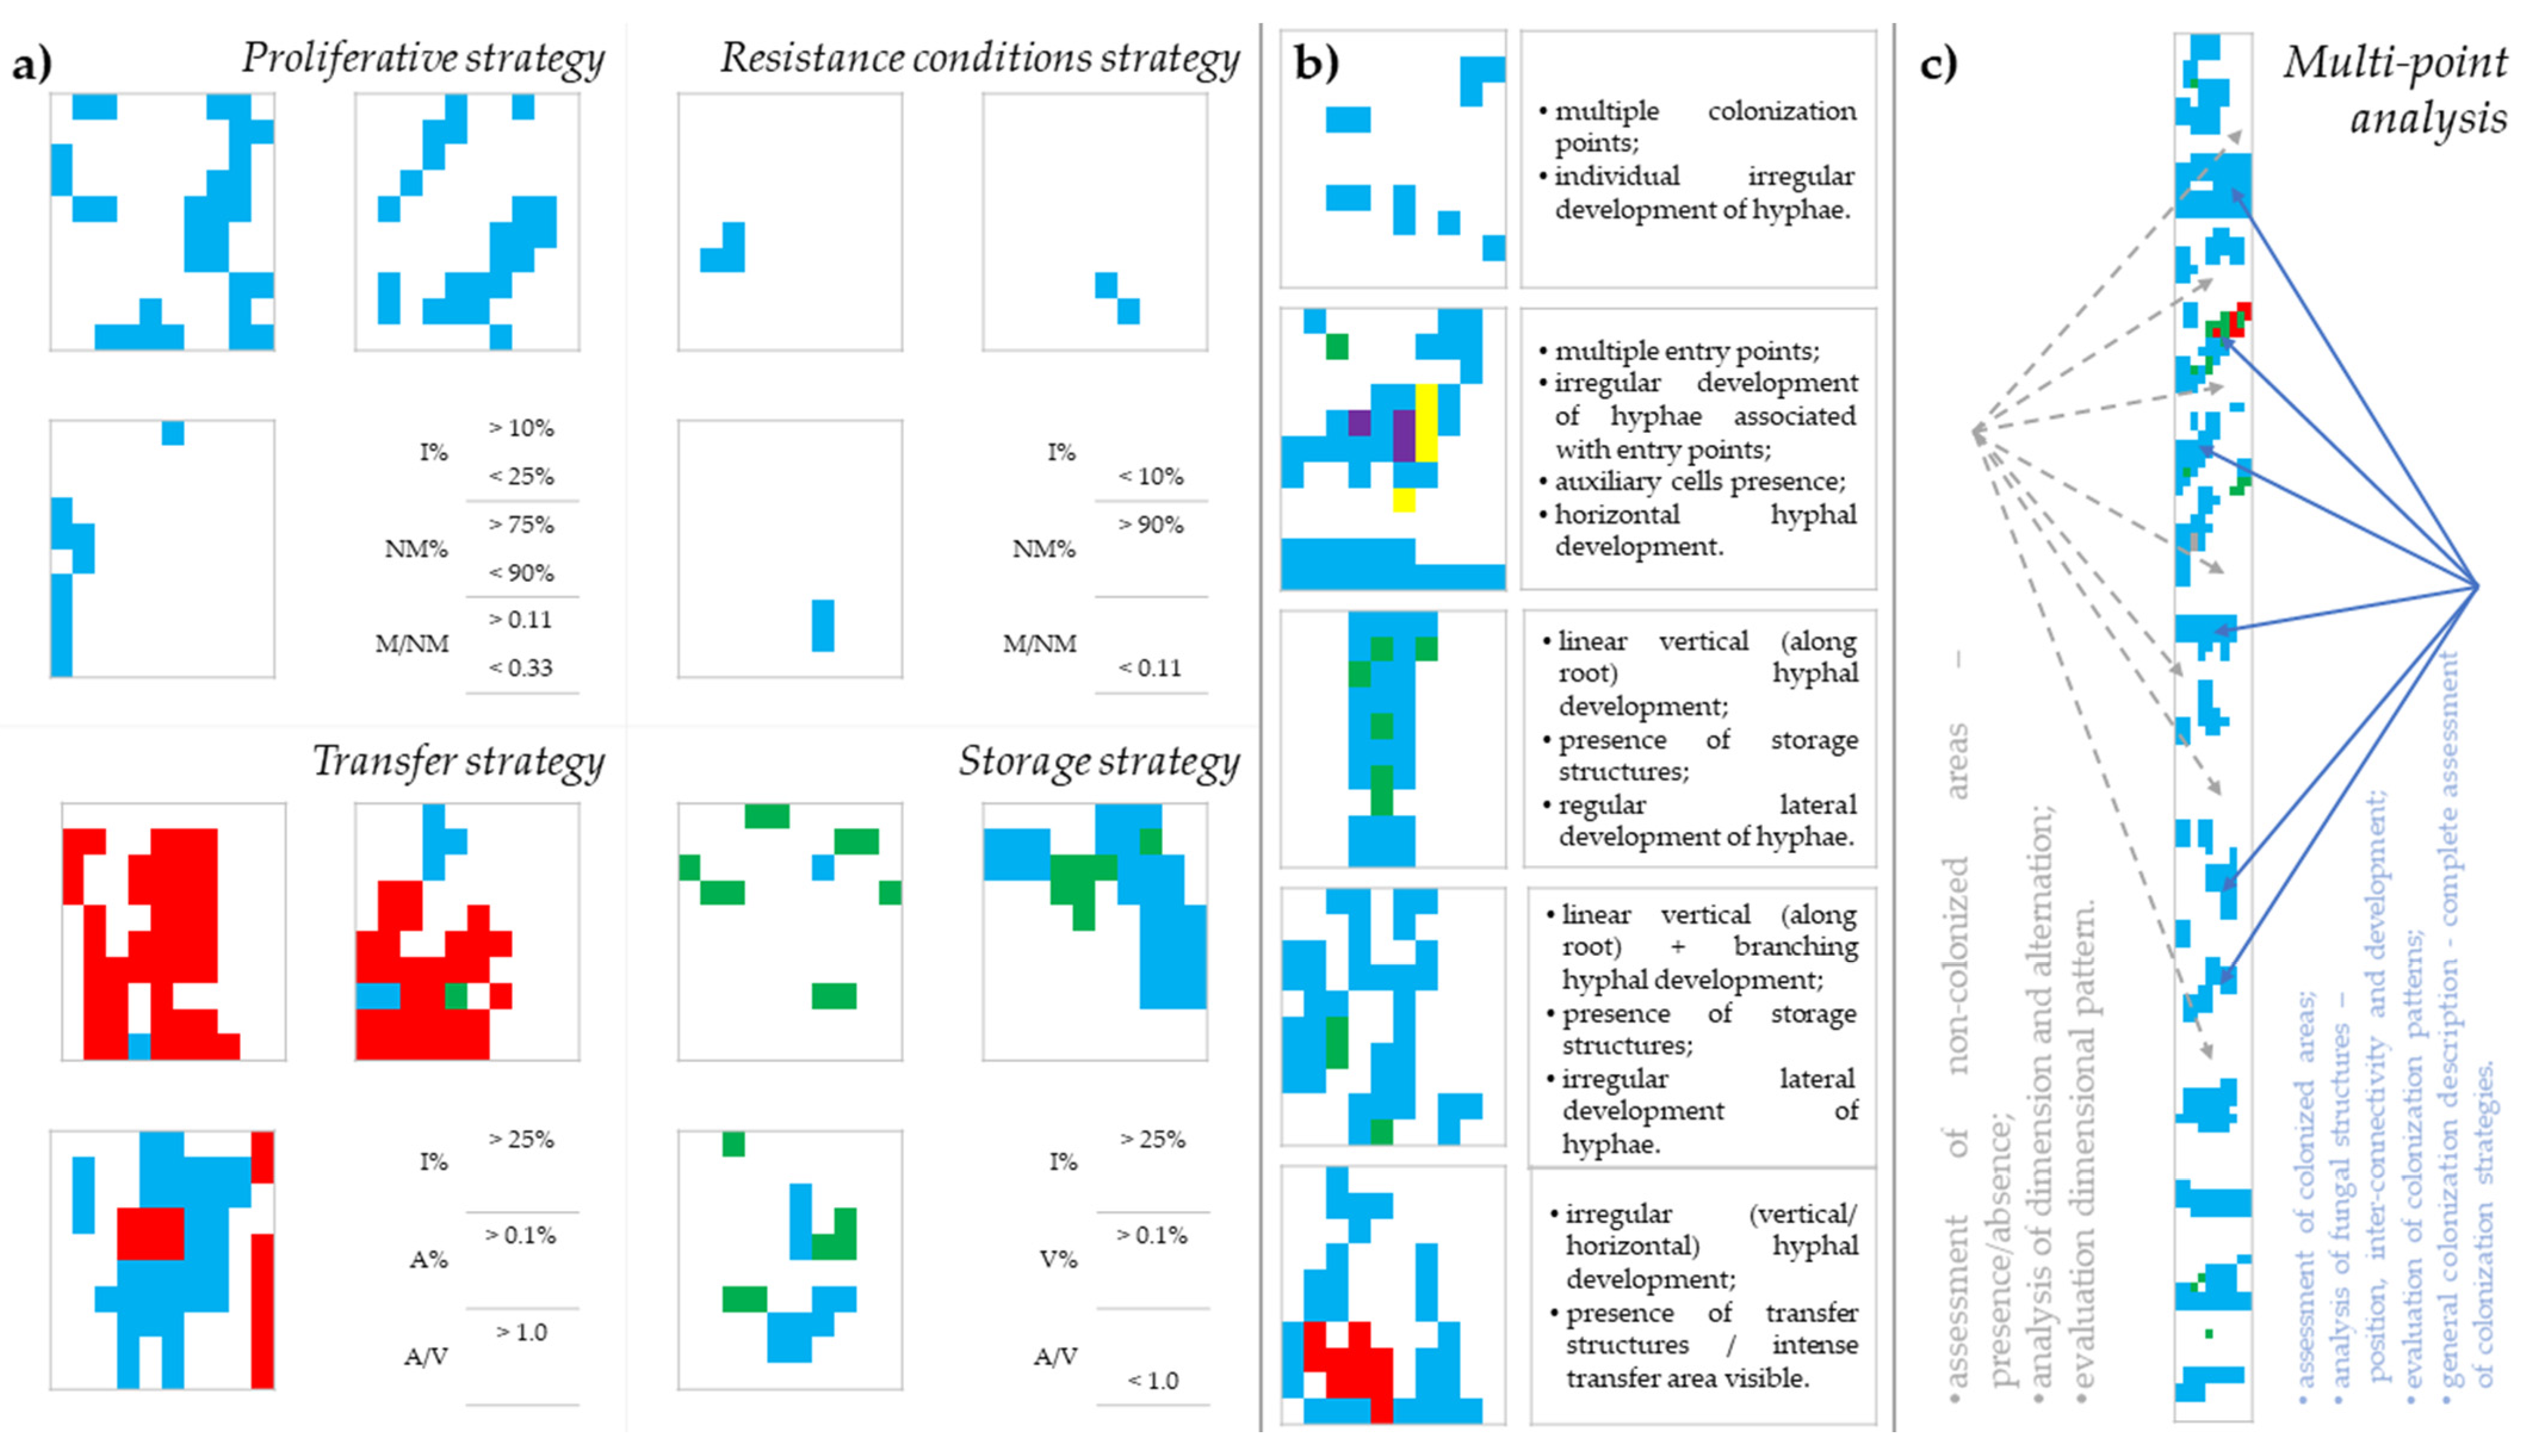
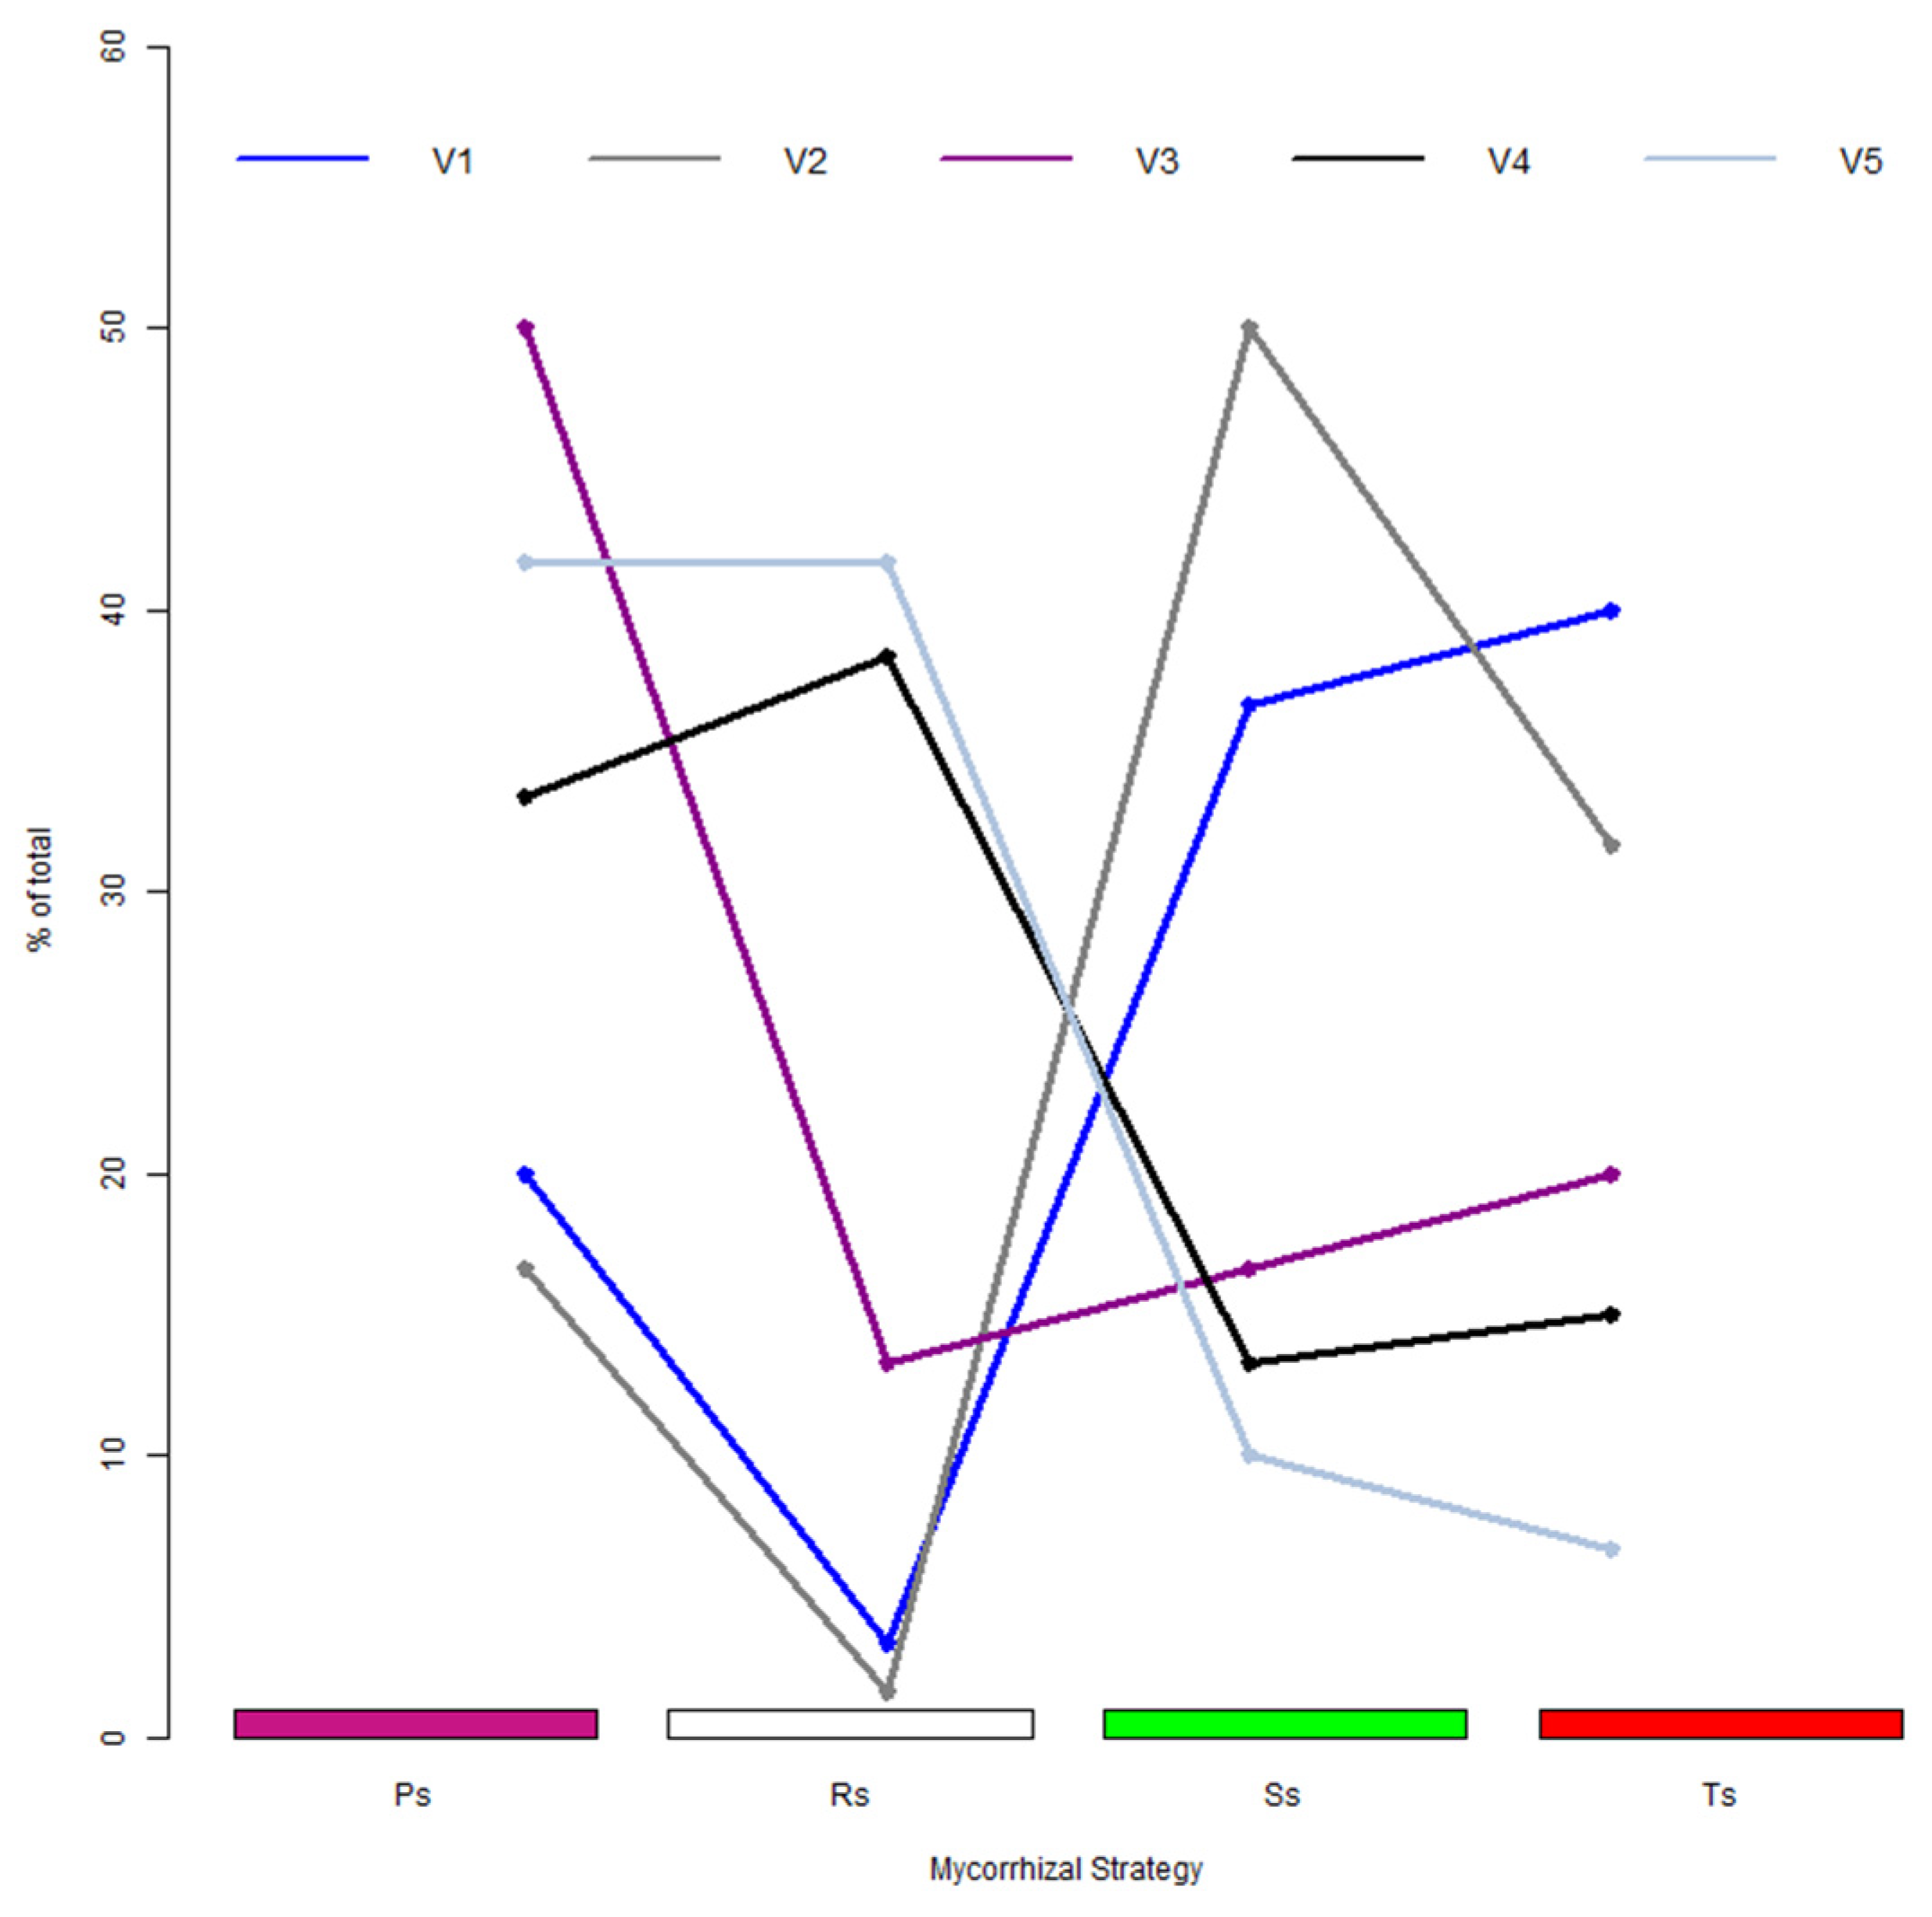
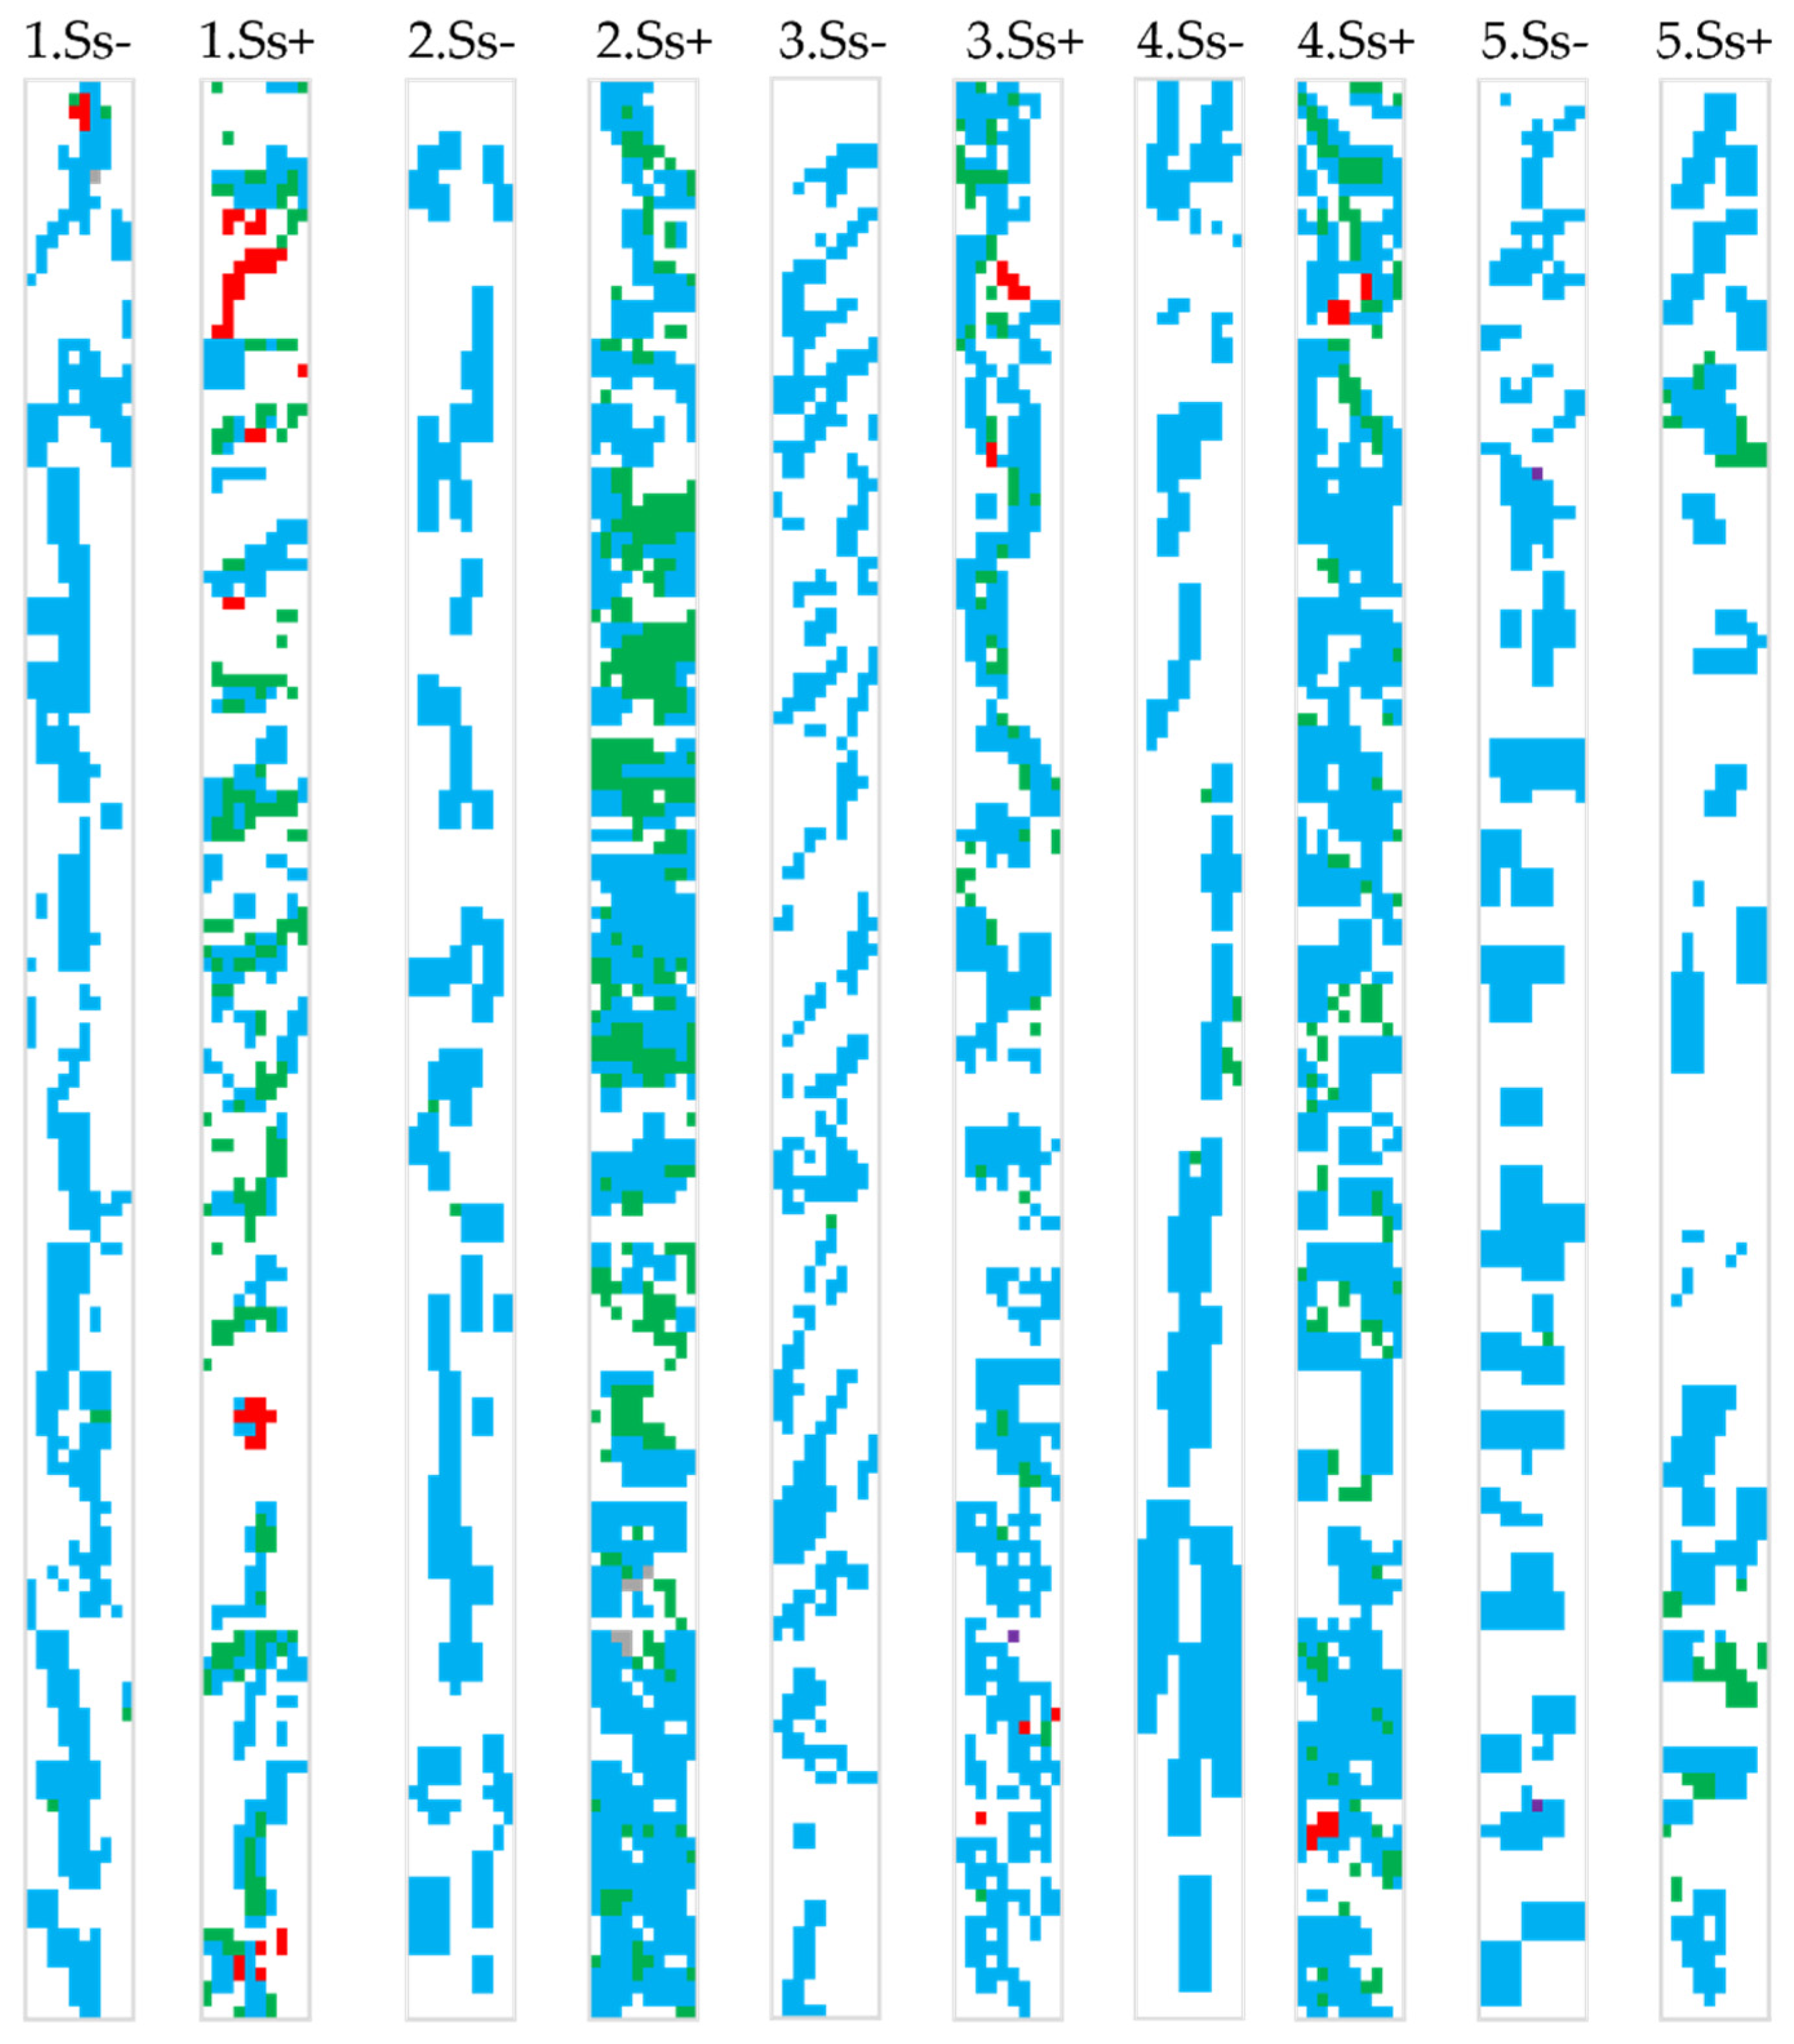
3.4. Establishment of Multi-Point Analysis as a Translation Tool in Deciphering Colonization Patterns and Strategies

The large database resulted from the microscopic colonization of A. capillaris roots, which imposed the necessity to create a specific guide for the assessment of both fungal patterns and colonization strategies (Figure 3). The multi-point analysis is a holistic concept that inter-connects multiple areas colonized by AM fungi and evaluates the non-mycorrhizal areas as disruptors within the colonization. Each colonization strategy implies a pattern of fungal development with the possibility of arbuscules and vesicles presence as secondary structures. The multi-point analysis permits the identification of multiple colonized areas within the same root segment, characterized by different colonization strategies and developmental patterns. This type of analysis is necessary for a deeper analysis of the colonization mechanism, which acts with various intensities within the same root. Four strategies were identified for A. capillaris, based on the proposal made by Corcoz et al. [52] Intensity of colonization in root segments is set as the indicator of all the colonization strategies. Based on the intensity value and the presence/absence of arbuscules and vesicles, the strategies present a clear orientation. The proliferative strategy is set to values of intensity in the interval 10–25%, which implies a potential future expansion of the hyphae network. This strategy also shows the trend of future development, to a longitudinal or radial, regular or irregular expansion in colonized roots.
Segments with a colonization intensity lower than 10% presents sparse colonized spots, numerous non-colonized areas and a mycorrhizal/non-mycorrhizal area report <0.11 (Figure 3). This strategy shows a plant resistance toward the establishment of a successful colonization. Over 25% colonization intensity, the presence of arbuscules and/or vesicles shows the orientation toward a transfer strategy or a storage one. The development patterns of hyphae and structures shows the colonization time-frame in the analyzed segment: incipient, intermediate, or mature. The presence of arbuscules at more than 0.1% along with an arbuscules/vesicles report higher than 1.0 indicates a clear transfer strategy. As an opposite, vesicles >0.1% and an arbuscules/vesicles report lower than 1.0 indicates a clear storage strategy.

3.5. Colonization Strategies Induced by the Application of Long-Term Treatments

The long-term application of inputs produces visible changes in the colonization strategies associated with each treatment (Figure 4). The native colonization shows only a 3% resistance strategy, while the transfer and storage strategies are identified in almost 40% each. A number of 20% of the segments are in a proliferative stage, which is the base for the future development of AM in A. capillaris roots. A slightly different trend is visible for organic treatments (V2), where half of the root is characterized by storage, with a reduction of both transfer and proliferative strategies. The application of mineral treatments (V3, V4 and V5) induces an increase in the share of root segments oriented toward a resistance strategy, along with an increase in the proliferative one. In high-mineral organic treatment (V5), the share of segments with less than 25% intensity of colonization reaches 84%, each strategy with an equal share. The resistance strategy share increases gradually from low-mineral organic treatment to mineral treatment to high-mineral organic treatment. This gradient is overlapped on the increase in the applied dose. This increase is associated with a decrease in both transfer and storage strategies.
Any of the analyzed root samples contained segments characterized by a resistance conditions strategy (Figure 5). The resistance conditions in each of the analyzed treatments presents large differences, starting with the native status (1.Rs) where most of the colonized areas show an irregular reduced development. The application of organic treatments (2.Rs) is visible in punctual colonized areas, with a very reduced development, which is a rare case for plants grown in this treatment regime. The low profile of resistance strategy, in low-organic treatment (3.Rs+/−), shows multiple colonized areas, with a reduced development. The upper resistance strategy profile shows six clear colonized areas, within which a development is visible. Non-colonized areas occupy a large proportion of the root, surrounding the colonized areas. An increase in the mineral dose applied with organic treatment (5.Rs+/−) produces an interesting difference between the low and upper resistance strategy patterns. The lower pattern shows only punctual colonization, with a very reduced development. The upper pattern shows irregular developed colonized areas, with an equal presence of non-colonized areas between them. The most interesting case is the mineral treatment (4.Rs+/−), with large, colonized areas alternating with reduced and uncolonized ones. A proliferative strategy creates various colonization patterns associated with applied treatments (Figure 6). Both arbuscules and vesicles are visible in the root segments of this strategy. The lower profile of the native proliferation strategy (1.Ps−) indicates an transverse development of hyphae, with several restricted areas where arbuscules are developed. The upper native proliferative profile presents a good hyphae development along the roots, with both arbuscules and vesicles present. Organic treatment (2.Ps+/−) implies either a good radial-irregular development of hyphae or punctual colonized areas. Large non-colonized areas are present with a heterogenous position. The upper proliferative pattern presents a mix of arbuscules/vesicles in the lateral irregularly colonized areas, which are separated by multiple small non-colonized areas. The mineral treatments (V3-V5) drastically alter the proliferative strategy pattern in the roots. A decrease is very visible from larger, irregularly developed, colonized areas with arbuscules/vesicles present (3.Ps+/−) up to sparse colonized areas with only vesicles being present (4.Ps+/−). The maximum applied treatment (V5) acts toward powerful linear-irregular colonized areas (5.Ps+), which are separated by non-colonized areas that are disposed as heterogenous.
Transfer strategies shows distinct patterns due to applied treatments (Figure 7). The segments belonging to the control variant (V1) requires a large hyphal network to develop arbuscules (1.Ts−), a mechanism in the presence of vesicles. Hyphal networks are developed along the root in this profile, alternating with large non-colonized areas and an irregular lateral branching. The upper native transfer strategy still present vesicles, near to the arbuscular areas (1.Ts+). Strong lateral development of arbuscules is visible, outcoming their basal hyphae. Application of organic treatment increases the hyphae system (2.Ts−), which is necessary to sustain a longitudinal development of arbuscular areas (2.Ts+). Lateral branching of arbuscular areas presents an irregular pattern, with a sparse presence of vesicles. As the organic-mineral treatments increase (V3 and V5), the arbuscules reduce their presence due to a reduction in hyphal networks (3.Ts− and 5.Ts−) and the presence of non-colonized areas in a proportion of 30–40%. Vesicles are present only in a low-mineral organic transfer strategy, the upper profile for this treatment showing a very large and condensed arbuscular area, surrounded by small irregular non-colonized areas. The higher mineral dose applied to V5 reduces the hyphae development of the lower transfer profile, the irregular development of these structures being surrounded by large non-colonized areas. The upper transfer profile for this treatment (5.Ts+) shows a maximum of half hyphae that can further develop arbuscules. The opposite to all transfer strategy is visible in mineral treated plants (V4), with a very large hyphal network developed and only few arbuscules emerging (4.Ts−) as compared to a very reduced hyphal network that is almost completely transformed in arbuscules (4.Ts+).
The storage strategy (Figure 8) is highly visible in native colonization (1.Ss+/−). The lower storage profile (1.Ss−) shows irregular-longitudinal development of hyphae along with a marginal emergence of vesicles. These hyphae permit the secondary emergence of vesicles in all colonized areas (1.Ss+). The organic treatment permits a two-phase development of a clear storage strategy, starting with a longitudinal-lateral branched hyphal network (2.Ss−) followed by a secondary increase in both hyphae and vesicles in all colonized areas (2.Ss+). The non-colonized areas appear sparse and produce small separation areas. The same storage strategy pattern is visible on a small scale at low-mineral organic treatment (3.Ss+/−), with both storage oriented segments showing hyphae in the lower profile compared to a dual development of hyphae and vesicles in the upper profile. The increase in the mineral dose (V5) produces a change in the storage strategy, with a punctual radial-irregular development of hyphae, surrounded by non-colonized areas and few arbuscules (5.Ss−). The upper profile for this treatment (5.Ss+) shows a reduction of vesicles and their heterogeneous presence in a few colonized areas. Mineral treatments restrict the storage strategy pattern to a longitudinal hyphae development and the emergence of few vesicles (4.Ss−) and an extensive development of hyphae, both horizontal and longitudinal, and a sparse emergence of multiple vesicles. Heterogenous non-colonized areas are still present, and the vesicles have a marginal position.

4. Discussion

4.1. Visibility of the Treatment Effect in Variability of Colonization Parameters

Long-term fertilization (N and P) in grassland induces changes in the structure of the floristic composition as well as in the edaphic level by changing the diversity of mycorrhizal fungi [58,59]. Within ecosystems, the diversity of plant communities can govern the composition of the soil microbial community and thus the activities carried out by them [60]. Plant species influence microbial communities in the soil, mainly through their functional traits [61]. Organic fertilizers are generally thought to be slow releasing fertilizers and they contain many trace elements [62]. The organic treatment acts as a slow-release nutrient resource, spread over a large area. This is a condition that sustains higher permission for fungal colonization in order to ensure an improved nutrient acquisition by the plant through the fungal component. The extent of mycorrhizal hyphae in roots have a maximum in the context of organic treatments. The same data were obtained by Gryndler [63] in terms of the length of the hyphae, and mineral fertilization reduces their size. The application of any dose of mineral fertilizers reduces drastically the frequency and intensity of colonization. As the gradient of mineral fertilizers increases, lower frequencies are observed. The restriction of fungal components is a phenomenon caused by the access of plants to easy soluble nutrients. Joner [64] demonstrated the highest value of the root colonization is visible in soils without phosphorus inputs, followed by organically fertilized soils and mineral fertilized ones, the last ones showing the weakest root colonization.
The native arbuscularity is almost double compared to the vesicle development potential. This mechanism sustains a general strategy oriented more toward increased transfer and partially to a storage one. Arbuscules are the specific structures of fungi responsible for bidirectional food transfer between symbiotic partners [65], and vesicles are responsible for storage [66]. The organic treatment acts as a dual stimulus for storage and transfer structures, which shows an almost equal strategy of colonization. The presence of mineral inputs acts as a restrictor for both structures, due to the easy access of plants to nutrients. The maximum gradient of the treatment decreases drastically the development of any secondary structure, with both the increased transfer and storage being almost deactivated, a mechanism associated with the restriction of fungal development in roots. Mineral fertilization reduces the number of arbuscules and extraradicular hyphae to the detriment of an increased number of vesicles only if phosphorus is limited [67].
An increase in the non-mycorrhizal area percent is visible in the presence of multiple un-colonized areas, or the restriction of fungal symbionts to a part of the root. Simultaneously, the volume explored by AM fungi decreases along with the increase in mineral nutrient availability, by up to less than 8% of the root. This mechanism is associated with mineral treatments, regardless of the dose, and implies a rapid growth of roots that overcome the hyphal extension potential. Mycorrhizae increase the absorption of phosphorus when it is limited in the soil, but also improves the absorption of nitrogen and phosphorus following fertilization [68]. The entire phenomenon acts toward the formation of areas with different exchange potential between the partners and the reduction of a further reconnection between colonized areas. In this case, there is an increased possibility for the appearance of areas with a lack of fungal symbionts or closures when hyphae are clogged. Fungal colonization can be positively or negatively influenced by mineral fertilization depending on the amount of fertilizer applied and the nutrient limitation of mycorrhizal fungi [69].

4.2. Interrelations between Mycorrhizal Parameters Shape the Model of Colonization Mechanism

Based on correlations established between all parameters, the hyphae development and secondary structures show different associations. The high correlation between intensity and frequency shows a good development of fungi in every colonized area. The intensity of the colonization process recorded in A. capillaris in the native environment is double the value identified by Gollotte [70], as a result of colonization by the species which form the genus Glomus, Scutellospora and Acaulospora. This phenomenon indicates a stable partnership between the two symbionts, which correspond to a long-term presence of both in the same ecosystem. The colonization degree, as a synthetic indicator of both parameters, will vary greatly due to the punctual permissiveness of roots, but all the exposed areas to the AM partner will be further colonized and explored. A. capillaris has a fine root, adapted to the limited conditions of nutrients, and some researchers claim that the species responds positively to colonization fungi for the benefits brought against pathogens [71]. The correlations between arbuscules and vesicles, in terms of frequency and intensity, revealed different interesting mechanisms. The first one is related to the perennity of plants and their dominance in HNV grasslands, which stimulates the development of vesicles as storage structures. All parameters act toward an increase in these structures as they increase in value. The second mechanism is related to the slow movement of nutrients in grasslands and their small amount in soil as available forms. A. capillaris has a higher absorption of amino acids, even though it is a species that excels in less fertile environments [72]. This reduces the need for a high arbuscules presence in a low flux of elements between AM and its partner. The most interesting observation is the lack of a significant correlation between arbuscules and vesicles. As the colonization process reaches its peak, the fungal growth pattern changes from one dominated by hyphae and arbuscules to one dominated by vesicles, usually considered as a deposit or reproductive structure [73]. Thus, it goes from a period of intense activity of the process to a stage of stagnation of the symbiosis, but is active strictly for the fungal community. For the general model of mycorrhizas in roots of A. capillaris, the absence of a direct important relation between these structures indicates the potential for their concomitant presence in the same or adjacent colonized areas. The same hyphae network acts as a transport system for both arbuscules and vesicles, which implies the same functional model in the dual colonized areas. Based on previous research, the arbuscules are found mainly in the fine roots and vesicles in the middle roots [74]. The further conversion of colonized roots to either transfer or storage is due to an increase in either one of these structures to the detriment of the other one.

4.3. Linking Colonization Patterns and Fungal Strategies

MycoPatt acts as a tool for the conversion of AM colonization in multiple data sets, with the extraction of colonization patterns. Application of multi-point analysis works as a translation tool for deciphering the MycoPatt colonization maps, the extent of fungal symbiont in roots and the development of secondary structures. Based on map translation, colonization strategies can be evaluated, and the direction of the colonization process can be described in depth. AM can develop irregularly, around one or multiple colonization points. The linear development of hyphae can be present along with a determined balanced lateral development, or with irregular lateral hyphal branches. Arbuscules and vesicles, if present, indicate an area of intense transfer processes, respectively areas for storage purposes. When analyzed in detail, in case of multiple non-colonized areas, AM hyphae from each root segment can act as a separate symbiosis in terms of functioning. This phenomenon represents the fabulous flexibility of the symbiotic partnership, with a global continuous nutrient flux from AM composed by sections with different intensities in the transfer or storage. The value of the arbuscules/vesicles report is in where it indicates whether a clear transfer or storage strategy, or a mixed strategy with multiple areas in the same segment, are oriented to one or both of these strategies. The biological mechanism of symbiosis and the colonization strategy add a supplementary understanding to how fungi allocate resources to sustain plants and how this process evolves over time.

4.4. Long-Term Teatments Shape Different Mycorrhizal Colonization Strategies

The native colonization strategy shows a balanced allocation of fungal structural development toward both transfer and storage strategies. This implies a rapid nutrient transfer in 40% of roots, while almost equal areas are associated with storage. This permits the host to have reserves to survive in oligotrophic conditions and to sustain its growth and development at the same time. The application of organic treatments increases the presence of storage structures, due to the unbalanced release of nutrients from manure. AM partners develop vesicles for storage on excess nutrients, which remain in roots for longer periods of time. Nevertheless, the presence of arbuscules in more than 30% of segments indicates that transfer is still very active between symbionts. Quantities of minerals such as nitrogen and phosphorus influence the formation of structures specific to the fungal component. Nitrogen fertilization in moderate amounts positively influence the formation of arbuscules [75], and the amounts of phosphorus positively influence the vesicles [76]. The high share of proliferative and resistance strategies associated with high-mineral organic treatments indicates the existence of nutrients available for plants. This restricts the extensive colonization and reduces the transfer and storage to 17% of the root system. Any dose of mineral treatments, even when applied with an organic buffer, decrease the presence of storage and transfer structures. Every life cycle of a mycorrhizal fungus is influenced by the roots of the plants [77]. The type of soil does not drastically influence root colonization, and the identity of the host species is key in symbiosis with fungi [78,79]. The species A. capillaris prefers the communities of fungi in the rhizosphere area, and a lower presence of bacteria [80].
The native resistance conditions strategy in roots shows how largely uncolonized areas divide the colonized areas, creating the premise of limitation to a punctual blocked colonization. The low-mineral organic treatments present multiple colonized areas which shows an extension of colonization in an irregular-linear pattern along the roots. This pattern indicates a potential secondary development of colonization along roots, by the development of both linear and branched hyphae networks. The upper resistance strategy profile in mineral treatments present vesicles as secondary structures to store the excess of nutrients. This is consistent with the proliferation of mycorrhizal fungi in organic matter, with an efficient recycling of mineral nutrients and the reduction of their leaching potential [81].
The native proliferative strategy shows the development of transverse hyphae in the first stages, which grow laterally later and develop both arbuscules and vesicles. Each of these structures are present in different areas, which implies the existence of different activities in the same root segment. Organic treatment permits the existence of both arbuscules and vesicles in higher shares, which sustain a mixed flow from AM to plant roots. The necessary nutrients for plants, available for AM, are transferred to the arbuscules areas, while the excess is stored in vesicles. An increase in mineral dose restricts the hyphal development to colonized areas heterogenous disposed, and the reduction of arbuscules and vesicles. The present study is in accordance with the results obtained by other researchers, and the complex fertilization (NPK) promotes an increase in hyphae and the number of vesicles in grassland species [82]. This mechanism implies a root growth due to available nutrients at a speed higher than the potential development of hyphae. The native transfer strategy is based on extensive hyphae, which are further converted to multiple arbuscules. This strategy still implies the presence of vesicles and a mixed transfer-storage mechanism, with the highest share to transfer. Both mineral-organic treatments present an irregular development of colonized and arbuscule areas, indicating a different root permissiveness for AM development along root segments. There is a clear decrease in hyphal network in favor of arbuscules development in high-mineral organic treatment, which maintains the overall presence of AM structures to similar levels between low and upper profiles. Mineral treatment acts as a converter of fungal transfer strategy with two possible scenarios: the extensive irregular hyphal development followed by secondary development of arbuscules or a rapid development of arbuscules in colonized areas. The storage strategy shows in general a marginal development of vesicles, an indicator of secondary development of these structures. Fertilization decreases the density of hyphae and arbuscules but keeps the ratio of vesicles, which can be explained by selecting fungi that are inferior to each other [83]. The vesicles abundance varies greatly between treatments, with higher shares in organic and native profiles.

5. Conclusions

The type and dose of treatment highly influences the values of the colonization parameters. Frequency of the colonization process varies in the range of 31%, high-mineral organic treatment, to 68% in organic treated variants. The intensity and colonization degree follow the same trend as frequency, the interval of variation being 14–38% for the intensity and 7 up to 31% for the colonization degree. A highly significant correlation is established between colonization parameters, with a maximum for Frequency x Intensity of colonization (0.90), Intensity x Colonization Degree (0.97), respectively, and Frequency x Colonization Degree (0.88). In terms of strategy establishment, treatments are the driving force in directing the process of colonization toward a specific strategy. Natural grassland tends to direct the symbiotic process towards a transfer strategy (40%) simultaneous with both storage (37%) and proliferative strategies (20%). Exclusively organic treatment leads to the formation of vesicles and implicitly to a predominant storage strategy (50%), due to the high content of slow-release nutrients. A high share of minerals acts as a restriction for the colonization process, the strategy being conducted to resistance conditions. The organic mixture, with small quantities of minerals, lead the colonization mechanism towards a proliferative strategy, but reduces the presence of arbuscules and vesicles by up to half compared to the native mycorrhizal profile.

Supplementary Materials

The following supporting information can be downloaded at: https://0-www-mdpi-com.brum.beds.ac.uk/article/10.3390/agriculture12060847/s1, Table S1: Pearson correlation between mycorrhizal parameters as influenced by long-term treatments.

Author Contributions

Conceptualization, L.C., V.S. and R.V.; methodology, L.C., F.P., I.V., V.P.-M., A.P.; software, L.C., V.S.; validation, F.P., I.V., A.P. and V.P.-M.; formal analysis, L.C., V.P.-M., V.S. and R.V.; investigation, L.C., V.P.-M., V.S. and R.V.; data curation, L.C., F.P., I.V. and A.P.; writing—original draft preparation, L.C., F.P., I.V., A.P., V.P.-M., V.S. and R.V.; writing—review and editing, L.C., F.P., I.V., A.P., V.P.-M., V.S. and R.V.; visualization, L.C., F.P., I.V. and A.P.; supervision, V.S. and R.V. All authors have read and agreed to the published version of the manuscript.

Funding

This research received no external funding.

Data Availability Statement

The data presented in this study are available on request from the corresponding authors.

Acknowledgments

This paper is part of a PhD study in the thematic area of Mycorrhizal Status and Development of Colonization in Mountain Grassland Dominant Species, conducted by the first author L.C., under the coordination of Roxana Vidican (R.V.).

Conflicts of Interest

The authors declare no conflict of interest.

References

  1. Schmitt, T.; Rákosy, L. Changes of Traditional Agrarian Landscapes and Their Conservation Implications: A Case Study of Butterflies in Romania. Divers. Distrib. 2007, 13, 855–862. [Google Scholar] [CrossRef]
  2. Bond, W.J.; Parr, C.L. Beyond the Forest Edge: Ecology, Diversity and Conservation of the Grassy Biomes. Biol. Conserv. 2010, 143, 2395–2404. [Google Scholar] [CrossRef]
  3. Carlson, M.L.; Flagstad, L.A.; Gillet, F.; Mitchell, E.A.D. Community development along a proglacial chronosequence: Are above-ground and below-ground community structure controlled more by biotic than abiotic factors? J. Ecol. 2010, 98, 1084–1095. [Google Scholar] [CrossRef]
  4. van Andel, J.; Aronson, J. Restoration Ecology: The New Frontier; John Wiley & Sons: Hoboken, NJ, USA, 2012; ISBN 9781118223154. [Google Scholar]
  5. Luo, W.; Xu, C.; Ma, W.; Yue, X.; Liang, X.; Zuo, X.; Knapp, A.K.; Smith, M.D.; Sardans, J.; Dijkstra, F.A.; et al. Effects of extreme drought on plant nutrient uptake and resorption in rhizomatous vs bunchgrass-dominated grasslands. Oecologia 2018, 188, 633–643. [Google Scholar] [CrossRef]
  6. Egli, T. How to live at very low substrate concentration. Water Res. 2010, 44, 4826–4837. [Google Scholar] [CrossRef]
  7. Duff, A.M.; Forrestal, P.; Ikoyi, I.; Brennan, F. Assessing the long-term impact of urease and nitrification inhibitor use on microbial community composition, diversity and function in grassland soil. Soil Biol. Biochem. 2022, 170, 108709. [Google Scholar] [CrossRef]
  8. Davison, J.; Vasar, M.; Sepp, S.K.; Oja, J.; Al-Quraishy, S.; Bueno, C.G.; Cantero, J.J.; Fabiano, E.C.; Decocq, G.; Fraser, L.; et al. Dominance, diversity, and niche breadth in arbuscular mycorrhizal fungal communities. Ecology 2022, e3761. [Google Scholar] [CrossRef]
  9. Le Roux, X.; Schmid, B.; Poly, F.; Barnard, R.L.; Niklaus, P.A.; Guillaumaud, N.; Habekost, M.; Oelmann, Y.; Philippot, L.; Salles, J.F.; et al. Soil Environmental Conditions and Microbial Build-Up Mediate the Effect of Plant Diversity on Soil Nitrifying and Denitrifying Enzyme Activities in Temperate Grasslands. PLoS ONE 2013, 8, e61069. [Google Scholar] [CrossRef]
  10. Christina, B.; Braker, G.; Matthies, D.; Reuter, A.; Engels, C.; Conrad, R. Impact of plant functional group, plant species, and sampling time on the composition of nirK-type denitrifier communities in soil. Appl. Environ. Microbiol. 2007, 73, 6876–6884. [Google Scholar]
  11. Debasis, M.; Braker, G.; Matthies, D.; Reuter, A.; Engels, C.; Conrad, R. Involvement of strigolactone hormone in root development, influence and interaction with mycorrhizal fungi in plant: Mini-review. Curr. Res. Microb. Sci. 2021, 2, 100026. [Google Scholar]
  12. Madawala, H.M.S.P. Chapter 7—Arbuscular Mycorrhizal Fungi as Biofertilizers: Current Trends, Challenges, and Future Prospects. In Biofertilizers; Rakshit, A., Meena, V.S., Parihar, M., Singh, H.B., Singh, A.K., Eds.; Woodhead Publishing: Sawston, UK, 2021; pp. 83–93. ISBN 9780128216675. [Google Scholar]
  13. Salmeron-Santiago, I.A.; Martínez-Trujillo, M.; Valdez-Alarcón, J.J.; Pedraza-Santos, M.E.; Santoyo, G.; Pozo, M.J.; Chávez-Bárcenas, A.T. An Updated Review on the Modulation of Carbon Partitioning and Allocation in Arbuscular Mycorrhizal Plants. Microorganisms 2022, 10, 75. [Google Scholar] [CrossRef] [PubMed]
  14. Radhakrishnan, R. Mycorrhizal Fungi: Utilization in Agriculture and Forestry; BoD—Books on Demand: Norderstedt, Germany, 2021; ISBN 9781838819408. [Google Scholar]
  15. Boutaj, H.; Meddich, A.; Roche, J.; Mouzeyar, S.; el Modafar, C. The effects of mycorrhizal fungi on vascular wilt diseases. Crop Prot. 2022, 155, 105938. [Google Scholar] [CrossRef]
  16. Fujita, M.; Kusajima, M.; Fukagawa, M.; Okumura, Y.; Nakajima, M.; Akiyama, K.; Asami, T.; Yoneyama, K.; Kato, H.; Nakashita, H. Response of tomatoes primed by mycorrhizal colonization to virulent and avirulent bacterial pathogens. Sci. Rep. 2022, 12, 4686. [Google Scholar] [CrossRef] [PubMed]
  17. Dey, M.; Ghosh, S. Arbuscular mycorrhizae in plant immunity and crop pathogen control. Rhizosphere 2022, 22, 100524. [Google Scholar] [CrossRef]
  18. Guisande-Collazo, A.; González, L.; Souza-Alonso, P. Origin Makes a Difference: Alternative Responses of an AM-Dependent Plant to Mycorrhizal Inoculum from Invaded and Native Soils under Abiotic Stress. Plant Biol. 2022, 24, 417–429. [Google Scholar] [CrossRef]
  19. Bennett, A.E.; Groten, K. The Costs and Benefits of Plant–Arbuscular Mycorrhizal Fungal Interactions. Annu. Rev. Plant Biol. 2022, 73, 649–672. [Google Scholar] [CrossRef]
  20. Jajoo, A.; Mathur, S. Role of Arbuscular Mycorrhizal Fungi as an Underground Saviuor for Protecting Plants from Abiotic Stresses. Physiol. Mol. Biol. Plants 2021, 27, 2589–2603. [Google Scholar] [CrossRef]
  21. Malhi, G.S.; Kaur, M.; Kaushik, P.; Alyemeni, M.N.; Alsahli, A.A.; Ahmad, P. Arbuscular mycorrhiza in combating abiotic stresses in vegetables: An eco-friendly approach. Saudi J. Biol. Sci. 2021, 28, 1465–1476. [Google Scholar] [CrossRef]
  22. Mbodj, D.; Effa-Effa, B.; Kane, A.; Manneh, B.; Gantet, P.; Laplaze, L.; Diedhiou, A.G.; Grondin, A. Arbuscular mycorrhizal symbiosis in rice: Establishment, environmental control and impact on plant growth and resistance to abiotic stresses. Rhizosphere 2018, 8, 12–26. [Google Scholar] [CrossRef]
  23. Riaz, M.; Kamran, M.; Fang, Y.; Wang, Q.; Cao, H.; Yang, G.; Deng, L.; Wang, Y.; Zhou, Y.; Anastopoulos, I.; et al. Arbuscular mycorrhizal fungi-induced mitigation of heavy metal phytotoxicity in metal contaminated soils: A critical review. J. Hazard. Mater. 2021, 402, 123919. [Google Scholar] [CrossRef]
  24. Solís-Ramos, L.Y.; Coto-López, C.; Andrade-Torres, A. Role of Arbuscular Mycorrhizal Symbiosis in Remediation of Anthropogenic Soil Pollution. Symbiosis 2021, 84, 321–336. [Google Scholar] [CrossRef]
  25. Sudipti, A.; Kumar, A.; Ogita, S.; Yau, Y.-Y. (Eds.) Innovations in Environmental Biotechnology; Springer: Berlin/Heidelberg, Germany, 2022. [Google Scholar] [CrossRef]
  26. Dassen, S.; van der Putten, W.H.; De Deyn, G.B. Severance of arbuscular mycorrhizal fungal mycelial networks in restoration grasslands enhances seedling biomass. New Phytol. 2021, 232, 753–761. [Google Scholar] [CrossRef]
  27. Fernandes Figueiredo, A.; Boy, J.; Guggenberger, G. Common Mycorrhizae Network: A Review of the Theories and Mechanisms Behind Underground Interactions. Front. Fungal Biol. 2021, 2, 735299. [Google Scholar] [CrossRef]
  28. Semchenko, M.; Barry, K.E.; de Vries, F.T.; Mommer, L.; Moora, M.; Maciá-Vicente, J.G. Deciphering the role of specialist and generalist plant–microbial interactions as drivers of plant–soil feedback. New Phytol. 2022, 234, 1929–1944. [Google Scholar] [CrossRef]
  29. Cheng, J.-K.; Cao, M.-Y.; Yang, H.-R.; Yue, M.-F.; Xin, G.-R.; Chen, B.-M. Interactive effects of allelopathy and arbuscular mycorrhizal fungi on the competition between the invasive species Bidens alba and its native congener Bidens biternata. Weed Res. 2022, 1–9, in press. [Google Scholar] [CrossRef]
  30. Sepp, S.-K.; Davison, J.; Jairus, T.; Vasar, M.; Moora, M.; Zobel, M.; Öpik, M. Non-random association patterns in a plant–mycorrhizal fungal network reveal host–symbiont specificity. Mol. Ecol. 2019, 28, 365–378. [Google Scholar] [CrossRef]
  31. Prado-Tarango, D.E. Mycorrhizal Fungi on the Sagebrush Steppe: Benefits for Restoring Keystone Rangeland Plant Species; Oregon State University: Corvallis, OR, USA, 2021. [Google Scholar]
  32. Hernández, D.H.; Larsen, J.; González-Rodríguez, A.; Tapia-Torres, Y.; de la Barrera, E.; Luis; Eguiarte, E.; García-Oliva, F. Cooperation between Sporobolus airoides and associated arbuscular mycorrhizal fungi for phosphorus acquisition under drought conditions in an oligotrophic desert ecosystem. Rhizosphere 2020, 15, 100225. [Google Scholar] [CrossRef]
  33. Tiley, G.E.D. Biological Flora of the British Isles: Cirsium arvense (L.) Scop. J. Ecol. 2010, 98, 938–983. [Google Scholar] [CrossRef]
  34. Peeters, A.; Food and Agriculture Organization. Wild and Sown Grasses: Profiles of a Temperate Species Selection, Ecology, Biodiversity and Use; Food & Agriculture Organization: Rome, Italy, 2004; ISBN 9789251051597. [Google Scholar]
  35. Burescu, L.I.N.; Morar-Burescu, E.A.; Ștef, S.F.; Vlad, I.A.; Bartha, S.; Pop, I.F.; Bojinescu-Rostescu, I. Vegetation and productive potential of dominant grasslands by Festuca valesiaca and Agrostis capillaris in northwestern Romania. Rom. Agric. Res. 2021, 39, 1–14. [Google Scholar]
  36. Agrostis capillaris (Common Bent). Available online: https://www.cabi.org/isc/datasheet/3830?fbclid=IwAR1efyHa9vJsOtzE_r2_C5U6l6lF_uMTr92ntKIM0iPPsTUhCOXJeqs2Do (accessed on 20 May 2022).
  37. Yin, Y.; Yuan, Y.; Zhang, X.; Huhe; Cheng, Y.; Borjigin, S. Comparison of the Responses of Soil Fungal Community to Straw, Inorganic Fertilizer, and Compost in a Farmland in the Loess Plateau. Microbiol. Spectr. 2022, 10, e02230-21. [Google Scholar] [CrossRef]
  38. Emery, S.M.; Reid, M.L.; Bell-Dereske, L.; Gross, K.L. Soil mycorrhizal and nematode diversity vary in response to bioenergy crop identity and fertilization. GCB Bioenergy 2017, 9, 1644–1656. [Google Scholar] [CrossRef]
  39. Van der Heijden, M.G.A.; Martin, F.M.; Selosse, M.-A.; Sanders, I.R. Mycorrhizal ecology and evolution: The past, the present, and the future. New Phytol. 2015, 205, 1406–1423. [Google Scholar] [CrossRef]
  40. Řezáčová, V.; Czakó, A.; Stehlík, M.; Mayerová, M.; Šimon, T.; Smatanová, M.; Madaras, M. Organic Fertilization Improves Soil Aggregation through Increases in Abundance of Eubacteria and Products of Arbuscular Mycorrhizal Fungi. Sci. Rep. 2021, 11, 12548. [Google Scholar] [CrossRef] [PubMed]
  41. Feilinezhad, A.; Mirzaeiheydari, M.; Babaei, F.; Maleki, A.; Rostaminya, M. The Effect of Tillage, Organic Matter and Mycorrhizal Fungi on Efficiency and Productivity Use of Nutrients in Maize. Commun. Soil Sci. Plant Anal. 2022, 53, 1–15. [Google Scholar] [CrossRef]
  42. Benaffari, W.; Boutasknit, A.; Anli, M.; Ait-El-Mokhtar, M.; Ait-Rahou, Y.; Ben-Laouane, R.; Ben Ahmed, H.; Mitsui, T.; Baslam, M.; Meddich, A. The Native Arbuscular Mycorrhizal Fungi and Vermicompost-Based Organic Amendments Enhance Soil Fertility, Growth Performance, and the Drought Stress Tolerance of Quinoa. Plants 2022, 11, 393. [Google Scholar] [CrossRef]
  43. Al-Maliki, S.; Al-zabee, M. Interactions between Biofertilizers and Chemical Fertilizers Affected Soil Biological Properties and Potato Yield. Euphrates J. Agric. Sci. 2019, 11, 1–13. [Google Scholar]
  44. Amir, H.; Gensous, S.; Cavaloc, Y.; Wantiez, L. Phosphorus Fertilization of an Ultramafic Soil Reduced Effects of Arbuscular Mycorrhizal Fungi but Not Mycorrhizal Colonization. J. Soil Sci. Plant Nutr. 2021, 21, 3544–3554. [Google Scholar] [CrossRef]
  45. Muneer, M.A.; Tarin, M.W.K.; Chen, X.; Afridi, M.S.; Iqbal, A.; Munir, M.Z.; Zheng, C.; Zhang, J.; Ji, B. Differential Response of Mycorrhizal Fungi Linked with Two Dominant Plant Species of Temperate Grassland under Varying Levels of N-Addition. Appl. Soil Ecol. 2022, 170, 104272. [Google Scholar] [CrossRef]
  46. McCain, K.N.S.; Wilson, G.W.T.; Blair, J.M. Mycorrhizal suppression alters plant productivity and forb establishment in a grass-dominated prairie restoration. Plant Ecol. 2011, 212, 1675–1685. [Google Scholar] [CrossRef]
  47. Zubek, S.; Kapusta, P.; Rożek, K.; Błaszkowski, J.; Gielas, I.; Nobis, M.; Świerszcz, S.; Nowak, A. Fungal root colonization and arbuscular mycorrhizal fungi diversity in soils of grasslands with different mowing intensities. Appl. Soil Ecol. 2022, 172, 104358. [Google Scholar] [CrossRef]
  48. Vaida, I. The Influence of Management on the Agronomic and Ecological Value of Mountain Grasslands. Ph.D. Thesis, University of Agricultural Sciences and Veterinary Medicine, Cluj-Napoca, Romania, 2018. Available online: https://rei.gov.ro/ (accessed on 20 May 2022).
  49. Stoian, V.H.; Florian, V. Mycorrhiza–Benefits, Influence, Diagnostic Method. Bull. UASMV Agric. 2009, 66, 2009. [Google Scholar] [CrossRef]
  50. Stoian, V.; Vidican, R.; Crişan, I.; Puia, C.; Şandor, M.; Stoian, V.A.; Păcurar, F.; Vaida, I. Sensitive approach and future perspectives in microscopic patterns of mycorrhizal roots. Sci. Rep. 2019, 9, 10233. [Google Scholar] [CrossRef] [PubMed]
  51. Corcoz, L.; Păcurar, F.; Pop-Moldovan, V.; Vaida, I.; Stoian, V.; Vidican, R. Mycorrhizal Patterns in the Roots of Dominant Festuca rubra in a High-Natural-Value Grassland. Plants 2021, 11, 112. [Google Scholar] [CrossRef] [PubMed]
  52. Corcoz, L.; Păcurar, F.; Vaida, I.; Pleșa, A.; Moldovan, C.; Stoian, V.; Vidican, R. Deciphering the Colonization Strategies in Roots of Long-Term Fertilized Festuca rubra. Agronomy 2022, 12, 650. [Google Scholar] [CrossRef]
  53. RStudio Team. RStudio: Integrated Development Environment for R; RStudio Inc., RStudio Team: Boston, MA, USA, 2019. [Google Scholar]
  54. RCore Team. R: A Language and Environment for Statistical Computing; R Foundation for Statistical Computing: Vienna, Austria, 2021. [Google Scholar]
  55. Revelle, W. Psych: Procedures for Psychological, Psychometric, and Personality Research; R Package Version 1.9.12; Northwestern University: Evanston, IL, USA, 2019. [Google Scholar]
  56. De Mendiburu, F. Agricolae: Statistical Procedures for Agricultural Research. 2019. Available online: https://CRAN.R-project.org/package=agricolae (accessed on 20 May 2022).
  57. Oksanen, J.; Blanchet, F.G.; Friendly, M.; Kindt, R.; Legrende, P.; McGlinn, D.; Wagner, H. 633 Vegan: Community Ecology Package; R Package Version 2.5-2; 2019; Available online: https://CRAN.R-project.org/package=vegan (accessed on 20 May 2022).
  58. Wang, G.; Koziol, L.; Foster, B.L.; Bever, J.D. Microbial mediators of plant community response to long term N and P fertilization: Evidence of a role of plant responsiveness to mycorrhizal fungi. Glob. Chang. Biol. 2022, 28, 2721–2735. [Google Scholar] [CrossRef]
  59. Ning, Q.; Jiang, L.; Niu, G.; Yu, Q.; Liu, J.; Wang, R.; Liao, S.; Huang, J.; Han, X.; Yang, J. Mowing increased plant diversity but not soil microbial biomass under N-enriched environment in a temperate grassland. Plant Soil 2022, 1–13. [Google Scholar] [CrossRef]
  60. Liu, L.; Zhu, K.; Wurzburger, N.; Zhang, J. Relationships between plant diversity and soil microbial diversity vary across taxonomic groups and spatial scales. Ecosphere 2020, 11, e02999. [Google Scholar] [CrossRef]
  61. Legay, N.; Grassein, F.; Binet, M.N.; Arnoldi, C.; Personeni, E.; Perigon, S.; Poly, F.; Pommier, T.; Puissant, J.; Clément, J.C.; et al. Plant species identities and fertilization influence on arbuscular mycorrhizal fungal colonisation and soil bacterial activities. Appl. Soil Ecol. 2016, 98, 132–139. [Google Scholar] [CrossRef]
  62. Shaji, H.; Chandran, V.; Mathew, L. Chapter 13—Organic Fertilizers as a Route to Controlled Release of Nutrients. In Controlled Release Fertilizers for Sustainable Agriculture; Lewu, F.B., Volova, T., Thomas, S., Rakhimol, K.R., Eds.; Academic Press: Cambridge, MA, USA, 2021; pp. 231–245. ISBN 9780128195550. [Google Scholar] [CrossRef]
  63. Gryndler, M.; Larsen, J.; Hršelová, H.; Řezáčová, V.; Gryndlerová, H.; Kubát, J. Organic and Mineral Fertilization, Respectively, Increase and Decrease the Development of External Mycelium of Arbuscular Mycorrhizal Fungi in a Long-Term Field Experiment. Mycorrhiza 2006, 16, 159–166. [Google Scholar] [CrossRef]
  64. Joner, E.J. The Effect of Long-Term Fertilization with Organic or Inorganic Fertilizers on Mycorrhiza-Mediated Phosphorus Uptake in Subterranean Clover. Biol. Fertil. Soils 2000, 32, 435–440. [Google Scholar] [CrossRef]
  65. Bücking, H.; Liepold, E.; Ambilwade, P. The Role of the Mycorrhizal Symbiosis in Nutrient Uptake of Plants and the Regulatory Mechanisms Underlying These Transport Processes. In Plant Science; IntechOpen: London, UK, 2012. [Google Scholar] [CrossRef]
  66. Paparokidou, C.; Leake, J.R.; Beerling, D.J.; Rolfe, S.A. Phosphate availability and ectomycorrhizal symbiosis with Pinus sylvestris have independent effects on the Paxillus involutus transcriptome. Mycorrhiza 2021, 31, 69–83. [Google Scholar] [CrossRef] [PubMed]
  67. Williams, A.; Manoharan, L.; Rosenstock, N.P.; Olsson, P.A.; Hedlund, K. Long-term agricultural fertilization alters arbuscular mycorrhizal fungal community composition and barley (Hordeum vulgare) mycorrhizal carbon and phosphorus exchange. New Phytol. 2017, 213, 874–885. [Google Scholar] [CrossRef] [PubMed]
  68. Nielsen, J.D.; Jensen, A. Influence of vesicular-arbuscular mycorrhiza fungi on growth and uptake of various nutrients as well as uptake ratio of fertilizer P for lucerne (Medicago sativa). Plant Soil 1983, 70, 165–172. [Google Scholar] [CrossRef]
  69. Treseder, K.K.; Allen, M.F. Direct nitrogen and phosphorus limitation of arbuscular mycorrhizal fungi: A model and field test. New Phytol. 2002, 155, 507–515. [Google Scholar] [CrossRef] [PubMed]
  70. Gollotte, A.; van Tuinen, D.; Atkinson, D. Diversity of Arbuscular Mycorrhizal Fungi Colonising Roots of the Grass Species Agrostis capillaris and Lolium perenne in a Field Experiment. Mycorrhiza 2004, 14, 111–117. [Google Scholar] [CrossRef]
  71. Olsen, E. Arbuscular mycorrhizal fungal communities and root colonisation differ in relation to plant host and soil nutrients. Fróskaparrit-Faroese Sci. J. 2017, 62, 85–101. [Google Scholar] [CrossRef]
  72. Weigelt, A.; King, R.; Bol, R.; Bardgett, R.D. Inter-specific variability in organic nitrogen uptake of three temperate grassland species. J. Plant Nutr. Soil Sci. 2003, 166, 606–611. [Google Scholar] [CrossRef]
  73. Fitter, A.H.; Graves, J.D.; Watkins, N.K.; Robinson, D.; Scrimgeour, C. Carbon transfer between plants and its control in networks of arbuscular mycorrhizas. Funct. Ecol. 1998, 12, 406–412. [Google Scholar] [CrossRef]
  74. Sheng, M.; Lalande, R.; Hamel, C.; Ziadi, N.; Shi, Y. Growth of Corn Roots and Associated Arbuscular Mycorrhizae Are Affected by Long-Term Tillage and Phosphorus Fertilization. Agron. J. 2012, 104, 1672–1678. [Google Scholar] [CrossRef]
  75. Saeed, M.; Khan, I.; Hameed, A.; Ullah, I.; Chaudhry, S.M.; Naveed-Ul-Haq, A.; Kaleem, S. Arbuscular mycorrhizal fungi (AMF) and soil chemical heterogeneity significantly alter nutritional value of tomato fruit. Pak. J. Bot. 2022, 54, 187–193. [Google Scholar] [CrossRef]
  76. Patreze, C.M.; Cordeiro, L. Nitrogen-Fixing and Vesicular–Arbuscular Mycorrhizal Symbioses in Some Tropical Legume Trees of Tribe Mimoseae. For. Ecol. Manag. 2004, 196, 275–285. [Google Scholar] [CrossRef]
  77. Islam, M.; Al-Hashimi, A.; Ayshasiddeka, M.; Ali, H.; Enshasy, H.A.E.; Dailin, D.J.; Sayyed, R.Z.; Yeasmin, T. Prevalence of Mycorrhizae in Host Plants and Rhizosphere Soil: A Biodiversity Aspect. PLoS ONE 2022, 17, e0266403. [Google Scholar] [CrossRef]
  78. Hartmann, A.; Schmid, M.; van Tuinen, D.; Berg, G. Plant-driven selection of microbes. Plant Soil 2009, 321, 235–257. [Google Scholar] [CrossRef]
  79. Vandenkoornhuyse, P.; Quaiser, A.; Duhamel, M.; Le Van, A.; Dufresne, A. The importance of the microbiome of the plant holobiont. New Phytol. 2015, 206, 1196–1206. [Google Scholar] [CrossRef]
  80. Bardgett, R.D.; Mawdsley, J.L.; Edwards, S.; Hobbs, P.J.; Rodwell, J.S.; Davies, W.J. Plant species and nitrogen effects on soil biological properties of temperate upland grasslands. Funct. Ecol. 1999, 13, 650–660. [Google Scholar] [CrossRef]
  81. Aristizábal, C.; Rivera, E.L.; Janos, D.P. Arbuscular mycorrhizal fungi colonize decomposing leaves of Myrica parvifolia, M. pubescens and Paepalanthus sp. Mycorrhiza 2004, 14, 221–228. [Google Scholar] [CrossRef]
  82. Pietikäinen, A.; Kytöviita, M.M.; Vuoti, U. Mycorrhiza and seedling establishment in a subarctic meadow: Effects of fertilization and defoliation. J. Veg. Sci. 2005, 16, 175–182. [Google Scholar] [CrossRef]
  83. Johnson, N.C. Can fertilization of soil select less mutualistic mycorrhizae? Ecol. Appl. 1993, 3, 749–757. [Google Scholar] [CrossRef]
Figure 1. Interdependence between arbuscules and vesicle abundance in A. capillaris due to applied treatments: (a) V1 (control variant)—untreated; (b) V2—organic (manure) treatment—10 t ha−1 manure; (c) V3—low-mineral organic treatment—10 t ha−1 manure + 50 N 25 P2O5 25 K2O; (d) V4—mineral treatment—100 N 50 P2O5 50 K2O; and (e) V5—high-mineral organic treatment—10 t ha−1 manure + 100 N 50 P2O5 50 K2O.
Agriculture 12 00847 g001
Figure 2. Principal Component Analysis of colonization parameters in A. capillaris due to applied treatments: (a) V1 (control variant)—untreated; (b) V2—organic (manure) treatment—10 t ha−1 manure; (c) V3—low-mineral organic treatment—10 t ha−1 manure + 50 N 25 P2O5 25 K2O; (d) V4—mineral treatment—100 N 50 P2O5 50 K2O; (e) V5—high-mineral organic treatment—10 t ha−1 manure + 100 N 50 P2O5 50 K2O. Legend: Freq—colonization frequency; Int—colonization intensity; Arb—arbuscules abundance; Ves—vesicles abundance; nonM—non-mycorrhizal areas; M.nonM—mycorrhizal/non-mycorrhizal areas report; ColDeg %—colonization degree; Arb/Ves %—arbuscules/vesicles report.
Agriculture 12 00847 g002aAgriculture 12 00847 g002b
Figure 3. Assemblage of multi-point analysis characteristics as a guide to arbuscular mycorrhiza colonization patterns and strategies: (a) the threshold values of mycorrhizal parameters in relevant patterns of colonization strategies; (b) detailed mycorrhizal structure development; (c) establishment of multi-point analysis as a merging guide to mycorrhizal maps. Legend: I%—colonization intensity; NM%—non-mycorrhizal areas; M/NM—mycorrhizal/non-mycorrhizal areas report; A%—arbuscules abundance; V—vesicles abundance; A/V—arbuscules/Vesicles report. Square color in mycorrhizal maps: hyphae—blue; arbuscules—red; vesicles—green; auxiliary cells—yellow; entry points—purple (based on original color code [50]).
Agriculture 12 00847 g003
Figure 4. Variations in colonization strategies orientation due to the application of long-term treatments. Legend: Ps—proliferative strategy; Rs—resistance conditions strategy; Ss—storage strategy; Ts—transfer strategy. V1 (control variant)—untreated; V2—organic (manure) treatment—10 t ha−1 manure; V3—low-mineral organic treatment—10 t ha−1 manure + 50 N 25 P2O5 25 K2O; V4—mineral treatment—100 N 50 P2O5 50 K2O; V5—high-mineral organic treatment—10 t ha−1 manure + 100 N 50 P2O5 50 K2O.
Agriculture 12 00847 g004
Figure 5. Resistance conditions (Rs) colonization strategy. Legend: 1-V1 (control variant)—untreated; 2-V2—organic (manure) treatment—10 t ha−1 manure; 3-V3—low-mineral organic treatment—10 t ha−1 manure + 50 N 25 P2O5 25 K2O; 4-V4—mineral treatment—100 N 50 P2O5 50 K2O; 5-V5—high-mineral organic treatment—10 t ha−1 manure + 100 N 50 P2O5 50 K2O. Color Legend: blue—hyphae; red—arbuscules; green—vesicles. Minus(−) sign—lower model of strategy; Plus(+) sign—upper model of strategy. Square color in mycorrhizal maps: hyphae—blue, vesicles—green (based on original color code [50]).
Agriculture 12 00847 g005
Figure 6. Proliferative (Ps) colonization strategy. Legend: 1-V1 (control variant)—untreated; 2-V2—organic (manure) treatment—10 t ha−1 manure; 3-V3—low-mineral organic treatment—10 t ha−1 manure + 50 N 25 P2O5 25 K2O; 4-V4—mineral treatment—100 N 50 P2O5 50 K2O; 5-V5—high-mineral organic treatment—10 t ha−1 manure + 100 N 50 P2O5 50 K2O. Color Legend: blue—hyphae; red—arbuscules; green—vesicles. Minus(−) sign—lower model of strategy; Plus(+) sign—upper model of strategy. Square color in mycorrhizal maps: hyphae—blue, arbuscules—red, vesicles—green (based on original color code [50]).
Agriculture 12 00847 g006
Figure 7. Transfer (Ts) colonization strategy. Legend: 1-V1 (control variant)—untreated; 2-V2—organic (manure) treatment—10 t ha−1 manure; 3-V3—low-mineral organic treatment—10 t ha−1 manure + 50 N 25 P2O5 25 K2O; 4-V4—mineral treatment—100 N 50 P2O5 50 K2O; 5-V5—high-mineral organic treatment—10 t ha−1 manure + 100 N 50 P2O5 50 K2O. Color Legend: blue—hyphae; red—arbuscules; green—vesicles. Minus (−) sign—lower model of strategy; Plus (+) sign—upper model of strategy. Square color in mycorrhizal maps: hyphae—blue, arbuscules—red, vesicles—green (based on original color code [50]).
Agriculture 12 00847 g007
Figure 8. Storage (Ss) colonization strategy. Legend: 1-V1 (control variant)—untreated; 2-V2—organic (manure) treatment—10 t ha−1 manure; 3-V3—low-mineral organic treatment—10 t ha−1 manure + 50 N 25 P2O5 25 K2O; 4-V4—mineral treatment—100 N 50 P2O5 50 K2O; 5-V5—high-mineral organic treatment—10 t ha−1 manure + 100 N 50 P2O5 50 K2O. Color Legend: blue—hyphae; red—arbuscules; green—vesicles. Minus (−) sign—lower model of strategy; Plus (+) sign—upper model of strategy. Square color in mycorrhizal maps: hyphae—blue, arbuscules—red, vesicles—green (based on original color code [50]).
Agriculture 12 00847 g008
Table 1. Differences induced by treatments in mycorrhizal colonization parameters.
VariantFrequency
(%)
Intensity
(%)
Arbuscules
(%)
Vesicles
(%)
Non-Mycorrhizal Areas
(%)
Colonization Degree
(%)
Mycorrhizal/Non-Mycorrhizal ReportArbuscules/Vesicles Report
V162.65 ± 0.95b32.81 ± 0.59b2.88 ± 0.26a1.53 ± 0.11b67.18 ± 0.59d24.8 ± 0.65b0.64 ± 0.02b0.50 ± 0.10a
V268.27 ± 0.92a38.45 ± 0.67a2.92 ± 0.25a2.32 ± 0.15a61.54 ± 0.67e31.0 ± 0.76a1.11 ± 0.09a0.54 ± 0.07a
V346.74 ± 1.01c22.05 ± 0.53c1.76 ± 0.21b0.58 ± 0.05cd77.94 ± 0.53c14.5 ± 0.51c0.36 ± 0.01c0.25 ± 0.09ab
V436.41 ± 1.12d18.59 ± 0.62d1.44 ± 0.17bc0.84 ± 0.08c81.39 ± 0.62b12.6 ± 0.60c0.34 ± 0.01c0.13 ± 0.04b
V530.25 ± 0.93e14.69 ± 0.45e0.68 ± 0.12c0.25 ± 0.03d85.30 ± 0.45a7.95 ± 0.38d0.21 ± 0.00c0.04 ± 0.02b
F test916.27884.4474.55164.22884.47721.14120.8830.77
p.valp < 0.001p < 0.001p < 0.001p < 0.001p < 0.001p < 0.001p < 0.001p < 0.001
Note: Means ± s.e. followed by different letters present significant differences at p < 0.05 based on LSD test. V1 (control variant)—untreated; V2—organic (manure) treatment—0 t ha−1 manure; V3—low-mineral organic treatment—10 t ha−1 manure + 50 N 25 P2O5 25 K2O; V4—mineral treatment—100 N 50 P2O5 50 K2O; V5—high-mineral organic treatment—10 t ha−1 manure + 100 N 50 P2O5 50 K2O.
Table 2. General Pearson correlation between colonization parameters.
ParameterFrequencyIntensityArbusculesVesiclesNon-Mycorrhizal AreasMycorrhizal/Non-Mycorrhizal ReportColonization DegreeArbuscules/Vesicles Report
Frequency 0.900.230.31−0.900.360.880.12
Intensity 0.220.34−1.000.530.970.11
Arbuscules −0.03−0.220.060.210.42
Vesicles −0.340.230.360.03 *
Non-Mycorrhizal areas −0.53−0.97−0.11
Mycorrhizal/non-mycorrhizal report 0.550.04
Colonization degree 0.12
Note: Marked (*) values present non-significant differences at p < 0.05. V1 (control variant)—untreated; V2—organic (manure) treatment—10 t ha−1 manure; V3—low-mineral organic treatment—10 t ha−1 manure + 50 N 25 P2O5 25 K2O; V4—mineral treatment—100 N 50 P2O5 50 K2O; V5—high-mineral organic treatment-10 t ha−1 manure + 100 N 50 P2O5 50 K2O.
Publisher’s Note: MDPI stays neutral with regard to jurisdictional claims in published maps and institutional affiliations.

