Article

16S Amplicon Sequencing of Nitrifying Bacteria and Archaea Inhabiting Maize Rhizosphere and the Influencing Environmental Factors

by
Oluwatobi Esther Ayiti
,
Ayansina Segun Ayangbenro
and
Olubukola Oluranti Babalola
*
Food Security and Safety Focus Area, Faculty of Natural and Agricultural Sciences, North-West University, Private Mail Bag X2046, Mmabatho 2735, South Africa
*
Author to whom correspondence should be addressed.
Submission received: 6 August 2022 / Revised: 24 August 2022 / Accepted: 25 August 2022 / Published: 28 August 2022
(This article belongs to the Special Issue Advanced Research of Rhizosphere Microbial Activity)

Abstract

:
Nitrifying bacteria and archaea are ubiquitous and can transform ammonia locked up in soil or manure into nitrate, a more soluble form of nitrogen. However, nitrifying bacteria and archaea inhabiting maize rhizosphere have not been fully explored. This study evaluates the diversity and abundance of nitrifying bacteria and archaea across different growth stages of maize using 16S amplicon sequencing. Moreover, the influence of environmental factors (soil physical and chemical properties) on the nitrifying communities was evaluated. Rhizosphere soil DNA was extracted using Nucleospin Soil DNA extraction kit and sequenced on Illumina Miseq platform. MG-RAST was used to analyze the raw sequences. The physical and chemical properties of the soil were measured using standard procedure. The results revealed 9 genera of nitrifying bacteria; Nitrospira, Nitrosospira, Nitrobacter, Nitrosovibrio, Nitrosomonas, Nitrosococcus, Nitrococcus, unclassified (derived from Nitrosomonadales), unclassified (derived from Nitrosomonadaceae) and 1 archaeon Candidatus Nitrososphaera. The Nitrospirae phyla group, which had the most nitrifying bacteria, was more abundant at the tasselling stage (67.94%). Alpha diversity showed no significant difference. However, the Beta diversity showed significant difference (p = 0.01, R = 0.58) across the growth stages. The growth stages had no significant effect on the diversity of nitrifying bacteria and archaea, but the tasselling stage had the most abundant nitrifying bacteria. A correlation was observed between some of the chemical properties and some nitrifying bacteria. The research outcome can be put into consideration while carrying out a biotechnological process that involves nitrifying bacteria and archaea.

1. Introduction

Molecular case finding, characterization, surveillance of microorganisms, and rapid identification of bacteria can be achieved using the 16S rRNA region [1]. Moreover, comparing 16S sequence profiles across samples clarifies how microbial diversity associates with environmental conditions [2]. Nitrifying bacteria and archaea carry out the biochemical reaction of transforming ammonia to nitrate. Their importance cannot be overemphasized because nitrate helps in the regulation of gene expression, mediates hormone signals [3] and is less acidic than ammonia. An acidic environment increases the bioavailability of heavy metals [4] and affects nutrient uptake [5]. The use of synthetic fertilizer [6] has been used to replace the function of these organisms. Unfortunately, this has caused adverse environmental effects, which include increase in nitrous oxide emission and eutrophication [6,7]. A management process that would mimic the natural process would be better to achieve both agricultural intensification and environmental sustainability.
The rhizosphere serves as an interface that supports the exchange of resources between plants and their associated soil environment. Its microbial diversity is influenced by the soil’s physical, biological, and chemical properties, which are usually determined by the host plant. Microbes in the maize rhizosphere can be endophytic, epiphytic, or closely associated [8]. Characterizing the ones associated with enhanced crop yield is an important first step toward understanding the role of the microbiota in soil fertility [9]. The structure and diversity of bacterial community in the rhizosphere vary significantly according to plant species [10]. Substantial variation is being observed in the microbial diversity of maize rhizosphere. Their root exudate enables them to attract a high diversity of microorganisms. It contains sugars, organic acids, aromatics and enzymes, which attract a wide range of microbial diversity [8].
The richness, diversity, and structure of microbial communities can be affected by environmental parameters and edaphic properties, mainly pH and nutrients. Researchers have reported the relationship of pH with other soil parameters [11,12,13]. Organic carbon had a significant correlation with pH (Tu et al., 2018; Xiao et al., 2018). A high level of sulfur in the soil increases its pH (Li et al., 2019). According to Kopáček, et al. [14], nitrogen cycling is intimately linked to sulfur and carbon cycling. Plant yield, quality, and growth are optimized when the ratio of ammonia to nitrate is low. Liu, et al. [15], suggested a ratio of (1:3). The ratio of carbon to nitrogen and soil total nitrogen influence both microbial activity and soil quality [12]. This is pivotal to crop production.
One of the methods of biofertilization is increasing the abundance of microbes in the rhizosphere of plants [16]. Elucidating nitrifying bacteria and archaea associated with specific crop types and growth stages could provide information for their biotechnological application. To date, many of the resident nitrifying bacteria and archaea associated with varying growth stages of maize are unknown. Identifying them and the influence of the rhizosphere physical and chemical properties would enhance a microbiome-based management strategy for nitrogen utilization. We hypothesize that maize rhizosphere inhabits varying composition of nitrifying bacteria and archaea across different growth stages, and they are influenced by environmental factors. This study evaluates the diversity and abundance of nitrifying bacteria and archaea across different growth stages of maize rhizosphere using 16S amplicon sequencing. Moreover, the study evaluates the relationship between the soil physical and chemical properties and their influence on the nitrifying bacteria and archaea.

2. Materials and Method
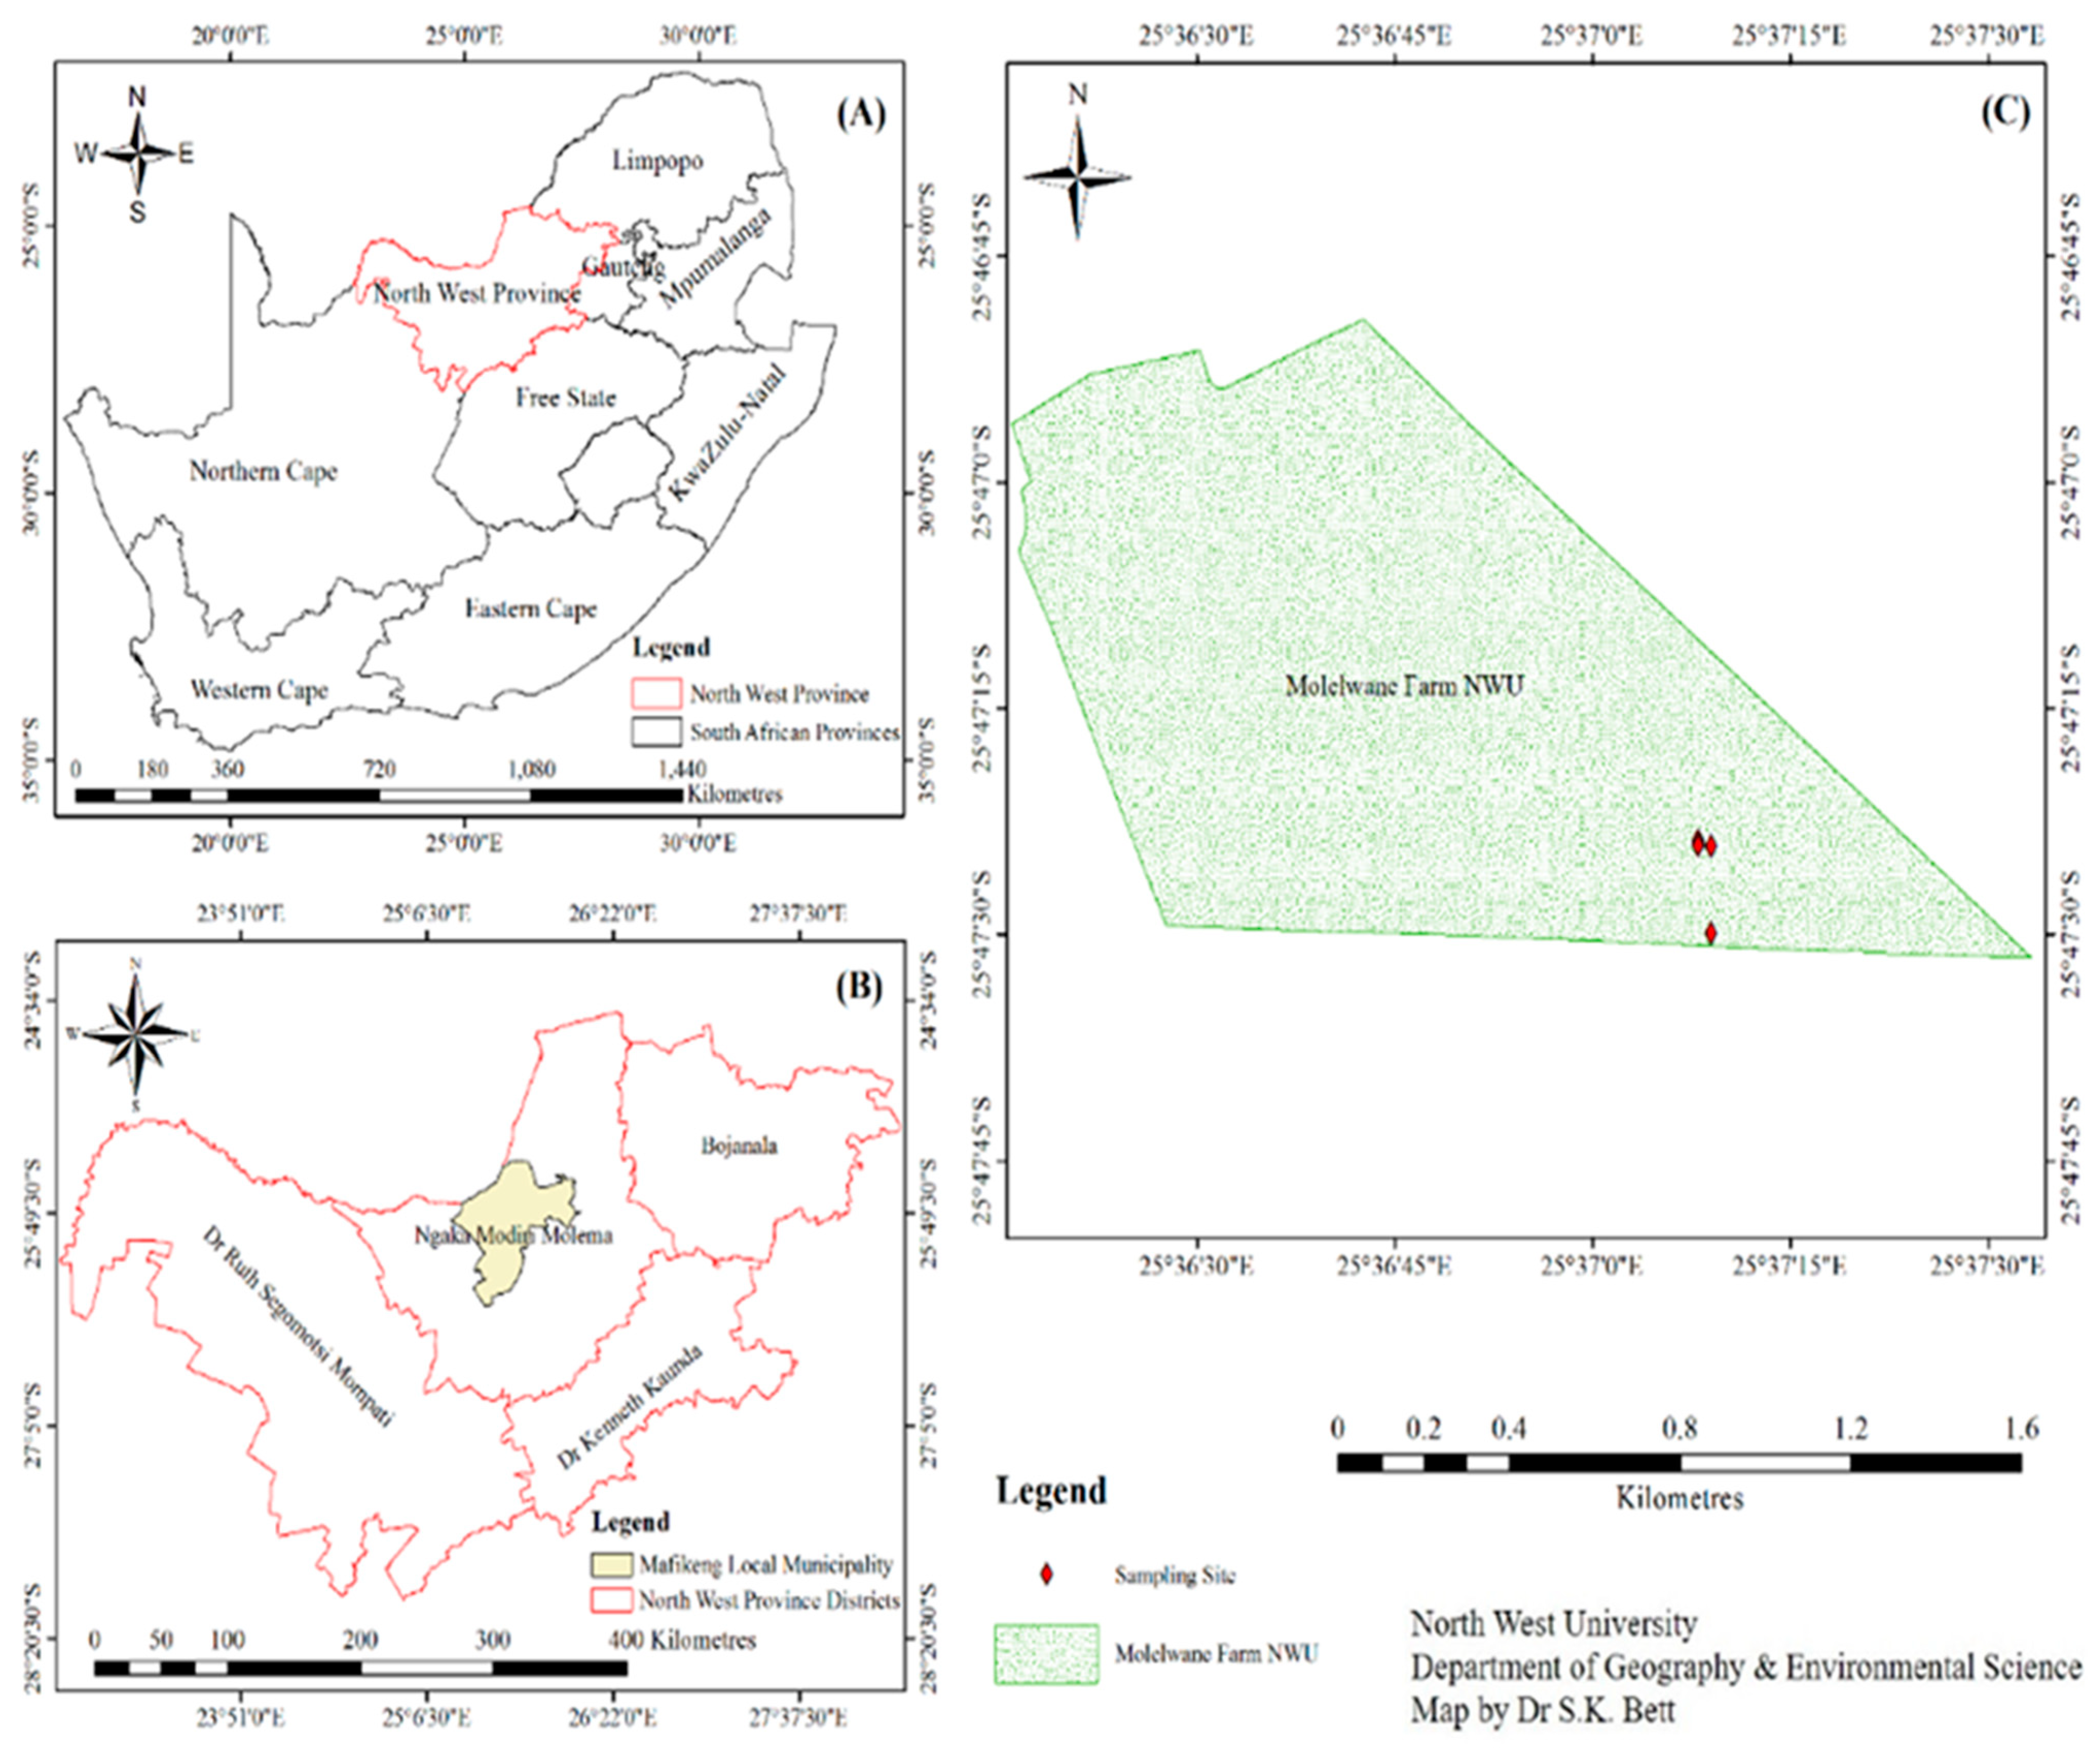
2.1. Sampling

The sampling area and procedure are the same as described in Ayiti, et al. [17]. The samples were collected from the 32-years old maize plantation of the North-West University, Molelwane, Mahikeng, South Africa (25°47′23.9604″ S, 25°37′8.43348″ E; altitude 1012 m Figure 1). The region has an annual temperature ranging from 22 °C–35 °C in summer, 2 °C–20 °C in winter, and an annual rainfall of 450 mm. The farm was irrigated and treated with NPK (20% nitrogen, 7% phosphorus, and 3% potassium) fertilizer before planting. The maize cultivar planted was QN.633. Three different growth stages of maize were identified: pretasseling growth stage (PR), tasselling growth stage (TA), and fruiting growth stage (FR). The rhizosphere soil was collected between 0 and 15 cm depth, and 0–5 cm of each maize root and bulk (BU) soil was also collected. The soil was collected in triplicate for each developmental stage and bulk soil, then transported to the laboratory and stored at −20 °C.

2.2. Physio-Chemical Analysis of the Rhizosphere and Bulk Soil

As reported by Ayiti, Ayangbenro, and Babalola [17], physical and chemical properties of the soils were measured using standard chemical analysis. The particle size (sand, silt, and clay) distribution was evaluated using the method of Kroetsch [18]. Nitrate and ammonium were measured using the KCL extraction method described by Keeny and Nelson [19]. Organic matter was measured using loss of ignition method [20]. Total carbon was analyzed using dry combustion method [21]. Organic carbon was measured using the method described by Walkley and Black [22]. Total nitrogen was analyzed using digestion method [23]. HCl extraction method was used to determine the sulfur content of the rhizosphere as described by Smittenberg [24]. The pH was measured with Jenway 3520 pH meter (Cole–Palmer instruments, Staffordshire, UK) after mixing the soil (2 g) and deionized water (10 mL).

2.3. DNA Extraction and 16S Amplicon Sequencing

The DNA extraction and 16S amplicon sequencing are the same as described by Ayiti, Ayangbenro and Babalola [17]. DNA was extracted using a Nucleospin soil DNA extraction kit (Macherey-Nagel, Duren, Germany) following the manufacturer’s instructions. The V3-V4 hypervariable portions of the 16S rRNA gene were targeted with universal primer pairs 341F (5′-CCT ACG GGN GGC WGC AG-3′) and 785R (5′-GAC TAC HVG GGT ATC TAA TCC-3′) [25]. The amplicons were then gel purified, end-repaired, and Illumina-specific adaptor sequences were ligated to each of them. The samples were individually indexed after quantification, and another purification step was conducted. The amplicons were sequenced using a MiSeq v3 (600 cycles) kit on Illumina’s MiSeq platform. For each experiment, 20 Mb of data (2 × 300 bp long paired-end reads) were generated.

2.4. Metagenome Assembly and Gene Annotation

The MG-RAST server (http://www.mg-rast.org, accessed on 15 April 2021) was used to process and analyze the raw sequences, which were uploaded as a FastQ file [26]. Quality control, which included filtering of ambiguous bases, removal of chimeras, minimum read specification, and length filtering [27] was carried out. Following that, the sequence reads were annotated using the BLAST technique [28] and the M5NR database [29]. The data normalization tool was applied to reduce experimental error. Default parameters were used for the bioinformatics tools [17]. The abundance of bacterial and archaeal communities at different growth stages was evaluated. Reads of eukaryotes and unclassified sequences were removed.

2.5. Data and Statistical Analysis

Microsoft Excel software was used in evaluating the mean of the triplicate samples and the relative abundance of the bacterial and archaea diversity. The richness of the species sequence was evaluated through rarefactions analyses on MG RAST. Heat map of the relative abundance of bacteria and archaea was carried out using online software (www.heatmapper.ca/expression, accessed on 20 April 2021). Alpha and beta diversity analysis was carried out using PAST version 2.17 [30]. The CANOCO 5 was used to carry out principal component analysis and principal coordinate analysis using default settings [31]. XLSTAT was used to determine the relationship between the soil physical and chemical properties and their influence on nitrifying bacteria and archaea.

3. Results

3.1. Rhizosphere Environmental Factors

The statistical analysis of the rhizosphere physical and chemical parameters is summarized in Table 1. The pH, which is the focal point of the physical and chemical parameters, ranges from 5.35 to 6.22 with a mean of 5.93. The soil sample contained a mean of 85% sand, 13% clay, 0.73% organic carbon, 0.73% total carbon, 2.4% organic matter, 0.08% total nitrogen, 336.5 mg/kg sulfur, 4.348 mg/kg ammonium, and 6.123 mg/kg nitrate. The carbon to nitrogen ratio is approximately 9:1. The NH4 to NO3 ratio is approximately 1:1.4.

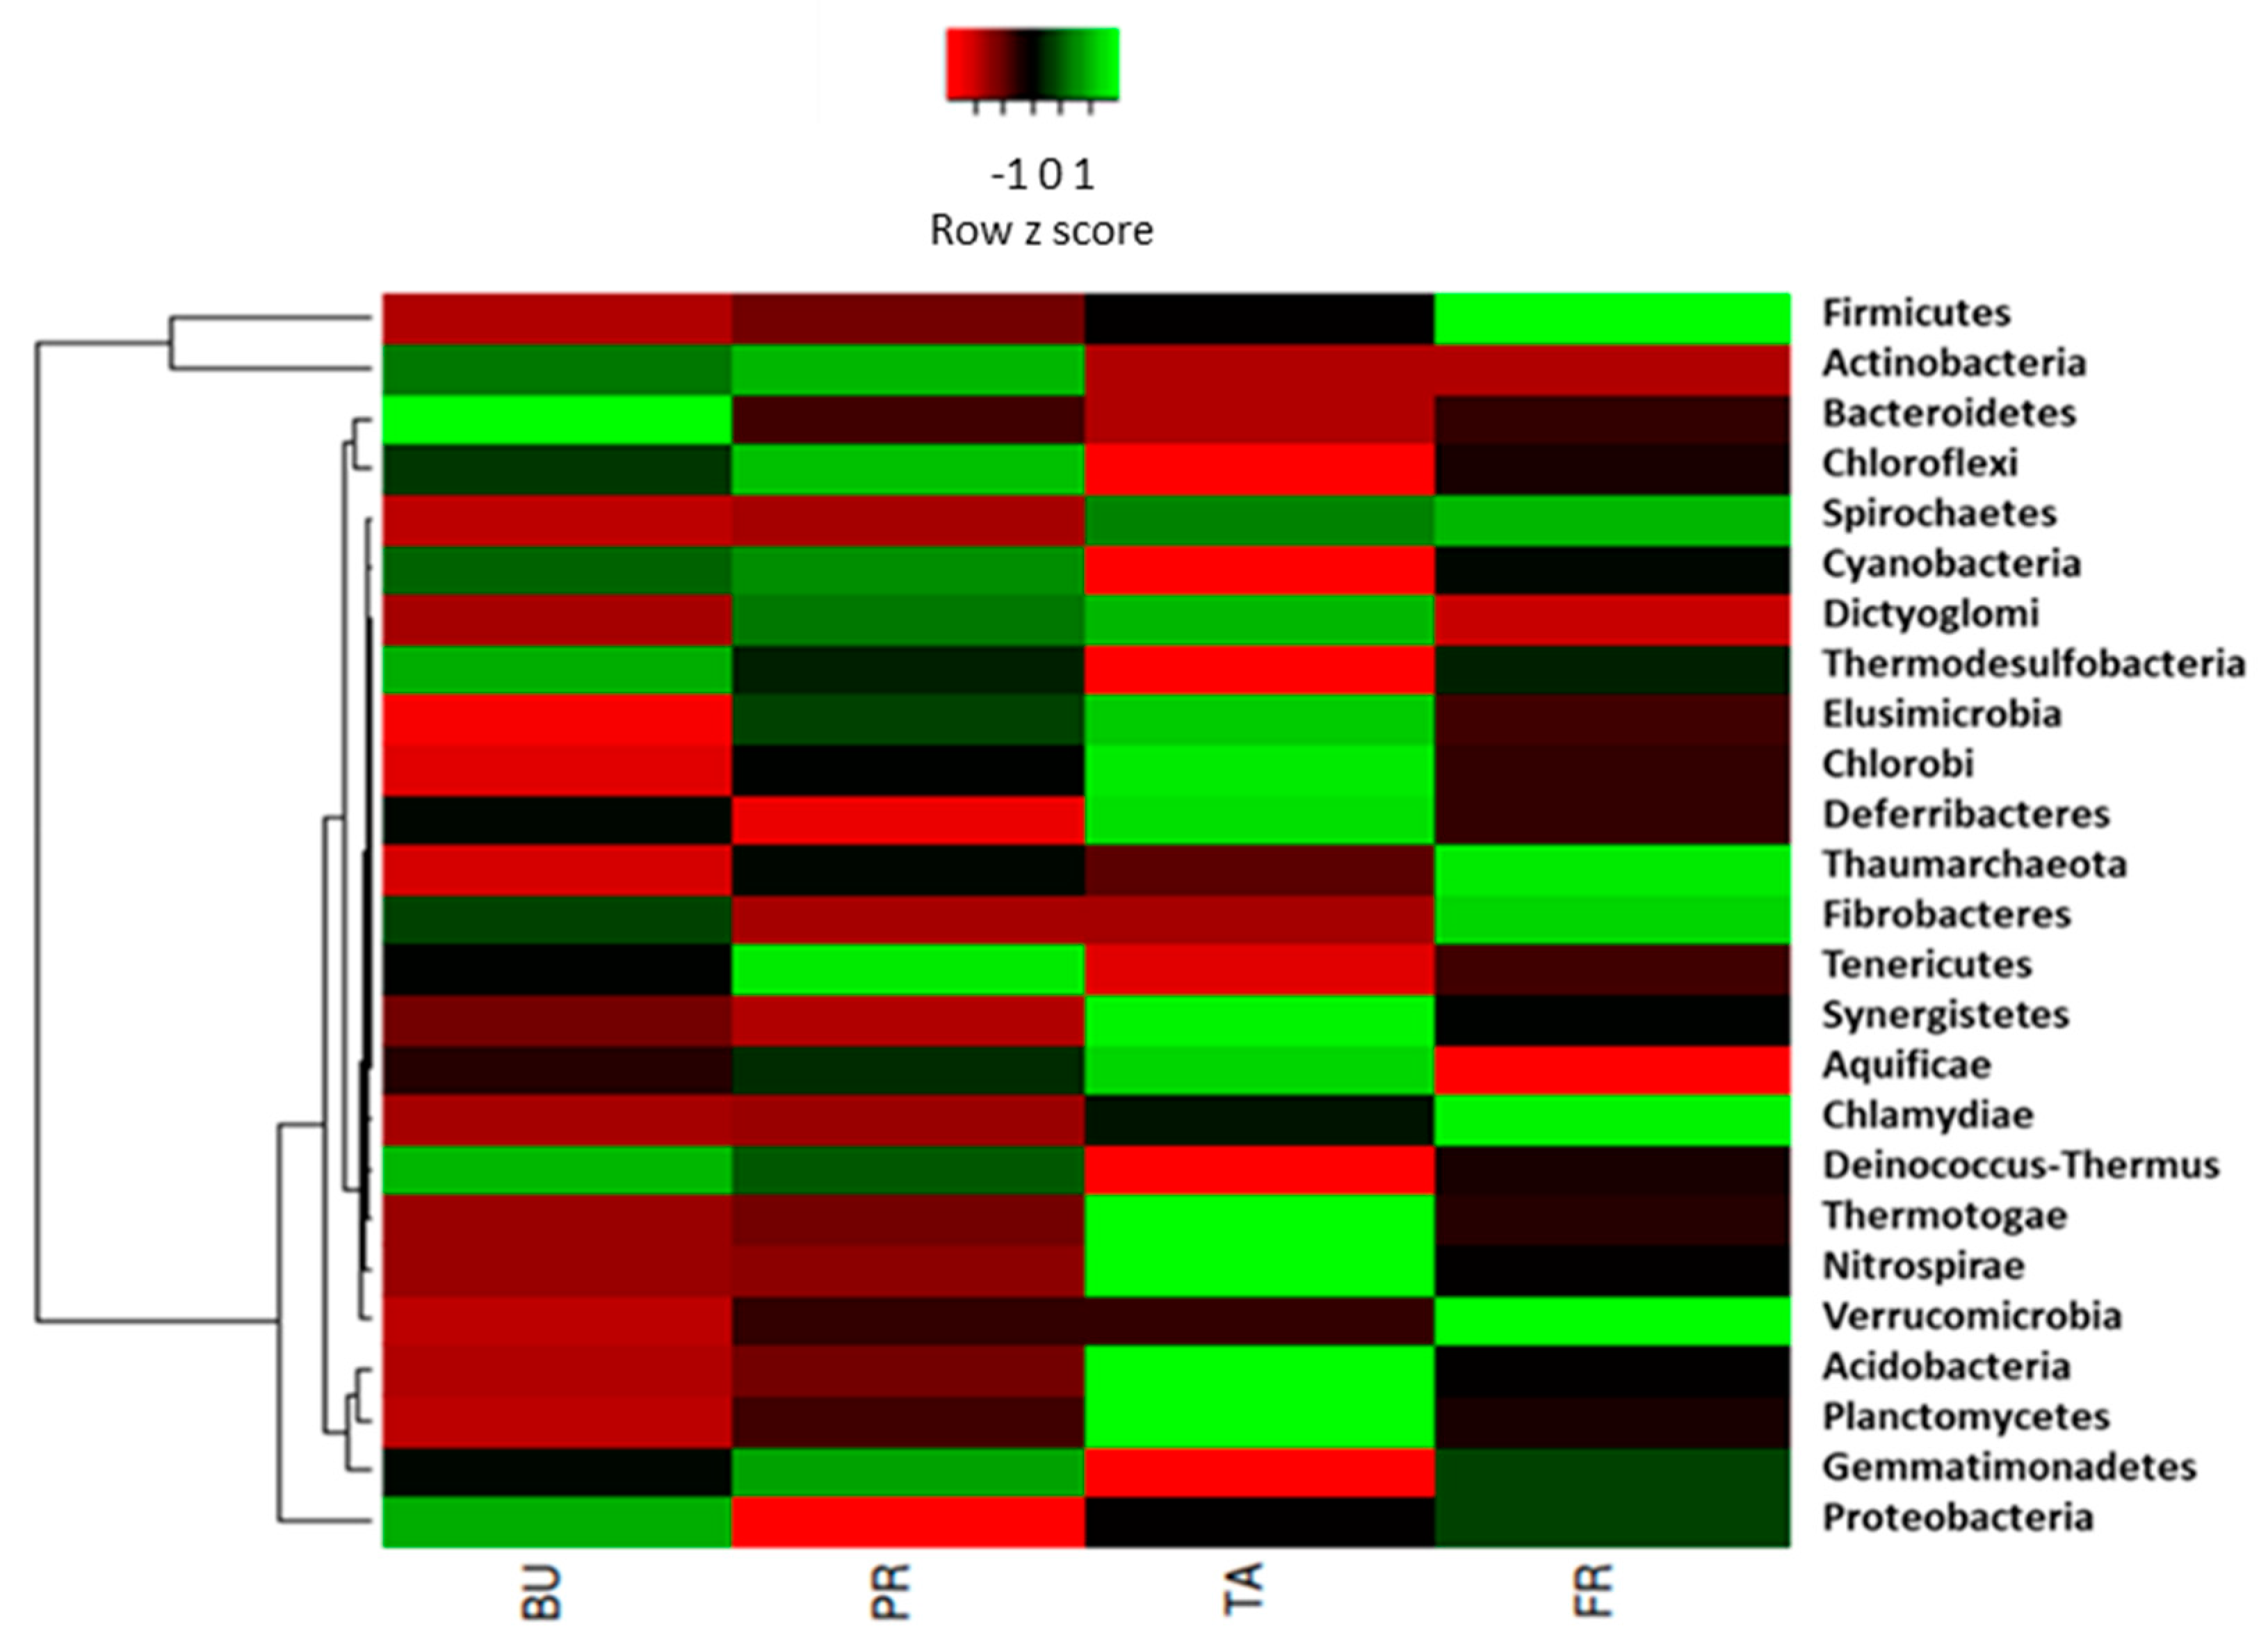
3.2. 16S Amplicon Sequencing of Maize Rhizosphere across Different Growth Stages

The analysis of the sequence reads are listed in Table S1. Rarefaction curve shows the richness of species sequences with the fruiting stage having the highest among the different vegetative growth stages (Figure S1). Figure 2 shows the bacteria and archaea phylum relative abundance represented in all growth stages. Over 99% of the reads were predominantly bacteria, while the archaea were less than 1%. Phylum Actinobacteria was the most dominant in all the growth stages and was highest (47%) at PR. The BU showed the highest percentage of Proteobacteria (10.4%) and Bacteroides (5.2%). Gemmatimonadates (5.6%) and Chloroflexi (2.6%) were highest at PR. At TA, Planctomycete and Acidobacteria were highest at 6.5% and 7.8% respectively. Phylum Firmicutes was highest (27%) at FR. Thaumarchaeota was the only phylum observed in the archaea domain. Although it was less than 1% in all the stages, it was highest at the FR. There was no significant difference (p = 0.99) in the bacteria and archaea phylum groups across the different growth stages (Table 2). At p = 0.01, R = 0.58 the beta diversity showed a significant difference across the growth stages.

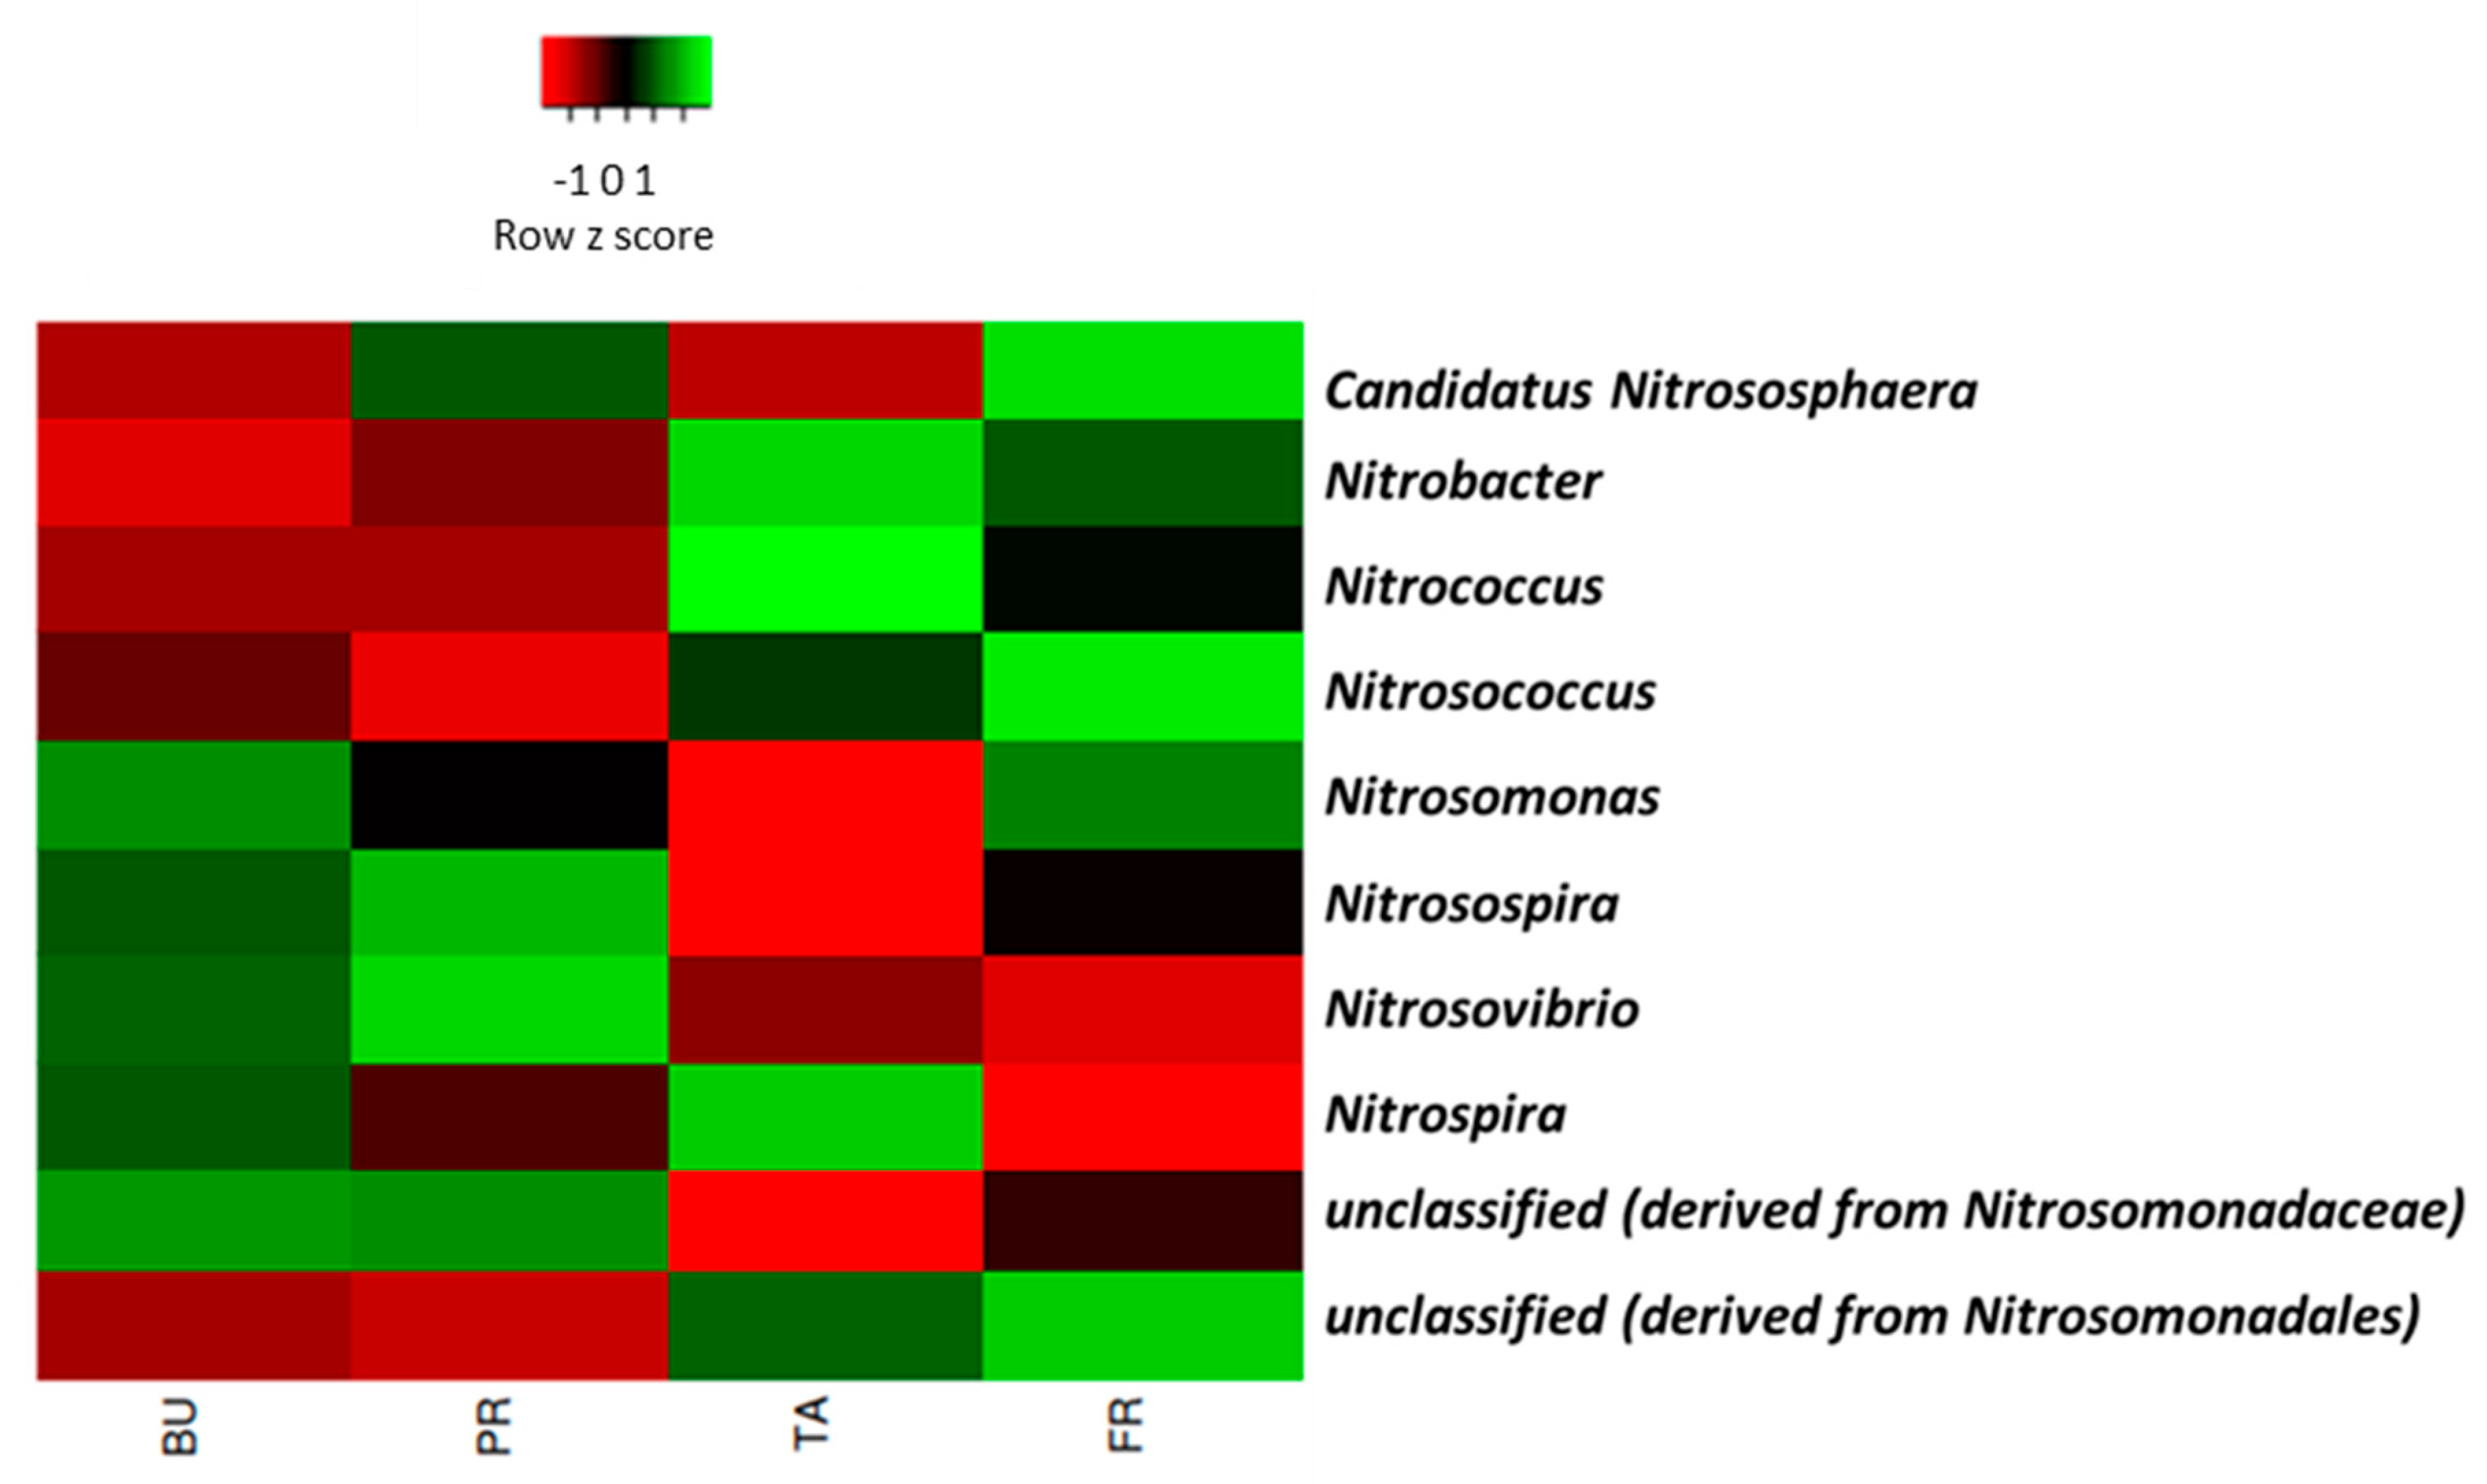
3.3. Taxonomic Profiling of Nitrifying Bacteria and Archaea Inhabiting Maize Rhizosphere across Different Vegetative Growth Stages

At the genus level, 9 groups of nitrifying bacteria and 1 group of archaea were identified (Figure 3). Nitrospira groups are the most abundant with their relative abundance highest at the TA stage 67.94%. Nitrosospira and unclassified (derived from Nitrosomonadales and Nitrosomonadaceae) were also notably abundant. Figure 4. shows the principal component analysis (PCA) conducted to reveal how the nitrifying bacteria and archaea were distributed at the various growth stages. Nitrospirae is in close association with Thermotogae and Synergistetes (Figure 4A). The identified genus was widely distributed and dominated different vegetative growth stages (Figure 4B). The diversity indices, Simpson, Shannon, and Evenness, were used to evaluate alpha diversity of nitrifying bacteria and archaea across different groups. At p = 0.99 the different genera groups showed no significant difference (Table 3). Beta diversity (Table S2) showed a significant difference (p = 0.01; R = 0.58) among the genera across the different growth stages. Principal coordinate analysis (PCoA) showed a distinct diversity exists across the different growth stages (Figure 5).

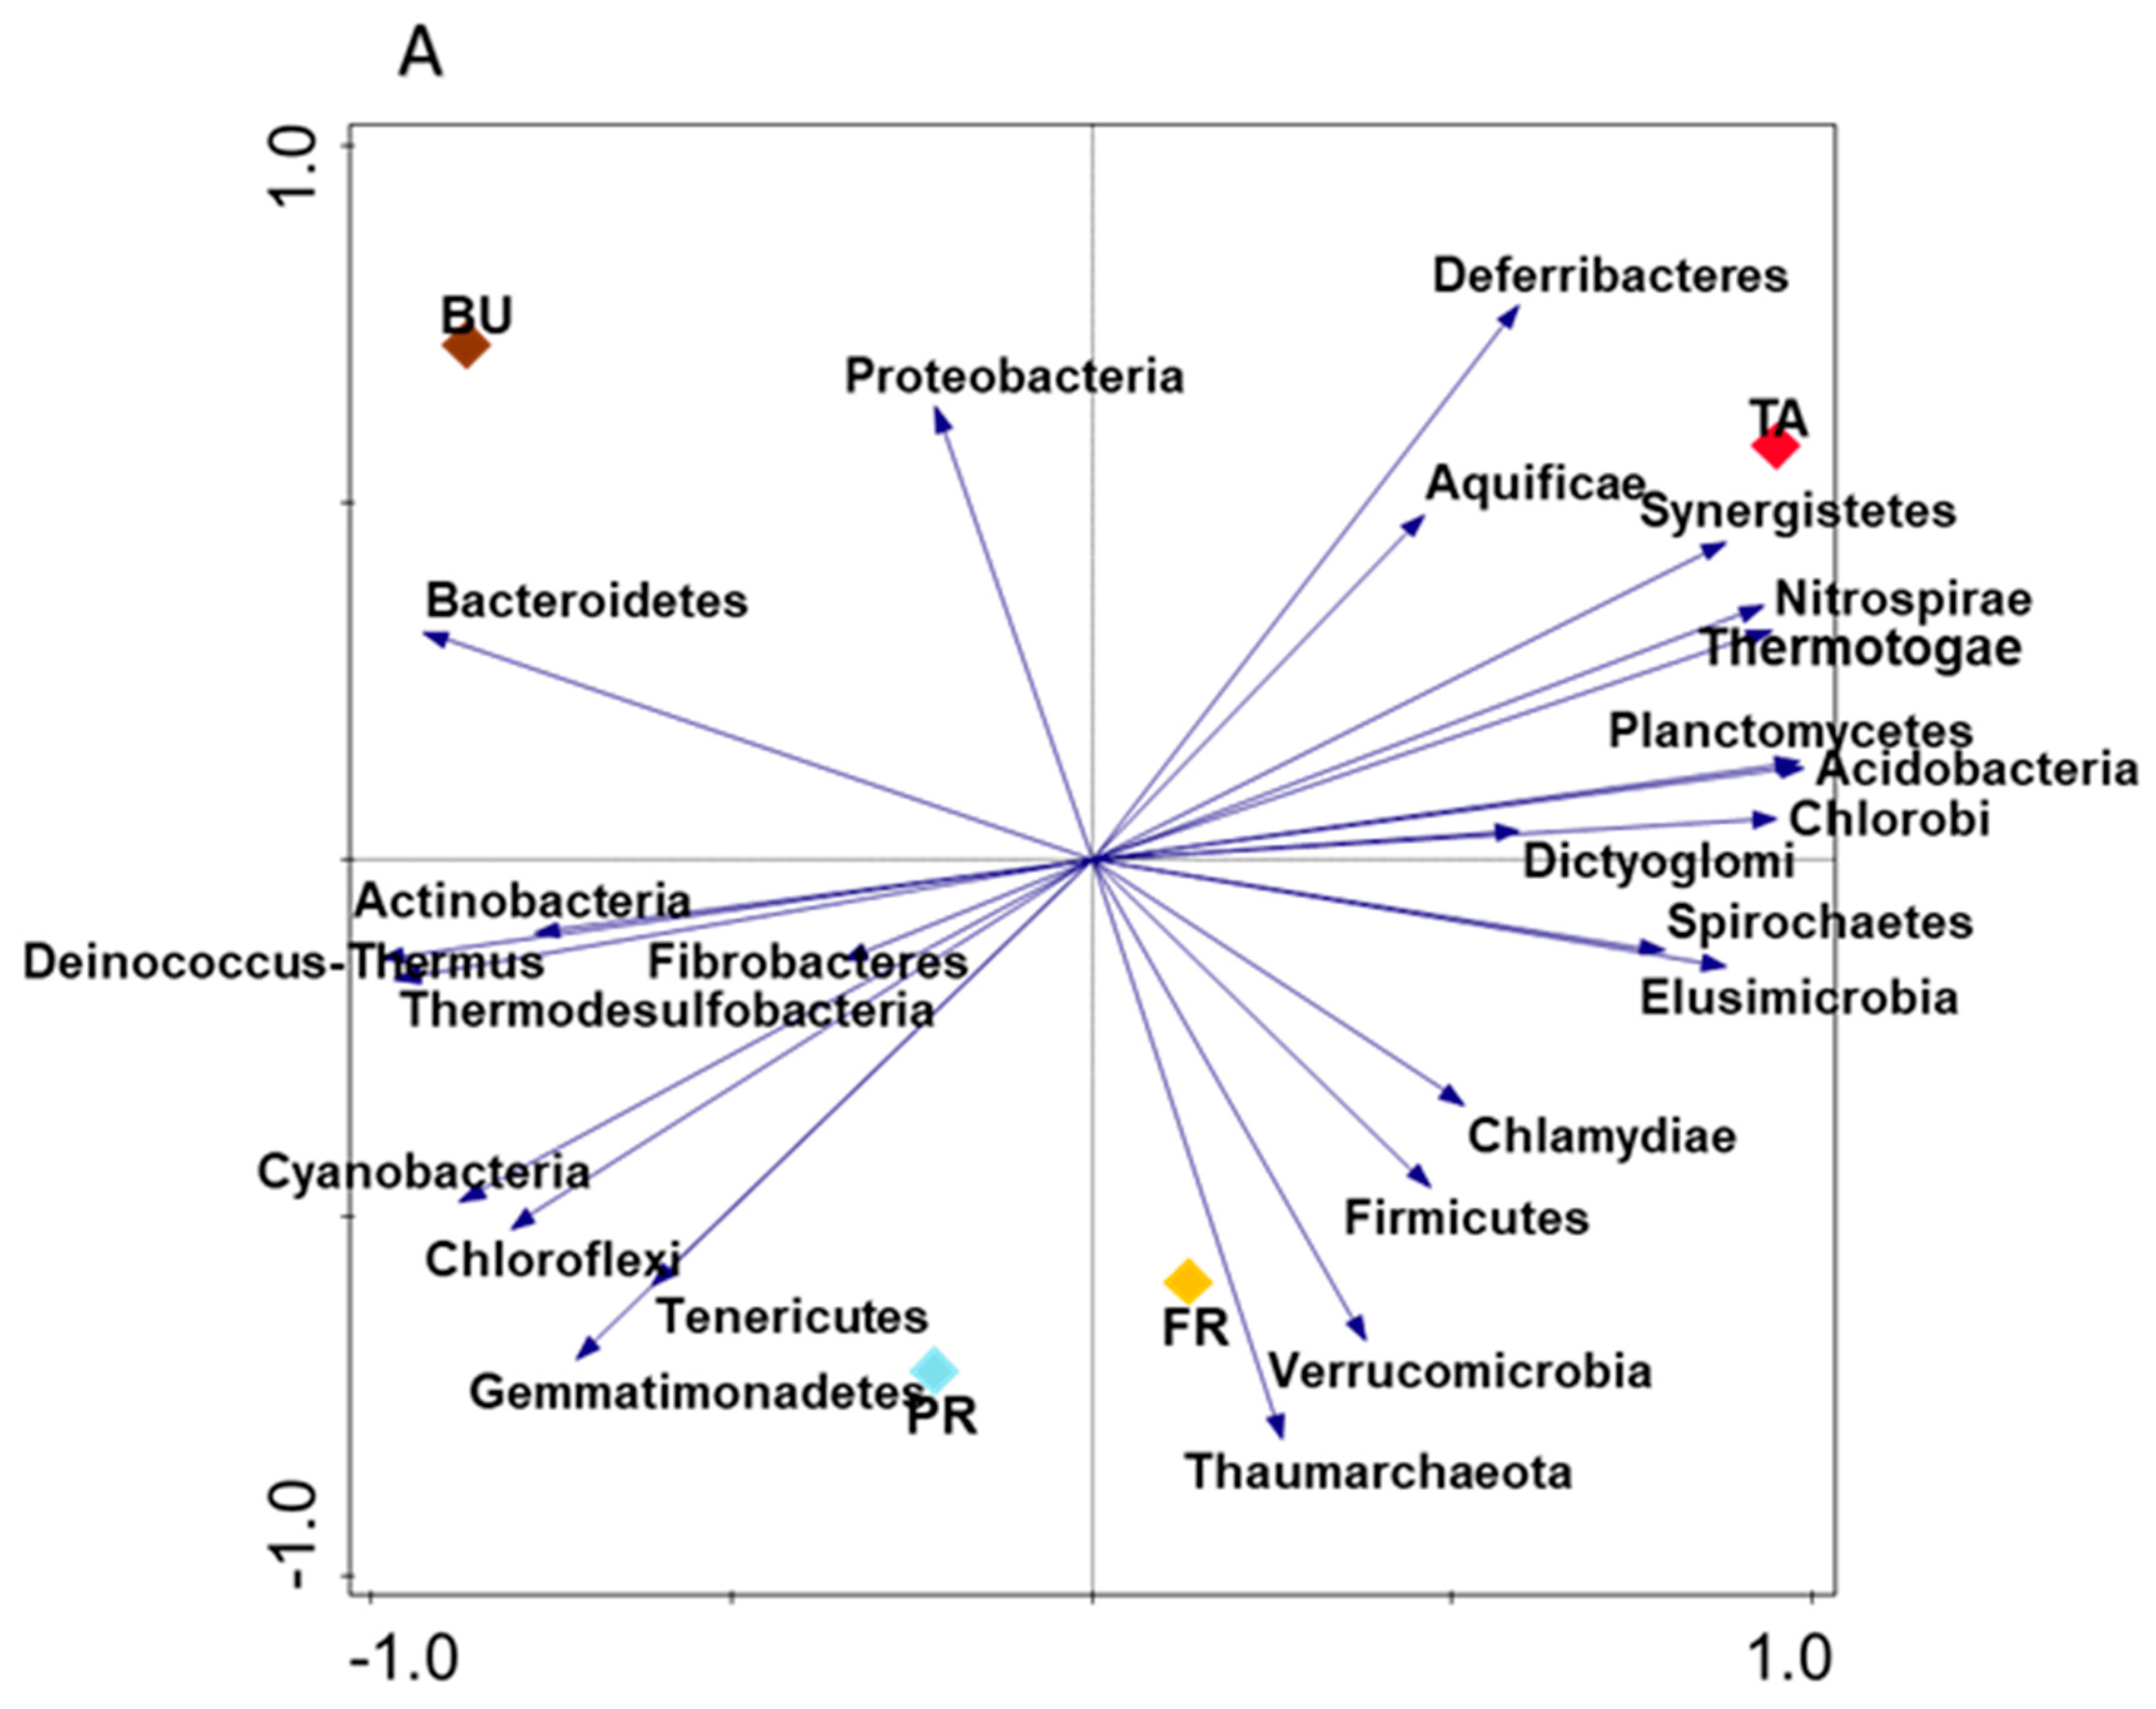
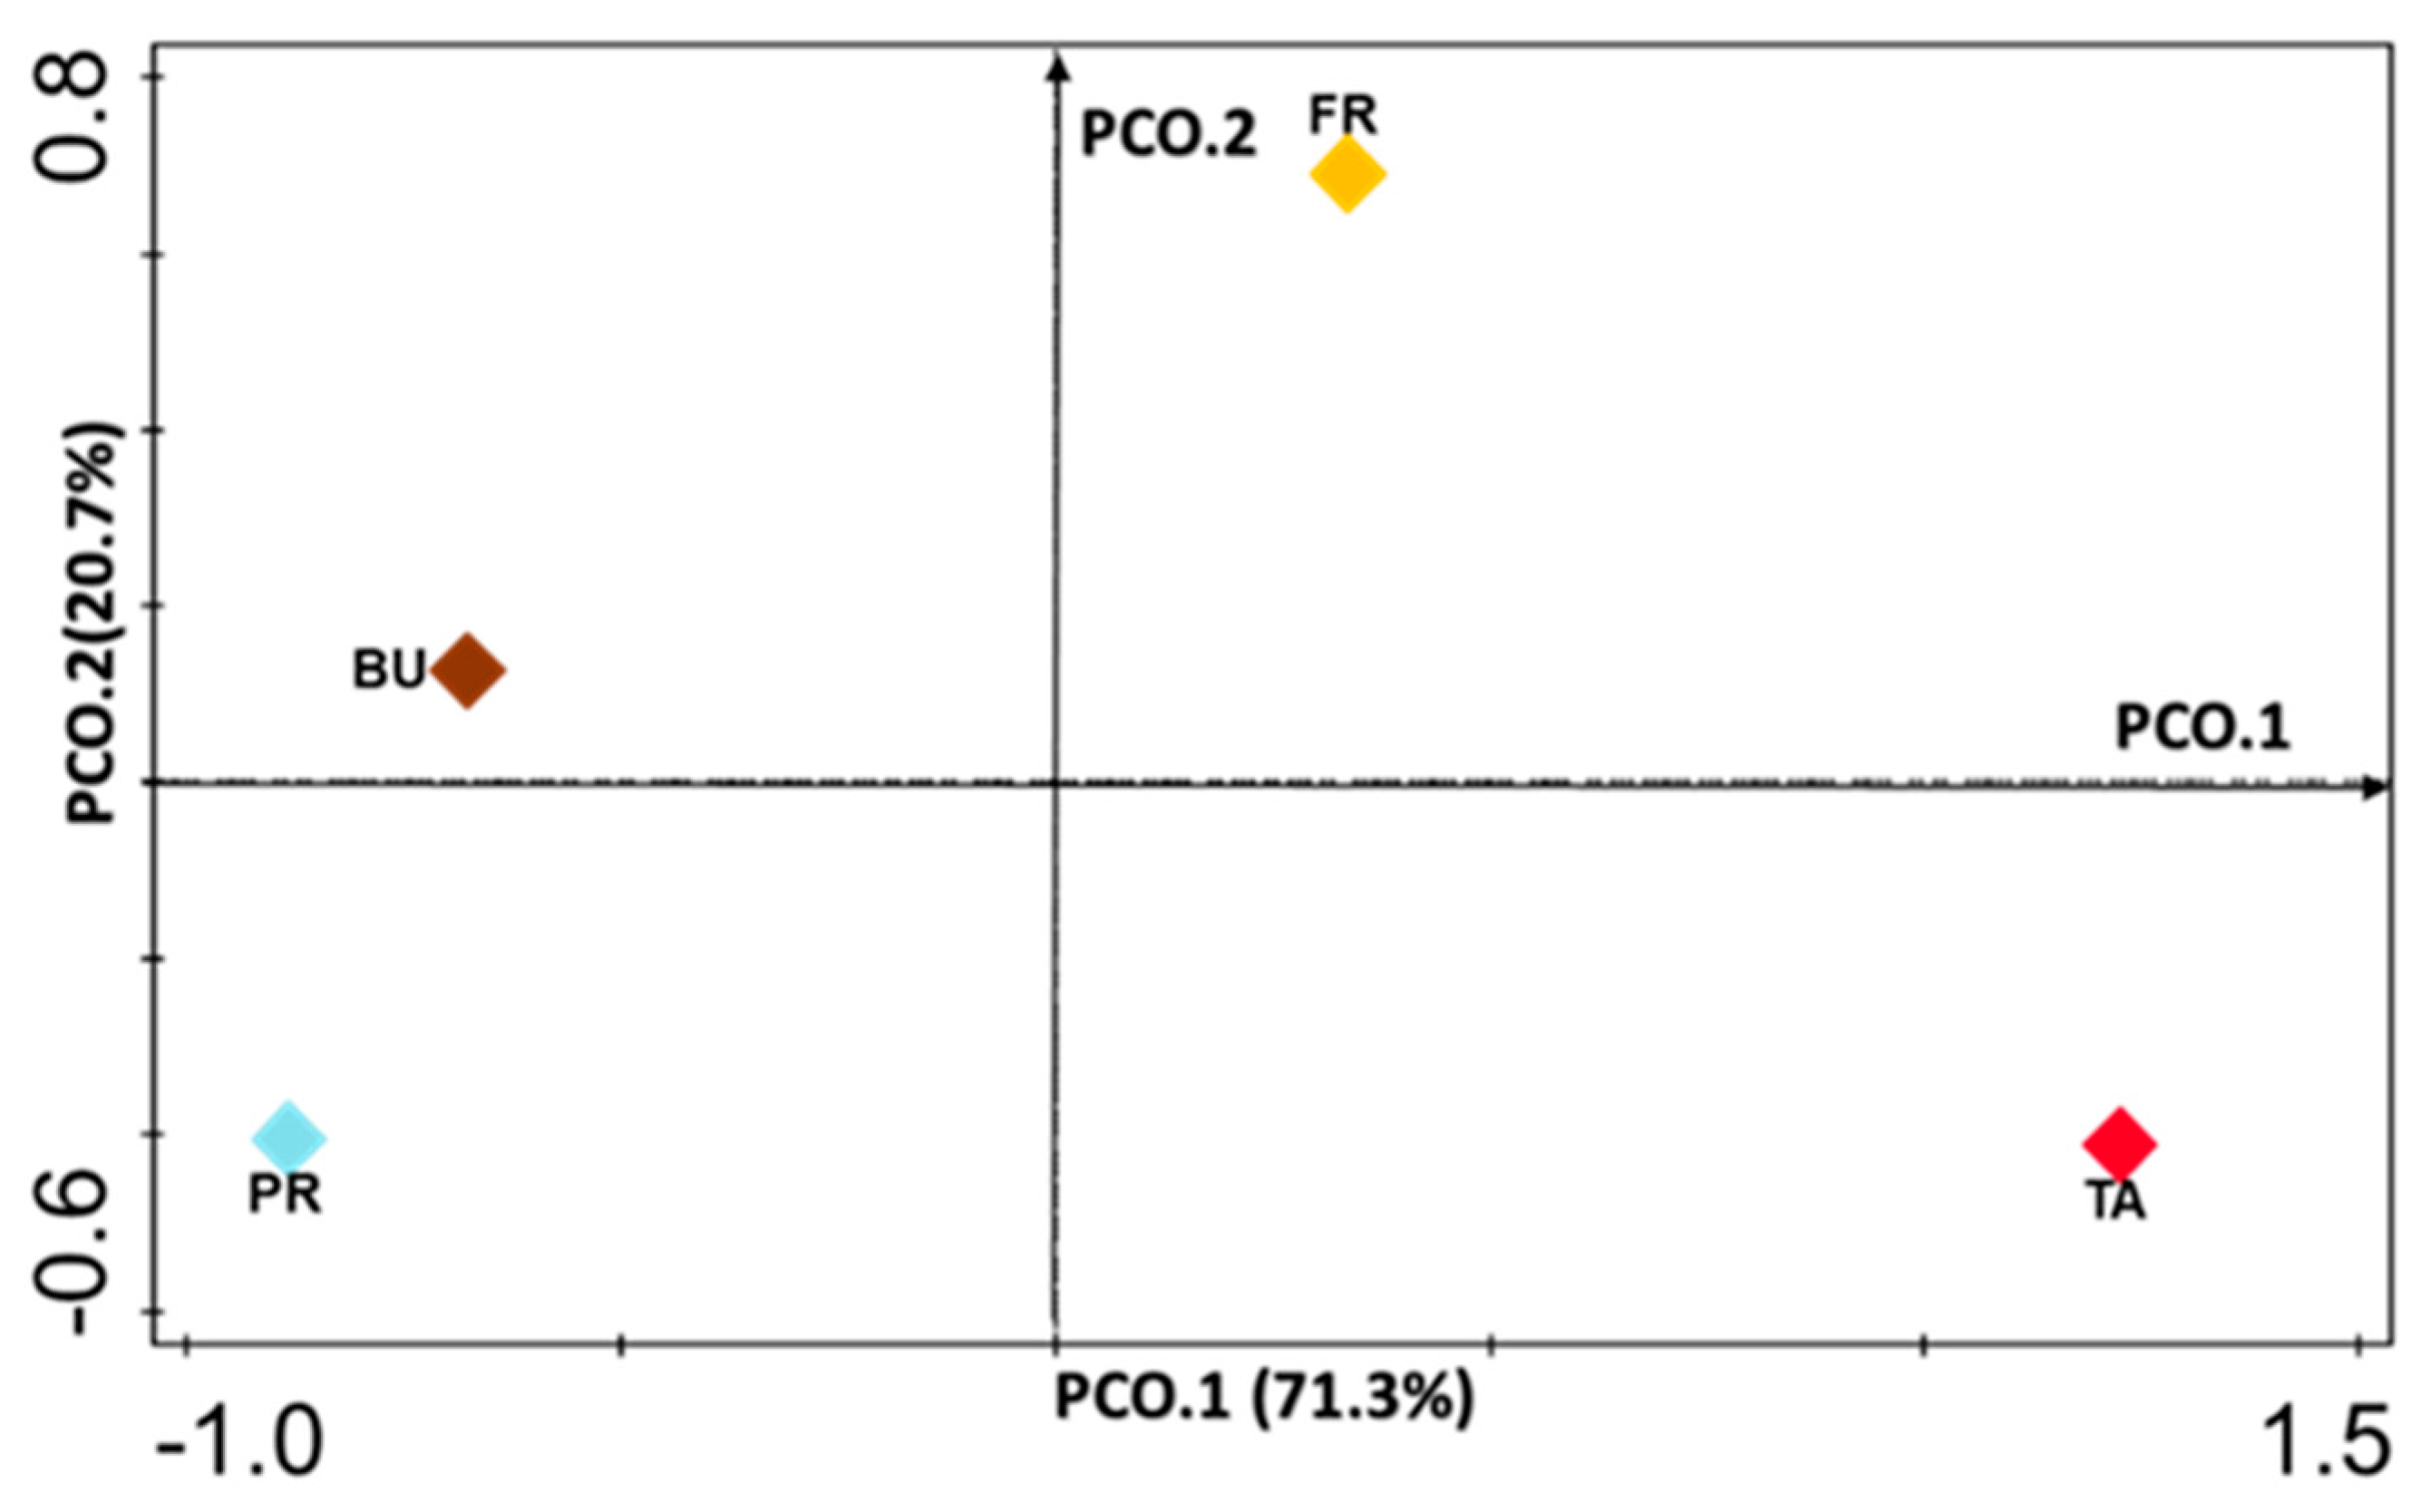
3.4. Relationship among Maize Rhizosphere Environmental Factors and Their Influence on Nitrifying Microorganism

The Pearson’s correlation coefficient showed both positive and negative correlation among the physico-chemical parameters (Table 4). A significant positive and negative relationship was observed among some of the environmental factors. Notable is the relationship between sulfur and pH, organic carbon, and total carbon; moreover, between total carbon and pH, organic carbon, and organic matter. Further, between organic matter and total carbon, total nitrogen, pH, sulfur, organic carbon, total carbon, and organic matter. Ammonium and sulfur, nitrate and pH, sulfur, organic carbon, total carbon, organic matter, and total nitrogen also showed significant positive relationships.

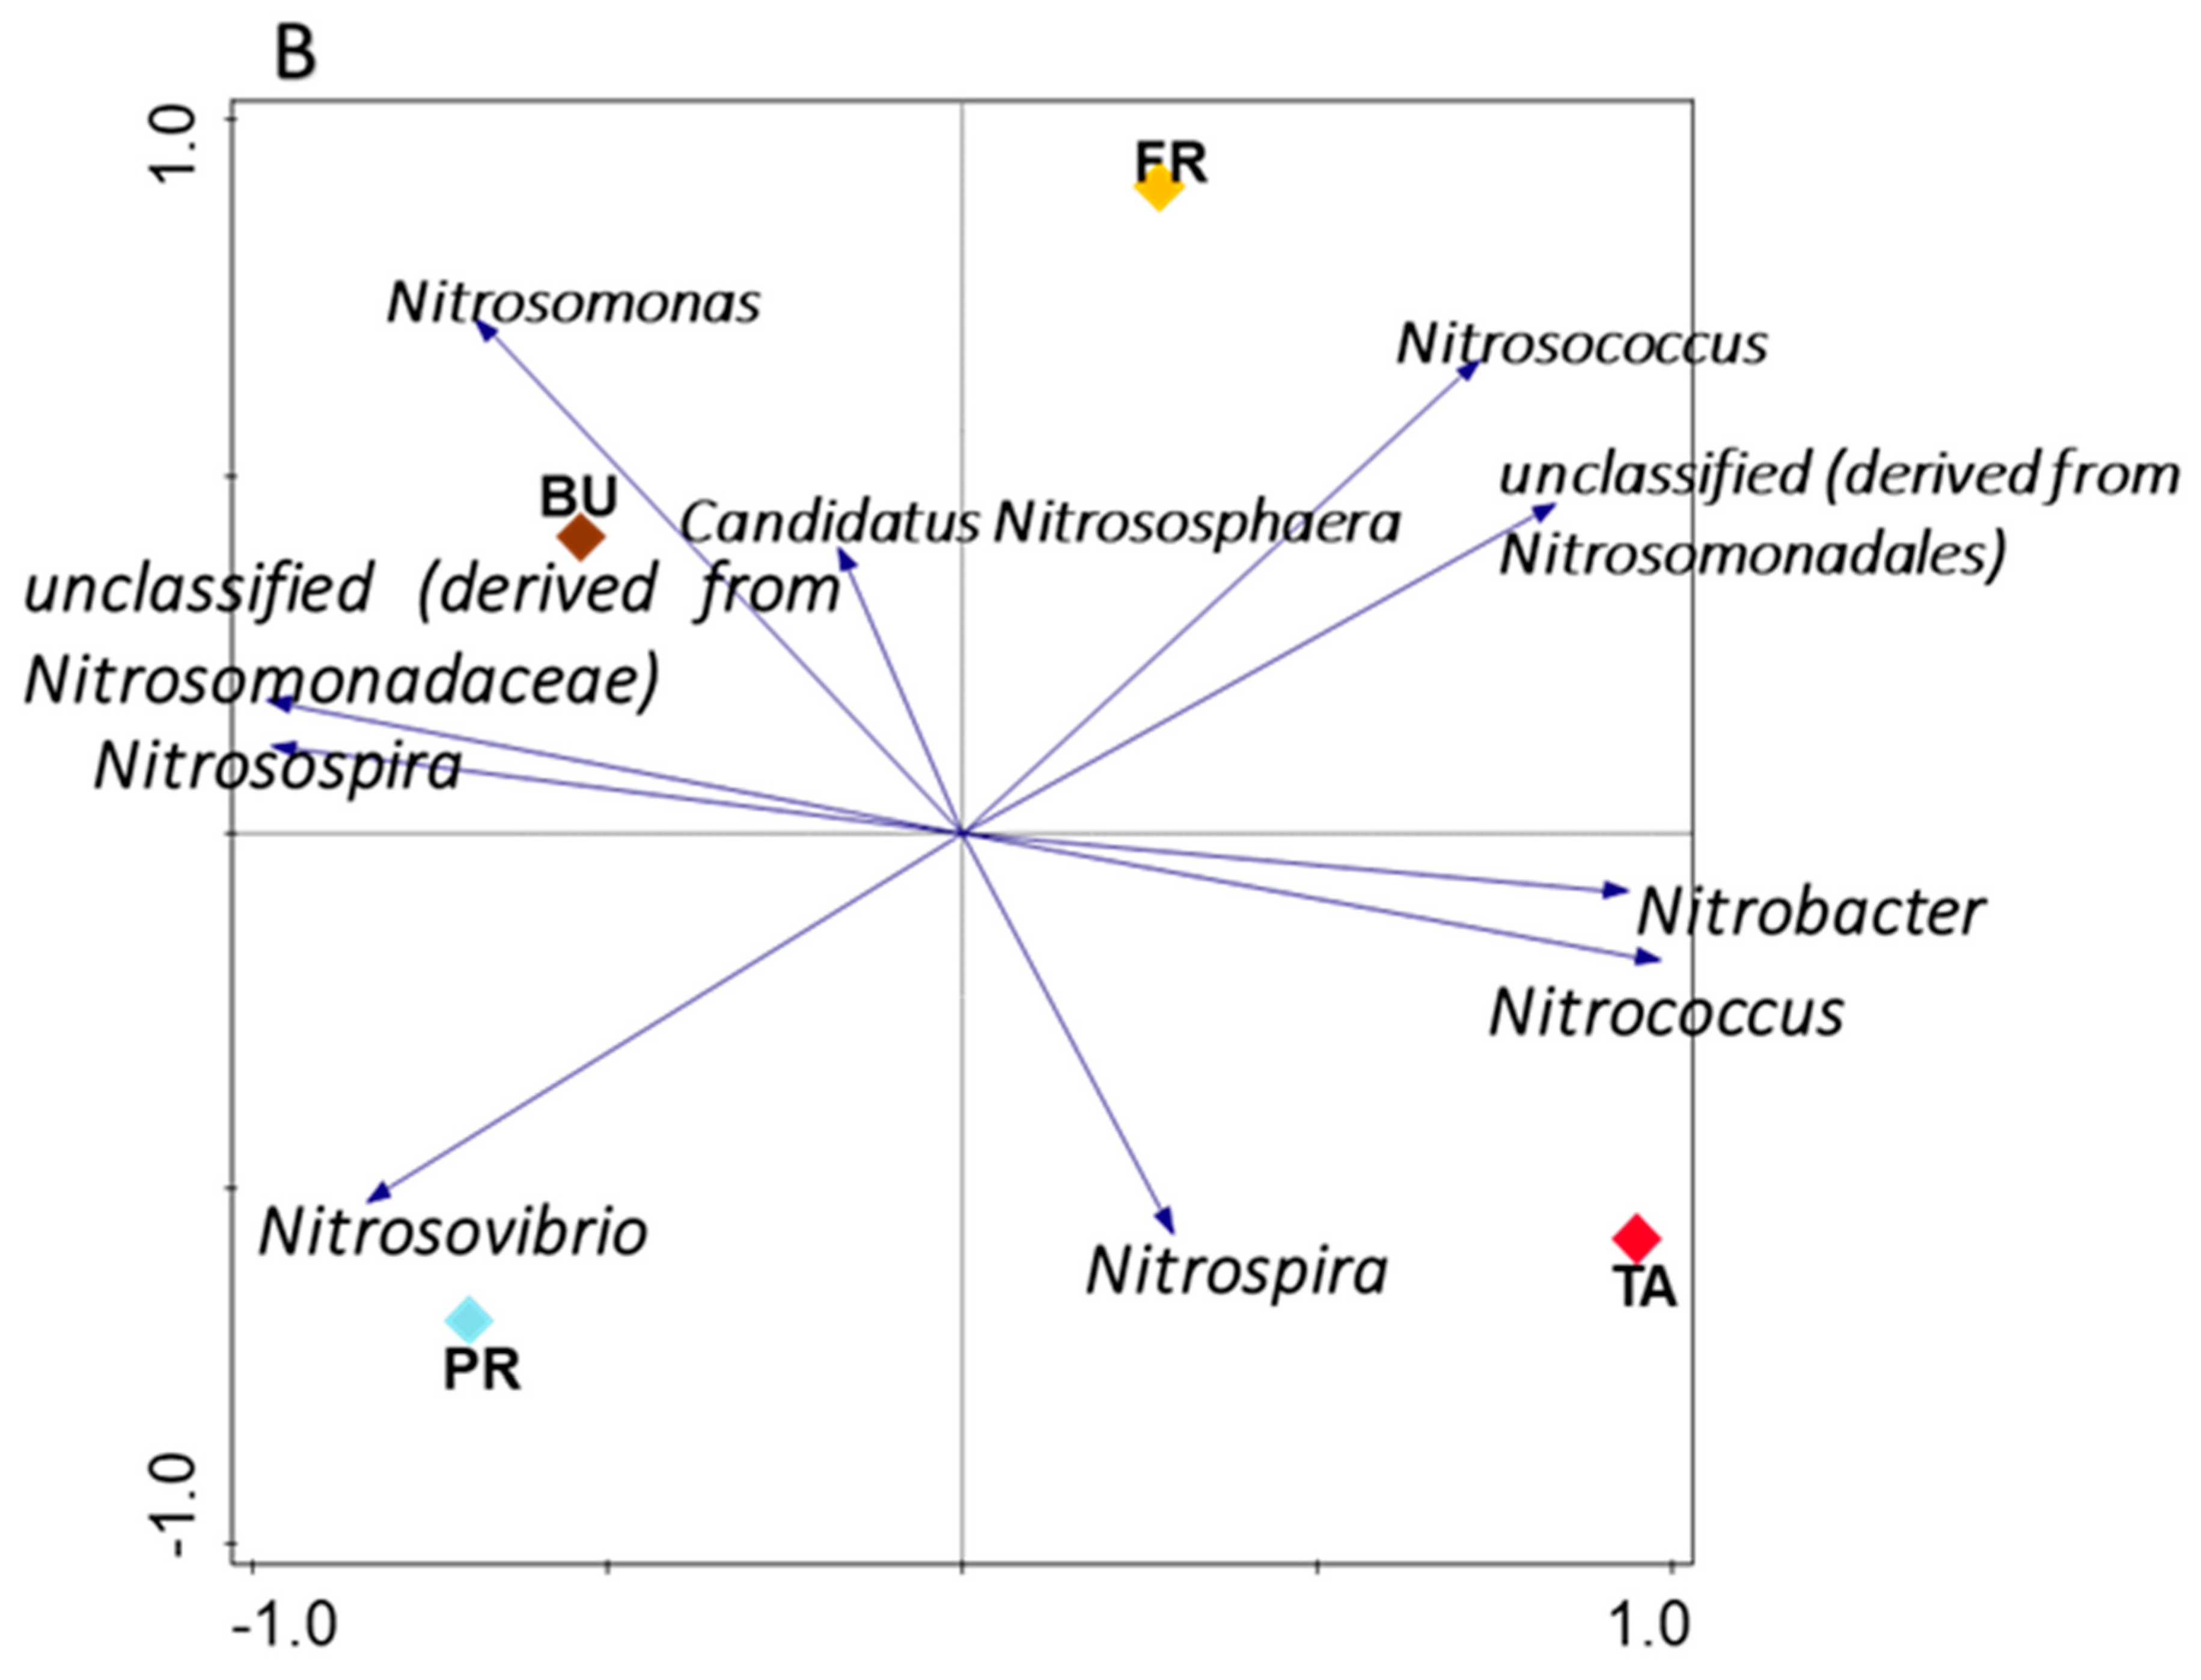
3.5. Influence of Maize Rhizosphere Environmental Factors on Nitrifying Bacteria and Archaea

Table 5 shows that a substantial number of the environmental factors had both positive and negative correlations with the nitrifying community. A significant positive and negative relationship was observed between some of the nitrifying microorganisms and some environmental factors. The relationship varies among the different groups of nitrifiers. pH, organic carbon, total nitrogen, and nitrate were observed to have a close relationship with Nitrosospira, unclassified Nitrosomonadaceae, Nitrosovibrio, and Nitrosomonas. Total carbon showed a close relationship with unclassified Nitrosomonadacea, Nitrosovibrio, and Nitrosomonas. Moreover, organic matter showed a close relationship with Nitrosospira, Nitrosovibrio, and Nitrosomonas. Ammonium showed a close relationship with Nitrosomonas and Nitrosococcus.

4. Discussion

This study profiled the nitrifying bacteria and archaea associated with maize rhizosphere and evaluated their diversity across different growth stages. Moreover, the environmental factors were analyzed and correlated with the nitrifying community. The pH is seen to be moderately acidic (5.93) according to USDA [32] classification. This could be as a result of the high level of sulfur present in the soil samples. Agrochemicals have been implicated in high level of sulfur in farmlands [33], which increases the acidity of soil [34]. The ratio of carbon to nitrogen (9:1) is slightly higher than the recommended ratio of 8:1. Moreover, the NH4 to NO3 ratio (1:1.4) falls short of expectation. Liu, Du, and Li [15] suggested a ratio of 1:3 for the soil microorganism. The holistic physical and chemical parameter sustained the proliferation of nitrifying community with an average of 0.5% relative abundance (Figure 2). Kong, et al. [35] report a favorable pH of 7.0 to 7.5 for nitrifying bacteria. Moreover, as observed by Elrys, et al. [36], nitrification rate is influenced by soil nitrogen and carbon. This would have accounted for the close relationship observed between some nitrifying bacteria and organic carbon, total nitrogen, nitrate, and total carbon.
Nitrifying bacteria and archaea are ubiquitous and are found in varying environmental conditions. Some have been successfully used as biofertilizer singly [37] and in consortium [38]. The nine genera of nitrifying bacteria identified in this study are Nitrospira, Nitrosospira, unclassified (derived from Nitrosomonadales), unclassified (derived from Nitrosomonadaceae), Nitrobacter, Nitrosovibrio, Nitrosomonas, Nitrosococcus, Nitrococcus. The order Nitrosomonadaceae and Nitrosomonadales still have unclassified and yet to be cultured nitrifying bacteria species. The only archaea genus discovered was Candidatus Nitrososphaera, which carry out ammonia oxidation [39], which has been reported by Melnichuk, et al. [40] and Enebe and Babalola [41] to be associated with crop plants including maize. The relative abundance of nitrite oxidizing genera were more than ammonia oxidizing genera (Figure 4). This has previously been observed by Clark, et al. [42], in plots with different management technique. The genera specification and proliferation could have accounted for the high level of nitrite than ammonia (Table 1).
Ammonia oxidizing bacteria noted in this study were Nitrosospira, Nitrosomonas, Nitrosococcus [43], and Nitrosovibrio [44]. Nitrosomonas was recently discovered in maize rhizosphere soil in low abundance by Wang, et al. [45]. The nitrite oxidizing bacteria carrying out the second stage of nitrification were the genus Nitrospira, Nitrobacter, and Nitrococcus [43]. Nitrospira is known to be well distributed globally and was found to be most abundant. It was recently observed by Sun, et al. [46] in a maize rhizosphere. Moreover, Nitrobacter was noted in a maize-soybean rotation system by Meier, et al. [47]. Unclassified nitrifying microorganisms were seen in the order Nitrosomonadaceae and order Nitrosomonadales. This affirms the possible presence of novel nitrifying bacteria in the studied maize rhizosphere. Stein [48] mentioned that there has been an increasing number of novel nitrifying microorganisms discovered lately. This could be as a result of advanced technologies used in sequencing and sampling different soils.
Schlemper, et al. [49] affirm the existence of variation in the bacteria population across different growth stages. The rarefaction curve shows that each of the growth stages had a high and unequal number of species diversity (Figure S1). The PCoA plot showed a distinct diversity and gap across the growth stages (Figure 5). The phylum Nitrospirae, which had the most abundant nitrifying bacteria, showed an increase from the BU to the TA and a decrease at the FR (Figure 2). Moreover, Nitrospira genus was most abundant at the TA stage. This could be because of the increasing demand of nutrients as the plant grows. According to Rocha, et al. [50], the abundance of microorganisms associated with nitrification increases with increasing developmental stages. Furthermore, Lu, et al. [51] explain that the increased and prolonged availability of nitrogen in the rhizosphere by nitrifying microorganisms delays flowering.
The heatmap showed that all the nitrifying bacteria genera were unequally distributed across the different growth stages (Figure 4). Moreover, it was observed in the overall microbial community of a study carried out by Fu, et al. [52] at varying maize growth stages. This would probably be due to the varying composition of nutrients at the different growth stages. Although the alpha diversity showed no significant difference, however, there was a significant difference (p = 0.01) in the beta diversity of the different growth stages. Peiffer, Spor, Koren, Jin, Tringe, Dangl, Buckler, and Ley [8], also reported a significant difference between the beta diversity between maize bulk soil and rhizosphere soil. The result obtained from the correlation affirms there is indeed a direct and indirect interlink between the environmental factors. Furthermore, between them and the nitrifying community, the soil physical and chemical properties showed both positive and negative correlations with a substantial number of the nitrifying community. This was also observed by Fu, et al. [53] between the microbial community and soil nutrients.

5. Conclusions

Profiling and diversity of nitrifying bacteria and archaea of maize rhizosphere across different growth stages were carried out. At the genus level, nine genera of nitrifying bacteria and one archaeon were identified. Two of the nine genera of nitrifying bacteria from the order Nitrosomonadaceae and order Nitrosomonadales are yet to be identified. The tasselling growth stage had the most abundant of the nitrifying bacteria. The correlation within the environmental factors shows the existence of a relationship between some parameters in the rhizosphere and it reveals possible impact or non-impact on nitrifying community. Prominent nitrifying bacteria and archaea associated with maize rhizosphere identified in this study and the understanding of the impact of soil physical and chemical properties on them can be used as a microbiome-based strategy to improve the productivity and yield of maize plants. More so, growth stages of maize should be considered in its management.

Supplementary Materials

The following supporting information can be downloaded at: https://0-www-mdpi-com.brum.beds.ac.uk/article/10.3390/agriculture12091328/s1, Table S1: 16S amplicon sequence information for maize rhizosphere across different growth stages; Table S2: Beta diversity evaluation of nitrifying bacteria and archaea; Figure S1: Rarefraction curve showing the richness of species sequences across the different vegetative growth. BU = samples from bulk soil, PR = samples from pretasseling growth stage, TA = samples from tassel growth stage, FR = samples from fruiting growth stage.

Author Contributions

O.E.A. experimented and wrote the first draft of the paper, A.S.A. critiqued and reviewed the manuscript, while O.O.B. conceptualized the work, secured funding, led the sample collection, provided academic input and expertise to co-authors, commented on the manuscript at all stages and thoroughly critiqued the article. All authors have read and agreed to the published version of the manuscript.

Funding

The study was funded by the National Research Foundation of South Africa through O.O.B. from the grant (UID123634, UID132595).

Institutional Review Board Statement

Not applicable.

Informed Consent Statement

Not applicable.

Data Availability Statement

The data presented in this study are openly available in NCBI sequence read archive (SRA) with accession numbers; SRR14978863 (1st replication of bulk rhizosphere), SRR14978852 (2nd replication of bulk rhizosphere), SRR14978855 (3rd replication of bulk rhizosphere), SRR14978856 (1st replication of pretasseling rhizosphere), SRR14978857 (2nd replication of pretasseling rhizosphere), SRR14978858 (3rd replication of pretasseling rhizosphere), SRR14978859 (1st replication of tasseling rhizosphere), SRR14978860. (2nd replication of tasseling rhizosphere), SRR14978861 (3rd replication of tasseling rhizosphere), SRR14978862 (1st replication of fruiting rhizosphere), SRR14978853. (2nd replication of fruiting rhizosphere), SRR14978854 (3rd replication of fruiting rhizosphere). The BioProject number is PRJNA742235.

Acknowledgments

We are grateful to the National Research Foundation of South Africa for funding research in Babalola’s lab (UID123634, UID132595). The North-West University has provided O.E.A. with a bursary.

Conflicts of Interest

The authors declare no conflict of interest.

References

  1. Deurenberg, R.H.; Bathoorn, E.; Chlebowicz, M.A.; Couto, N.; Ferdous, M.; García-Cobos, S.; Kooistra-Smid, A.M.; Raangs, E.C.; Rosema, S.; Veloo, A.C.; et al. Application of next generation sequencing in clinical microbiology and infection prevention. J. Biotechnol. 2017, 243, 16–24. [Google Scholar] [CrossRef]
  2. Sharpton, T.J. An introduction to the analysis of shotgun metagenomic data. Front. Plant Sci. 2014, 5, 209. [Google Scholar] [CrossRef]
  3. Hachiya, T.; Sakakibara, H. Interactions between nitrate and ammonium in their uptake, allocation, assimilation, and signaling in plants. J. Exp. Bot. 2016, 68, 2501–2512. [Google Scholar] [CrossRef] [PubMed]
  4. Ayangbenro, A.S.; Olanrewaju, O.; Babalola, O.O.; Ayangbenro, A. Sulfate-Reducing Bacteria as an Effective Tool for Sustainable Acid Mine Bioremediation. Front. Microbiol. 2018, 9, 1986. [Google Scholar] [CrossRef] [PubMed]
  5. Shi, R.-Y.; Ni, N.; Nkoh, J.N.; Li, J.-Y.; Xu, R.-K.; Qian, W. Beneficial dual role of biochars in inhibiting soil acidification resulting from nitrification. Chemosphere 2019, 234, 43–51. [Google Scholar] [CrossRef]
  6. Verma, N.; Chaudhary, S.; Goyal, S. Long Term Effects of Inorganic Fertilizers and Organic Amendments on Ammonification and Nitrification Activity of Soils under Cotton-Wheat Cropping System. Int. J. Curr. Microbiol. Appl. Sci. 2018, 7, 718–724. [Google Scholar] [CrossRef]
  7. ZZhai, Y.; Zhao, X.; Teng, Y.; Li, X.; Zhang, J.; Wu, J.; Zuo, R. Groundwater nitrate pollution and human health risk assessment by using HHRA model in an agricultural area, NE China. Ecotoxicol. Environ. Saf. 2017, 137, 130–142. [Google Scholar] [CrossRef]
  8. Peiffer, J.A.; Spor, A.; Koren, O.; Jin, Z.; Tringe, S.G.; Dangl, J.L.; Buckler, E.S.; Ley, R.E. Diversity and heritability of the maize rhizosphere microbiome under field conditions. Proc. Natl. Acad. Sci. USA 2013, 110, 6548–6553. [Google Scholar] [CrossRef]
  9. Qiao, C.; Penton, C.R.; Xiong, W.; Liu, C.; Wang, R.; Liu, Z.; Xu, X.; Li, R.; Shen, Q. Reshaping the rhizosphere microbiome by bio-organic amendment to enhance crop yield in a maize-cabbage rotation system. Appl. Soil Ecol. 2019, 142, 136–146. [Google Scholar] [CrossRef]
  10. López-Carmona, D.A.; Alarcón, A.; Martinez-Romero, E.; Peña-Cabriales, J.J.; Larsen, J. Maize plant growth response to whole rhizosphere microbial communities in different mineral N and P fertilization scenarios. Rhizosphere 2019, 9, 38–46. [Google Scholar] [CrossRef]
  11. Tu, C.; He, T.; Lu, X.; Luo, Y.; Smith, P. Extent to which pH and topographic factors control soil organic carbon level in dry farming cropland soils of the mountainous region of Southwest China. Catena 2018, 163, 204–209. [Google Scholar] [CrossRef]
  12. Xiao, D.; Huang, Y.; Feng, S.; Ge, Y.; Zhang, W.; He, X.; Wang, K. Soil organic carbon mineralization with fresh organic substrate and inorganic carbon additions in a red soil is controlled by fungal diversity along a pH gradient. Geoderma 2018, 321, 79–89. [Google Scholar] [CrossRef]
  13. Li, X.; Cai, Y.; Liu, D.; Ai, Y.; Zhang, M.; Gao, Y.; Zhang, Y.; Zhang, X.; Yan, X.; Liu, B.; et al. Occurrence, fate, and transport of potentially toxic metals (PTMs) in an alkaline rhizosphere soil-plant (Maize, Zea mays L.) system: The role of Bacillus subtilis. Environ. Sci. Pollut. Res. 2019, 26, 5564–5576. [Google Scholar] [CrossRef] [PubMed]
  14. Kopáček, J.; Cosby, B.J.; Evans, C.D.; Hruška, J.; Moldan, F.; Oulehle, F.; Šantrůčková, H.; Tahovská, K.; Wright, R.F. Nitrogen, organic carbon and sulphur cycling in terrestrial ecosystems: Linking nitrogen saturation to carbon limitation of soil microbial processes. Biogeochemistry 2013, 115, 33–51. [Google Scholar] [CrossRef]
  15. Liu, G.; Du, Q.; Li, J. Interactive effects of nitrate-ammonium ratios and temperatures on growth, photosynthesis, and nitrogen metabolism of tomato seedlings. Sci. Hortic. 2017, 214, 41–50. [Google Scholar] [CrossRef]
  16. Igiehon, N.O.; Babalola, O.O. Biofertilizers and sustainable agriculture: Exploring arbuscular mycorrhizal fungi. Appl. Microbiol. Biotechnol. 2017, 101, 4871–4881. [Google Scholar] [CrossRef]
  17. Ayiti, O.E.; Ayangbenro, A.S.; Babalola, O.O. Relationship between nitrifying microorganisms and other microorganisms residing in the maize rhizosphere. Arch. Microbiol. 2022, 204, 1–11. [Google Scholar] [CrossRef]
  18. Kroetsch, D.; Wang, C. Particle size distribution. Soil Sampl. Methods Anal. 2008, 2, 713–725. [Google Scholar]
  19. Keeny, D.R.; Nelson, D.W. Nitrogen—Inorganic Forms; American Society of Soil Science Inc.: Madison, WI, USA, 1982; pp. 643–693. [Google Scholar]
  20. Nelson, D.W.; Sommers, L.E. Total Carbon, Organic Carbon, and Organic Matter; American Societ of Agronomy: Madison, WI, USA, 1996. [Google Scholar]
  21. Santi, C.; Giacomo, C.; Luigi, P.D.A. Direct determination of organic carbon by dry combustion in soils with carbonates. Commun. Soil Sci. Plant Anal. 2006, 37, 155–162. [Google Scholar] [CrossRef]
  22. Walkley, A.; Black, I.A. An examination of the Degtjareff method for determining soil organic matter, and a proposed modification of the chromic acid titration method. Soil Sci. 1934, 37, 29–38. [Google Scholar] [CrossRef]
  23. Bremme, J.M.; Mulvaney, C.S. Total Nitrogen. In Agronomy Monograph No. 9; American Society of Agronomy: Madison, WI, USA, 1982. [Google Scholar]
  24. Smittenberg, J.; Harmsen, G.W.; Quispel, A.; Otzen, D. Rapid methods for determining different types of sulphur compounds in soil. Plant Soil 1951, 3, 353–360. [Google Scholar] [CrossRef]
  25. Sofie, T.; Michiel, O.D.B.; Bram, B.; Sascha, T.; Vincent, S.; Van, H.J.D.; Nele, W.; Jaco, V. Comparative evaluation of four bacteria-specific primer pairs for 16S rRNA gene surveys. Front. Microbiol. 2017, 8, 494. [Google Scholar] [CrossRef]
  26. Meyer, F.; Paarmann, D.; Souza, M.D.; Olson, R.; Glass, E.M.; Kubal, M.; Paczian, T.; Rodriguez, A.; Stevens, R.; Wilke, A.; et al. The metagenomics RAST server—A public resource for the automatic phylogenetic and functional analysis of metagenomes. BMC Bioinform. 2008, 9, 386. [Google Scholar] [CrossRef] [PubMed]
  27. Bolger, A.M.; Lohse, M.; Usadel, B. Trimmomatic: A flexible trimmer for Illumina sequence data. Bioinformatics 2014, 30, 2114–2120. [Google Scholar] [CrossRef]
  28. Kent, W.J. BLAT—The BLAST-Like Alignment Tool. Genome Res. 2002, 12, 656–664. [Google Scholar] [CrossRef]
  29. Wilke, A.; Harrison, T.; Wilkening, J.; Field, D.; Glass, E.M.; Kyrpides, N.; Mavrommatis, K.; Meyer, F. The M5nr: A novel non-redundant database containing protein sequences and annotations from multiple sources and associated tools. BMC Bioinform. 2012, 13, 141. [Google Scholar] [CrossRef] [PubMed]
  30. Hammer, O.; Harper, D.A.T.; Ryan, P.D. Paleontological Statistics Software Package for Education and Data Analysis. Palaentologia Electron. 2001, 4, 9. Available online: http://folk.uio.no/ohammer/past (accessed on 20 April 2021).
  31. Cajo, J.F.; Ter, B.; Petr, S. Software for Multivariate Data Exploration, Testing, and Summarization 1997. Available online: http://www.canoco5.com (accessed on 20 April 2021).
  32. USDA. Soil Survey Laboratory Methods Manual; United State of Agriculture, Natural Resource Conservation Service: Washington, DC, USA, 2014; p. 4.
  33. Burkitbayev, M.; Bachilova, N.; Kurmanbayeva, M.; Tolenova, K.; Yerezhepova, N.; Zhumagul, M.; Mamurova, A.; Turysbek, B.; Demeu, G. Effect of sulfur-containing agrochemicals on growth, yield, and protein content of soybeans (Glycine max (L.) Merr). Saudi J. Biol. Sci. 2021, 28, 891–900. [Google Scholar] [CrossRef]
  34. Wang, Y.; Li, Q.; Hui, W.; Shi, J.; Lin, Q.; Chen, X.; Chen, Y. Effect of sulphur on soil Cu/Zn availability and microbial community composition. J. Hazard. Mater. 2008, 159, 385–389. [Google Scholar] [CrossRef]
  35. Kong, X.; Eriksen, J.; Petersen, S.O. Evaluation of the nitrification inhibitor 3,4-dimethylpyrazole phosphate (DMPP) for mitigating soil N2O emissions after grassland cultivation. Agric. Ecosyst. Environ. 2018, 259, 174–183. [Google Scholar] [CrossRef]
  36. Elrys, A.S.; Wang, J.; Metwally, M.A.S.; Cheng, Y.; Zhang, J.; Cai, Z.; Chang, S.X.; Müller, C. Global gross nitrification rates are dominantly driven by soil carbon-to-nitrogen stoichiometry and total nitrogen. Glob. Chang. Biol. 2021, 27, 6512–6524. [Google Scholar] [CrossRef] [PubMed]
  37. Doost, H.V.; Sharifi, R.S.; Farzaneh, S.; Panah, D.H. Effects of bio- and chemical-organic fertilizers on yield, some physiological traits and fatty acids composition of canola. Bangladesh J. Bot. 2019, 48, 113–122. [Google Scholar] [CrossRef]
  38. Vatandoost, H.; Seyed, S.R.; Kheirizadeh, A.Y. Effect of irrigation levels and plant growth promoting rhizobacteria on yield, some physiological and biochemical indices of rapeseed (Brassica napus L.). J. Crop Prod. Processing 2019, 9, 99–111. Available online: https://www.sid.ir/en/journal/ViewPaper.aspx?id=818546 (accessed on 16 May 2021).
  39. Zhalnina, K.V.; Dias, R.; Leonard, M.T.; de Quadros, P.D.; Camargo, F.A.O.; Drew, J.C.; Farmerie, W.G.; Daroub, S.H.; Triplett, E.W. Genome Sequence of Candidatus Nitrososphaera evergladensis from Group 1.1b Enriched from Everglades Soil Reveals Novel Genomic Features of The Ammonia Oxidizing Archaea. PLoS ONE 2014, 9, e101648. [Google Scholar] [CrossRef]
  40. Melnichuk, T.; Abdurashytov, S.; Andronov, E.; Abdurashytova, E.; Egovtseva, A.Y.; Gongalo, A.; Turin, E.; Pashtetskiy, V. The taxonomic structure of southern chernozem at the genus level influenced by microbial preparations and farming systems. In IOP Conference Series: Earth and Environmental Science, Proceedings of the 6th International Conference on Agriproducts Processing and Farming, Voronezh, Russian Federation, 17–18 October 2019; IOP Publishing: Bristol, UK, 2020; p. 012101. [Google Scholar]
  41. Enebe, M.C.; Babalola, O.O. The influence of soil fertilization on the distribution and diversity of phosphorus cycling genes and microbes community of maize rhizosphere using shotgun metagenomics. Genes 2021, 12, 1022. [Google Scholar] [CrossRef] [PubMed]
  42. Clark, I.M.; Hughes, D.J.; Fu, Q.; Abadie, M.; Hirsch, P.R. Metagenomic approaches reveal differences in genetic diversity and relative abundance of nitrifying bacteria and archaea in contrasting soils. Sci. Rep. 2021, 11, 1–9. [Google Scholar]
  43. Schaechter, M. Encyclopedia of Microbiology; Academic Press: Cambridge, MA, USA, 2009. [Google Scholar]
  44. Fu, Q.; Abadie, M.; Blaud, A.; Carswell, A.; Misselbrook, T.H.; Clark, I.M.; Hirsch, P.R. Effects of urease and nitrification inhibitors on soil N, nitrifier abundance and activity in a sandy loam soil. Biol. Fertil. Soils 2020, 56, 185–194. [Google Scholar] [CrossRef]
  45. Wang, J.; Liu, L.; Gao, X.; Hao, J.; Wang, M. Elucidating the effect of biofertilizers on bacterial diversity in maize rhizosphere soil. PLoS ONE 2021, 16, e0249834. [Google Scholar] [CrossRef]
  46. Sun, P.; Zhao, Z.; Fan, P.; Chen, W.; Ruan, Y.; Wang, Q. Ammonia and Nitrite Oxidizing Bacteria are Dominant in Nitrification of Maize Rhizosphere Soil Following Combined Application of Biochar and Chemical Fertilizer. Front. Microbiol. 2021, 12, 715070. [Google Scholar] [CrossRef]
  47. Meier, M.A.; Lopez-Guerrero, M.G.; Guo, M.; Schmer, M.R.; Herr, J.R.; Schnable, J.C.; Alfano, J.R.; Yang, J. Rhizosphere Microbiomes in a Historical Maize-Soybean Rotation System Respond to Host Species and Nitrogen Fertilization at the Genus and Subgenus Levels. Appl. Environ. Microbiol. 2021, 87, e03132–e03220. [Google Scholar] [CrossRef]
  48. Stein, L.Y. Insights into the physiology of ammonia-oxidizing microorganisms. Curr. Opin. Chem. Biol. 2019, 49, 9–15. [Google Scholar] [CrossRef]
  49. Schlemper, T.R.; Leite, M.F.; Lucheta, A.R.; Shimels, M.; Bouwmeester, H.J.; van Veen, J.A.; Kuramae, E.E. Rhizobacterial community structure differences among sorghum cultivars in different growth stages and soils. FEMS Microbiol. Ecol. 2017, 93. [Google Scholar] [CrossRef] [PubMed]
  50. Rocha, K.F.; Kuramae, E.E.; Borges, B.M.F.; Leite, M.F.A.; Rosolem, C.A. Microbial N-cycling gene abundance is affected by cover crop specie and development stage in an integrated cropping system. Arch. Microbiol. 2020, 202, 2005–2012. [Google Scholar] [CrossRef] [PubMed]
  51. Lu, T.; Ke, M.; Lavoie, M.; Jin, Y.; Fan, X.; Zhang, Z.; Fu, Z.; Sun, L.; Gillings, M.; Peñuelas, J. Rhizosphere microorganisms can influence the timing of plant flowering. Microbiome 2018, 6, 1–12. [Google Scholar] [CrossRef] [Green Version]
  52. Fu, J.; Xiao, Y.; Liu, Z.; Zhang, Y.; Wang, Y.; Yang, K. Trichoderma asperellum improves soil microenvironment in different growth stages and yield of maize in saline-alkaline soil of the Songnen Plain. Plant Soil Environ. 2020, 66, 639–647. [Google Scholar] [CrossRef]
  53. Fu, Q.; Xi, R.; Zhu, J.; Hu, H.; Xing, Z.; Zuo, J. The relative contribution of ammonia oxidizing bacteria and archaea to N2O emission from two paddy soils with different fertilizer N sources: A microcosm study. Geoderma 2020, 375, 114486. [Google Scholar] [CrossRef]
Figure 1. Sketch map of the study area, Molelwane farm, North West Province, South Africa. (A) North west province, (B) Mafikeng local municipality, (C) Molelwane farm.
Agriculture 12 01328 g001
Figure 2. Heatmap showing the relative abundance of bacteria and archaea at each growth stage. Z-score with the scale bar shows the gradient of color saturation representing the relative abundance of the organisms. BU = samples from bulk soil, PR = samples from pretasseling growth stage, TA = samples from tasseling growth stage, and FR = samples from fruiting growth stage.
Agriculture 12 01328 g002
Figure 3. Heatmap showing list and relative abundance of nitrifying bacteria and archaea genera. Z-score with the scale bar shows the gradient of color saturation representing the relative abundance of the organisms.
Agriculture 12 01328 g003
Figure 4. Principal component analysis (PCA) of nitrifying bacteria and archaea group 16S amplicon sequence. The resultant vector showed the structural shift and the influence of nitrifying bacteria and archaea. Axis 1 and 2 explained the observed variation based on Euclidean dissimilarity matrix. [(A) phylum level axis 1 (83%), axis 2 (11%). (B) genus level axis 1 (69%), axis 2 (21%)].
Agriculture 12 01328 g004aAgriculture 12 01328 g004b
Figure 5. Principal coordinate analysis (PCoA) of nitrifying bacteria and archaea genera across different growth stages.
Agriculture 12 01328 g005
Table 1. Physio-chemical parameters of the maize rhizosphere.
VariableMinimumMaximumMeanStd. Deviation
SA84.0086.0085.001.16
CL12.0014.0013.001.16
pH5.356.225.930.41
S246.00576.00336.50159.85
OC0.520.840.730.15
TC0.520.890.730.15
OM2.042.702.430.30
TN0.060.090.080.01
NH43.844.674.350.40
NO34.029.766.122.72
SA—sand (%), CL—clay (%), pH (H2O), S—sulfur (mg/kg), OC—organic carbon (%), TC—total carbon (%), OM—organic matter (%), TN—total nitrogen (%), NH4—ammonium (mg/kg), NO3—nitrate (mg/kg).
Table 2. Evaluation of evenness and diversity of bacteria and archaea across different growth stages at phylum level.
Diversity IndicesBUPRTAFRp-Value
Phylum
Simpson_1-D0.71 ± 0.060.71 ± 0.070.74 ± 0.070.73 ± 0.060.99
Shannon_H1.62 ± 0.191.61 ± 0.181.69 ± 0.191.69 ± 0.19
Evenness_e^H/S0.20 ± 0.100.21 ± 0.110.23 ± 0.100.22 ± 0.11
The p-value is based on Kruskal–Wallis. Mean ± standard error (n = 3).
Table 3. Alpha diversity evaluation of nitrifying bacteria and archaea across different growth stages at genus level.
Diversity IndicesBUPRTAFRp-Value
Genus
Simpson_1-D0.52 ± 0.070.54 ± 0.110.51 ± 0.100.56 ± 0.100.99
Shannon_H1.13 ± 0.191.19 ± 0.221.09 ± 0.201.21 ± 0.21
Evenness_e^H/S0.31 ± 0.100.33 ± 0.130.27 ± 0.120.28 ± 0.12
The p-values are based on Kruskal–Wallis. Mean ± standard error (n = 3).
Table 4. Pearson’s correlation coefficient (r) matrix analysis shows the relationship among maize rhizosphere environmental factors.
VariablesSACLpHSOCTCOMTNNH4NO3NB
SA1
CL−1.001
pH−0.810.811
S−0.600.600.511
OC−0.840.840.100.541
TC−0.810.810.980.340.971
OM−0.910.910.970.650.980.941
TN−0.740.740.980.620.980.910.951
NH40.27−0.270.060.530.06−0.130.040.271
NO3−0.880.880.720.900.760.620.860.750.161
NB0.22−0.22−0.590.38−0.55−0.71−0.41−0.490.310.121
SA—sand (%), CL—clay (%), pH (H2O), S—sulfur (mg/kg), OC—organic carbon (%), TC—total carbon (%), OM—organic matter (%), TN—total nitrogen (%), NH4—ammonium (mg/kg), NO3—nitrate (mg/kg), NB—nitrifying bacteria. r; 0.90 to 1.00 (−0.90 to −1.00) = very highly positive (negative) correlation. r; 0.70 to 0.90 (−0.70 to −0.90) = highly positive (negative) correlation. r; 0.50 to 0.70 (−0.50 to −0.70) = Moderately positive (negative) correlation. r; 0.30 to 0.50 (−0.30 to −0.50) = Low positive (negative) correlation. r; 0.00 to 0.30 (−0.00 to −0.30) = insignificant correlation. p ≤ 0.05. Significant values in bold.
Table 5. Pearson’s correlation coefficient (r) matrix analysis shows the influence of environmental factors and nitrifying bacteria.
VariablesSACLpHSOCTCOMTNNH4NO3
Nitrospira−0.070.07−0.490.29−0.44−0.53−0.28−0.49−0.160.22
Nitrosospira−0.840.840.980.370.971.000.950.91−0.150.66
unclassified (derived from Nitrosomonadales)0.97−0.97−0.65−0.51−0.68−0.67−0.78−0.550.43−0.82
unclassified (derived from Nitrosomonadaceae)−0.900.900.980.570.990.961.000.95−0.020.81
Nitrobacter0.94−0.94−0.92−0.74−0.94−0.87−0.99−0.91−0.06−0.93
Nitrosovibrio−0.950.950.670.370.700.730.770.54−0.540.73
Nitrosomonas−0.410.410.840.540.820.740.760.920.560.52
Candidatus Nitrososphaera0.20−0.200.33−0.500.280.410.110.300.01−0.41
Nitrosococcus0.88−0.88−0.49−0.31−0.52−0.55−0.61−0.350.63−0.66
Nitrococcus0.86−0.86−1.00−0.53−1.00−0.98−0.99−0.97−0.01−0.76
SA—sand (%), CL—clay (%), pH (H2O), S—sulfur (mg/kg), OC—organic carbon (%), TC—total carbon (%), OM—organic matter (%), TN—total nitrogen (%), NH4—ammonium (mg/kg), NO3—nitrate (mg/kg), NB—nitrifying bacteria. r; 0.90 to 1.00 (−0.90 to −1.00) = very highly positive (negative) correlation. r; 0.70 to 0.90 (−0.70 to −0.90) = highly positive (negative) correlation. r; 0.50 to 0.70 (−0.50 to −0.70) = Moderately positive (negative) correlation. r; 0.30 to 0.50 (−0.30 to −0.50) = Low positive (negative) correlation. r; 0.00 to 0.30 (−0.00 to −0.30) = insignificant correlation. p ≤ 0.05. Significant Figure in bold.
Publisher’s Note: MDPI stays neutral with regard to jurisdictional claims in published maps and institutional affiliations.

