Article

Investigating the Impact of Grain Subsidy Policy on Farmers’ Green Production Behavior: Recent Evidence from China

College of Economics, Sichuan Agricultural University, Chengdu 611130, China
*
Author to whom correspondence should be addressed.
Submission received: 12 July 2022 / Revised: 5 August 2022 / Accepted: 8 August 2022 / Published: 10 August 2022
(This article belongs to the Special Issue Agricultural Food Marketing, Economics and Policies)

Abstract

:
This paper investigates how grain subsidy policy (GSP) in farmland transfer affects farmers’ green production behavior (FGPB) for promoting green agricultural development and improving grain subsidy policy. In this study, we used the data of the China Household Finance Survey (CHFS, 2015) and applied the Probit model to discover the impact and mechanism of the GSP on FGPB in farmland transfer. In addition, we also analyzed the mediating effect of farmers’ credit constraints and the moderating effect of farmers’ risk tolerance. The results show that, firstly, grain subsidy to the actual operator of the farmland generally promotes farmers’ excessive fertilizer application behavior, while there is no significant effect on farmers’ excessive pesticide application behavior. Secondly, the mediating effect of farmers’ credit constraints on the impact of GSP on FGPB is not significant. Thirdly, farmers’ risk tolerance plays a significant moderating effect in the impact of GSP on farmers’ excessive fertilizer application behavior. Finally, GSP mainly promotes excessive fertilizer application behavior among farmers in Eastern China.

1. Introduction

Promoting agricultural green development (AGD) is becoming the starting point and foothold of China’s grain subsidy policy (GSP). Presently, green economic development is a prime concern of the Chinese government [1]. Since the reform and opening up, under the premise of a large number of inputs of chemical fertilizers and pesticides, China’s agriculture has achieved rapid development [2], but, at the same time, the agricultural environment has been damaged [3], and many agricultural areas have faced increasingly serious ecological and environmental problems, such as river water pollution, soil fertility decline, and land pesticide residues [4,5,6]. However, by the end of 2020, China’s zero-growth target of chemical fertilizers and pesticide usage was successfully achieved.
China is the world’s largest country in terms of consumption of chemical fertilizers and pesticides, accounting for more than 30% of the world’s chemical fertilizer consumption, and the amount of pesticide application per unit area is 2.5–5 times that of developed countries [7]. Several studies revealed that the utilization rate of various major chemical and agricultural products in China has remained at a low level. In 2015, the utilization rates of chemical fertilizers and pesticides for major food crops (i.e., rice, wheat, and corn) in China were 35.2% and 36.6%, respectively. The unutilized part of chemical fertilizers and pesticides eventually remained in the soil or flowed into water, which was the main reason for agricultural non-point source pollution in China [8]. AGD, as an effective mode to solve the contradiction between agricultural economic development and agricultural ecological environment protection, has become the inevitable choice for China’s agricultural modernization development trend, and the Chinese government has formulated several agricultural development policies.
In recent years, the Chinese government has devoted great importance to agricultural non-point source pollution and introduced various policies to promote AGD in the country. In 2017, the General Office of the Central Committee of the Communist Party of China and the State Council of the People’s Republic of China issued the Opinions on Innovating Institutional Mechanisms to Promote Agricultural Green Development, emphasizing that AGD should be placed in a prominent position in the overall situation of ecological civilization construction. The report of the 19th National Congress of the Communist Party of China clearly stated that we should promote green development, focus on solving prominent environmental problems, and strengthen ecosystem protection. In 2021, the Ministry of Agriculture and Rural Affairs of the People’s Republic of China, the National Development and Reform Commission of the People’s Republic of China, and six other departments jointly issued the “14th Five-Year” National Agricultural Green Development Plan, which pointed out that it is necessary to strengthen the prevention and control of agricultural non-point source pollution, improve the environmental protection level of production areas, and promote the reduction in and efficiency of chemical fertilizers and pesticides. The latest Central Document No. 1 of 2022 proposed promoting the green development of agricultural and rural areas, strengthening the comprehensive management of agricultural non-point source pollution, and further promoting a reduction in agricultural inputs.
Agricultural subsidies are an important factor affecting farmers’ production decision-making behavior, and they are an effective incentive that significantly affects farmers’ green production behavior (FGPB) [9]. On the one hand, agricultural subsidies can reduce the expected cost of farmers adopting green production technology and then increase the expected net income of farmers, thus promoting FGPB [10]. On the other hand, subsidies for means of production can reduce the real prices of polluting factors of production, which will make farmers increase their investment in fertilizers, pesticides, and agricultural film, leading to an aggravation of agricultural non-point source pollution [11]. Other scholars believe that agricultural subsidies have a certain role in promoting farmers’ income but that they will not affect farmers’ production input behavior. The environmental effects of agricultural subsidy policies have been discussed a great deal in academic circles, but little work in the literature places agricultural subsidy policies in the perspective of farmland transfer to evaluate their environmental effects.
Agricultural land transfer is an effective way to achieve moderate scale management of agricultural production; improve the efficiency of agricultural land resource allocation; improve agricultural productivity; and promote farmers’ income [12]. In recent years, the Chinese government has formulated various policies to promote agricultural land transfer. By 2020, the total area of agricultural land transfer in China had exceeded 1/4 of the total area of cultivated land in China. Since the new century, China’s agricultural land transfer has gradually entered an accelerated period [13], and the problem of whether the related grain subsidy based on agricultural land is attached to this transfer has gradually become prominent. The existence of the agricultural subsidy, the amount of the subsidy, and the different subsidy objects will impact farmers’ ecological production behavior [14,15,16]. In the context of farmland transfer, will the attribution of grain subsidies affect FGPB? How does it affect it? What is the influencing mechanism? These questions need a response from the academic community. This paper will study the above problems from the perspective of the impact of grain subsidy ownership on FGPB in agricultural land transfer.
At present, a large number of studies have examined the effects of agricultural subsidies on FGPB, but no consistent conclusions have been reached. There are three main conclusions. The first is that agricultural subsidies have a promoting effect on FGPB. Scholars believe that agricultural subsidies can encourage farmers to reduce the application of chemical fertilizers and pesticides and promote the substitution of organic fertilizers for inorganic fertilizers [16,17,18]. The second is that agricultural subsidies have an inhibitory effect on FGPB. Some studies revealed that agricultural subsidies reduced the environmental efficiency of farmers’ chemical fertilizer inputs and increased agricultural non-point source pollution [19,20]. Subsidies on the price of agricultural materials distort the prices of agricultural materials such as chemical fertilizers and pesticides and promote farmers’ incremental investment in chemical fertilizers and pesticides [21]. The third is that agricultural subsidies have no effect on FGPB or that different agricultural subsidy policies have different effects. Some scholars believe that the effect of agricultural subsidies on green agricultural development is not consistent, and the environmental effect of agricultural subsidies is still difficult to determine [22]. In addition, there are studies more similar to the theme of this paper. Li [23] studied the subsidy policy of farmland fertility protection and believed that the subsidy funds should be enjoyed by the actual farmers of the farmland to enhance the environmental effect of the subsidy policy. However, this study did not empirically analyze the relationship between the ownership of subsidy funds and environmental protection. Mao and Cao [24] took a crop straw mechanized returning operation subsidy as an example and, through empirical calculation and comparative analysis, studied the influence of different objects of the operation subsidy on farmers’ green ecological agricultural technology adoption behavior. The results showed that the direct payment of the operation subsidy to farmers was more conducive to FGPB.
The existing works focused on the environmental effects of various agricultural subsidy policies, and some studies focused on the effects of grain subsidy attribution on land transfer, food security, and farmers’ income in farmland transfer but ignored the possible environmental effects of grain subsidy attribution on farmland transfer. It is the development direction of China’s agriculture to achieve moderate-scale operation of farmland through farmland transfer. In recent years, the scale of farmland transfer in China has been increasing, and the problem of the ownership of grain subsidies in farmland transfer has gradually emerged. Therefore, it is very important to study the ownership of this subsidy. Agricultural green production is an important way to break the bottleneck of China’s agricultural development and accelerate the realization of China’s agricultural and rural modernization [25]. Will the attribution of grain subsidies in farmland transfer affect FGPB? The answer to this question can provide a reference for the reform and optimization of grain subsidy policy in China and other countries with the same national conditions and provide a path basis for the green development of agriculture, which has great theoretical and practical value.
Therefore, based on the perspective of grain subsidy attribution in farmland transfer, this paper discusses the impact of agricultural subsidy policy on FGPB. In this paper, two typical environmentally friendly agricultural production behavioral patterns are used as proxy variables of FGPB, namely, whether chemical fertilizers are excessive or not and whether pesticides are excessive. Based on the 2015 survey data of the China Household Finance Survey (CHFS), this paper applied the Probit model. Firstly, it estimates the impact of grain subsidy ownership on FGPB in farmland transfer and then tests the mechanism of the impact of grain subsidy ownership on FGPB to answer the question of whether GSP in farmland transfer will affect FGPB.
This paper is organized as follows: Section 2 introduces the research hypothesis, data source, model setting, and variable selection and description. Section 3 reports the model regression results. Section 4 presents the research conclusion and policy implications.

2. Materials and Methods

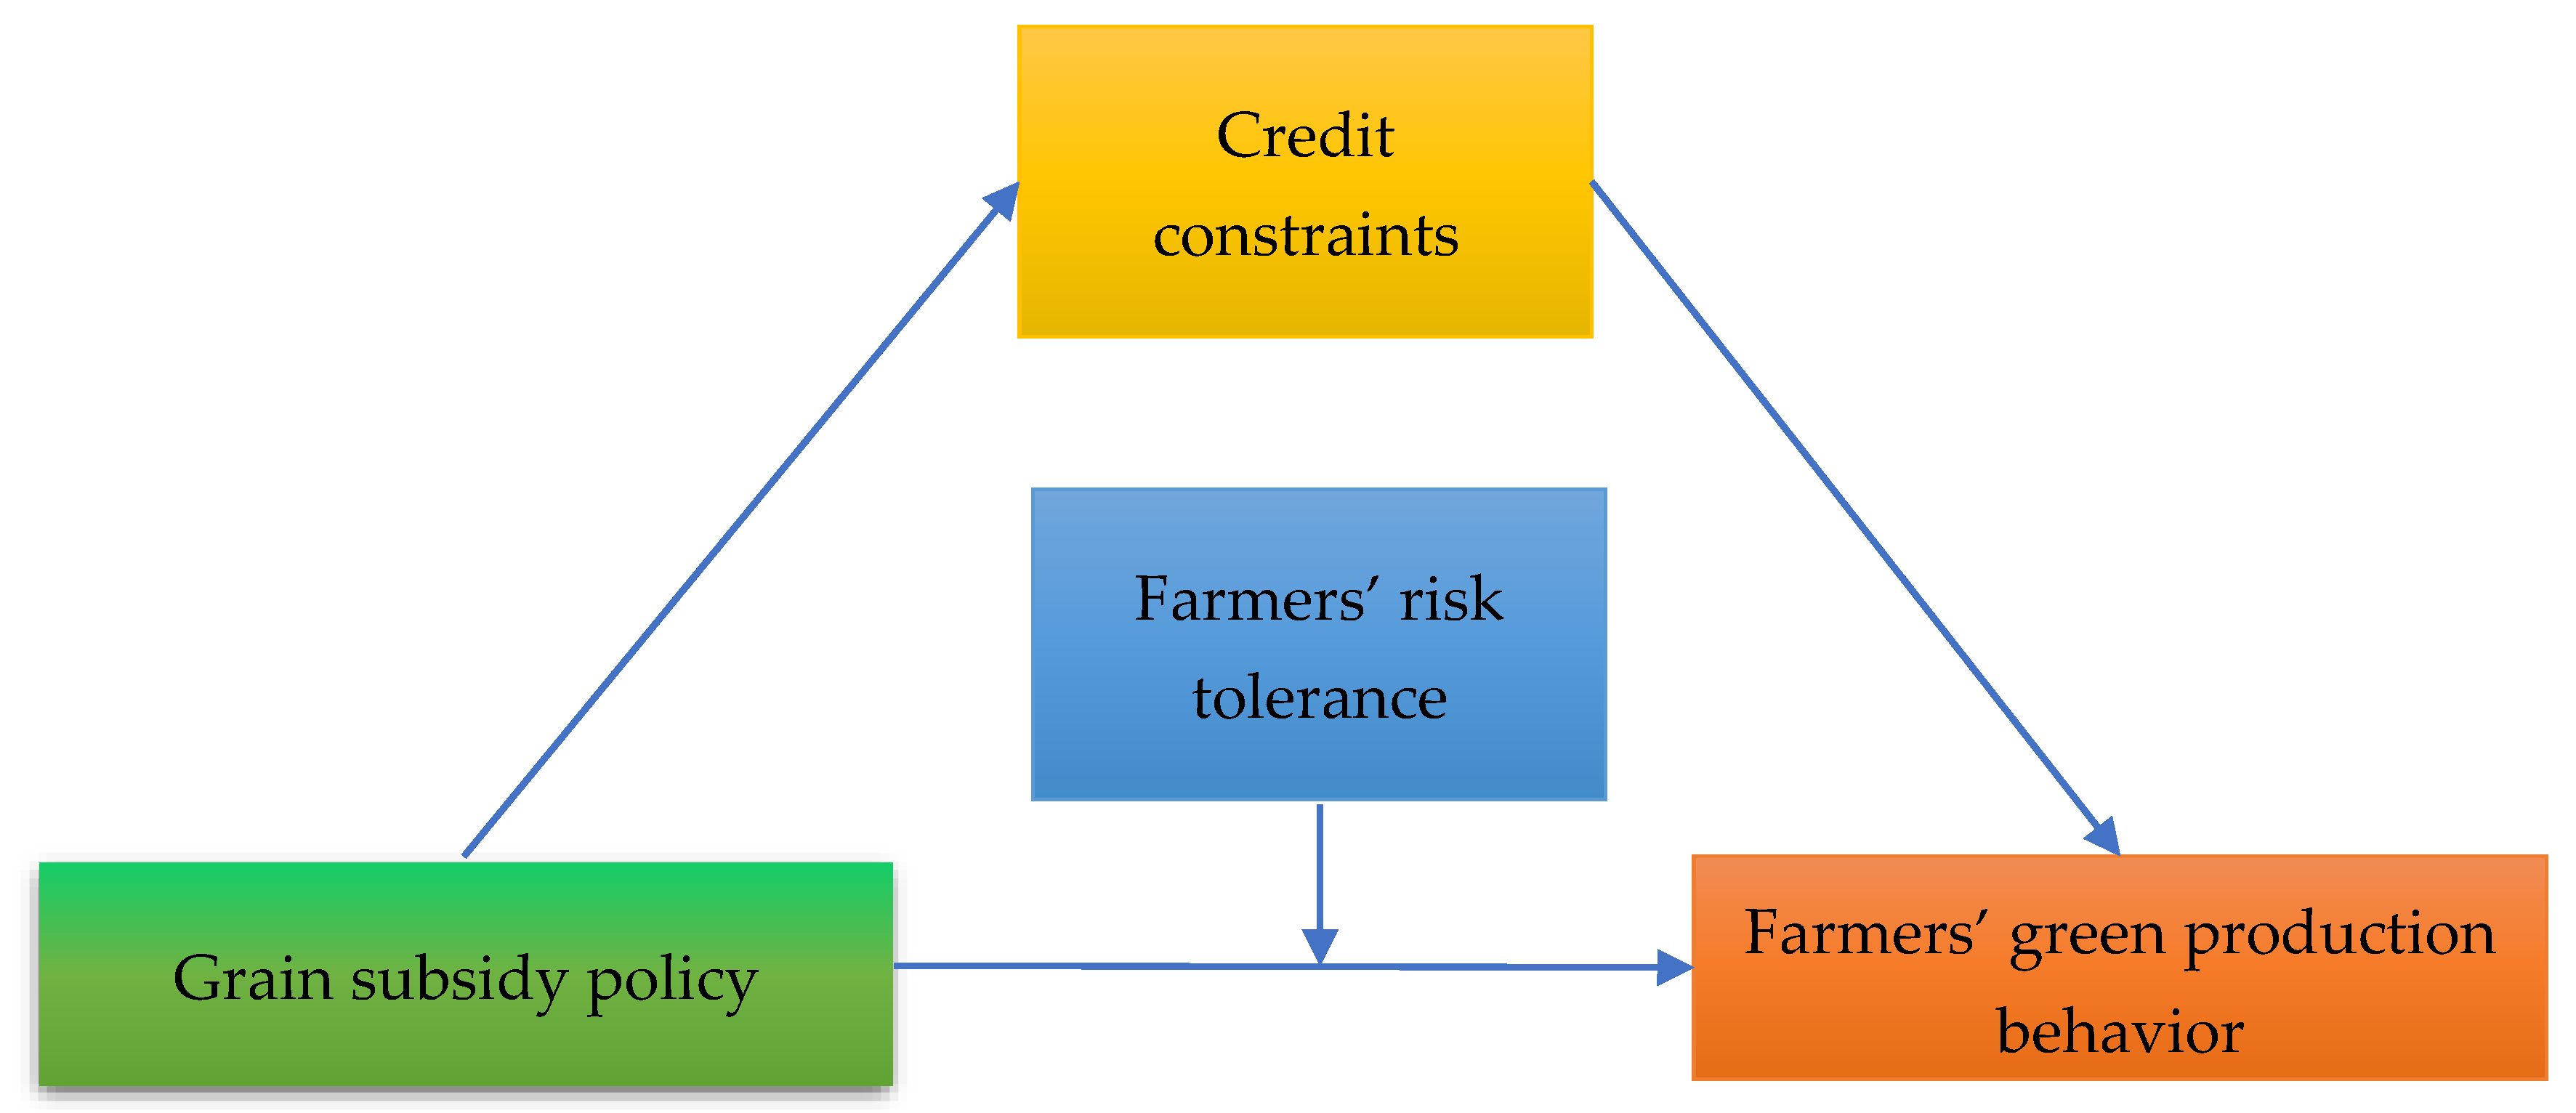
2.1. Research Hypotheses

The impact of GSP on FGPB may have a direct and indirect effect. To begin with, the attribution of grain subsidies may directly affect FGPB. The specific analysis is as follows. On the one hand, agricultural subsidies (or grain subsidies), such as a price subsidy for production materials (fertilizers, pesticides, etc.), distort their market prices while promoting agricultural development so that farmers choose to invest in chemical agricultural materials with relatively low prices to replace labor and other production materials, resulting in the excessive application of fertilizers and pesticides and environmental pollution. On the other hand, an agricultural subsidy will increase farmers’ economic income. For the disposal of transfer payments, to reduce the labor force in agricultural production, farmers may be more inclined to increase production by increasing the application of fertilizers and pesticides, which requires less labor force, leading to the deterioration of the agricultural environment [26]. In conclusion, the attribution of grain subsidies may directly hinder FGPB, i.e., promote farmers’ excessive fertilizer and pesticide application behavior. Based on this, this paper proposes the following hypothesis:
H1. 
The attribution of grain subsidies (whether to supply the actual operator of farmland or not) will affect FGPB, showing an inhibitory effect.
H1a. 
The attribution of grain subsidies affects farmers’ excessive fertilizer application behavior, which is promoted.
H1b. 
The attribution of grain subsidies affects farmers’ excessive pesticide application behavior, which is promoted.
Next, the attribution of a grain subsidy may indirectly affect FGPB through credit constraints affecting farmers. Firstly, agricultural subsidies can alleviate the credit constraints of farmers. The analysis is as follows. On the one hand, the agricultural subsidy increases farmers’ income. Suppose that this increase makes up for the gap in agricultural production inputs. In that case, it will reduce the credit demand of farmers due to agricultural production and operation and ease the credit constraints of farmers.
On the other hand, the agricultural subsidy increases farmers’ capital (available for mortgages and transactions). Suppose that farmers desire to expand production and that the agricultural subsidy is not enough to make up the funds needed to expand production. In that case, farmers will need to obtain funds through credit channels. Agricultural subsidy income can improve farmers’ credit qualifications and ease credit constraints of farmers. Studies have also shown that agricultural subsidies can indirectly ease farmers’ credit constraints by promoting land value and increasing collateral for farmers’ credit [27].
Secondly, the impact of farmers’ credit constraints on FGPB is inconclusive. On the one hand, the lifting of credit constraints will enable farmers to have capital support for agricultural inputs such as fertilizers and pesticides, which may lead to farmers replacing labor inputs with inputs of production factors, leading to excessive inputs of agricultural chemical products [28]. On the other hand, through theoretical analysis and empirical testing, Yu et al. [29] believed that the credit constraints of family farms limited the application of green pest control technology in the agricultural production process. This shows that the lifting of credit constraints also has the effect of promoting FGPB. This paper argues that the attribution of grain subsidies can alleviate the credit constraints of farmers but that the effect of credit constraints on FGPB is still difficult to determine. Based on this, the following hypothesis is proposed:
H2. 
The attribution of grain subsidies will affect FGPB by alleviating farmers’ credit constraints.
H2a. 
The attribution of grain subsidies promotes farmers’ excessive fertilizer application behavior by easing farmers’ credit constraints.
H2b. 
The attribution of grain subsidies promotes farmers’ excessive pesticide application behavior by easing farmers’ credit constraints.
H2c. 
The attribution of grain subsidies inhibits farmers’ excessive fertilizer application behavior by alleviating farmers’ credit constraints.
H2d. 
The attribution of grain subsidies inhibits farmers’ excessive pesticide application behavior by easing farmers’ credit constraints.
Finally, farmers’ risk tolerance may have a moderating effect on the impact of grain subsidy ownership on FGPB. Since agricultural production has the characteristics of natural and market risks, the uncertainty of agricultural production and operation is much higher than that of other economic activities. Farmers have a different risk tolerance, and the attribution of a grain subsidy will affect farmers’ behavior in agricultural production input. Further, farmers with low risk tolerance tend to adopt traditional production methods to avoid risks, and so access to grain subsidies may lead to increased preventive investment in agricultural chemical products such as fertilizers and pesticides; farmers with strong risk tolerance have lower risk expectations and risk constraints, and grain subsidies may have little effect on their behavior of increasing agricultural inputs. To sum up, the weaker the farmer’s risk tolerance, the stronger the hindering effect of agricultural subsidies on FGPB. Based on this, this paper proposes the following hypothesis:
H3. 
Farmers’ risk tolerance will negatively moderate the inhibitory effect of grain subsidy attribution on FGPB.
H3a. 
Farmers’ risk tolerance negatively moderates the promoting effect of grain subsidy attribution on farmers’ excessive fertilizer application behavior.
H3b. 
Farmers’ risk tolerance negatively moderates the promoting effect of grain subsidy attribution on farmers’ excessive pesticide application behavior.
The theoretical framework that has been applied in the context of this piece of research is presented in Figure 1.

2.2. Data Sources and Basic Characteristics of Samples

The data used in this study are from the China Household Finance Survey (CHFS) project carried out nationwide in 2015 by the China Household Finance Survey and Research Center of Southwest University of Finance and Economics. The survey covers 29 provinces (autonomous regions, municipalities), 351 districts and counties, and 1396 village (neighborhood) committees in China, and the sample size is 37,289 households. The data are representative of national and provincial sub-provincial cities. After excluding the samples that neither engaged in agricultural production and operation nor participated in farmland transfer and had a serious lack of core variables, 1269 observations were finally retained (20.1% in the eastern region; 44.7% in the central region; 35.2% in the western region). According to the China Rural Statistical Yearbook, based on CHFS’s division of eastern, central, and western China, in 2015, China’s total cultivated land area was 129.367 million hectares, of which the eastern region accounted for 24.1%, central for 41.3%, and western for 34.6%. The spatial distribution of the research samples is basically consistent with the cultivated land in China, indicating that the research samples are well representative.
The basic characteristics of the sample are shown in Table 1. The educational level of the rural household is basically at the level of junior high school, primary school, and below, and this part of the sample accounts for nearly 90% of the total sample. The age of the rural household is mainly concentrated in 36~65 years old, and the proportion of 51~65 years old is slightly higher. The proportion of the sample farmers with 2–4 family members is the highest, accounting for 43.1% of the total sample, while the proportion of the sample with 0~2 family members in the labor force is more than 50%. There are 203 observations of grain subsidies for the actual operator of farmland in farmland transfer, accounting for 16% of the total sample size. In contrast, samples of household land operation areas of 2~4 mu and 10~70 mu are more numerous, accounting for 23.95% and 28.84% of the total sample. A total income from grain and cash crops in the range of Renminbi (RMB) 200~30,000 accounted for 79.28% of the total sample.

2.3. Methods

2.3.1. Production Function Model

In this paper, the standard for defining excessive application of fertilizers and pesticides is whether the amount of fertilizers and pesticides applied by farmers exceeds the optimal amount in an economic sense, which is judged by the marginal productivity of chemical inputs. Based on the hypothesis of the “rational rural household” in economics, the production purpose of farmers is to maximize profits, and the objective function is:
Π = pY i r i X i fF wZ
where Π denotes the net profit of agricultural production; p stands for the unit price of agricultural products; Y indicates the total output of agricultural products; ri represents the unit price of the i other production factors except fertilizer and pesticide; Xi is the input number of the i other production factors except fertilizer and pesticide; f is the unit price of fertilizer; F is the input number of the fertilizer; w is the unit price of pesticide; and Z is the input number of the pesticide. To maximize profits, the optimal amount of fertilizer and pesticide should meet the following conditions:
d Π f = f
d Π w = w
where dΠf is the marginal output value (VMF) of fertilizer application. When VMF/f = 1, the amount of fertilizer is the optimal amount in the economic sense. The tern dΠw is the marginal output value (VMP) of pesticide application. When VMP/w = 1, the amount of pesticide is the optimal amount in the economic sense. Due to the limited availability of relevant data, the fertilizer and pesticide application amount is calculated by the input expenditure (RMB) of the unit area of land. Therefore, it is assumed that the marginal input of fertilizer and pesticide is 1 (RMB) and that the unit price of fertilizer and pesticide is 1 (RMB). Therefore, when VMF and VMP are greater than 1, the amount of fertilizer and pesticide is insufficient; when VMF and VMP are less than 1, they are excessive. The C-D production function is commonly used to estimate the marginal output of fertilizers and pesticides in theoretical circles. Nevertheless, pesticides affect the total output by reducing crop losses under the condition of other production inputs unchanged and so belong to the loss control input. Directly substituting it into the C-D production function will overestimate the marginal output value of the pesticide. Lichtenberg and Zilberman [30] introduced pesticide input as a loss control function into the production function and established the following loss control production function model:
Y = f ( A , X ) × G ( B )
where Y denotes crop output; A denotes fertilizer input; B denotes pesticide input; X denotes input of production factors except fertilizer and pesticide and the influencing factors that may affect farmers’ production factor input behavior; f (A, X) is the composite function of input and control variables of other production factors except pesticide input; and G (B) is the loss control function. G (B) has four forms, those of Pareto distribution, logistic distribution, Weibull distribution, and exponential distribution. The exponential distribution is an exponential form, and the estimated results are more robust [31]. Therefore, the production function of loss control in this paper adopted an exponential distribution, and the following production model was established:
lnY = α + β lnA + i γ i lnX i + ln ( 1 e λ B ) + δ
Among them, Y is the output value of crops; Xi is the first control variable; α is the intercept term; β, γi, and λ are the parameters to be estimated; and δ is the residual term. Referring to the production function constructed by Christian Grovermann et al. [32], Xi mainly includes the input of other production factors (i.e., labor input, mechanical input, and seed input) except fertilizer and pesticide, farmer characteristics (i.e., education level of a household, age of householder), and land characteristics (land quality, land type). For the formula (5), the first derivative of fertilizer and pesticide can be obtained:
VMF = β Y A
VMP = Y × λ e λ B 1 e λ B
Substituting the parameter estimation of Equation (5) into Equations (6) and (7), the marginal productivity of fertilizer and pesticide for each farmer is calculated to determine whether the farmer applied excessive fertilizer and pesticide.

2.3.2. Basic Estimation Model

Since excessive application of fertilizer and pesticide belongs to two classification variables, this paper used the binary Probit model as the measurement model of benchmark analysis and constructed the following model [33]:
y A = α 0 + α 1 Subsidy + α 2 Control + δ 1
y B = β 0 + β 1 Subsidy + β 2 Control + δ 2
where yA and yB, respectively, indicate whether there was excessive application of fertilizer and pesticide; “Subsidy” indicates whether grain subsidies are owned by the actual operator of the farmland; “Control” indicates control variables; α0 and β0 are intercept items; α1, α2 and β1, β2 are parameters to be estimated; and δ1, δ2 are residual items.

2.3.3. Mediation Effect Model

To identify how agricultural subsidies indirectly affect FGPB through credit constraints, the mediating effect model setting and test procedures of Wen and Ye [34] were referred to, and the following regression equations were constructed:
CreditC = ϑ 1 + ϑ 2 Subsidy + ϑ 3 Control + δ 3
y A = α 3 + α 4 Subsidy + α 5 CreditC + α 6 Control + δ 4
y B = β 3 + β 4 Subsidy + β 5 CreditC + β 6 Control + δ 5
where CreditC indicates whether farmers are subject to credit constraints for engaging in agricultural production and operation. θ1, θ2, θ3, α3, α4, α5, α6, β3, β4, β5, β6, δ3, δ4, and δ5 are the parameters to be estimated; other variables and symbols have the same meaning as Equations (8) and (9).

2.3.4. Moderation Effect Model

To test the moderating effect of grain subsidy ownership on farmers’ risk tolerance in the process of green production behavior, the following model is constructed:
y A = α 7 + α 8 Subsidy + α 9 Control + α 10 Frisk + δ 6
y A = α 11 + α 12 Subsidy + α 13 Control + α 14 Frisk + α 15 Subsidy * Frisk + δ 7
y B = β 7 + β 8 Subsidy + β 9 Control + β 10 Frisk + δ 8
y B = β 11 + β 12 Subsidy + β 13 Control + β 14 Frisk + β 15 Subsidy * Frisk + δ 9
where Frisk indicates farmers’ risk tolerance; α715, β715 and δ69 are the parameters to be estimated, and other variables have the same meaning as Equations (8) and (9).

2.4. Model Variables

  • Dependent variables. As mentioned above, academic circles usually use farmers’ application of various green agricultural production technologies to characterize FGPB. In this paper, FGPB was characterized by whether farmers applied excessive fertilizer and pesticides. Specifically, when the marginal productivity of farmers applying fertilizer and pesticide was greater than or equal to 1, it was considered that farmers did not apply excessive fertilizer and pesticide; conversely, excessive application of fertilizer and pesticide was considered.
  • Focus variable and control variables. In this paper, the core explanatory variable is whether the grain subsidy supplies the actual operator of farmland in farmland transfer, which is a dummy variable. Referring to the existing research on the influencing factors of farmers’ fertilizer and pesticide application behavior, the control variables that may affect FGPB were selected in the model, including three types: household characteristics; farmers’ family, agricultural production, and operation characteristics; and cultivated land characteristics [35]. Specifically, the household characteristics are as follows: ① The age of the household: the older rural household has more difficulties accepting advanced concepts and advanced production technologies and a greater possibility of excessive application of fertilizer and pesticide [36]. ② Gender of the rural household: for example, female rural households tend to be more conservative, and there is a risk of production reduction in the implementation of fertilizer and pesticide reduction. Therefore, female rural households tend to choose to increase the application of fertilizer and pesticides to reduce this risk. ③ Educational level of the rural household: the well-educated rural household is more active and more likely to scientifically apply fertilizer and pesticides. Household and agricultural production and operation characteristics: ① whether they consume their own agricultural products: if farmers consume their own agricultural products, they are more likely to focus on the quality and safety of agricultural products, thereby reducing the use of fertilizer and pesticides. ② Whether they are ordinary farmers: compared with large professional households and family farms, ordinary farmers are more likely to adopt traditional production methods due to a lack of information and production technology, resulting in excessive fertilizer and pesticide application. ③ Agricultural income: on the one hand, farmers with higher agricultural income may focus more on agricultural production, and they are more concerned about advanced agricultural production technology and are more likely to apply it, and so they may adopt a green production mode. On the other hand, farmers with higher agricultural income also have more agricultural investment capital, which may lead to excessive fertilizer and pesticide application. ④ Land operation area: farmers with large farms are more likely to adopt advanced production technology and adopt a greener production mode [14]. ⑤ Whether they have their own agricultural machinery: the transportation and application of agricultural materials such as fertilizer and pesticides (pesticide solvents) (e.g., mechanical sowing will have a certain impact on the application of fertilizer) are directly or indirectly related to agricultural machinery. Therefore, the existence of agricultural machinery in rural households may affect FGPB. Land condition: ① cultivated land quality: the lower the quality of cultivated land is, the lower is the output level of crops; to achieve the purpose of increasing production, farmers tend to increase the application of fertilizer and pesticide. ② Whether the cultivated land has power supply facilities: on farmland with power supply facilities, farmers may adopt the modern mode of operation in agricultural production. Production inputs tend to be standardized and rationalized; therefore, farmers’ input level of fertilizer and pesticides may be low. ③ Whether the farmland has irrigation facilities. Cultivated land with irrigation facilities has better production conditions and higher output levels. Farmers have less motivation to ensure yield by increasing fertilizer and pesticides. Considering that the location of the land, cultural customs, and other differences may impact FGPB, this paper also set up a regional dummy variable to fix the regional effect. The specific meaning and descriptive statistics of variables are shown in Table 2 and Table 3.
3.
Mediator variable. In this paper, the credit constraint of farmers was used as an intermediary variable which specifically referred to whether farmers did or did not obtain loans to engage in agricultural production and operation. It was divided into two situations. One was that they needed loans but had not applied, and the other was that they needed loans but were rejected.
4.
Moderator variable. The risk tolerance of farmers was used as a moderator variable. In an ordinary peasant household, the support ratio directly affects the family’s income and expenditure level and determines the size of the family’s economic risk. Therefore, in this paper, the household’s supporting ratio was used to represent the risk tolerance of farmers.

3. Results

For the purpose of this piece of research, STATA (version 16) was used to estimate the marginal productivity of fertilizer and pesticide, the impact of GSP on FGPB in agricultural land transfer, the mediating effect of credit constraints, and the moderating effect of farmers’ risk tolerance. The results are as follows:

3.1. Production Function Estimation

Since Equation (5) is non-linear, the non-linear least square method was used to estimate its parameters. The estimation results are shown in Table 4. The overall fitting degree of the model is good, and the analysis shows that fertilizer input is positively correlated with the total agricultural output value at the 1% significance level. When the fertilizer input increases by 1%, the total agricultural output value will increase by about 0.425%. Pesticide input was also positively correlated with agricultural output at the 1% significance level. Farmers’ mechanical, labor, and seed inputs are all significantly positively correlated with total agricultural output. From the perspective of farmers’ characteristics, there is a significant, positive correlation between educational level and agricultural output value, while the age of the rural household is negatively related to agricultural output value.
The values of parameters β and λ in the regression results of the production function were substituted into Equation (6) and Equation (7), respectively, to calculate the marginal productivity of each farmer’s fertilizer and pesticide and then to judge the farmers’ excessive application of fertilizer and pesticide behavior. The statistical results of farmers’ excessive fertilizer and pesticide application are shown in Table 5. According to the calculation, 241 households overused fertilizer, accounting for 18.99% of the total sample; there were 1061 households with excessive pesticide application, accounting for 83.61% of the total sample size. It can be seen that the excessive application of pesticides by farmers is common, and there is also a certain degree of excessive application of fertilizer.

3.2. Basic Estimation Result

In Table 6, the results show that under the condition of other conditions unchanged, the attribution of grain subsidies has a significant, positive impact on farmers’ excessive fertilizer application, i.e., the grain farmers who are provided with grain subsidies in farmland transfer tend to overuse fertilizer. Thus, hypothesis (H1a) is confirmed. The Chinese government allocates most of the grain subsidy funds to the owners of land contract rights, not the actual grain growers. Although this subsidy method may adversely affect farmers’ enthusiasm for growing grain, if the Chinese government is eager to control the amount of fertilizer input in agricultural production, maintaining the existing grain subsidy policy may be a good idea. On the other hand, the empirical results show no significant correlation between the attribution of grain subsidies and farmers’ excessive pesticide application behavior. That is, the grain subsidy has no effect on the pesticide application behavior of farmers, whether it is for the owner of the land contract rights or for the actual operator of the farmland. Thus, we reject the original hypothesis (H1b). This may be due to the polarization of farmers’ pesticide application behavior, the excessive application of pesticides by most farmers under the condition of marginal pesticide productivity approaching zero, and the fact that the promotion effect of GSP on the reduction in pesticide application behavior is not enough to make this section of farmers control the amount of pesticide application to within a reasonable range [32,37]. A few farmers have advanced agricultural production and operation experience and adopt scientific agricultural production modes which require that their agricultural input decision be scientifically justified. These farmers are pioneers in applying agricultural production and operation technology (or the agricultural production mode itself does not rely too much on the input of pesticides). Thus, their pesticide application amount is within a reasonable range, and the promotion effect of GSP on excessive pesticide application behavior is not obvious. The direct cause of the serious over-application of pesticides by farmers is the farmers’ concerns about the risk of possible yield reduction. Farmers may have the willingness to reduce pesticide application, but, due to their lack of knowledge of pesticide use, their motivation to reduce pesticide application is eventually restrained. Here, the Chinese government should pay more attention to the promotion of pesticide application technology and the establishment of agricultural information service platforms so as to solve the problem of excessive pesticide application from a deeper level [38].

3.3. Mediation Effect Analysis

The mediating effect test results are shown in Table 7. From the estimated results, the Regression 2 results show that GSP has a significant positive impact on farmers’ excessive fertilizer application behavior, i.e., the coefficient α1 of model (8) is significant, assuming that there is a mediating effect; Regression 1 shows that the effect of GSP on farmers’ credit constraints is not significant, i.e., the coefficient θ2 of model (10) is not significant. Next, the bootstrap method was used to test the significance of the coefficient product θ2α5. The results are shown in Table 8. The confidence interval of the indirect effect included 0, indicating that the indirect effect was not significant, and the analysis was stopped. The results show that GSP can affect farmers’ excessive fertilizer application, but the mediating effect of farmers’ credit constraints was not tested by the bootstrap test, indicating that there was no mediating effect of farmers’ credit constraints (there may be other mediating effects). Thus, we reject the original hypotheses (H2a) and (H2c). Regression 4 results show that the correlation between GSP and farmers’ excessive pesticide application behavior is not significant, i.e., the coefficient β1 of model (9) is not significant, assuming that farmers’ credit constraints show a masking effect. Follow-up tests showed that the coefficients θ2 and β5 of model (10) and model (12) were not significant, and the bootstrap method was used to test the significance of the coefficient product θ2β5. As shown in Table 8, the confidence interval of the indirect effect contains 0, indicating that the indirect effect is not significant and that there is no mediating effect on farmers’ credit constraints. Thus, the hypotheses (H2b) and (H2d) do not hold. The reason may be that the size of grain subsidy is too small to alleviate and stimulate farmers’ credit constraints, leading to the mediating impacts not being significant. The China Rural Statistical Yearbook showed that, in 2015, the cash cost of producing the three major staple grains in China was RMB 492.95/mu. Judging from the research samples in this paper, in China, each farmer can obtain agricultural subsidies of RMB 718.2 and manage 15.6 mu of the three major staple grains on average. The amount of agricultural subsidies received by farmers only accounts for 10.7% of the total cash production cost of the three staple grains. The amount is far less than the cost of growing grain. Once farmers are constrained by credit for growing grain, agricultural subsidies have a limited effect on alleviating farmers’ credit constraints.

3.4. Moderation Effect Analysis

In this paper, the hierarchical regression method was used to analyze the data [39]. The independent variables (GSP), moderating variables (farmers’ risk tolerance), and interaction term of the independent variables and moderating variables were put hierarchically. To reduce the problem of multicollinearity, the moderating variables were centralized when constructing the interaction term.
The regression results are shown in Table 9. In Regression 3, the coefficient of the interaction term of GSP and farmers’ risk tolerance is significantly negative (coefficient = −0.996, p < 0.05), indicating that farmers’ risk tolerance negatively moderates the impact of GSP on farmers’ excessive application of fertilizer; thus, hypothesis (H3a) is valid. In Regression 6, the coefficient of interaction term of GSP and farmers’ risk tolerance was not significant (coefficient = −0.036, p > 0.1), indicating that farmers’ risk tolerance had no moderating effect on the impact of GSP on farmers’ excessive pesticide application behavior, and the hypothesis (H3b) is not established. The reason may also be related to the polarization of farmers’ pesticide application behavior.

3.5. Heterogeneity Analysis

There are differences in the level of economic and social development, resource endowment conditions, social customs, and culture in different regions. Therefore, GSP may have inconsistent effects on FGPB in different regions [40,41]. According to the classification of the eastern, central, and western regions of China by CHFS, the samples were divided into three sub-samples: the eastern region, the central region, and the western region. The regression results are shown in Table 10. The results of group regression show that GSP has a significant positive impact on farmers’ excessive application of fertilizer in the eastern region, and the estimated coefficient is 0.656, which is significant at the 1% significance level. Compared with the total sample, GSP has a greater impact on farmers’ excessive fertilizer application behavior in the eastern region, but the moderating effect of farmers’ risk tolerance is not significant. GSP has no significant effect on farmers’ excessive fertilizer application behavior in the central and western regions and has no significant effect on farmers’ excessive pesticide application behavior in various regions. This may be because the eastern region has more opportunities for non-agricultural employment and a higher opportunity cost of labor. After receiving the subsidy, farmers tend to invest in more fertilizer instead of labor, thereby increasing overall income; on the other hand, the income level of farmers in the eastern region is relatively high. The variable characterizing the risk tolerance of farmers in this paper is the family support ratio. A higher income level may make up for the economic risks brought by the large proportion of family support and invalidate the moderating effect of farmers’ risk tolerance. Therefore, in the eastern region, GSP has a significant effect on farmers’ excessive fertilizer application, but the moderating effect of farmers’ risk tolerance is not significant. The reasons why GSP has no significant impact on farmers’ excessive application of pesticide in various regions may be similar to the previous analysis.

3.6. Robustness Test

To ensure the reliability of the Probit model regression results, the ordinary OLS model was used to replace the Probit model for the robustness test. The specific results are shown in Table 11. The results show that the coefficient direction and significance of the core variables of the re-regression results are consistent with the benchmark regression results. The GSP still has a significant positive impact on farmers’ excessive fertilizer application behavior but does not significantly affect farmers’ excessive pesticide application. In addition, farmers’ risk tolerance negatively moderates the impact of GSP on farmers’ excessive application of fertilizer but does not significantly moderate the impact on farmers’ excessive application of pesticides. Overall, the robustness of the benchmark regression conclusion is confirmed.

4. Conclusions

Agricultural green development is crucial to the survival of human beings. Whether the adjustment and optimization of grain subsidy policy can promote agricultural green development is a question that needs to be answered at both the theoretical and practical levels. Based on the theoretical analysis of the direct and indirect effects of grain subsidy policy on farmers’ green production behavior, this paper used CHFS micro-farmer survey data and used the C-D production function model, binary Probit model, mediating effect model, moderating effect model, and other measurement methods. This paper empirically tested the impact of grain subsidy policy on farmers’ green production behavior. Based on the analysis presented above, the following key messages can be drawn:
Firstly, in the transfer of farmland, if the actual operator of the farmland has a grain subsidy, it will promote excessive fertilizer application behavior. In addition, the size of the farmers’ risk tolerance will negatively regulate this effect. Secondly, if the actual operator of the farmland has a grain subsidy, it will not affect their excessive pesticide application behavior. Thirdly, grain subsidy policy does not affect farmers’ excessive fertilizer and pesticide application behavior through the credit constraints of farmers. Finally, grain subsidy policy has regional heterogeneity in farmers’ excessive fertilizer application behavior; that is, if the actual operator of the farmland has a grain subsidy, it will only promote excessive fertilizer application behavior in eastern China and has no obvious effect on farmers in central and western China.
In China, grain subsidies were initially distributed to the contractors of farmland. With the accelerated development of farmland circulation, to protect the interests of the actual grain growers, some regions have passed policy reforms and issued grain subsidies to the actual operators of farmland. However, from the environmental perspective, grain subsidies should continue to be distributed to the contractors of farmland, especially in eastern China, to reduce non-point source pollution caused by agricultural production. Starting from farmers’ risk tolerance, the government should improve farmers’ risk tolerance by increasing the amount of the grain subsidy, improving the social security system, and improving the policy-based agricultural insurance system. At the same time, the government should strengthen the publicity of farmers’ scientific application of fertilizer and pesticides to avoid farmers’ preventive investment in chemical and agricultural materials. From the perspective of traditional agricultural production, the contradiction between environmental protection and increased grain production is inevitable. However, bio-based fertilizers can not only ensure soil fertility but also promote the process of a circular economy. The application of bio-based fertilizers in agricultural production provides an opportunity to resolve this contradiction. However, the current bio-based fertilizer infrastructure technologies are not yet mature, and the development of these technologies requires government subsidies and interventions to advance.

Author Contributions

Conceptualization, S.P. and C.D.; methodology, S.P., H.Z. and C.D.; software, S.P. and C.D.; validation, S.P., A.A.C. and C.D.; formal analysis, S.P.; investigation, C.D.; resources, S.P. and C.D.; data curation, C.D.; writing—original draft preparation, S.P. and C.D.; writing—review and editing, A.A.C., G.R.S. and H.Z.; funding acquisition, S.P. and H.Z. All authors have read and agreed to the published version of the manuscript.

Funding

This research was funded by The National Natural Science Foundation of China Youth Program, grant number 71804196; and The National Social Science Fund of China, grant number 19CSH029.

Institutional Review Board Statement

Not applicable.

Informed Consent Statement

Not applicable.

Data Availability Statement

The data will be available on request.

Conflicts of Interest

The authors declare no conflict of interest.

References

  1. Liu, Y.; Sun, D.; Wang, H.; Wang, X.; Yu, G.; Zhao, X. An evaluation of China’s agricultural green production: 1978–2017. J. Clean. Prod. 2020, 243, 118483. [Google Scholar] [CrossRef]
  2. Pratt, A.N.; Yu, B.; Fan, S. The total factor productivity in China and India: New measures and approaches. China Agric. Econ. Rev. 2009, 1, 9–22. [Google Scholar] [CrossRef]
  3. Li, Y.; Fan, Z.; Jiang, G.; Quan, Z. Addressing the Differences in Farmers’ Willingness and Behavior Regarding Developing Green Agriculture-A Case Study in Xichuan County, China. Land 2021, 10, 316. [Google Scholar] [CrossRef]
  4. Ebenstein, A.Y.; Zhang, J.; Mcmillan, M.; Chen, K. Chemical Fertilizer and Migration in China; Social Science Electronic Publishing: Rochester, NY, USA, 2011. [Google Scholar]
  5. Lu, Y.; Jenkins, A.; Ferrier, R.C.; Bailey, M.; Gordon, I.J.; Song, S.; Huang, J.; Jia, S.; Zhang, F.; Liu, X. Addressing China’s grand challenge of achieving food security while ensuring environmental sustainability. Sci. Adv. 2015, 1, e1400039. [Google Scholar] [CrossRef] [Green Version]
  6. Wang, F.; Jiang, X.; Bian, Y.; Yao, F.; Gao, H.; Yu, G.; Munch, J.C.; Schroll, R. Organochlorine pesticides in soils under different land usage in the Taihu Lake region, China. J. Environ. Sci. 2007, 19, 584–590. [Google Scholar] [CrossRef]
  7. Xie, H.; Huang, Y. Influencing factors of farmers’ adoption of pro-environmental agricultural technologies in China: Meta-analysis. Land Use Policy 2021, 109, 105622. [Google Scholar] [CrossRef]
  8. Wang, H.; He, P.; Shen, C.; Wu, Z. Effect of irrigation amount and fertilization on agriculture non-point source pollution in the paddy field. Environ. Sci. Pollut. Res. 2019, 26, 10363–10373. [Google Scholar] [CrossRef]
  9. Chen, Y.-h.; Wen, X.-w.; Wang, B.; Nie, P.-y. Agricultural pollution and regulation: How to subsidize agriculture? J. Clean. Prod. 2017, 164, 258–264. [Google Scholar] [CrossRef]
  10. Pietola, K.; Lansink, A. Farmer response to policies promoting organic farming technologies in Finland. Eur. Rev. Agric. Econ. 2001, 28, 1–15. [Google Scholar] [CrossRef]
  11. Battaglin, W.A.; Goolsby, D.A. Spatial Data in Geographic Information System Format on Agricultural Chemical Use—Land Use, and Cropping Practices in the United States; U.S. Water-Resources Investigations Report 94–4176; U.S. Department of the Interior: Fairfax, VA, USA, 1995; p. 87. [CrossRef] [Green Version]
  12. Jin, S.; Deininger, K. Land rental markets in the process of rural structural transformation: Productivity and equity impacts from China. J. Comp. Econ. 2009, 37, 629–646. [Google Scholar] [CrossRef] [Green Version]
  13. Gao, J.; Song, G.; Sun, X. Does labor migration affect rural land transfer? Evidence from China. Land Use Policy 2020, 99, 105096. [Google Scholar] [CrossRef]
  14. Ju, X.; Gu, B.; Wu, Y.; Galloway, J.N. Reducing China’s fertilizer use by increasing farm size. Glob. Environ. Chang.-Hum. Policy Dimens. 2016, 41, 26–32. [Google Scholar] [CrossRef]
  15. Li, W.; Ou, Q.; Chen, Y. Decomposition of China’s CO2 emissions from agriculture utilizing an improved Kaya identity. Environ. Sci. Pollut. Res. 2014, 21, 13000–13006. [Google Scholar] [CrossRef]
  16. Elts, J.; Lõhmus, A. What do we lack in agri-environment schemes? The case of farmland birds in Estonia. Agric. Ecosyst. Environ. 2012, 156, 89–93. [Google Scholar] [CrossRef]
  17. Tong, R.; Wang, Y.; Zhu, Y.; Wang, Y. Does the certification of agriculture products promote the adoption of integrated pest management among apple growers in China? Environ. Sci. Pollut Res. Int. 2022, 29, 29808–29817. [Google Scholar] [CrossRef] [PubMed]
  18. Wu, H.; Ge, Y. Excessive Application of Fertilizer, Agricultural Non-Point Source Pollution, and Farmers’ Policy Choice. Sustainability 2019, 11, 1165. [Google Scholar] [CrossRef] [Green Version]
  19. Koppmair, S.; Kassie, M.; Qaim, M. The influence of farm input subsidies on the adoption of natural resource management technologies. Aust. J. Agric. Resour. Econ. 2017, 61, 539–556. [Google Scholar] [CrossRef]
  20. Paul, C.; Ball, V.; Felthoven, R.; Grube, A.; Nehring, R. Effective Costs and Chemical Use in United States Agricultural Production: Using the Environment as a “Free” Input. Am. J. Agric. Econ. 2002, 84, 902–915. [Google Scholar] [CrossRef]
  21. Repetto, R. Economic incentives for sustainable production. Ann. Reg. Sci. 1987, 21, 44–59. [Google Scholar] [CrossRef]
  22. Wu, Y.; Wang, E.; Miao, C. Fertilizer Use in China: The Role of Agricultural Support Policies. Sustainability 2019, 11, 4391. [Google Scholar] [CrossRef] [Green Version]
  23. Li, L. Research on the Reform of Cultivated Land Fertility Protection Subsidy in Shandong Province. Master’s Thesis, Shandong University, Jinan, China, 2020. [Google Scholar]
  24. Mao, H.; Cao, G. Subsidy policy and green ecological agricultural technology adoption behavior of farmers. China Popul. Resour. Environ. 2020, 30, 49–56. [Google Scholar]
  25. Liu, D.; Zhu, X.; Wang, Y. China’s agricultural green total factor productivity based on carbon emission: An analysis of evolution trend and influencing factors. J. Clean. Prod. 2021, 278, 123692. [Google Scholar] [CrossRef]
  26. Lin, B.; Raza, M.Y. Fuels substitution possibilities and the technical progress in Pakistan’s agriculture sector. J. Clean. Prod. 2021, 314, 128021. [Google Scholar] [CrossRef]
  27. Goodwin, B.K.; Mishra, A.K. Are “Decoupled” Farm Program Payments Really Decoupled? An Empirical Evaluation. Am. J. Agric. Econ. 2006, 88, 73–89. [Google Scholar] [CrossRef]
  28. Dercon, S.; Christiaensen, L. Consumption risk, technology adoption and poverty traps: Evidence from Ethiopia. J. Dev. Econ. 2011, 96, 159–173. [Google Scholar] [CrossRef] [Green Version]
  29. Yu, L.; Zhao, D.; Xue, Z.; Gao, Y. Research on the use of digital finance and the adoption of green control techniques by family farms in China. Technol. Soc. 2020, 62, 101323. [Google Scholar] [CrossRef]
  30. Lichtenberg, E.; Zilberman, D. The Econometrics of Damage Control: Why Specification Matters. Am. J. Agric. Econ. 1986, 68, 261–273. [Google Scholar] [CrossRef]
  31. Grovermann, C.; Schreinemachers, P.; Riwthong, S.; Berger, T. ‘Smart’ policies to reduce pesticide use and avoid income trade-offs: An agent-based model applied to Thai agriculture. Ecol. Econ. 2017, 132, 91–103. [Google Scholar] [CrossRef]
  32. Grovermann, C.; Schreinemachers, P.; Berger, T. Quantifying pesticide overuse from farmer and societal points of view: An application to Thailand. Crop Prot. 2013, 53, 161–168. [Google Scholar] [CrossRef]
  33. Lin, V.S.; Yang, Y.; Li, G. Where Can Tourism-Led Growth and Economy-Driven Tourism Growth Occur? J. Travel Res. 2019, 58, 760–773. [Google Scholar] [CrossRef]
  34. Wen, Z.; Ye, B. Analyses of Mediating Effects: The Development of Methods and Models. Adv. Psychol. Sci. 2014, 22, 731–745. (In Chinese) [Google Scholar] [CrossRef]
  35. Liu, T.; Wu, G. Does agricultural cooperative membership help reduce the overuse of chemical fertilizers and pesticides? Evidence from rural China. Environ. Sci. Pollut. Res. Int. 2022, 29, 7972–7983. [Google Scholar] [CrossRef] [PubMed]
  36. Khan, I.; Lei, H.D.; Shah, I.A.; Ali, I.; Khan, I.; Muhammad, I.; Huo, X.X.; Javed, T. Farm households’ risk perception, attitude and adaptation strategies in dealing with climate change: Promise and perils from rural Pakistan. Land Use Policy 2020, 91, 104395. [Google Scholar] [CrossRef]
  37. Schreinemachers, P.; Tipraqsa, P. Agricultural pesticides and land use intensification in high, middle and low income countries. Food Policy 2012, 37, 616–626. [Google Scholar] [CrossRef]
  38. Bakker, L.; Sok, J.; van der Werf, W.; Bianchi, F. Kicking the Habit: What Makes and Breaks Farmers’ Intentions to Reduce Pesticide Use? Ecol. Econ. 2021, 180, 106868. [Google Scholar] [CrossRef]
  39. Dubey, R.; Gunasekaran, A.; Ali, S.S. Exploring the relationship between leadership, operational practices, institutional pressures and environmental performance: A framework for green supply chain. Int. J. Prod. Econ. 2015, 160, 120–132. [Google Scholar] [CrossRef]
  40. Gao, Y.; Shu, Y.; Cao, H.; Zhou, S.; Shi, S. Fiscal Policy Dilemma in Resolving Agricultural Risks: Evidence from China’s Agricultural Insurance Subsidy Pilot. Int. J. Environ. Res. Public Health 2021, 18, 7577. [Google Scholar] [CrossRef]
  41. Zhang, Z.; Xu, H.; Shan, S.; Liu, Q.; Lu, Y. Whether the Agricultural Insurance Policy Achieves Green Income Growth-Evidence from the Implementation of China’s Total Cost Insurance Pilot Program. Int. J. Environ. Res. Public Health 2022, 19, 852. [Google Scholar] [CrossRef]
Figure 1. The Theoretical Framework.
Agriculture 12 01191 g001
Table 1. Basic Characteristics of Sample Farmers.
Variable NameCategoryNumber of FarmersProportion of Farmers (%)
Degree of HouseholderNo School907.09
Grade School48938.54
Junior High School54442.86
High School/Technical Secondary School13110.33
University/College or Above151.18
Householder Age (Years)(21–35)564.41
(35–50)49639.09
(50–65)56144.21
(65–85)15612.29
Family Size (Persons)(1–2)19415.29
(2–4)54743.1
(4–6)41032.31
(6–15)1189.3
Size of Family Labor Force (Persons)(0–2)67953.51
(2–4)53442.08
(4–8)564.41
Whether Grain Subsidy Belongs to the Actual Operator of Farmland or NotYes20316
No106684
Family Land Operation Area (Mu)(0–2)16212.76
(2–4)30423.95
(4–6)21216.71
(6–8)1219.54
(8–10)1048.20
(10–70)36628.84
Income from Grain and Cash Crops (× RMB 10,000)(0.02–1)66752.56
(1–3)33926.72
(3–15)26320.72
Note: RMB = Renminbi.
Table 2. Variable Classification and Descriptive Statistics of Production Function Model.
VariableVariableObservationsMeanSt. Dev.Min.Max.
Gross Agricultural Output(RMB), Taking Logarithm27368.9541.215.85811.885
Fertilizer Input(RMB), Taking Logarithm27367.2041.1284.6059.903
Pesticide Input(RMB)2736687.5621177.986208000
Seed Input(RMB), Taking Logarithm27366.2591.1593.6899.21
Mechanical Inputs(RMB), Taking Logarithm27366.7911.2863.4019.999
Labor InputNumber of Households, Agricultural Production and Operation
(Person), Taking Logarithm
27360.6140.39602.303
Degree of HouseholderNo School = 1, Grade School = 2, Junior High School = 3, High School = 4, Technical Secondary School/College = 527362.670.86615
Age of Householder(Year), Taking Logarithm27363.9520.2162.894.489
Cultivated Land QualityVery Good = 1, Good = 2, General = 3, Poor = 4, Very Poor = 527362.610.95915
Cultivated Land TypeWater = 1, Irrigated = 2, Dryland = 327362.1450.83613
Table 3. Specific Meanings of Variables and Descriptive Statistics.
CategoryVariableVariable and CodingMeanSt. Dev.
Dependent Variables
Farmers’ Green Production BehaviorExcessive application of fertilizer:
Yes = 1, No = 0
0.190.39
Excessive application of pesticide:
Yes = 1, No = 0
0.840.37
Focus Variable
Attribution of Grain SubsidyWhether the grain subsidy is owned by the actual operator of farmland in farmland transfer: Yes = 1, No = 00.160.37
Mediator Variable
Credit ConstraintWhether farmers receive loans for farming: Yes = 0, No = 10.120.32
Moderator Variable
Farmers’ Risk ToleranceSupply ratio of farmer household: Number of supporters/Total size of family0.340.24
Control Variable
Householder CharacteristicsAge of Householder(year), Taking Logarithm3.950.21
Gender of HouseholderMale = 1, Female = 00.920.27
Degree of HouseholderNo School = 1, Grade School = 2, Junior High School = 3, High School/Technical Secondary School = 4, University/College or Above = 52.600.81
The Characteristics of Farmer Household and Production and OperationConsumption of Agricultural Products Produced by OneselfYes = 1, No = 00.890.31
Ordinary FarmerYes = 1, No = 00.960.18
Operating Area of Land(Acre), Taking Logarithm1.871.00
Farming IncomeTotal output value of grain and cash crops (RMB), Taking Logarithm9.171.39
Whether Own Farm MachineryYes = 1, No = 00.540.50
Land SituationCultivated Land QualityVery Poor = 1, Poor = 2, General = 3, Good = 4, Very Good = 52.610.97
Whether Farmland Has Irrigation FacilitiesYes = 1, No = 00.240.43
Whether Cultivated Land Has Power Supply FacilitiesYes = 1, No = 00.420.49
RegionEastern RegionYes = 1, No = 00.200.40
Central RegionYes = 1, No = 00.450.50
Western RegionYes = 1, No = 00.350.48
Note: The number of observations = 1269.
Table 4. Regression results of a production function.
Independent VariableDependent Variable: Gross Agricultural Output
(Taking Logarithm)
CoefficientStd. Err.t Ratio
Intercept Term5.400 ***0.394−13.713
Fertilizer Input0.425 ***0.022−18.883
Pesticide Input0.088 ***0.027−3.304
Seed Input0.223 ***0.022−10.292
Mechanical Inputs0.100 ***0.017−5.934
Labor Input0.081 *0.044−1.816
Degree of Householder0.053 **0.021−2.529
Age of Householder−0.338 ***0.084−4.010
Cultivated Land Quality−0.122 ***0.018−6.640
Cultivated Land Type−0.051 **0.021−2.382
R20.442
Observed Value2736
Note: * p < 0.1, ** p < 0.05, *** p < 0.01; Std. Err. = Standard Error.
Table 5. Statistics of Overuse of Fertilizer and Pesticide among Sample Farmers.
Farmers’ BehaviorNumber of HouseholdsProportion/%
No Excessive Application of
Fertilizer
102881.01
Excessive Application of Fertilizer24118.99
Total1269100
No Excessive Application of
Pesticide
20816.39
Excessive Application of Pesticide106183.61
Total1269100
Table 6. Results of the impact of the grain subsidy policy on farmers’ green production behavior.
Variable NameR1R2R3R4R5R6
Dependent Variable: Excessive Application of FertilizerDependent Variable: Excessive Application of Pesticide
Attribution of Grain Subsidy0.213 **0.305 **0.278 **−0.063−0.046−0.060
(0.106)(0.121)(0.123)(0.113)(0.117)(0.118)
Age of Householder −0.569 **−0.595 *** −0.256−0.268
(0.228)(0.229) (0.221)(0.221)
Gender
of Householder
−0.103−0.104 0.277 *0.278 *
(0.158)(0.159) (0.148)(0.149)
Degree
of Householder
−0.119 **−0.128 ** −0.085−0.090
(0.061)(0.061) (0.056)(0.056)
Consumption of Agricultural Products Produced by Oneself −0.215−0.193 0.516 ***0.535 ***
(0.154)(0.154) (0.127)(0.128)
Ordinary Farmer 0.0540.024 −0.161−0.100
(0.299)(0.300) (0.503)(0.252)
Farming Income −0.717 ***−0.726 *** 0.086 **0.081 **
(0.049)(0.050) (0.038)(0.038)
Operating Area of Land 0.312 ***0.312 *** 0.0740.075
(0.057)(0.057) (0.051)(0.051)
Whether Own Farm Machinery 0.472 ***0.492 *** 0.1440.159 *
(0.101)(0.102) (0.093)(0.094)
Cultivated Land Quality 0.002−0.000 0.0140.013
(0.049)(0.049) (0.045)(0.045)
Whether Farmland Has Irrigation
Facilities
0.0790.057 0.0310.012
(0.128)(0.129) (0.122)(0.123)
Whether Cultivated Land Has Power
Supply Facilities
0.0390.021 0.297 ***0.287 ***
(0.113)(0.113) (0.106)(0.107)
Area Dummy Variable −0.111 * −0.078
(0.064) (0.061)
Constant Term−0.915 ***7.290 ***7.756 ***0.989 ***0.4570.745
(0.045)(1.149)(1.184)(0.046)(1.064)(1.088)
Observed Value126912691269126912691269
LR Chi23.96 **305.30 ***308.28 ***0.3155.90 ***57.56 ***
Pseudo R20.0030.2480.250-0.0490.051
Notes: * p < 0.1, ** p < 0.05, *** p < 0.01; the numbers in brackets are standard deviations; the model passed the multiple collinearity test; R1~R6 are regression models 1~6 respectively; LR Chi2 is the chi-square value of the likelihood ratio test. It should be noted that, due to space constraints, the regression results of the gradual addition of control variables such as householder characteristics, family, production, and operation characteristics, and land situation are not reported here.
Table 7. Mediating Effect of Credit Constraints on the Impact of grain subsidy policy on farmers’ green production behavior.
Variable NameR1R2R3R4R5
Credit
Constraint
Excessive Application of
Fertilizer
Excessive Application of
Pesticide
Attribution of Grain Subsidy0.0780.278 **0.269 **−0.060−0.061
(0.130)(0.123)(0.123)(0.118)(0.118)
Credit Constraints 0.369 *** 0.096
(0.141) (0.143)
Constant Term0.8147.756 ***7.553 ***0.7450.690
(1.164)(1.184)(1.191)(1.088)(1.091)
Observed Value12691269126912691269
LR Chi235.83 ***308.28 ***314.96 ***57.56 ***58.02 ***
Pseudo R20.0390.2500.2550.0510.051
Note: ** p < 0.05, *** p < 0.01; R1~R5 are regression models 1~5 respectively; LR Chi2 is the chi-square value of the likelihood ratio test.
Table 8. Bootstrap test results of mediating effect.
EffectEstimated
Coefficient
St. Dev.95% Conf. IntervalSignificance
Excessive Application of FertilizerGross Effect0.27835220.1250680.03322330.523481Yes
Indirect Effect0.001273960.00213914−0.00217910.0064123No
Direct Effect0.060495720.028034440.00658340.1150742Yes
Excessive Application of PesticideGross Effect−0.0604470.1185189−0.29273970.1718458No
Indirect Effect0.000354880.00106708−0.00140980.0030688No
Direct Effect−0.01686610.0284569−0.07329590.0366488No
Table 9. The moderating effect of farmers’ risk tolerance on the impact of grain subsidy policy on farmers’ green production behavior.
Variable NameR1R2R3R4R5R6
Dependent Variable: Excessive Application of FertilizerDependent Variable: Excessive Application of Pesticide
Attribution of Grain Subsidy0.278 **0.279 **0.270 **−0.060−0.061−0.061
(0.123)(0.122)(0.124)(0.118)(0.118)(0.118)
Farmers’ Risk Tolerance 0.1680.374 * 0.1430.150
(0.195)(0.219) (0.182)(0.202)
Interaction Term −0.996 ** −0.036
(0.478) (0.459)
Constant Term7.756 ***7.580 ***7.475 ***0.7450.6010.596
(1.184)(1.200)(1.202)(1.088)(1.104)(1.106)
Observed Value126912691269126912691269
LR Chi2308.28 ***309.02 ***313.42 ***57.56 ***58.17 ***58.18 ***
Pseudo R20.2500.2500.2540.0510.0510.051
Note: * p < 0.1, ** p < 0.05, *** p < 0.01; R1~R6 are regression models 1~6 respectively; LR Chi2 is the chi-square value of the likelihood ratio test.
Table 10. Sample grouping regression estimation results based on different regions.
Variable NameDependent Variable: Excessive Application of FertilizerDependent Variable: Excessive Application of Pesticide
Eastern Region
R1R2R3R4R5R6
Attribution of Grain Subsidy0.656 ***0.690 ***0.614 ***−0.160−0.146−0.158
(0.218)(0.221)(0.232)(0.228)(0.229)(0.238)
Farmers’ Risk Tolerance 0.4430.804 0.2750.324
(0.436)(0.527) (0.432)(0.498)
Interaction Term −1.147 −0.190
(0.923) (0.967)
Observed Value255255255255255255
LR Chi269.18 ***70.21 ***71.79 ***34.71 ***35.12 ***35.16 ***
Pseudo R20.2510.2550.2600.1390.1410.141
Central Region
R7R8R9R10R11R12
Attribution of Grain Subsidy0.0490.0570.062−0.041−0.041−0.030
(0.239)(0.240)(0.240)(0.214)(0.214)(0.216)
Farmers’ Risk Tolerance −0.264−0.215 −0.0050.117
(0.325)(0.354) (0.317)(0.349)
Interaction Term −0.313 −0.695
(0.895) (0.839)
Observed Value567567567567567567
LR Chi2149.23 ***149.89 ***150.02 ***38.61 ***38.61 ***39.30 ***
Pseudo R20.3110.3130.3130.0950.0950.096
Western Region
R13R14R15R16R17R18
Attribution of Grain Subsidy0.0820.0420.111−0.059−0.071−0.099
(0.224)(0.225)(0.230)(0.200)(0.201)(0.204)
Farmers’ Risk Tolerance 0.647 **0.800 ** 0.2260.118
(0.320)(0.349) (0.282)(0.306)
Interaction Term −1.001 0.715
(0.882) (0.782)
Observed Value447447447447447447
LR Chi2114.29 ***118.42 ***119.71 ***13.9914.6315.47
Pseudo R20.2440.2530.2560.0310.0320.034
Note: ** p < 0.05, *** p < 0.01; R1~R18 are regression models 1~18 respectively; LR Chi2 is the chi-square value of the likelihood ratio test.
Table 11. Re-estimation results of ordinary OLS regression model.
Variable NameR1R2R3R4R5R6
Dependent Variable: Excessive Application of FertilizerDependent Variable: Excessive Application of Pesticide
Attribution of Grain Subsidy0.062 **0.062 **0.060 **−0.017−0.016−0.016
(0.027)(0.027)(0.027)(0.028)(0.028)(0.028)
Farmers’ Risk Tolerance 0.0300.074 0.0360.036
(0.042)(0.046) (0.044)(0.049)
Interaction Term −0.236 ** −0.001
(0.107) (0.112)
Constant Term2.215 ***2.178 ***2.140 ***0.742 ***0.698 ***0.698 ***
(0.250)(0.255)(0.256)(0.262)(0.267)(0.268)
Observed Value126912691269126912691269
F27.72 ***25.76 ***24.44 ***4.55 ***4.27 ***3.98 ***
Adj R20.2150.2150.2170.0350.0350.034
Note: ** p < 0.05, *** p < 0.01; R1~R6 are regression models 1~6 respectively; F is the joint hypothesis test value; Adj R2 is the adjusted R-square value.
Publisher’s Note: MDPI stays neutral with regard to jurisdictional claims in published maps and institutional affiliations.

