1. Introduction
With the continual advancement of agricultural mechanization, there is an escalating demand for the operational quality and dependability of agricultural harvesting equipment. As the pivotal agricultural machinery essential for agricultural modernization, the combine harvester can complete the harvest, threshing, cleaning, and collection of crops in a singular operation, thereby effectively reducing labor costs and enhancing agricultural labor productivity. The cleaning sieve serves as a pivotal core component within the combine harvester and carries out the vital task of material cleaning. Its durability profoundly impacts the reliability of the entire machine [
1]. The cleaning sieve has a considerable weight and intricate structure and engages in reciprocating motion during operation. Each individual part is exposed to prolonged and intricate alternate load effects, rendering it susceptible to issues such as rubber bearing abrasion, the fracture of the bearing seat, and weld failure in the column [
2]. In current investigations of cleaning sieves, both domestic and international scholars primarily concentrate on performance indicators such as the loss rate and operational efficiency. However, the durability of the sieve remains inadequately addressed. Existing cleaning sieves have not undergone comprehensive quality reliability testing during the developmental phase and have instead relied solely on field trials of prototype machines for enhancement; thus, they remain reliant on empirical knowledge [
3]. To achieve the objectives of the high yield, high efficiency, and stability of combine harvesters, it is imperative to carry out experimental research on the durability of cleaning sieves [
4,
5].
Via the analysis of various vibrating sieves in the industrial domain, numerous scholars have identified deficiencies in the structural design and manufacturing processes and have subsequently made optimizations. For instance, Jacques constructed a simulation model for the vibrating sieve commonly employed in the mining industry, and a modal analysis revealed the influence of the girder on its fatigue life [
6]. Peng et al. observed that increased oscillation amplifies the risk of structural damage during the operation of a large-scale coal sieve subject to vibration. Accordingly, they proposed suggestions for enhancing the structural design via mechanical analysis [
7]. Wang et al. examined the vibrating sieve typically deployed for coal particle size classification and investigated the impact force on the sieve surface. They obtained the fundamental vibration characteristics via finite element simulation and optimized the arrangement of the support beam [
8]. Li et al. investigated the vibrating dewatering sieve for building sand and gravel, and ultimately determined the optimal combination of parameters by modifying factors like the amplitude and slope angle of the sieve surface [
9].
The cleaning sieve serves as a pivotal core component within the combine harvester and carries out the vital task of grains cleaning. The cleaning capacity of a cleaning sieve significantly impacts the machine’s overall performance. As the feeding capacity of the combine harvester increases, the workload on the cleaning device also rises, necessitating heightened performance standards for the cleaning mechanism, while emphasizing the importance of system structure durability and service life. Within the realm of combine harvesters, extensive research both domestically and internationally has been conducted in relation to the optimization of the cleaning sieve. Wang et al. employed the response surface method to analyze the impacts of various factors such as the frequency, amplitude, and installation dip angle of the vibrating sieve on the content of impurities and the loss rate, after which they optimized these influencing factors [
10]. Li et al. utilized the classical transfer path analysis method to analyze the vibration signal in both the time and frequency domains. By verifying the clearance of the drive shaft key, they were able to pinpoint the position of a manufacturing defect in the cleaning sieve based on the amplitude of the abnormal excitation force [
11]. Feng et al. developed a model that considers the trajectory of particles passing through sieve pores after impact by leveraging the mass center of the grain particle. By controlling the impact point position, they successfully improved the rate of passage through sieve pores, consequently enhancing the cleaning efficiency [
12]. Pang J. et al. addressed the vibration issue caused by the imbalance of the rotor system during the operation of the grain cleaning screen. They conducted feature extraction and analysis of the signal using a comprehensive index based on variational mode decomposition, fuzzy entropy, and kurtosis. The imbalance vibration of the system was extracted, and an optimization function was constructed with the mass and installation position of the balance block as optimization variables to optimize the drive mechanism [
13].
Despite the significant research conducted on the simulation of various vibrating sieves in the industrial sector, in the realm of combine harvesters, attention has predominantly been focused on optimizing cleaning performance to enhance the efficiency and reduce the loss rate. To date, there have been limited investigations into the quality, reliability, and durability of the cleaning sieve in combine harvesters, with most studies solely employing vibration signals to assess the fatigue of individual components within the sieve. A dedicated durability test bench and methodology are lacking, necessitating the further exploration of both the durability testing of the cleaning sieve and the comprehensive analysis of multisensory signals.
When delving into dynamic inquiries, it is customary to establish equations encompassing displacement, velocity, and acceleration over time. Given that acceleration exhibits heightened sensitivity in the high-frequency realm [
14], vibration signals commonly serve as the preferred choice for fault diagnosis during practical measurements. However, according to the dynamic equation model, synchronous and reliable monitoring of displacement, velocity, and acceleration enables more accurate assessment of structural failures. Nevertheless, within real systems, the simultaneous measurement of these parameters through multiple sensors, particularly the acquisition of displacement signals, presents considerable challenges. Displacement can be indirectly determined by examining strain signals, which are more sensitive than vibration signals in the low-frequency range [
15]. Therefore, joint analysis is viable. Zhang et al. introduce a methodology for detecting tooth faults in planetary gearboxes by analyzing the strain signals from the tooth root of the ring gear. The time domain of the measured strain signals clearly exhibits the theoretical fault characteristics [
16]. Yoon, J et al. propose a novel approach that employs a solitary piezoelectric strain sensor to diagnose faults in planetary gearboxes. By conducting an analysis of the strain signals, the planetary gearbox faults can be accurately diagnosed [
17].
This research centers on the cleaning sieve of a crawler combine harvester, which boasts significant market representation. The overall stress imposed on the cleaning sieve is first appraised by finite element analysis, and a specially designed and constructed durability test bench facilitates the experimental phase. Based on the simulation results, both acceleration and strain gauge sensors are arranged, thus facilitating durability testing. With the aid of multi-sensor signal analysis, the fault characteristics of the cleaning sieve are scrutinized. The combined utilization of vibration and strain signals enables the comprehensive testing and analysis of the cleaning sieve, thereby offering guidance for sensor arrangement and fault signal diagnosis in combine harvesters.
2. Materials and Methods
2.1. Structural Composition
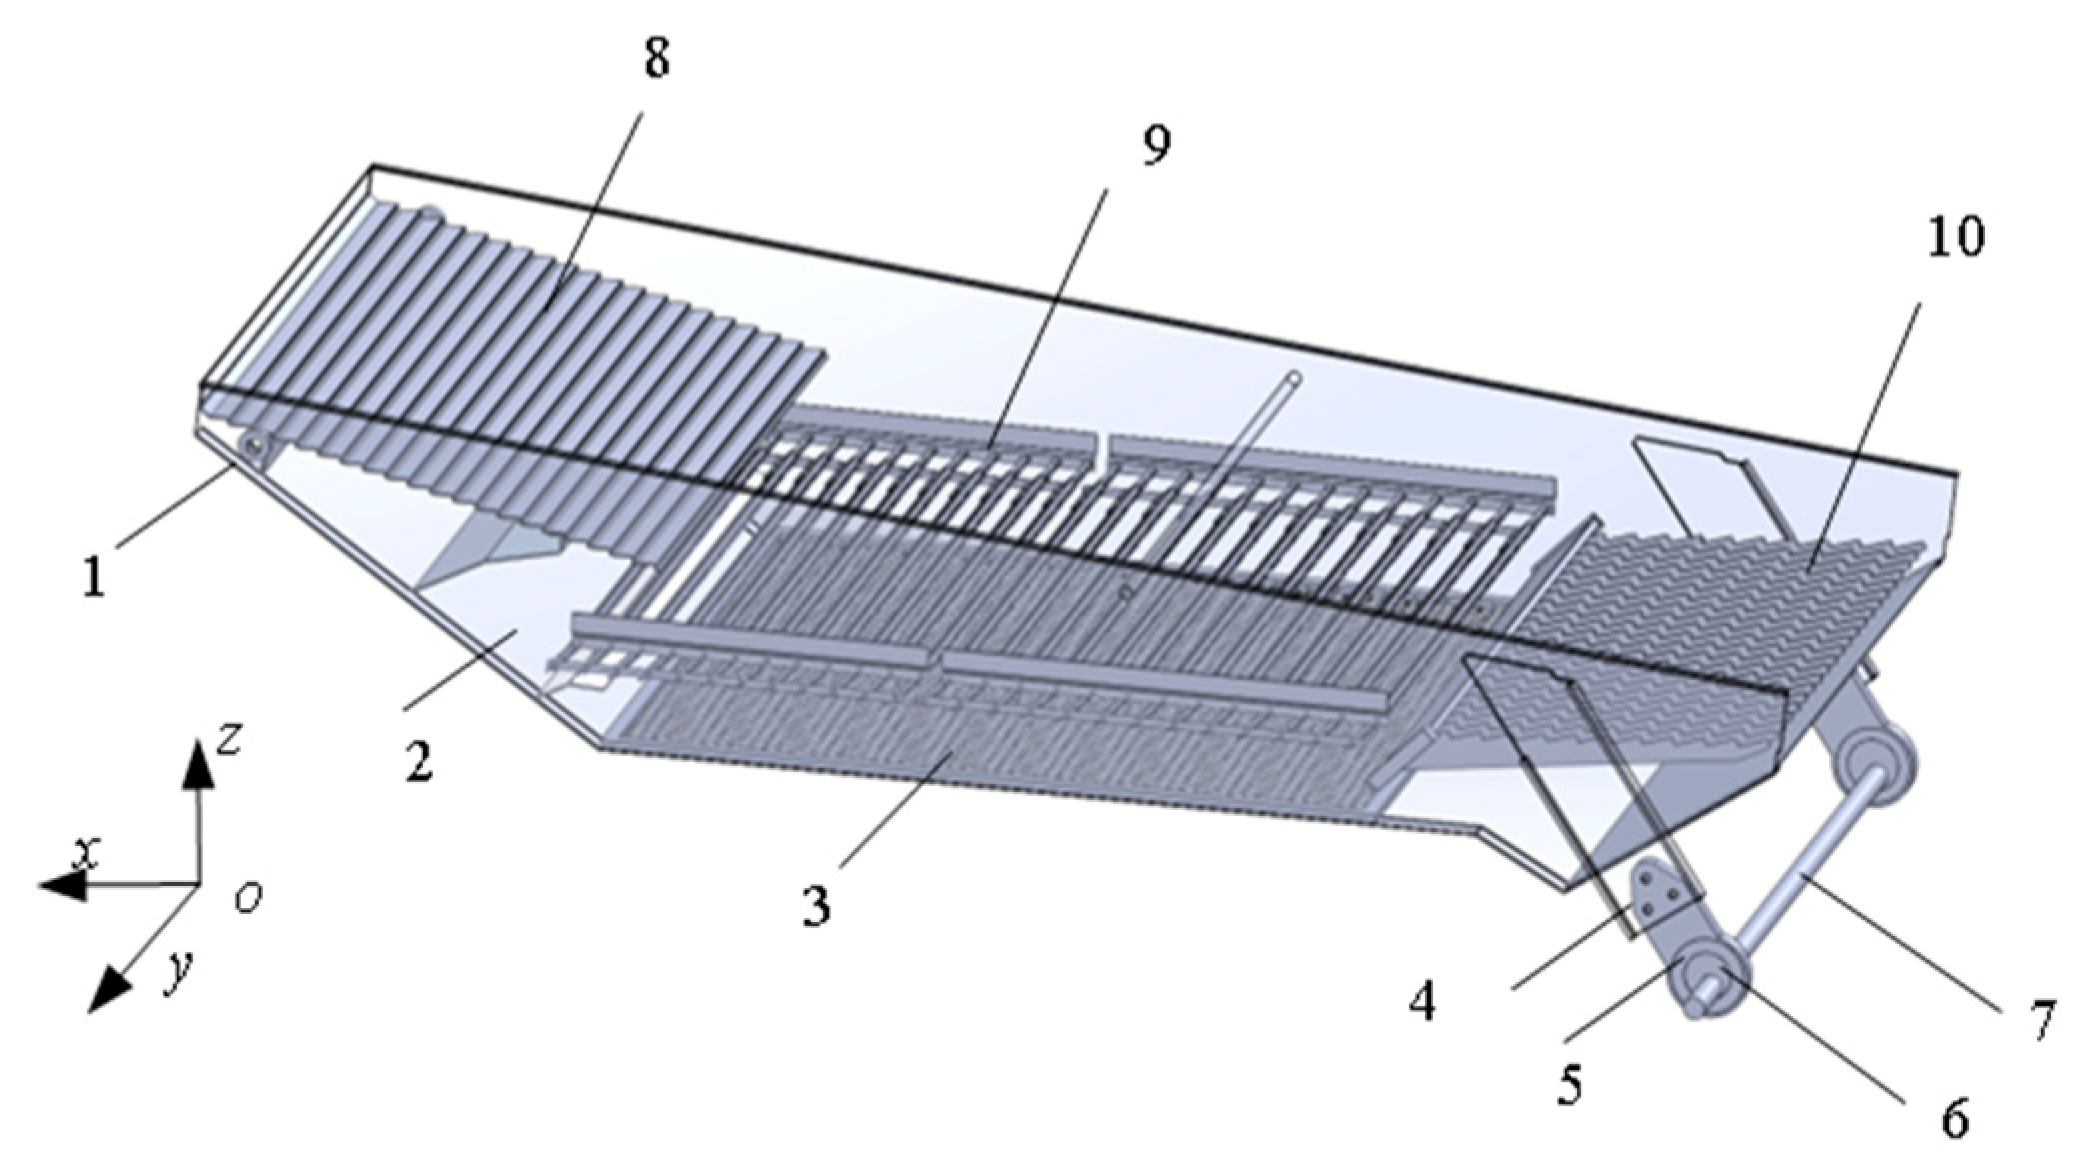
This paper focuses on the cleaning sieve of a prominent crawler combine harvester in China, which serves as the research subject. The structure of the cleaning sieve is depicted in
Figure 1, and encompasses the drive shaft, cleaning sieve frame, shaking plate, top sieve, mesh sieve, and rear sieve [
18,
19]. The eccentric wheel is set in motion by the rotational force of the drive shaft, causing the reciprocal movement of the front-end bearing within the chute. This motion is governed by the revolute pair and the notch, while the bearing seat, bearing, eccentric wheel, and drive shaft are interconnected through the revolute pair [
20,
21]. The vibration source of the cleaning sieve is driven by the motor to generate the amplitude of the crank slider mechanism (eccentric), and the vibration frequency typically ranges from 4–5 Hz during practical field operations. In contrast to the studies on impurity rate and loss rate, which primarily concentrate on configuring parameters like the sieve’s inclination angle, the pivotal parameter in the durability testing of the sieve is its vibration frequency [
22]. Therefore, in accordance with the normal operating parameters of the cleaning sieve, the vibration frequency is designated as 5 Hz, equating to a driving shaft speed of 31.4 rad/s.
2.2. Modal Analysis
The modal analysis method is widely used in the calculation of the vibration characteristics of structural systems, which are mainly used for the calculation of the dynamic performance of structural systems [
23]. The main purpose of this section is to use modal analysis to calculate the natural frequency and vibration mode of the cleaning sieve, so as to reflect the overall stress situation of the sieve and determine the points that are more sensitive to strain signals. This provides a basis for the arrangement of sensors in subsequent bench tests.
2.2.1. Finite Element Model
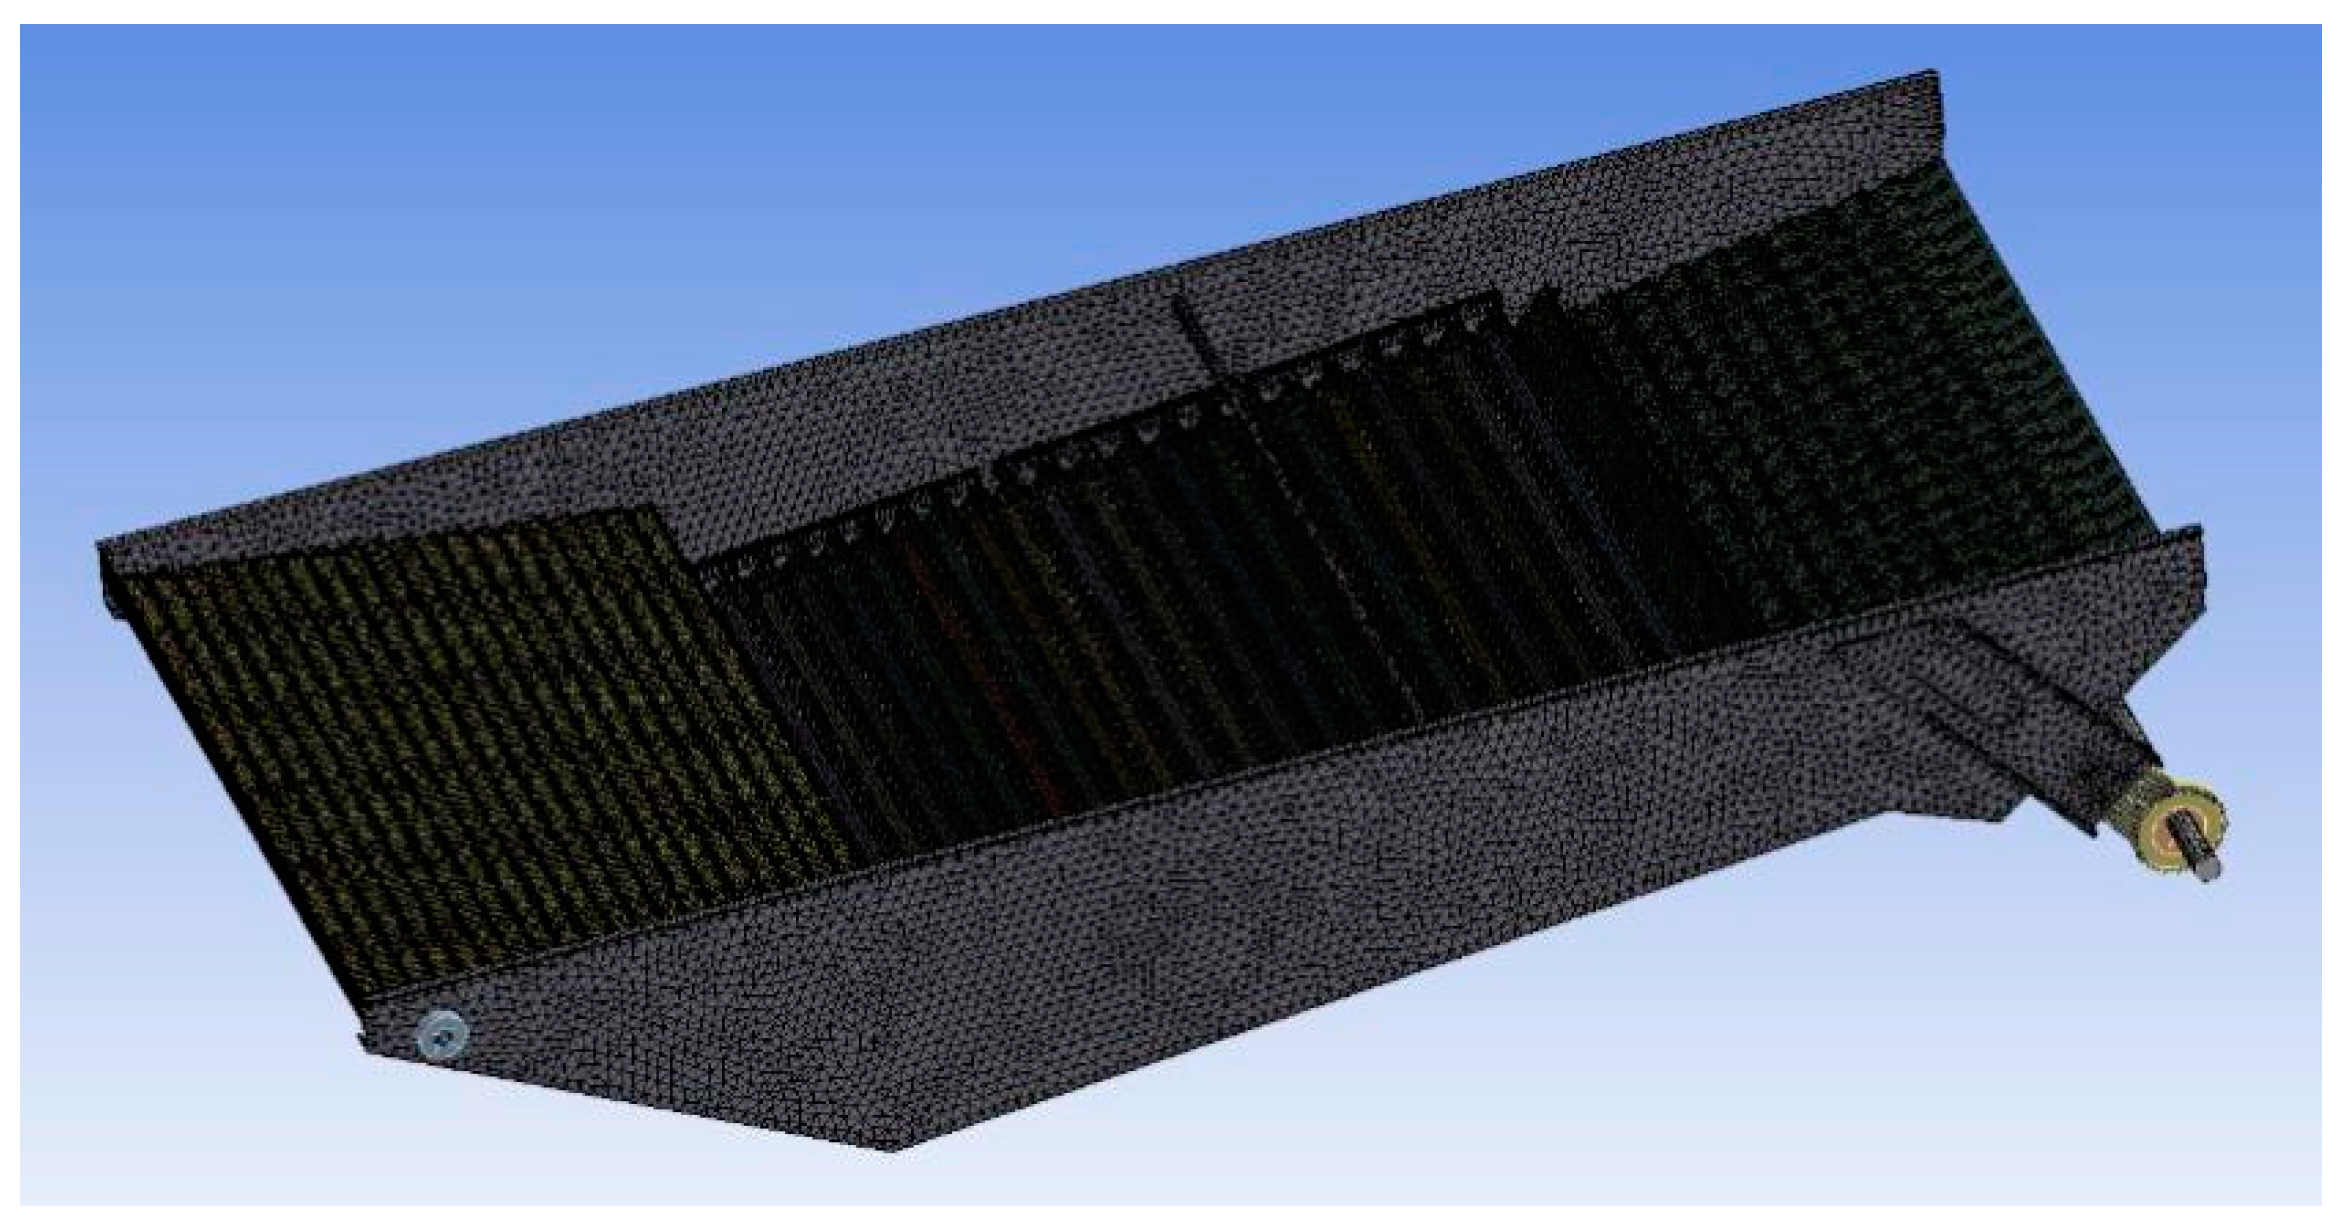
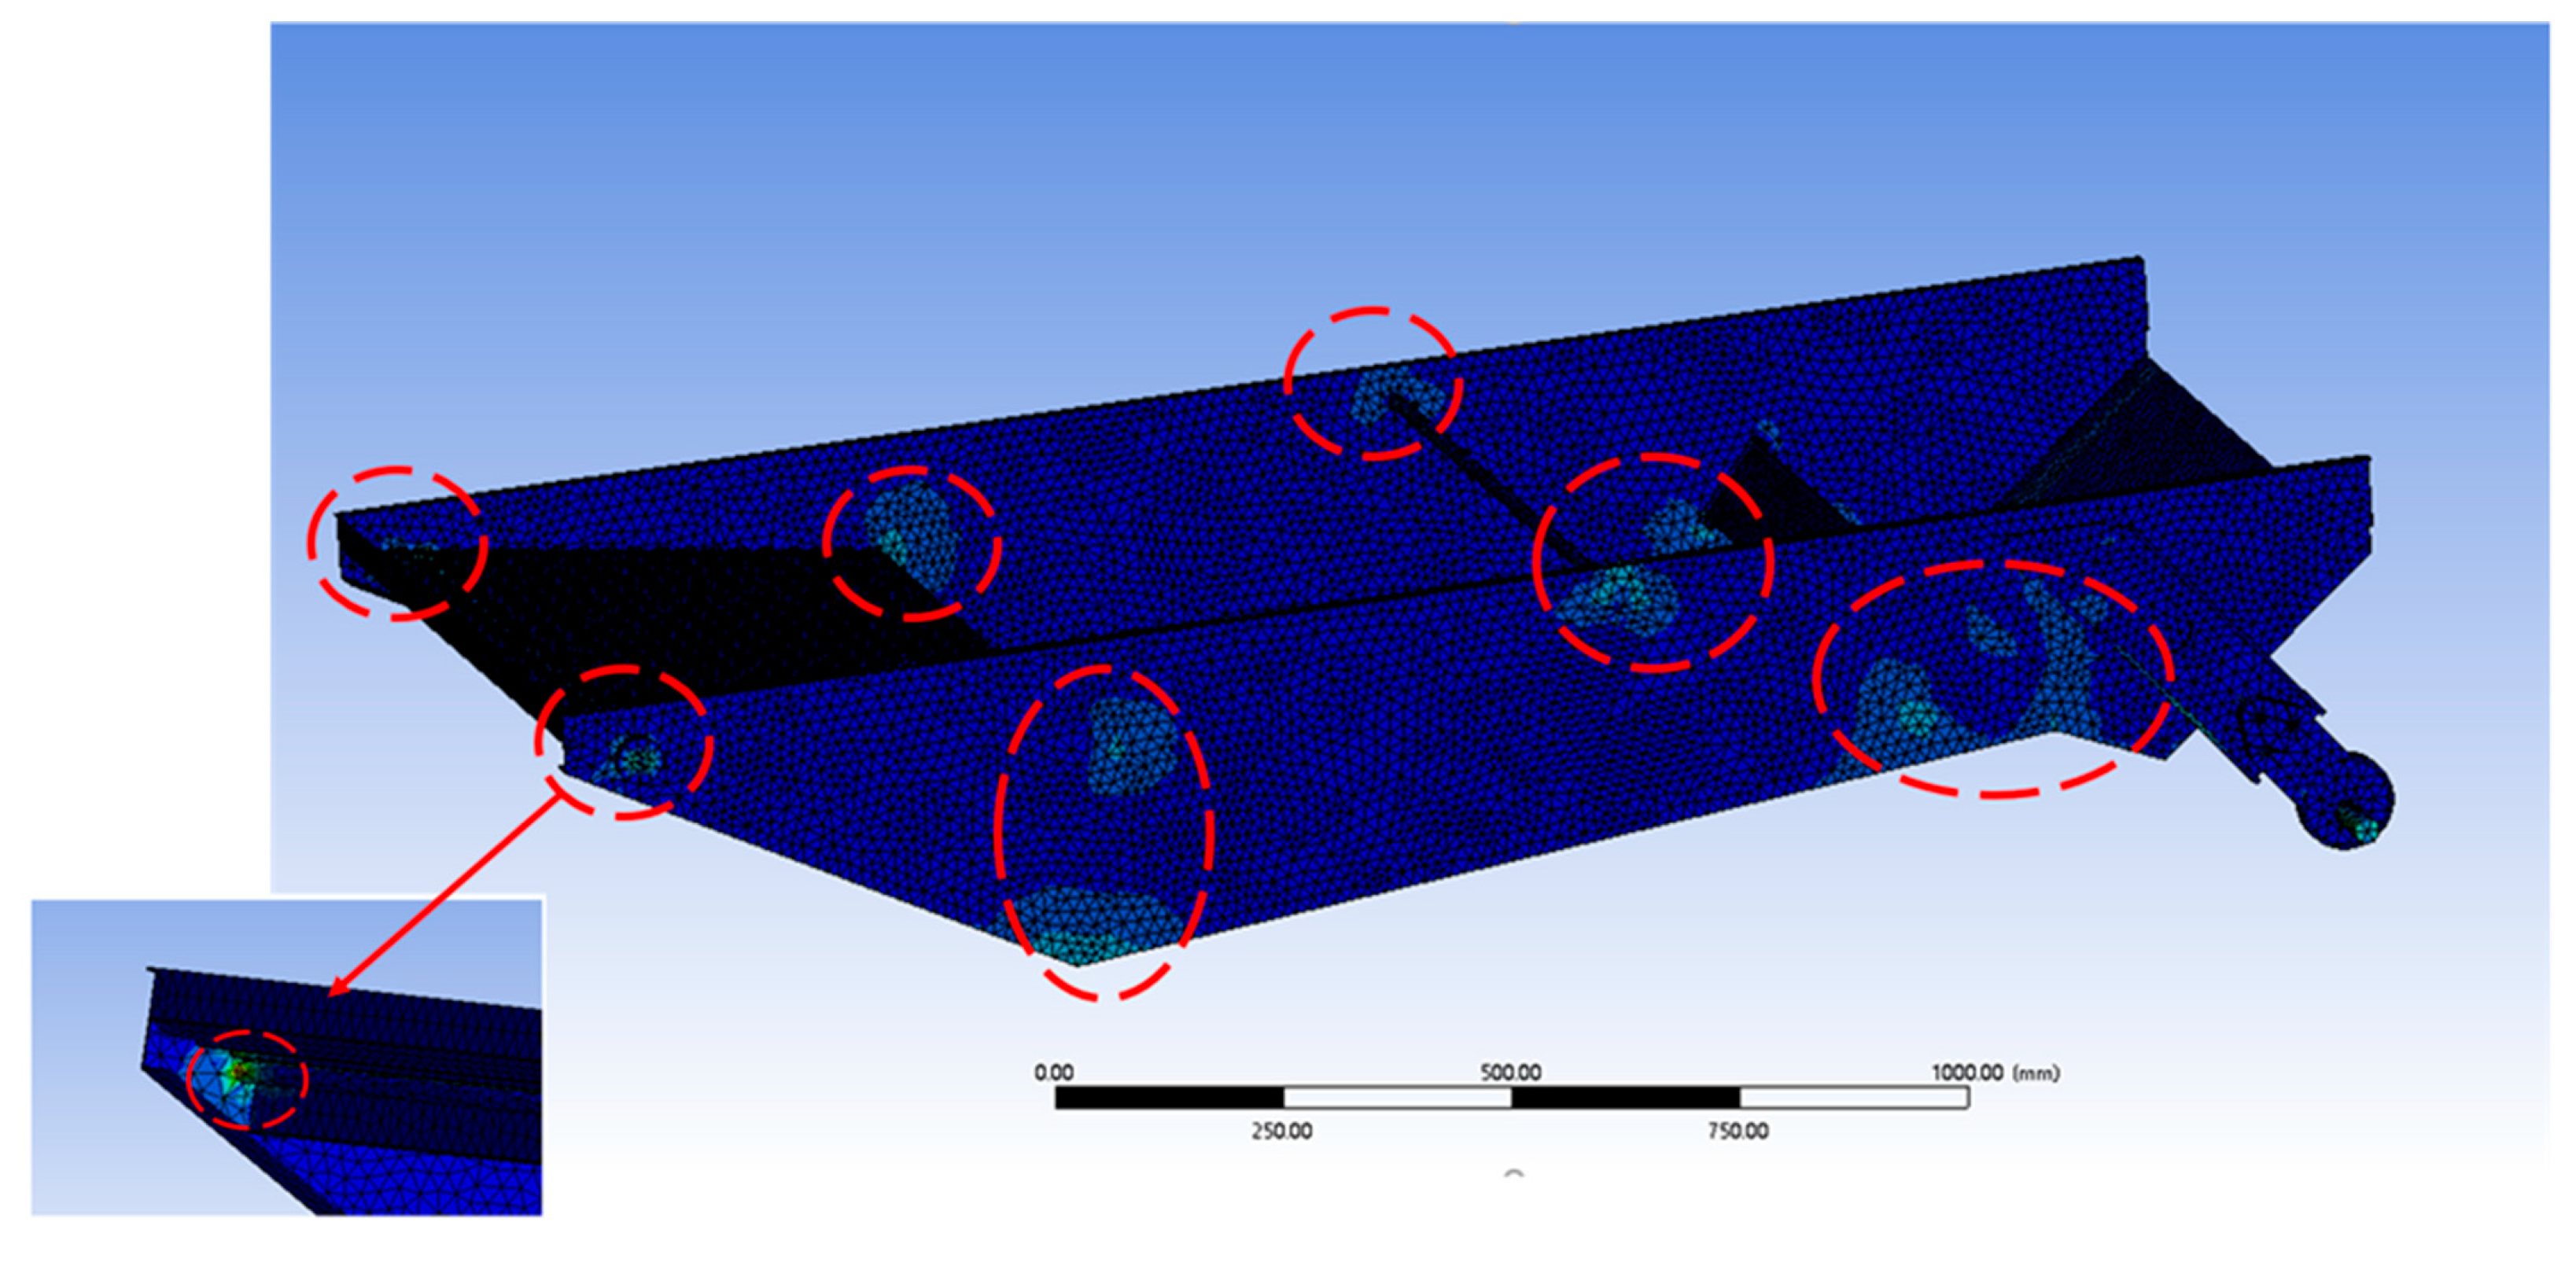
SolidWorks2020 software was utilized to establish an accurate and comprehensive 1:1 three-dimensional model of the cleaning sieve based on the physical object. Subsequently, the established model was imported into ANSYS2021 Workbench for further analysis. Considering the occurrence of nonlinear deformation or local stress concentration, and the requirement for contact on both sides of most components in the screen box model, solid elements are used for mesh division. In order to improve computational accuracy and accelerate convergence, hexahedral elements are primarily used for mesh division, supplemented by tetrahedral elements. Due to the thin frame of the sieve, tetrahedral units are predominantly utilized in this part. By referencing
Table 1, the mesh size of the cleaning sieve model was precisely set to 8 mm. To enhance the analytical capabilities and optimize the mesh quality, corner encryption processing (with a mesh size of 1–2 mm) was applied to both the top sieve and the rear sieve, thus effectively eliminating undesired small features and yielding a superior mesh structure. The resulting mesh consisted of a total of 704,846 units and 1,577,310 nodes, with a unit mass of 0.62. The overall mesh quality was excellent, and the outcomes are showcased in
Figure 2.
2.2.2. Modal Analysis Results and Discussion
Due to the complex structure and numerous components of the cleaning sieve, it is difficult to calculate all its natural frequencies and vibration modes. With the increase of the order of natural frequencies and vibration modes, their influences on the overall dynamic characteristics decrease [
24]. In the modal analysis in this section, the first 10 modes of the cleaning sieve are mainly studied, and the calculation results are reported in
Table 2.
During normal operation, the frequency of the cleaning sieve is 5–6 Hz. The modal analysis results show that at the first 10 natural frequencies in the range of 14.542–41.797 Hz, the driving speed of the fundamental frequency will not resonate with the cleaning sieve. However, it is necessary to consider the effect of resonance when analyzing the signal collected during the cleaning sieve bench test.
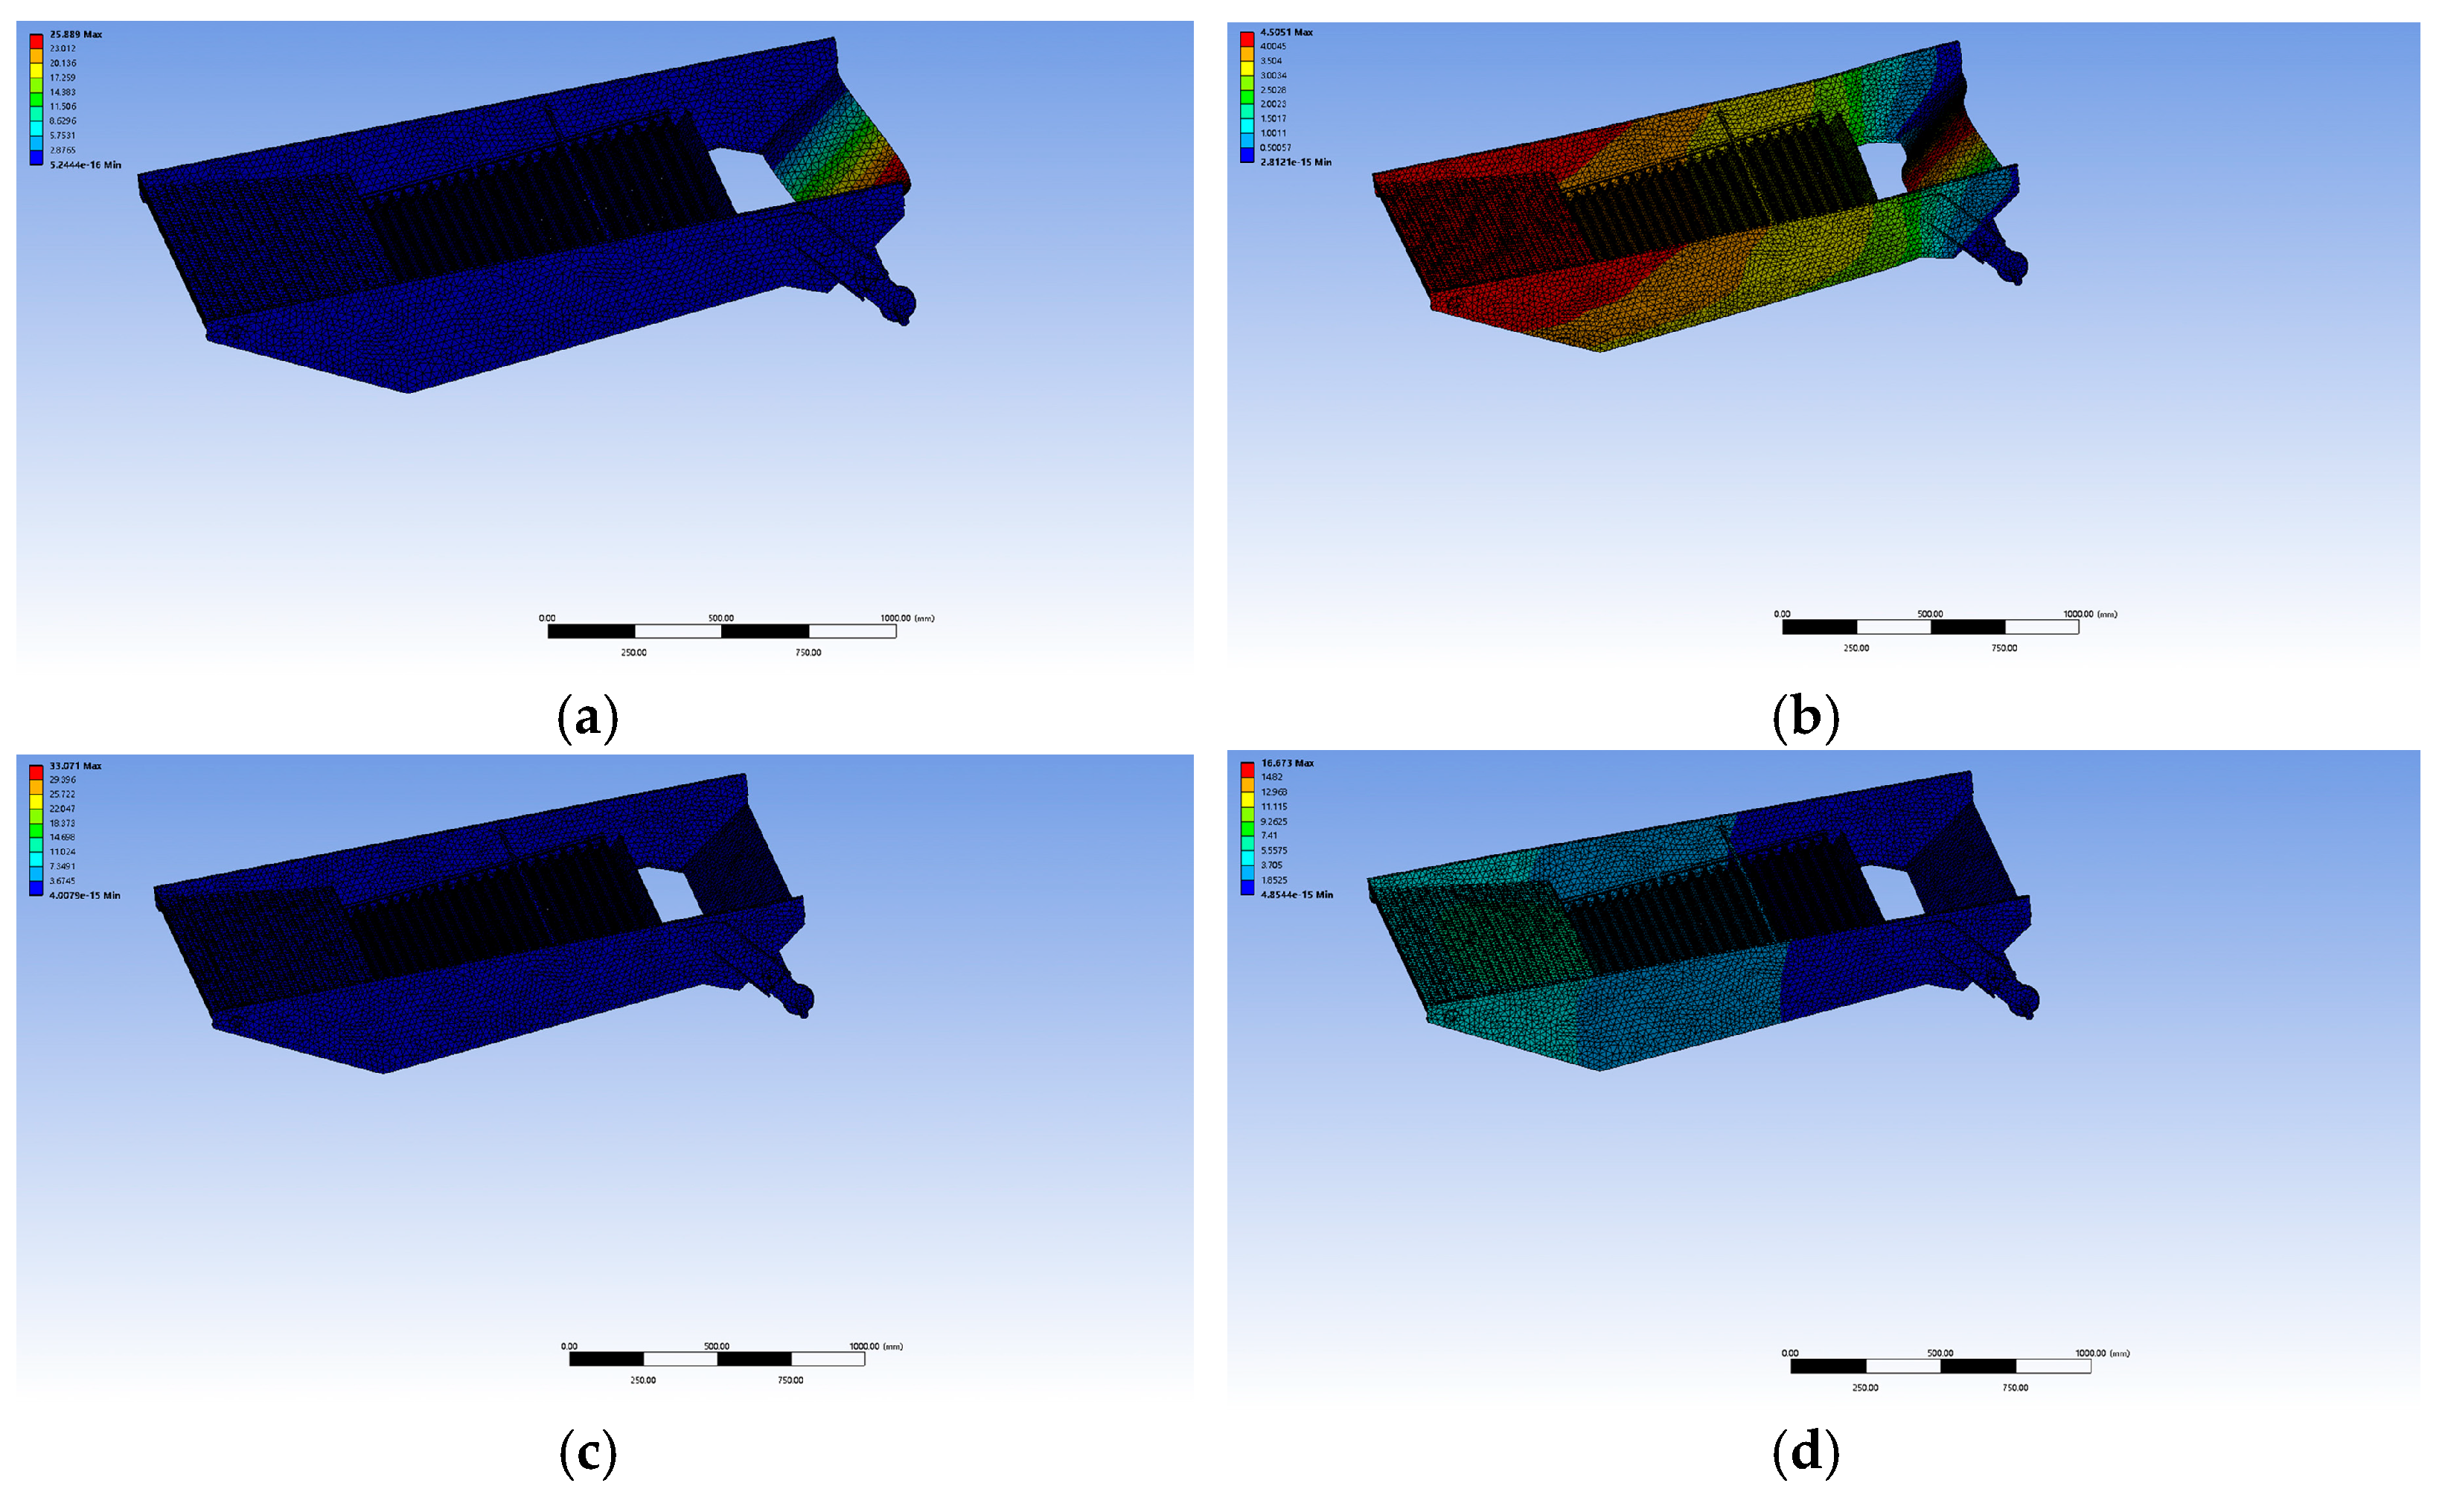
Figure 3 presents the first four modes of the cleaning sieve. It can be seen from these vibration patterns that the front part of the sieve frame, the shaking plate, and the baffle part of the rear sieve experience large deformation during vibration. In particular, in the second-order mode, the deformation caused by the vibration of the sieve frame on the side of the cleaning sieve exhibits an attenuation trend from the front of the sieve to the rear, and the change amplitude is more obvious. Based on this characteristic, in the follow-up durability test, strain gauge sensors were evenly arranged on the side frame of the cleaning sieve to better monitor and analyze the vibration of the sieve.
2.3. Transient Dynamic Analysis
Transient dynamic analysis (also known as time-history analysis) can be used to determine the time-varying displacement, strain, stress, and force of a structure under any combination of steady, transient, and harmonic loads. To simplify the simulation process, transient dynamic analysis was only carried out on the main bearing components such as the frame and the shaking plate of the cleaning sieve [
25], and the more complicated parts such as the top sieve and the rear sieve were ignored. The simulation analysis results are shown in
Figure 4.
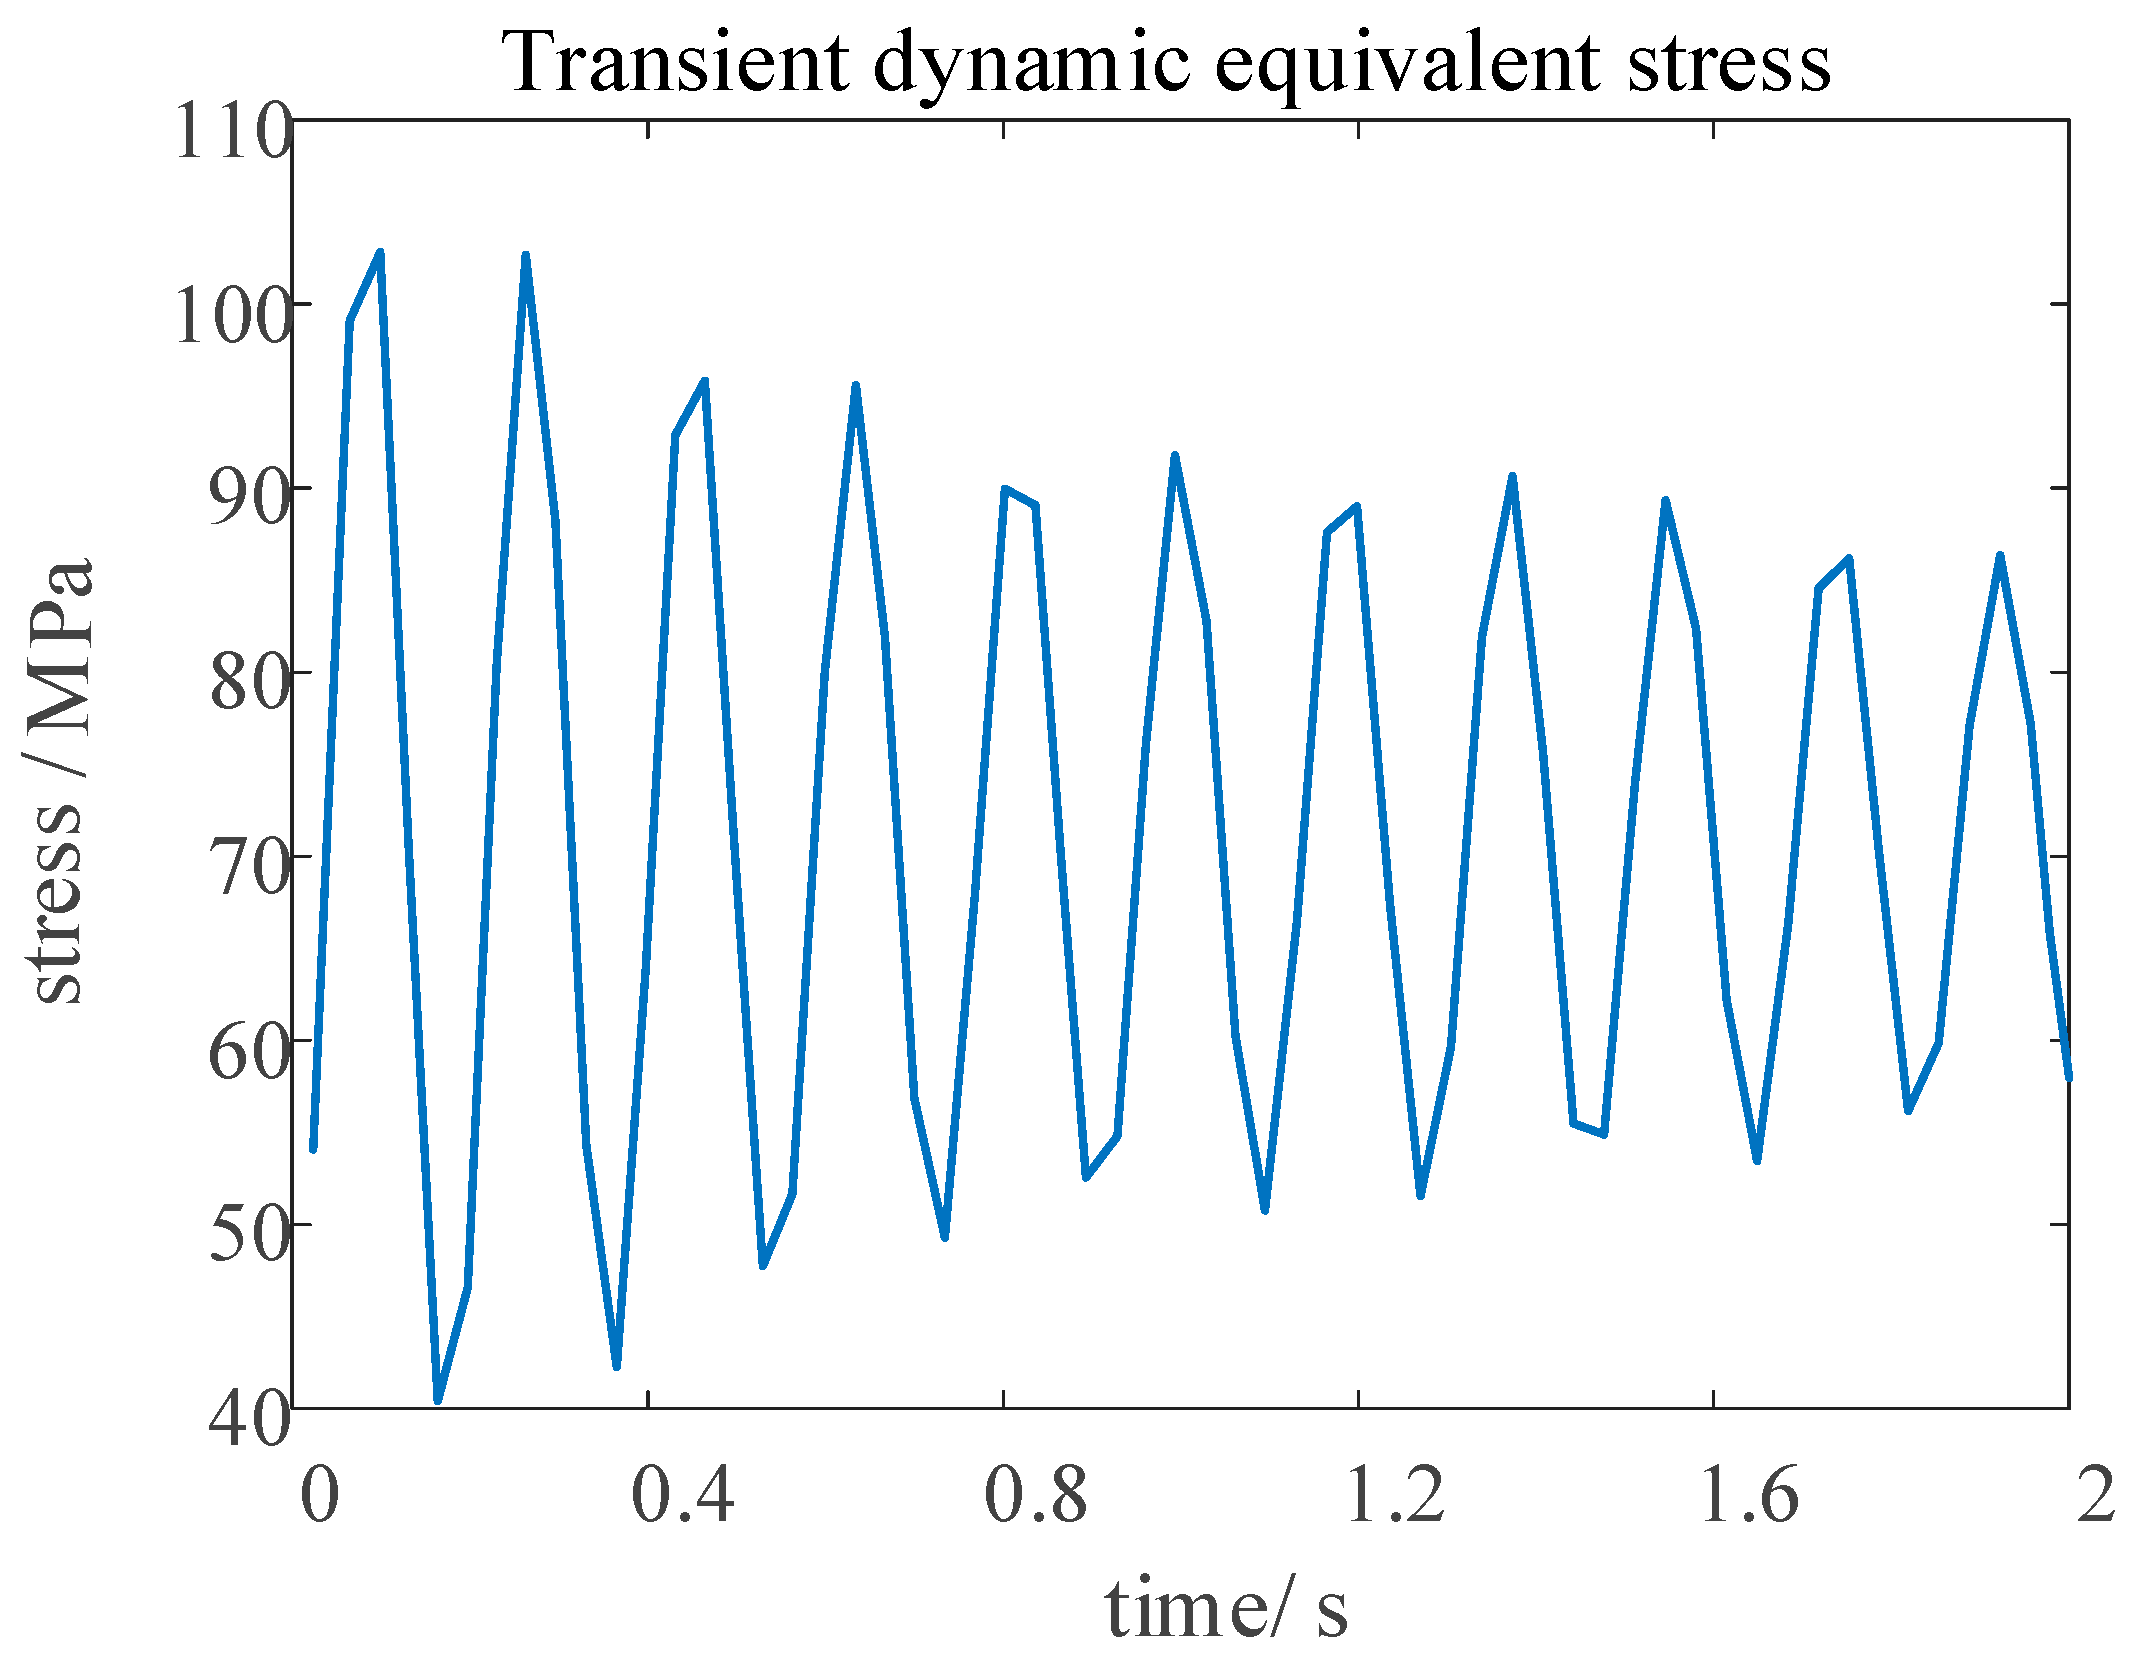
From
Figure 4, it can be seen that the equivalent stress value of the cleaning sieve changed periodically in the first 2 s of the simulation. It reached the maximum peak of 102.82 MPa at about 0.07 s, and the peak then gradually decreased with time. After 0.8 s, the peak tended to be less than 91.8 MPa. The simulation results show that the maximum stress value of the main bearing parts of the cleaning sieve was lower than the tensile strength of the material used in the cleaning sieve, namely 370 MPa, and was within the safe range.
To further analyze the stress distribution of the cleaning sieve, the stress cloud corresponding to the maximum equivalent stress value of the cleaning sieve at 0.07 s was simulated.
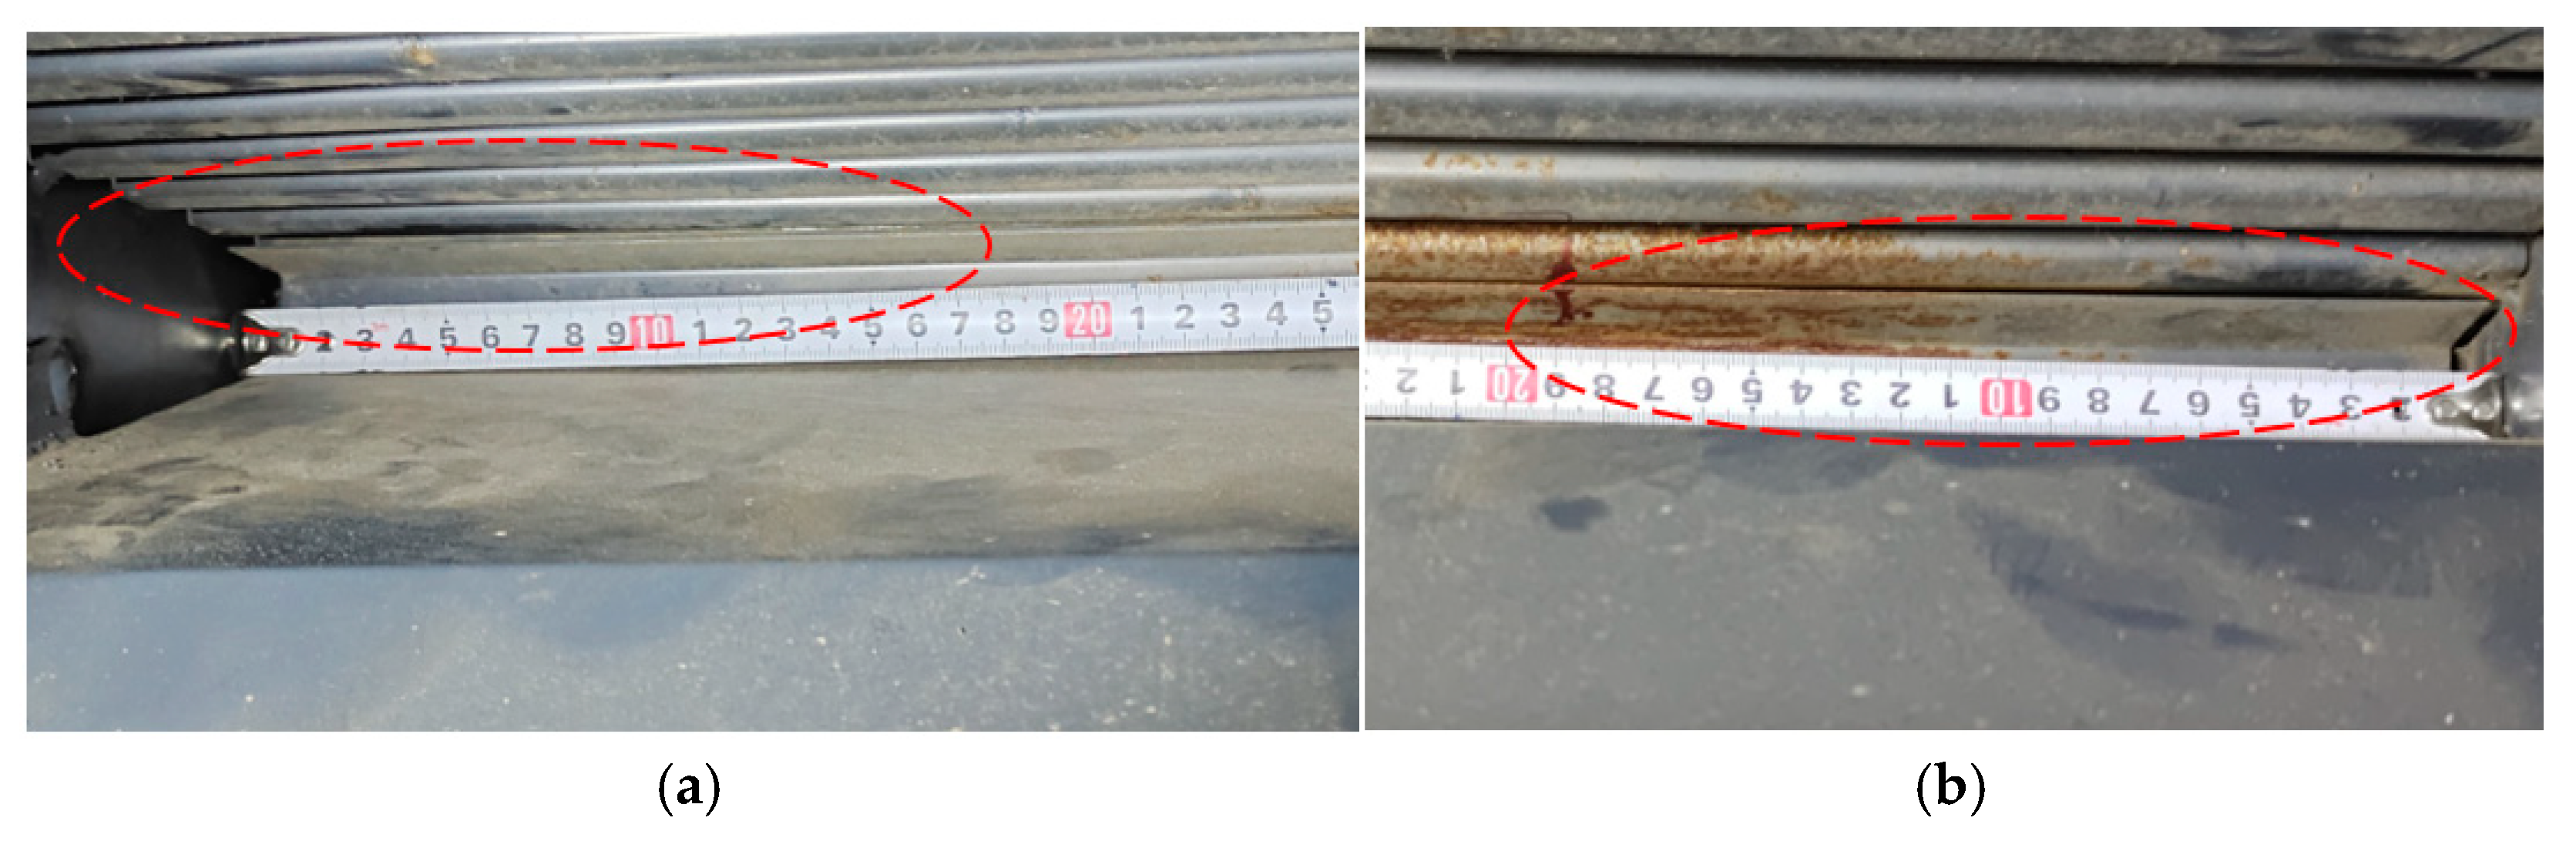
Figure 5 demonstrates that the maximum stress position occurred on the inside of the front bearing of the cleaning sieve. In addition, the connection between the side wall of the cleaning sieve and the shaking plate, the reinforcing rib, and the rare sieve support plate also experienced large stress in the range of 20–40 MPa. According to the actual operation process of the cleaning sieve, it can be seen that the front bearing and driving shaft are the main bearing parts of the whole sieve, and the analysis results agree with the actual situation.
According to the conclusion of the transient dynamic simulation of the cleaning sieve and the feasibility of sensor installation, the connection between the shaking plate and the side wall of the sieve and the connection between the rear sieve support plate and the side wall of the sieve were selected as the reference points for sensor arrangement. To facilitate comparisons with other points, the part with less stress in the middle of the side wall of the cleaning sieve was selected as the reference object.
2.4. Construction of the Durability Test Bench for the Cleaning Sieve
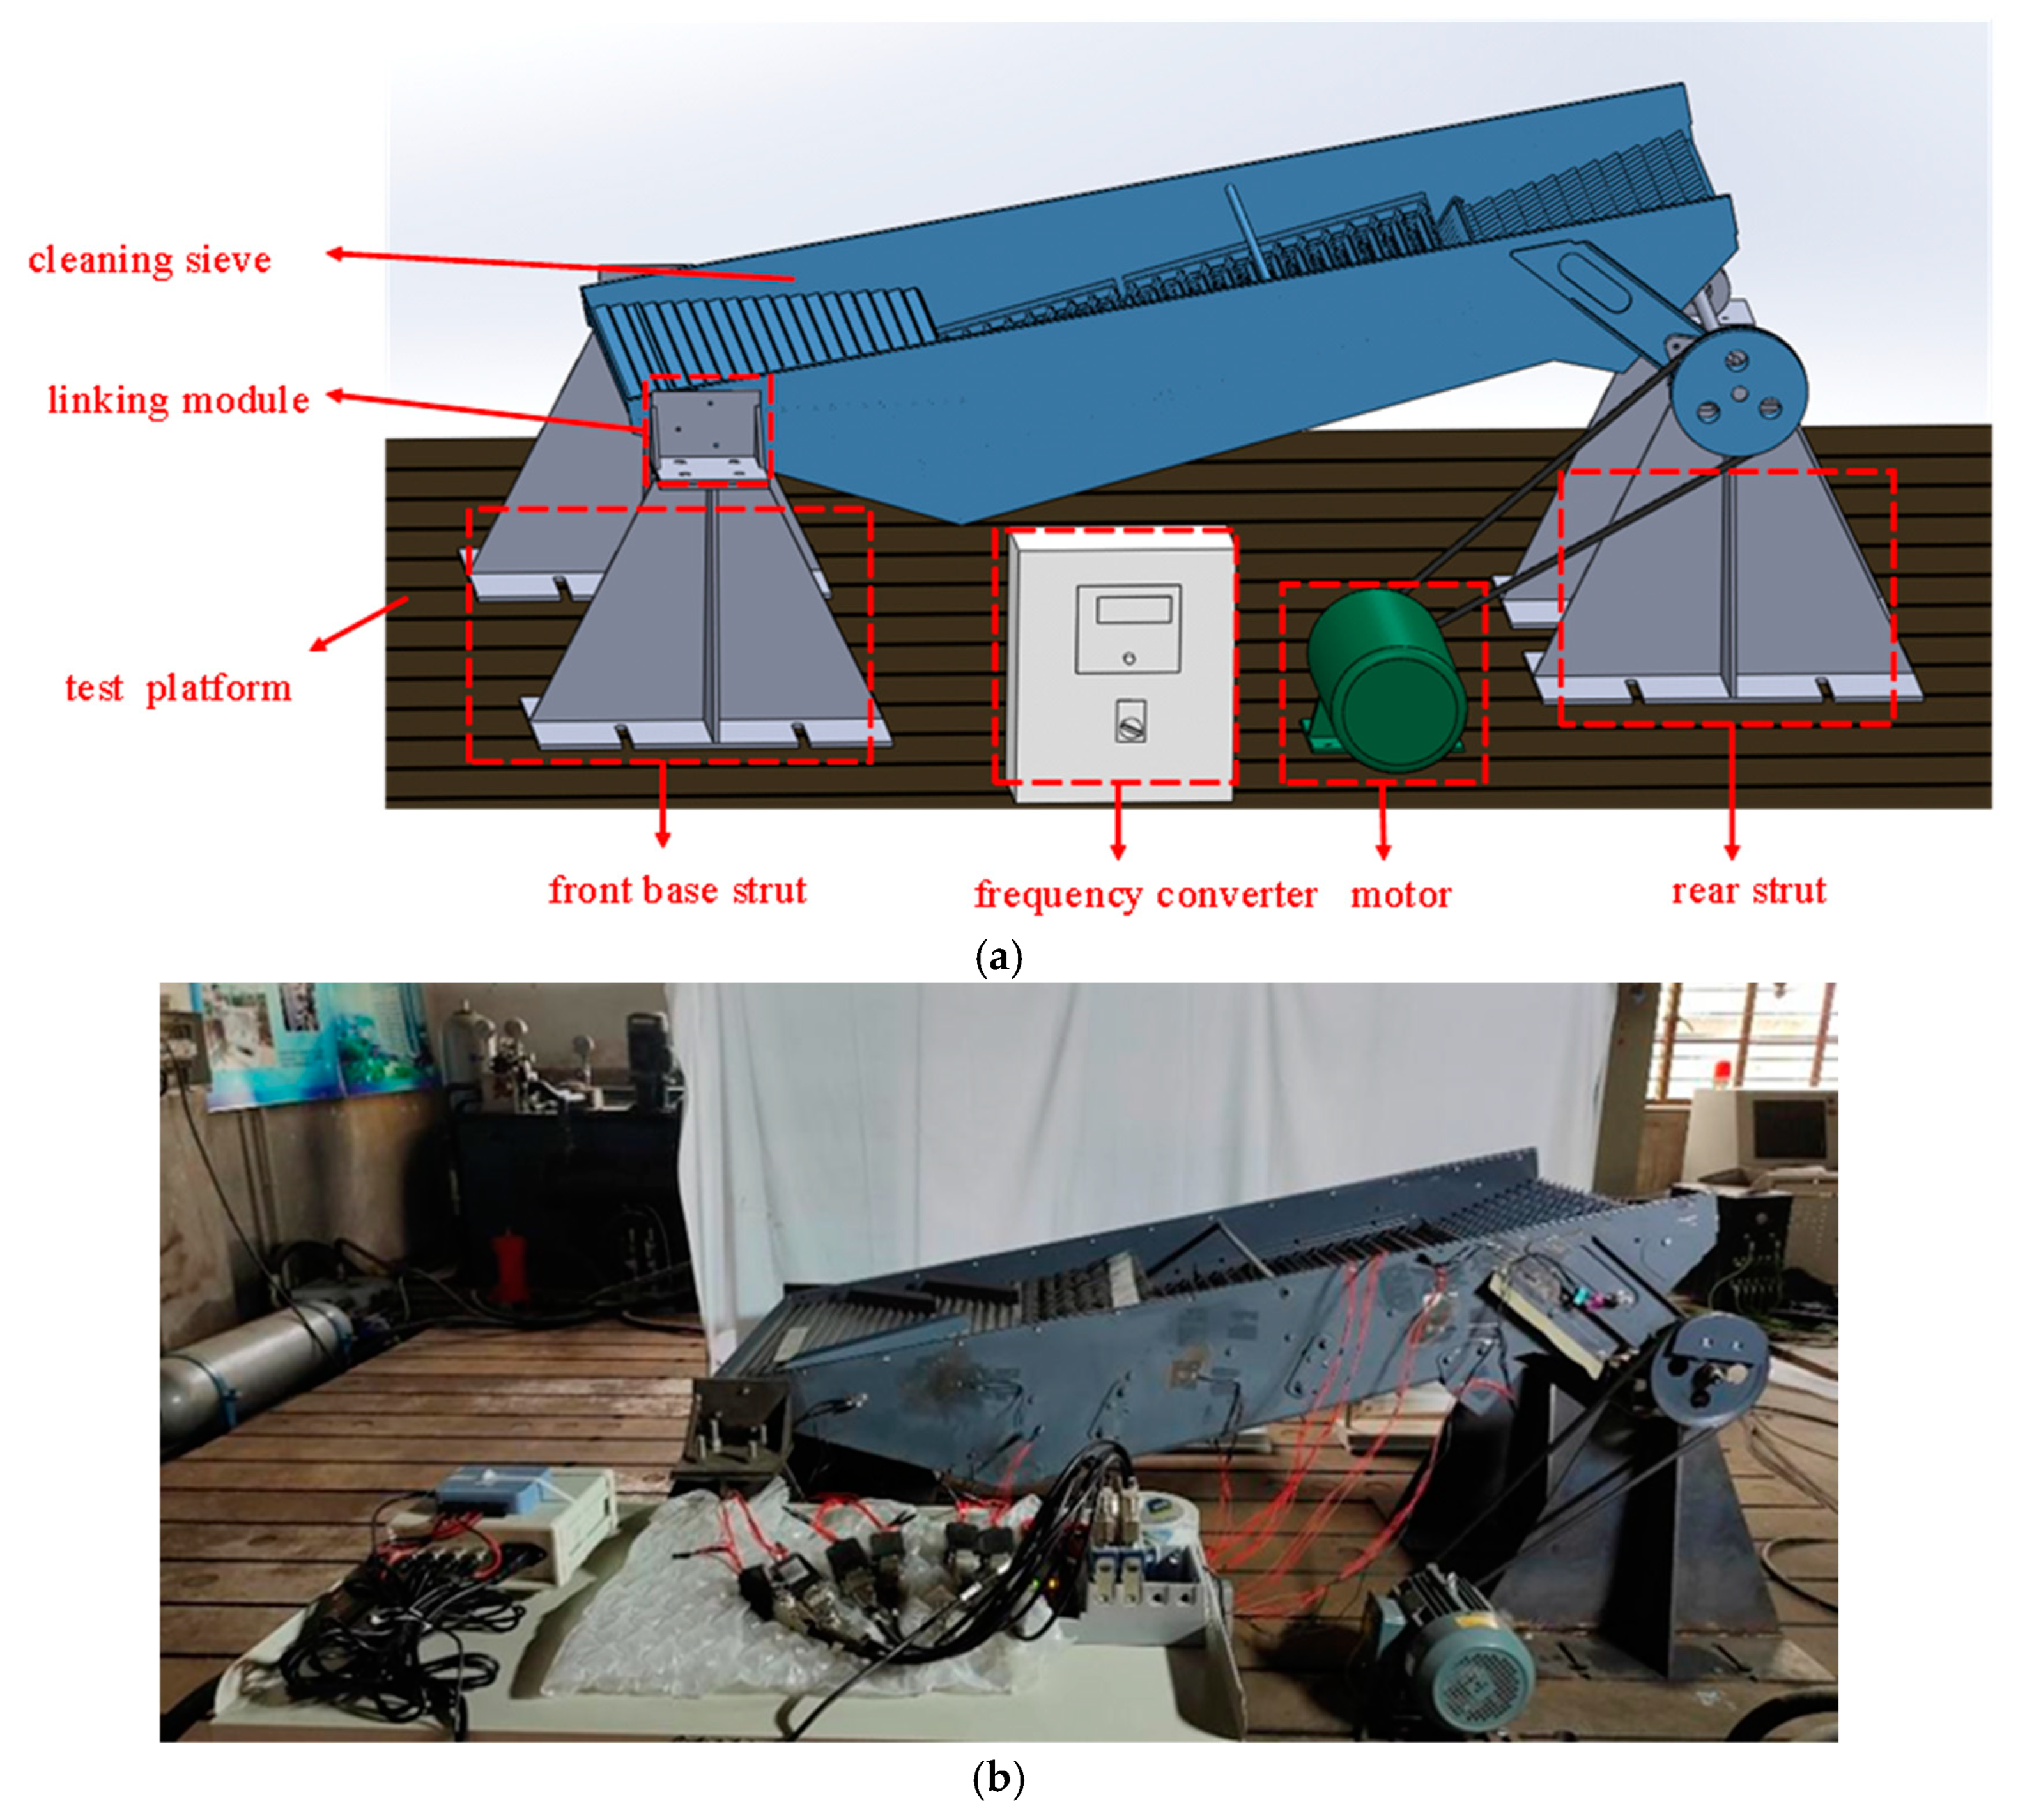
A special test bench was designed and constructed to study the durability of the cleaning sieve during the working process. After studying the installation mode of the cleaning sieve on the harvester, and with reference to the fatigue test equipment for car bodies and frames in the automobile field, a durability test bench was designed specifically for the sieve. The test bench is composed of a cleaning sieve, frequency converter, motor, front (back) base pillar, test platform, connection module, and signal acquisition system, as shown in
Figure 6. Four pillars were selected to support the front bearing and the drive shaft of the cleaning sieve, respectively. Moreover, the contact area between the bottom of the pillar and the test platform was increased to improve the stability of the platform. During operation, the rotating motion of the three-phase motor is transmitted to the drive shaft through the belt drive, which drives the overall motion of the cleaning sieve [
26]. The speed of the motor is regulated by the frequency converter.
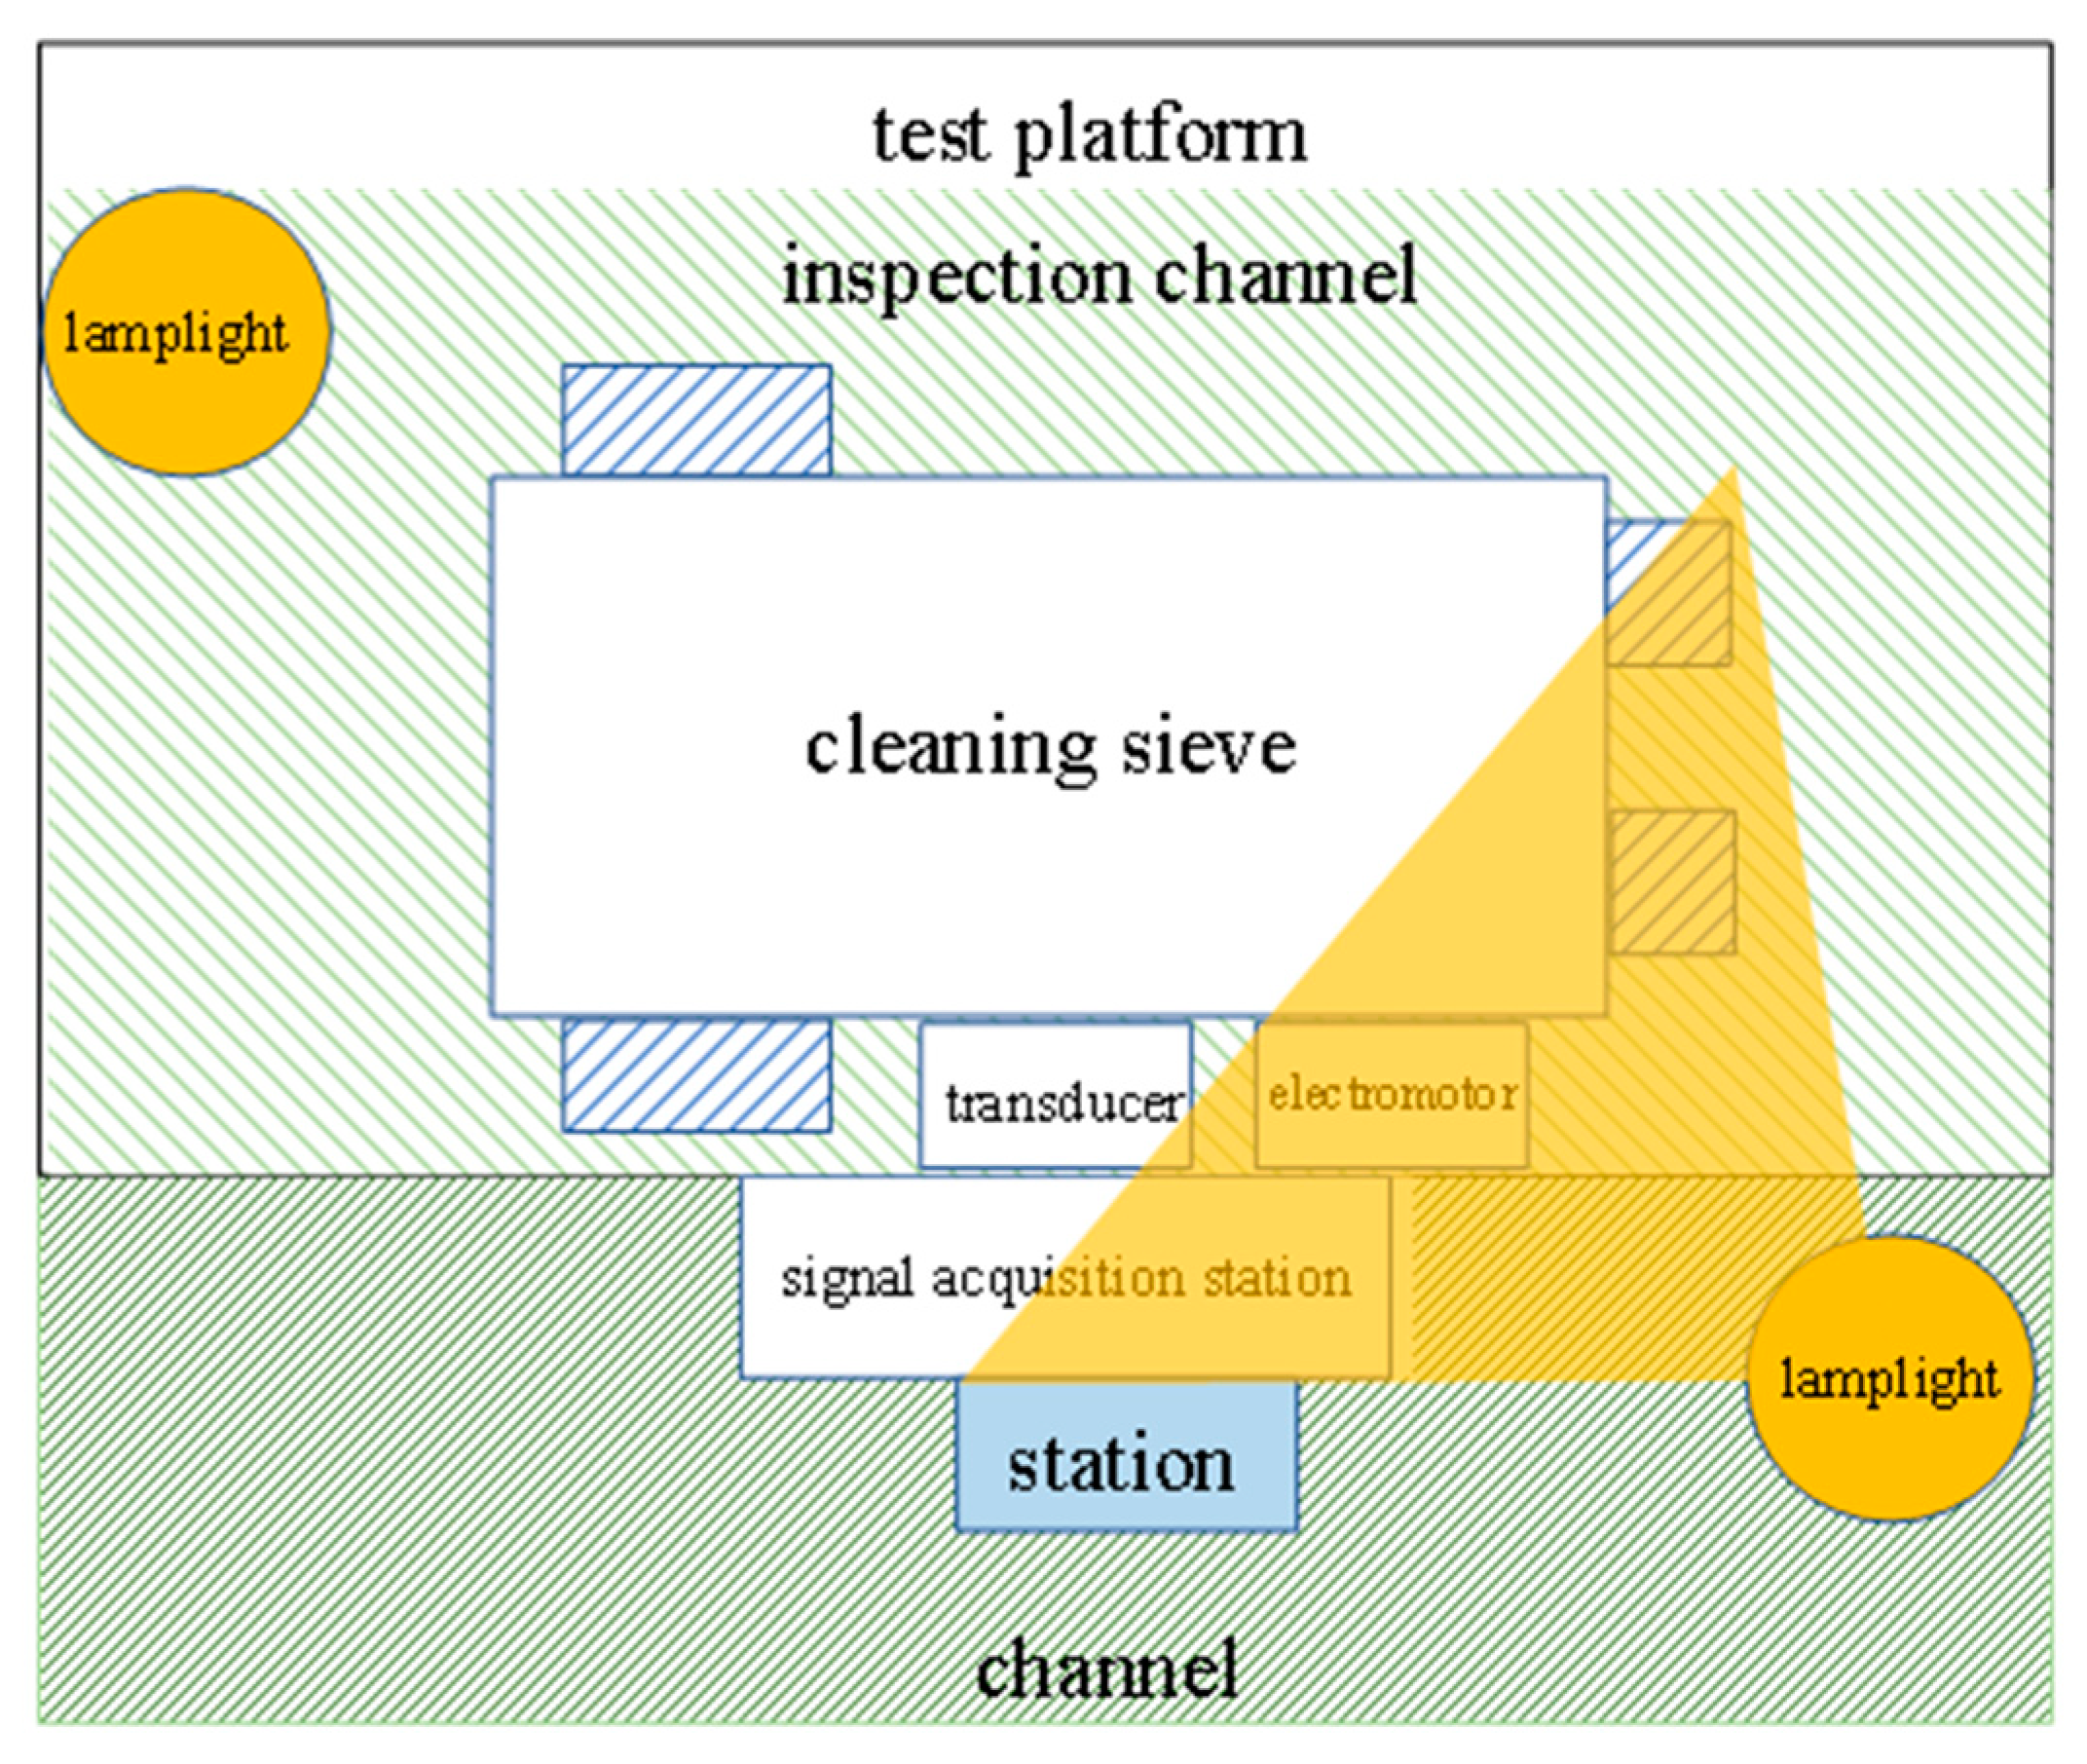
The installation position of the cleaning sieve and the layout area of the sensor acquisition system were planned based on the test platform. The specific layout of the test area is shown in
Figure 7. The test bench has the following advantages.
The open design can more intuitively detect the operating status of the cleaning sieve and facilitate the installation of the sensor.
The bench base comprises four independent pillars, which are fixed on the test platform through T-nuts, and the distance between the pillars can be adjusted to adapt to cleaning sieves of different sizes.
A modular design is adopted for the connecting parts, and the replacement of the connecting module can be carried out to adjust the installation method of the cleaning sieve. This can meet different test needs, such as changing the tilt angle and simulating the installation error.
2.5. Sensor Layout and Signal Acquisition
To monitor the vibration and strain signals of the cleaning sieve with more accuracy and sensitivity, the corresponding sensors are arranged in the appropriate positions based on the modal analysis and transient dynamic analysis results, and according to the actual movement of the cleaning sieve. The sensor layout is described as follows.
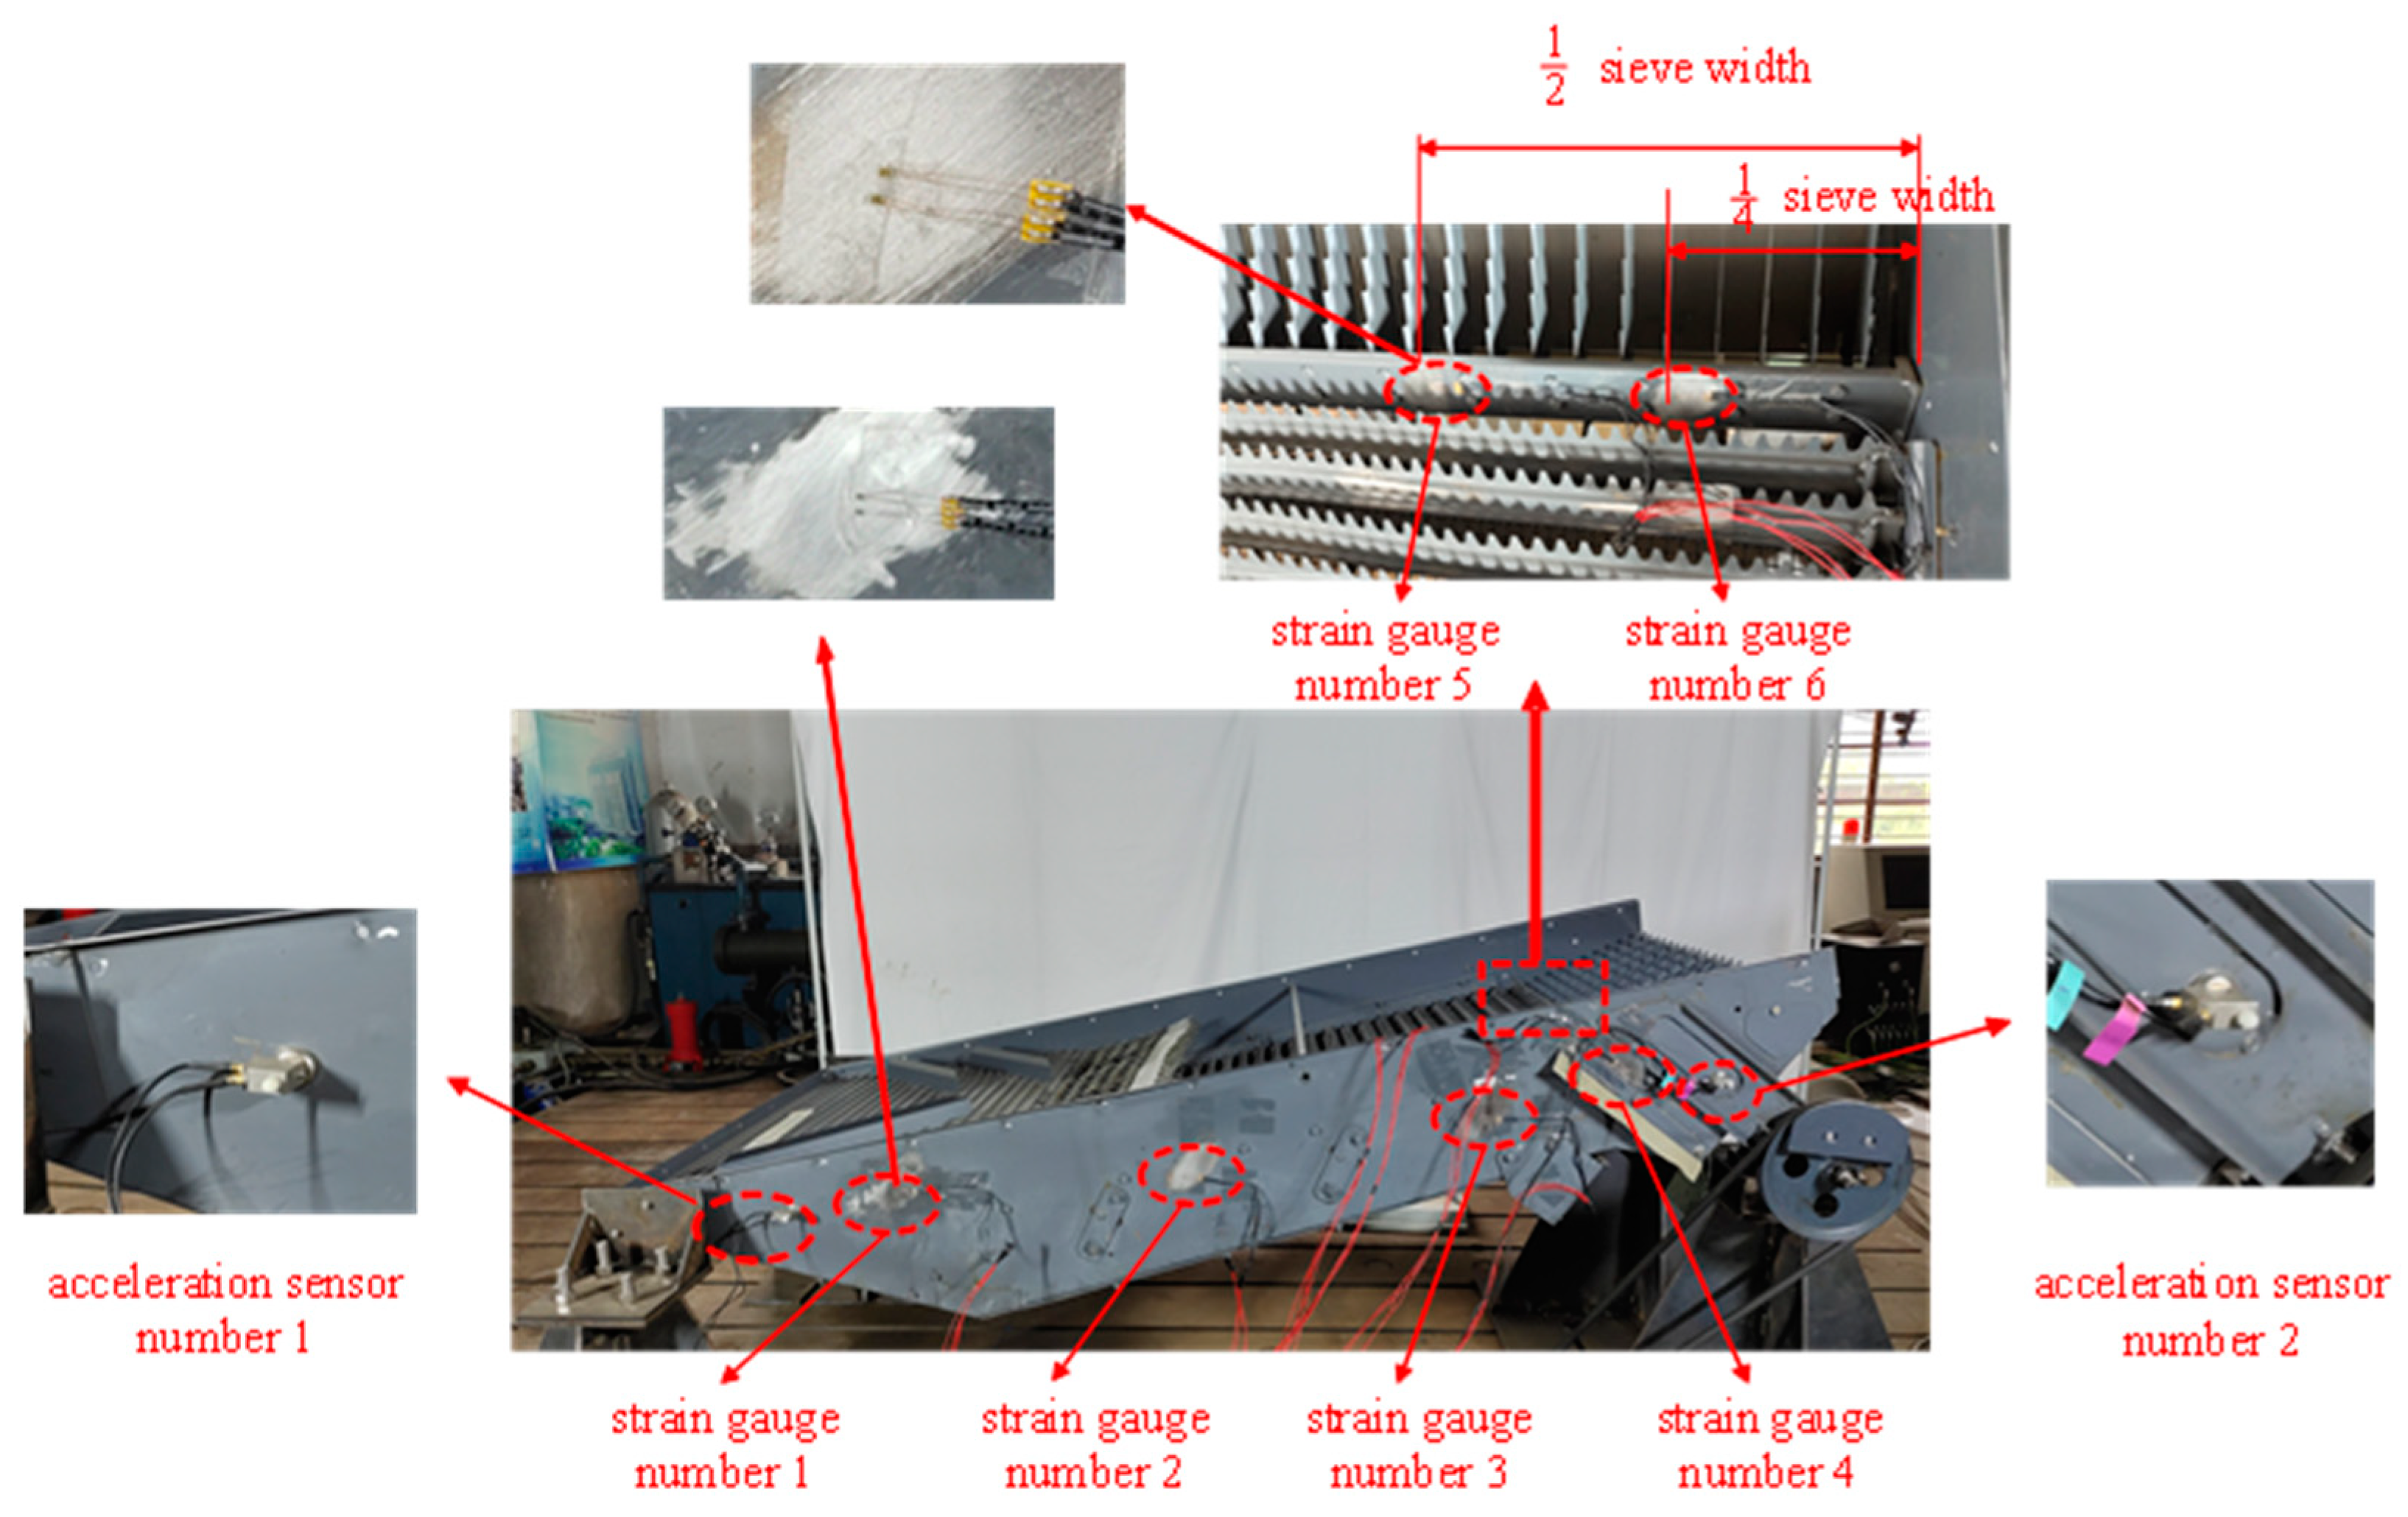
The movement of the cleaning sieve mainly includes the sliding of the front bearing along the chute and the eccentric rotating movement of the back end. Therefore, two Chengke CT1005LS three-way acceleration sensors, marked No. 1 and No. 2, are, respectively, arranged near the front bearing and chute plate and near the drive shaft to measure the vibration signals of these two parts. Chengke CT1005LS is a piezoelectric accelerometer with a frequency range of 1–5000 KHz and a resonant frequency of 20 kHz. The collected data is transferred to the host computer via Chengke MCC USB-231 data acquisition card.
The strain signal acquisition system comprises Chengke 120-1AA strain sensors and Chengke CT9300 dynamic/static strain gauges. The sensor exhibits a resistance value of 120 ± 0.1 (Ω), a strain limit of 2%, and a sensitivity coefficient of 2.0 ± 1%. Each channel attains a maximum sampling rate of 51.2 ks/s, with an ADC resolution of 24 bits. According to the modal analysis and transient dynamic analysis results, it is evident that the strains of the side wall plate, the shaking plate, the top sieve, and the rear sieve are large. To detect the strain distribution of the cleaning sieve in the
x-axis direction, strain gauge sensor No. 1 is arranged at the connection between the side plate and the shaking plate, sensor No. 2 is arranged at the middle position of the connection between the side plate and the top sieve (i.e., at half of the length of the whole cleaning sieve), sensor No. 3 is arranged near the end of the connection between the side plate and the top sieve, and sensor No. 4 is arranged near the bend of the side plate and the drive shaft. Due to the special structure of the shaking plate, the top sieve, and the rear sieve, it is not convenient to install and fix a strain gauge sensor. To detect the strain distribution of the cleaning sieve in the
y-axis direction, strain gauge sensors No. 5 and No. 6 are arranged at the 1/2 and 1/4 width of the rear sieve support plate, respectively. The strain gauge sensors in the signal acquisition system are all Chengke 120-1AA sensors, and the specific position of each sensor on the cleaning sieve is shown in
Figure 8.
Install the acceleration sensor on the designated position of the cleaning sieve using magnetic suction. When installing the strain gauge sensor, polish the installation area with sandpaper at a 45° angle to the direction of strain gauge application. Cleanse the polished area with alcohol and paper towels to remove surface paint and stains. Attach the strain gauge to the cleaning screen box using adhesive. Secure the strain gauge and wires with multiple layers of transparent tape.
To transmit the collected signals of the three-way acceleration sensors and the strain gauge sensors to the host computer for storage and display, a data acquisition card and a dynamic and static strain gauge are, respectively, used to transmit the collected vibration signals and strain signals to the host computer, and the constant current adapter is used to provide stable power for the normal operation of the acquisition card.
2.6. Test Scheme
According to the actual operation of the cleaning sieve, the vibration frequency of the sieve was set to 5 Hz, the sampling frequency was set to 1000 Hz, and the sampling duration was manually controlled. The transmission ratio between the motor pulley and the sieve driving wheel in this test bench was 3.125, and the motor speed was set to 937.5 r/min.
At present, there is no universal standard for the durability test of the cleaning system of the combine harvester. Combine harvesters generally work continuously for 30 days in one working season. According to the working conditions of 10 h a day, of which half of the time is used for unloading/transferring/turning, etc., the continuous working time of the cleaning sieve of the combine harvester in one working season is about 150 h [
27]. At present, the trouble-free working time of the Chinese crawler combine harvester is about 50 h [
28], that of the parts is generally 2–3 times that of the whole machine, and that of the cleaning sieve is about 150 h. In consideration of these aspects, the continuous durability test time of the cleaning sieve was set to 150 h in the bench test.
4. Discussion
The structural characteristics of the cleaning sieve are preliminarily analyzed through finite element simulation. The modal analysis results indicate that the lowest natural frequency among the first 10 modes is 14.542 Hz. Examination of the first 10 vibration patterns reveals significant vibration effects on the front part of the sieve frame, the shaking plate, and the rear sieve. Transient dynamic analysis demonstrates conspicuous stress variations within the cleaning sieve model, with the highest stress of 102.82 MPa occurring near the front bearing, and additional substantial stress of 20–40 MPa present in the sieve frame.
On the whole, the strain distribution position of the cleaning sieve during operation was similar to the transient dynamic analysis results, but there were some errors that are attributable to two factors. First, the simplified model cannot completely simulate the structural characteristics of the cleaning sieve, and the installation error between parts will lead to changes in the strain distribution. Second, the single-axis foil strain gauge has certain limitations; it can only measure the strain along the grid axis, and it is not accurate enough to measure the plane strain.
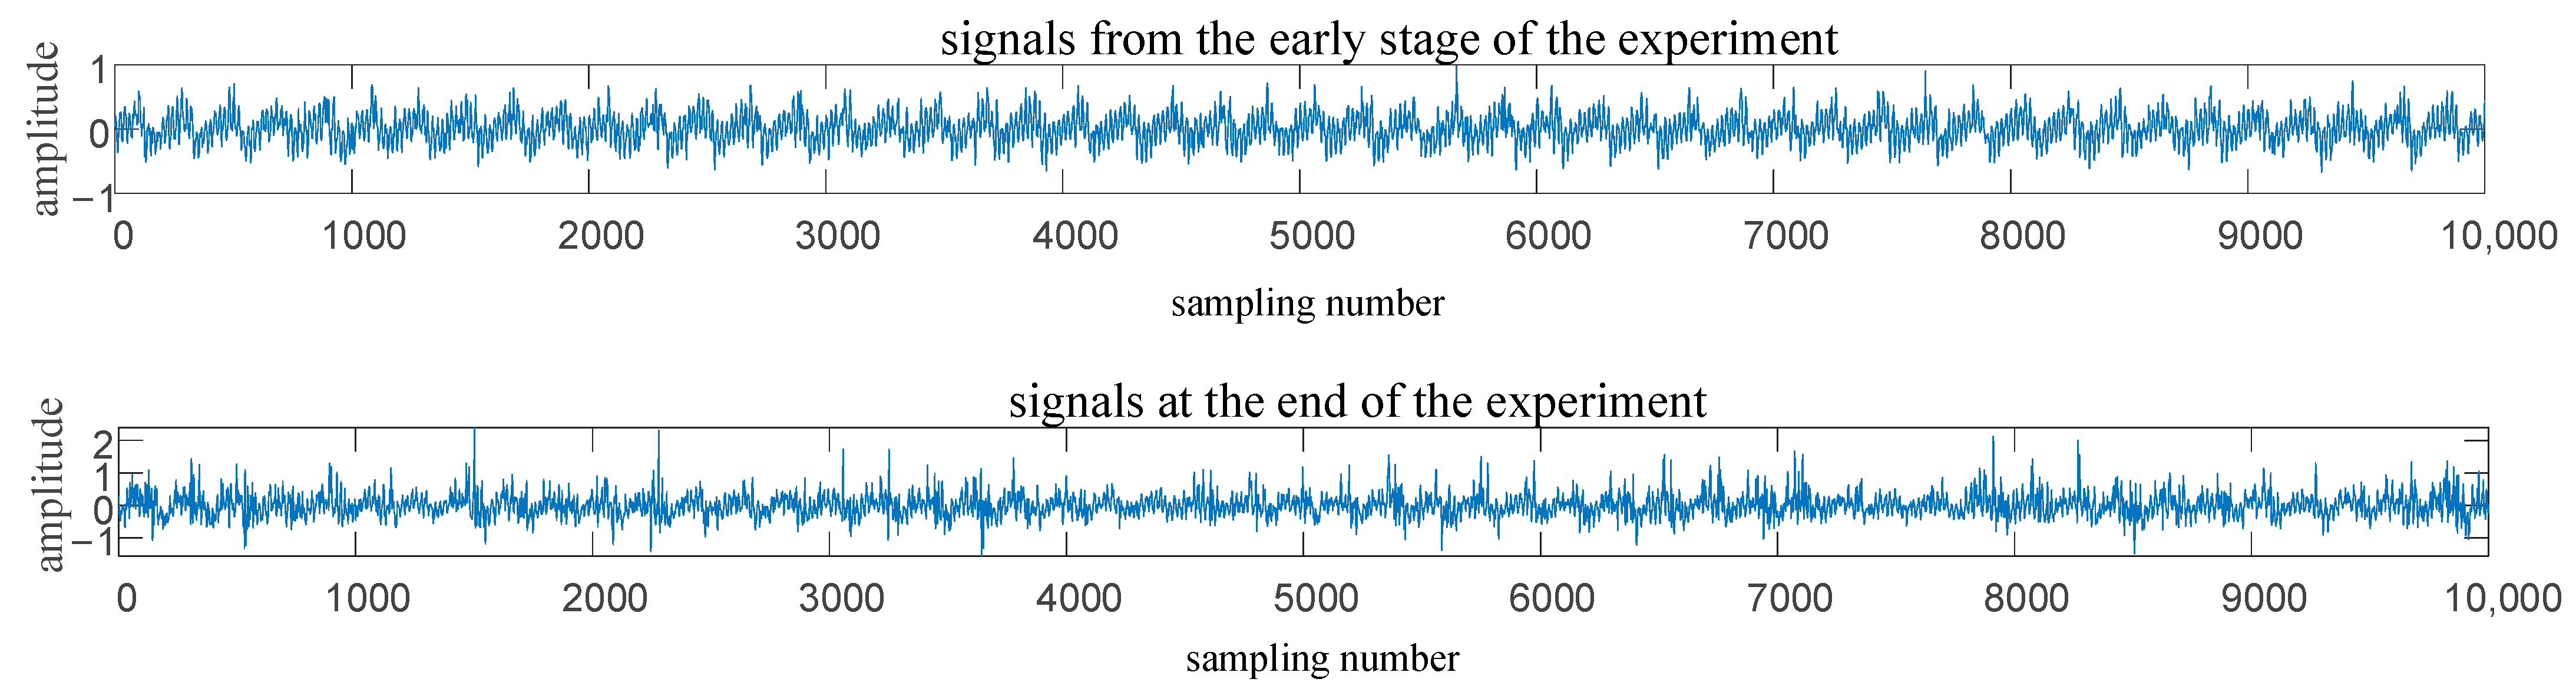
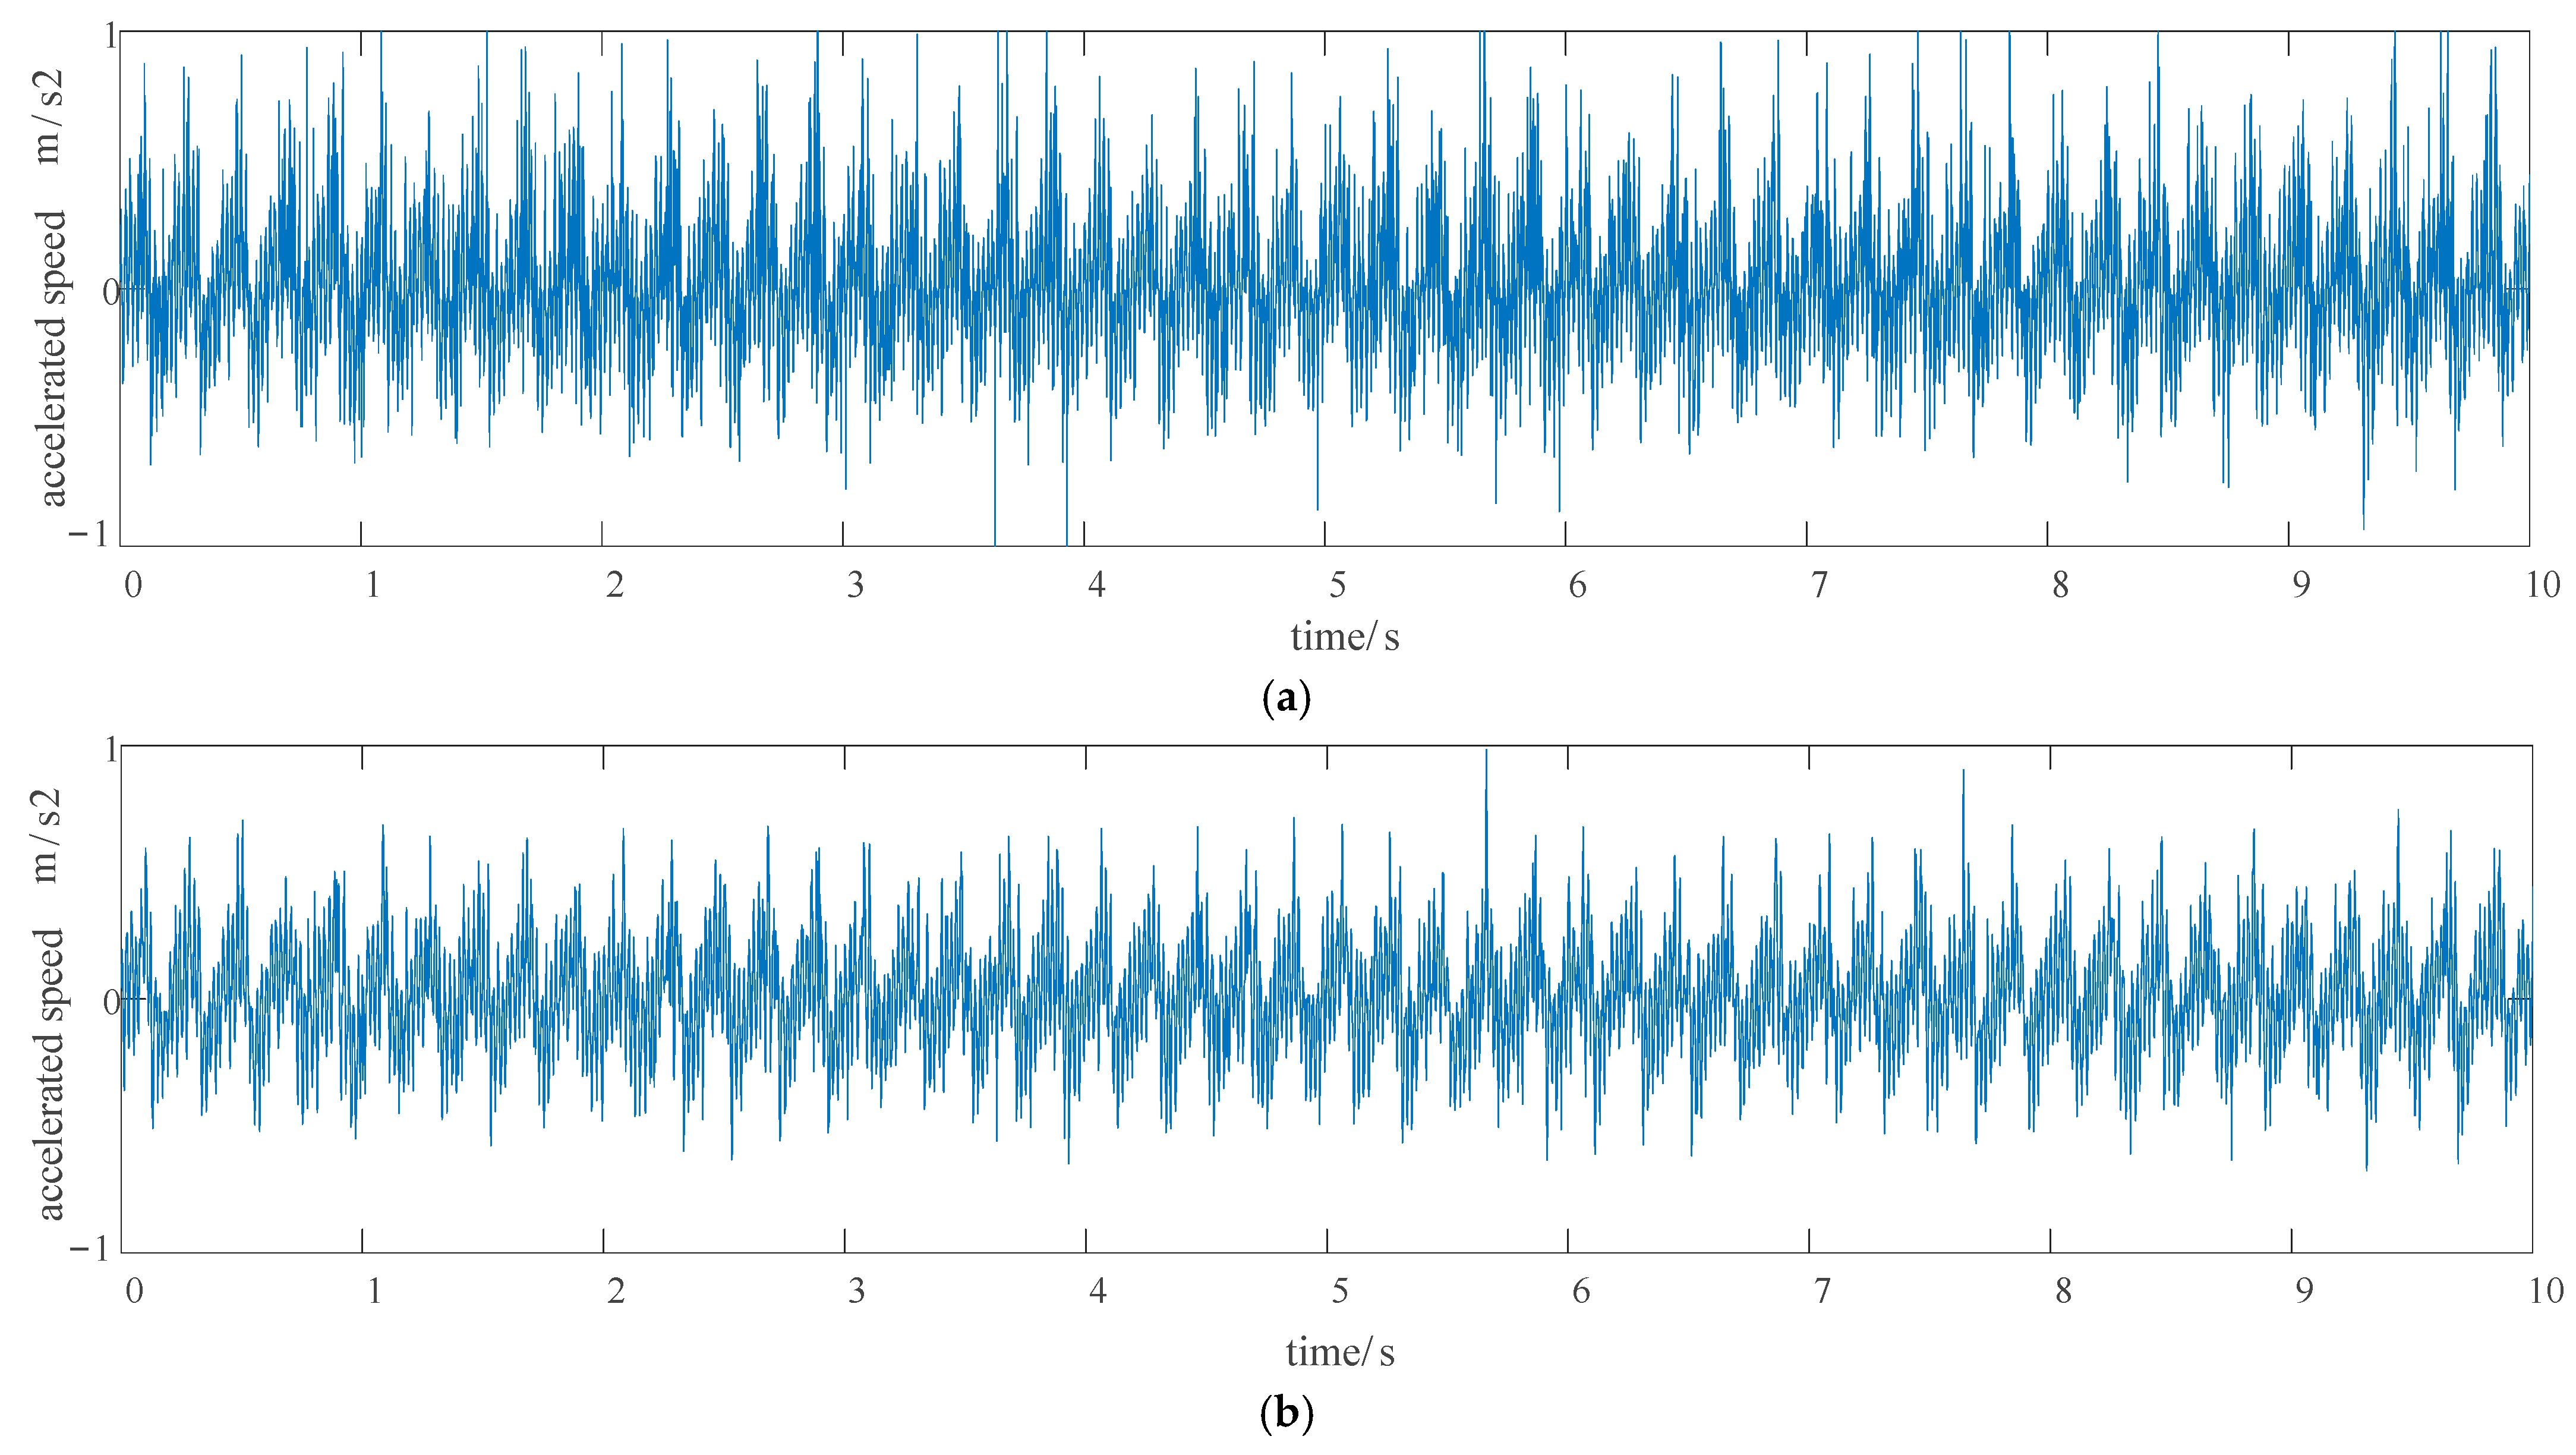
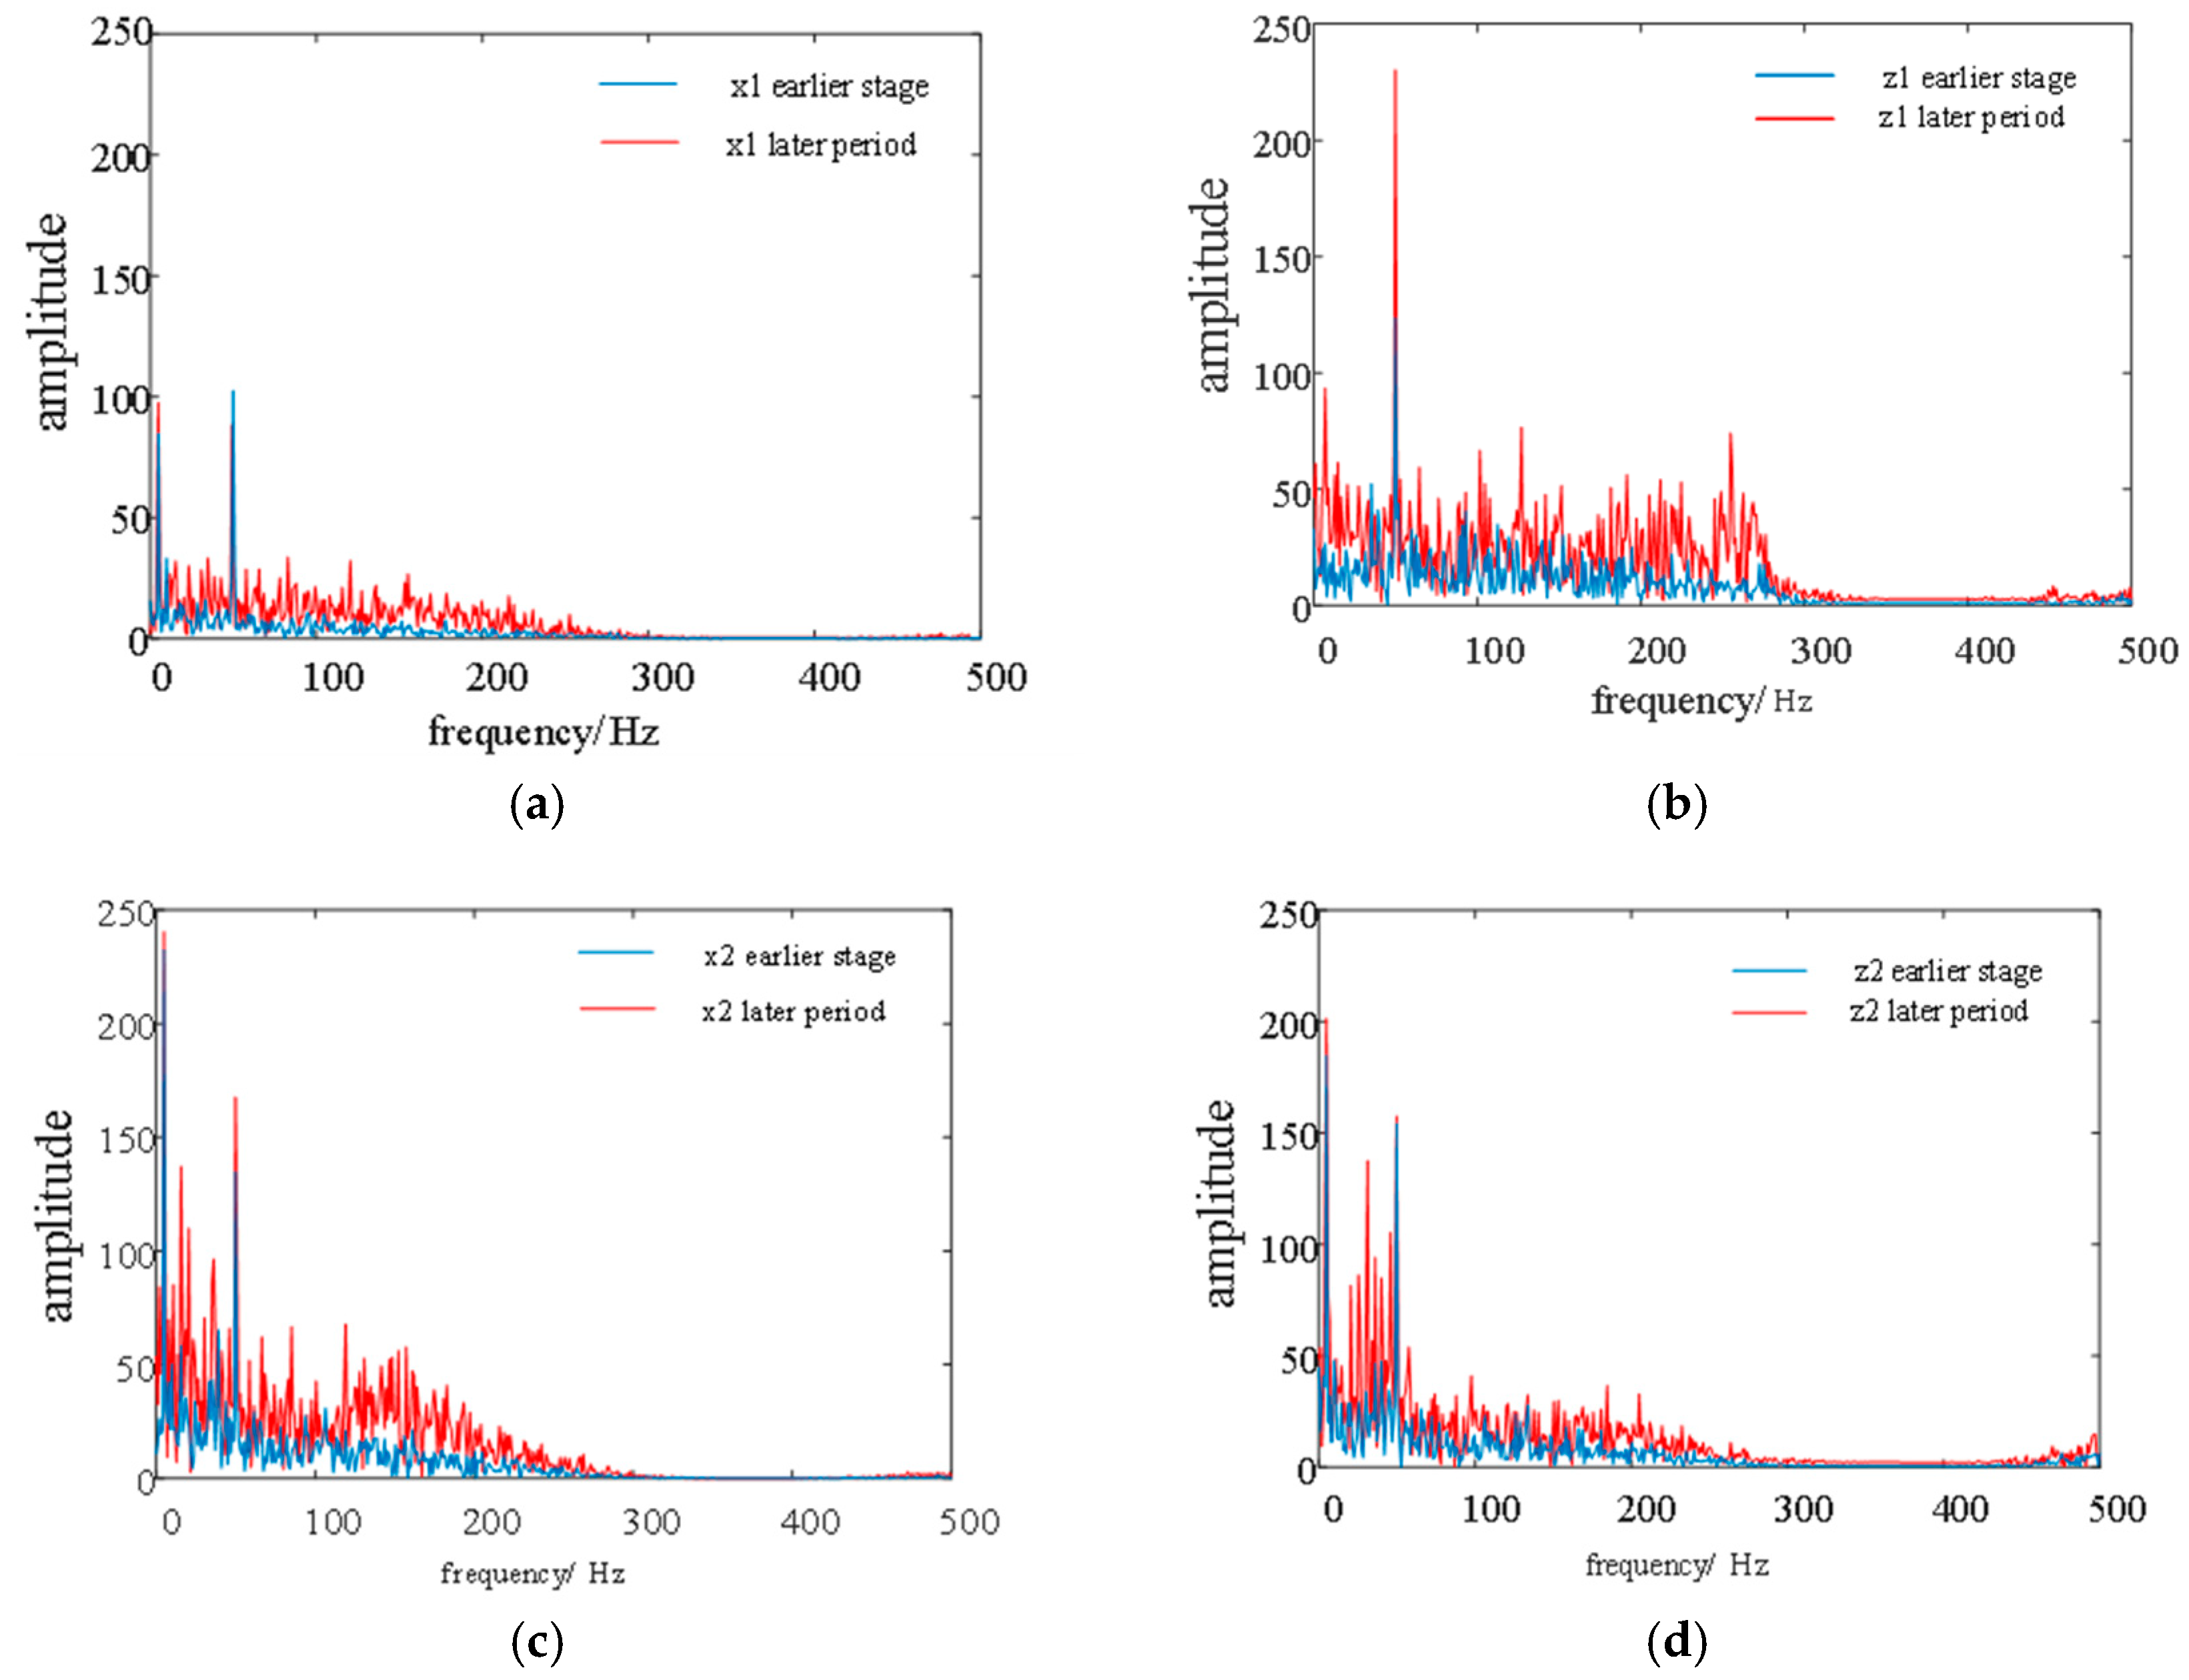
After analyzing the vibration signal, it was found that at the main frequency of the vibration signal of the cleaning sieve, in addition to the base frequency of the driving speed of 5 Hz, a frequency-doubling signal at 50 Hz was also present. After failure, the amplitude of the signal increased significantly; in particular, the peak amplitude of the frequency-doubling signal at 50 Hz increased by more than 86.3%. This can lead to further damage and reduce the life expectancy of the device. Therefore, it is necessary to reduce the influence of resonance and further improve the level of component manufacturing and the assembly of the cleaning sieve.
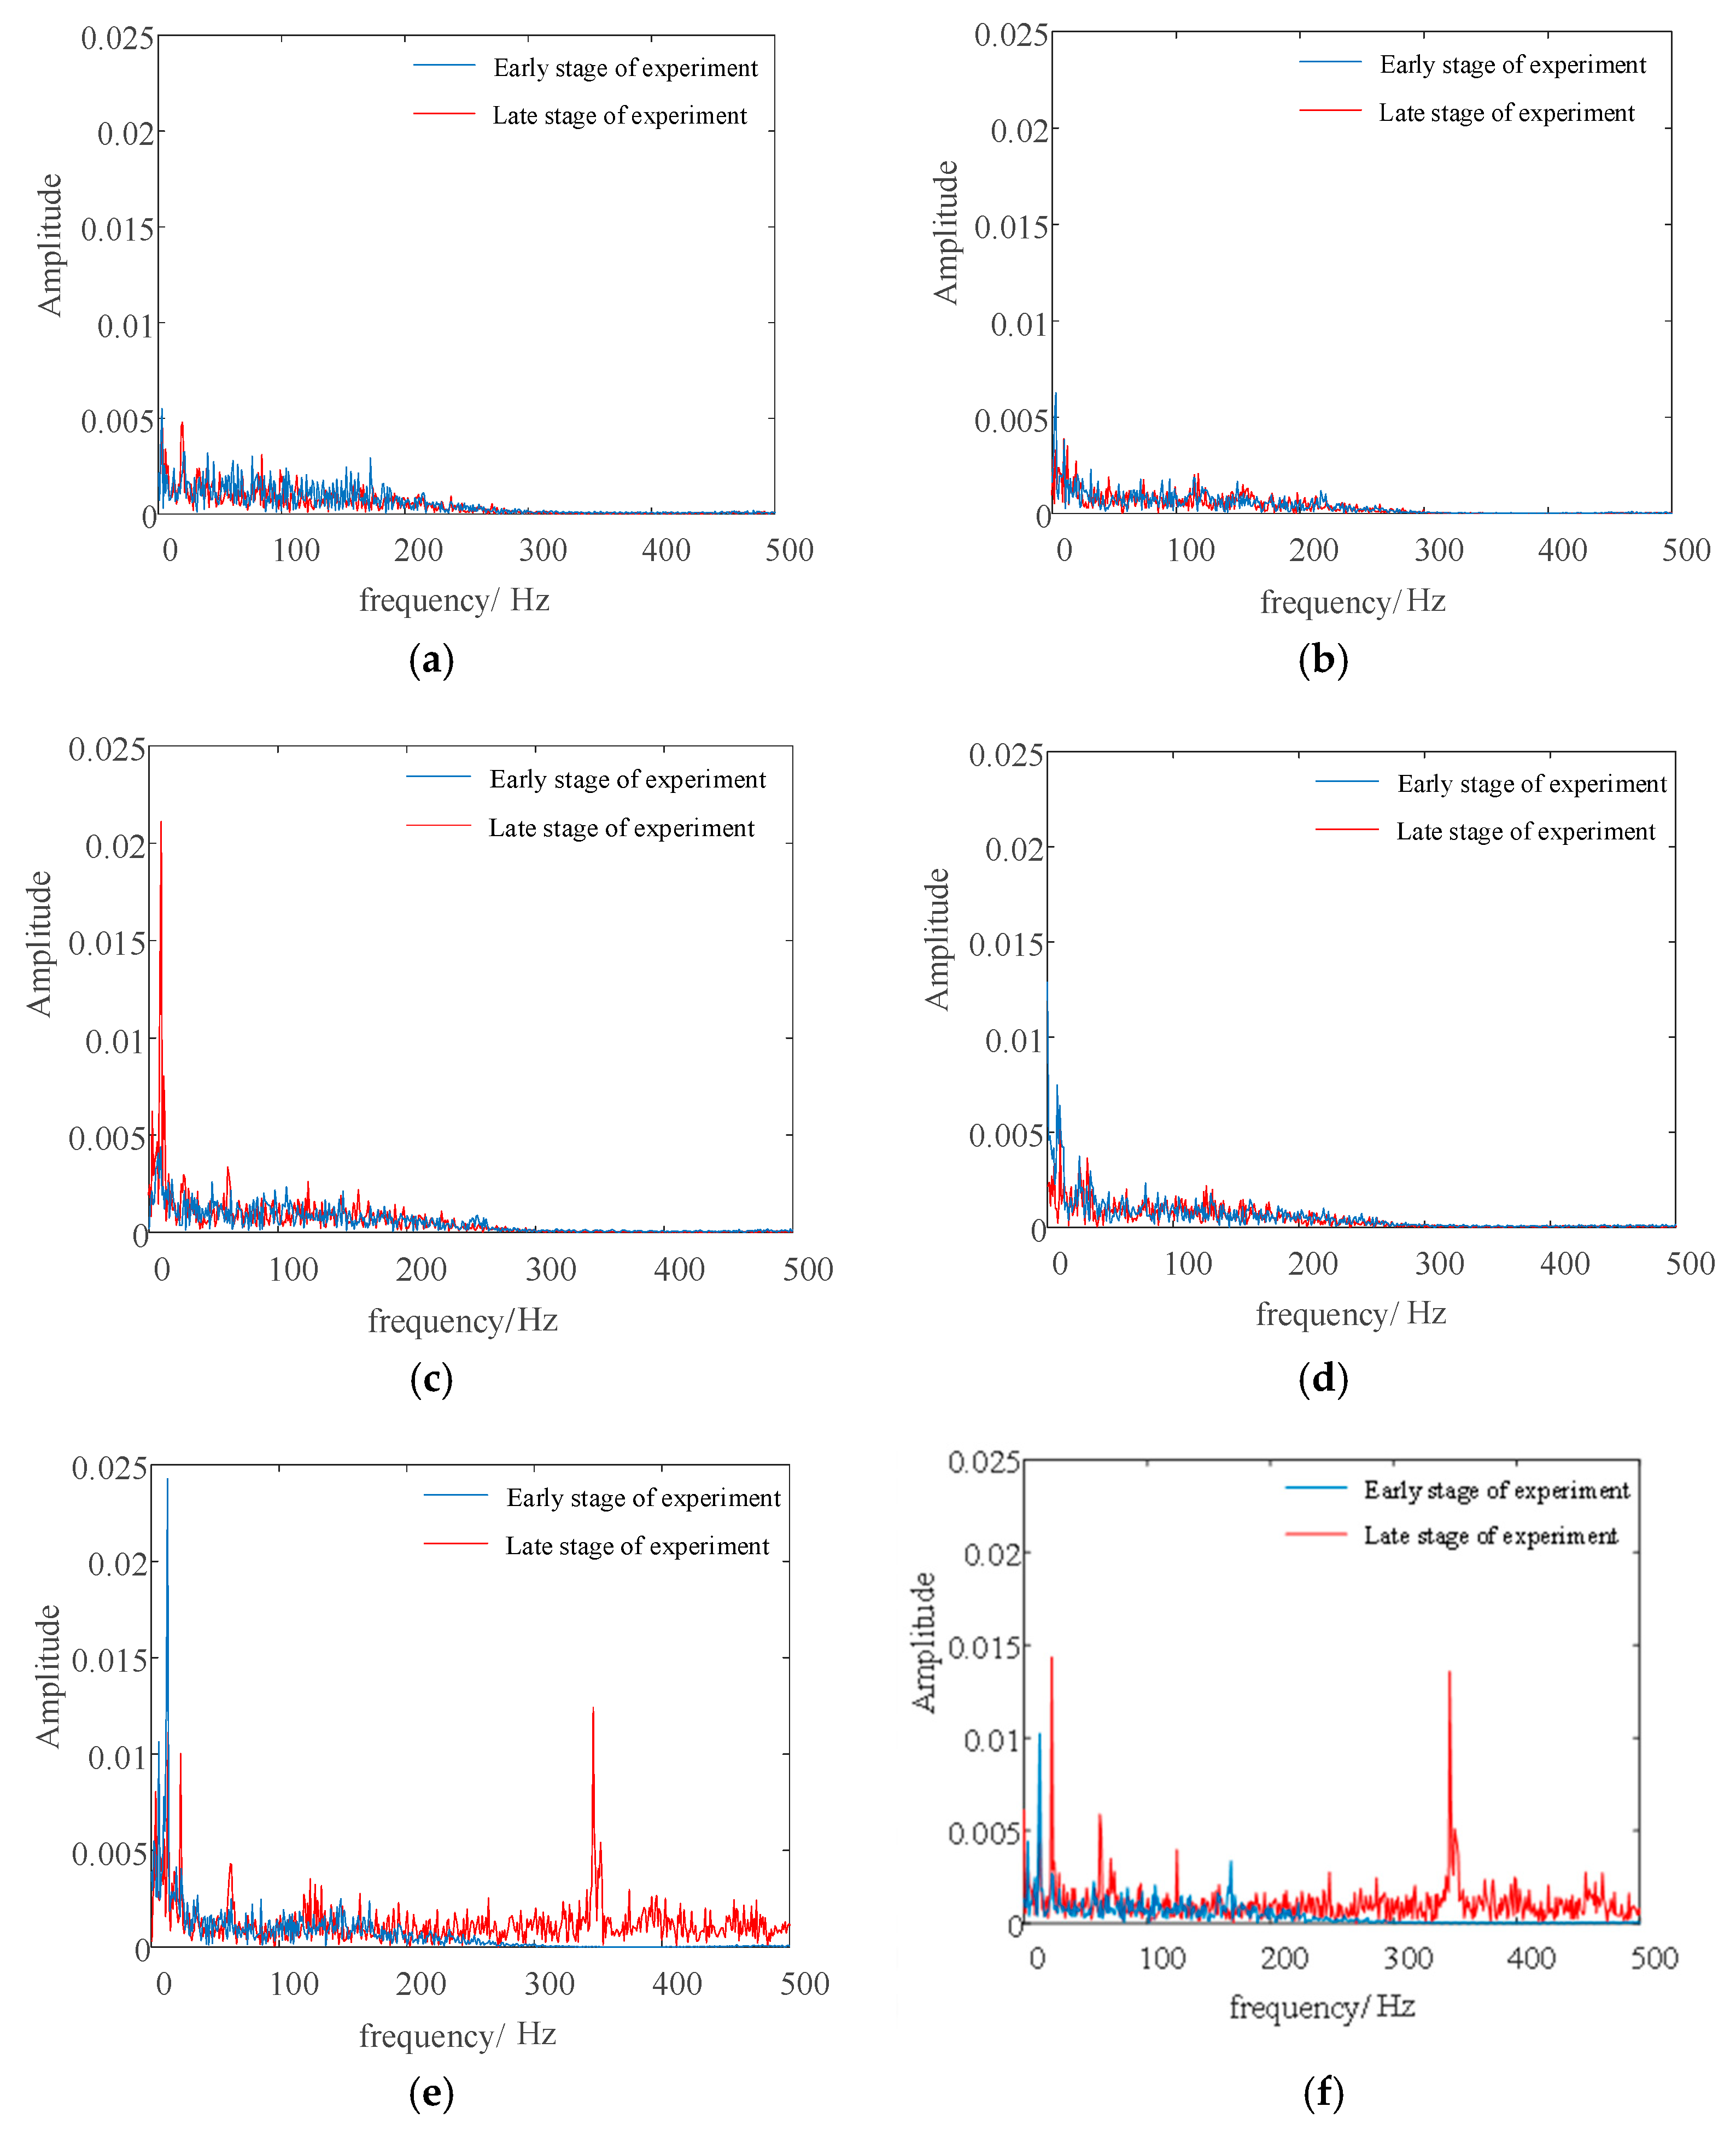
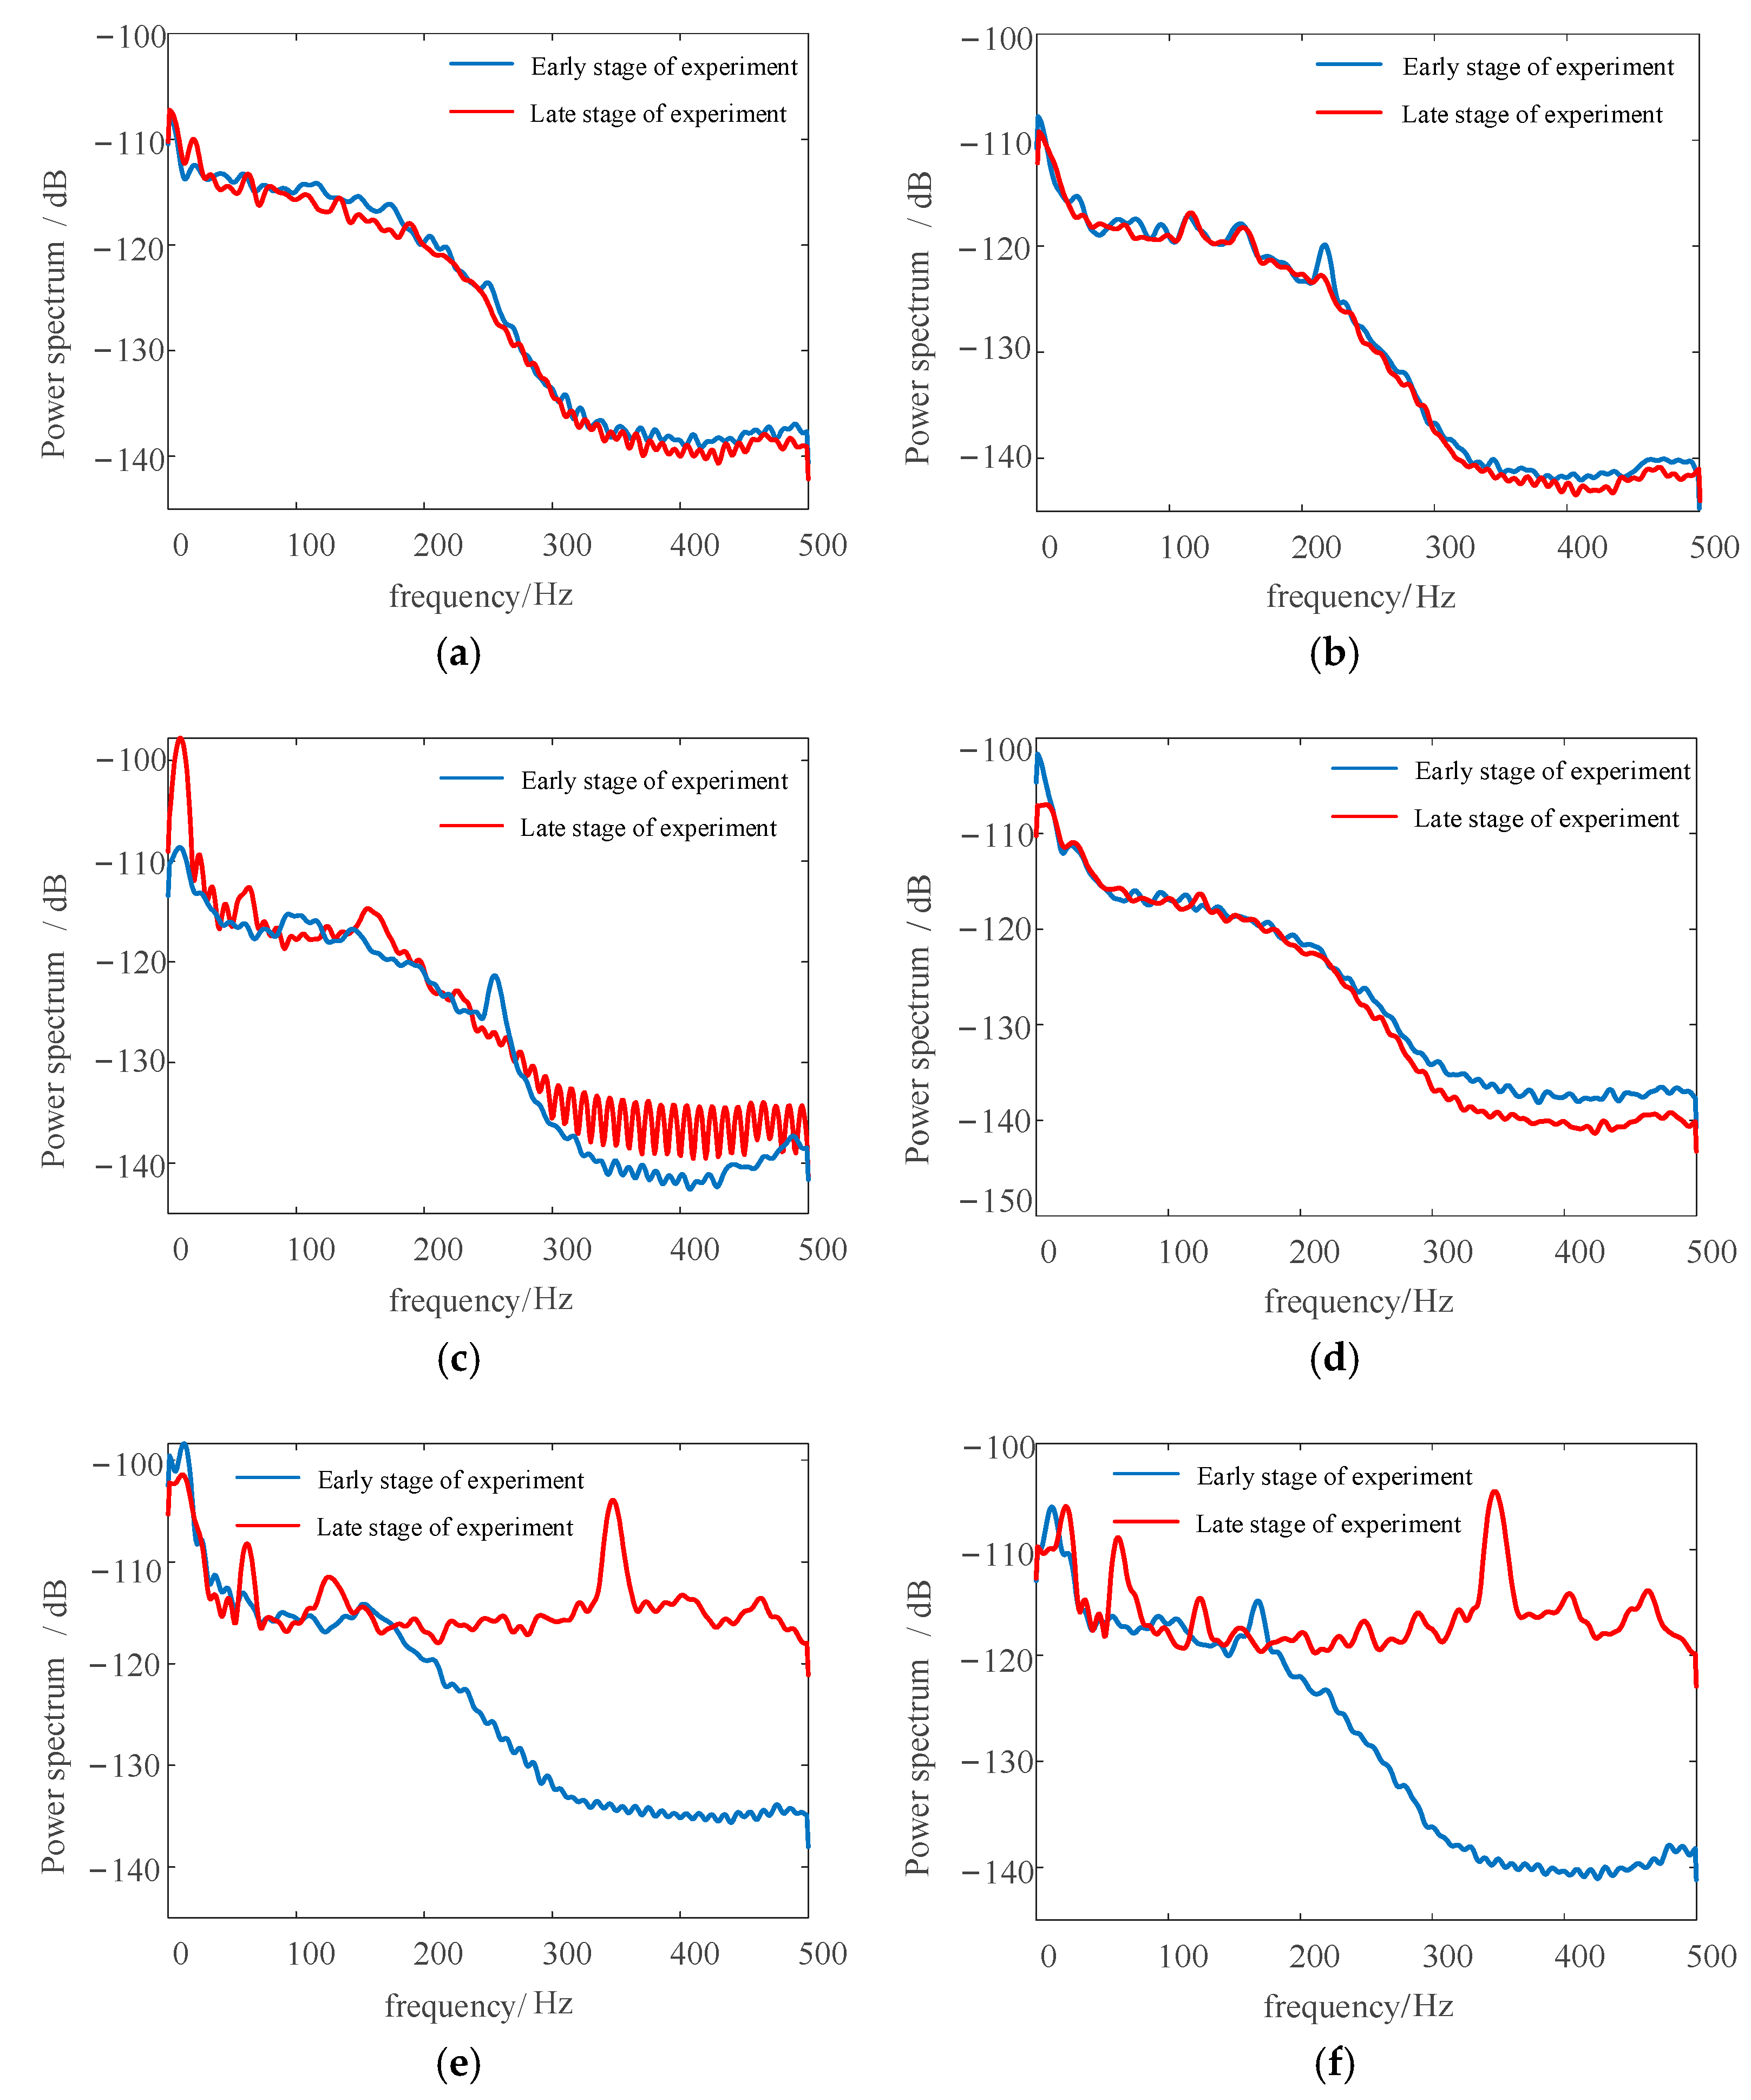
The frequency-domain analysis of the strain signal revealed that after the occurrence of the abnormal state, the amplitude of the stress at the connection position between the side plate and the top sieve increased significantly near 10 Hz, which may lead to the risk of damage. The signals of sensors No. 5 and No. 6 located on the rear sieve support plate were found to be more sensitive to abnormal signals. Thus, the strain signals at these two places can be used to test and analyze the cleaning sieve, and the damage can be determined by monitoring the presence of signals with a frequency above 300 Hz.
5. Conclusions
This article presented a durability test and analysis method for the cleaning sieve of combine harvesters based on vibration and strain signals. Via modal analysis, the positions of the cleaning sieve that are more sensitive to fault signals were determined, and a durability test bench specially used for the cleaning sieve was designed. The health state of the cleaning sieve is monitored via the analysis of the vibration and strain signals. The main conclusions of this work are as follows.
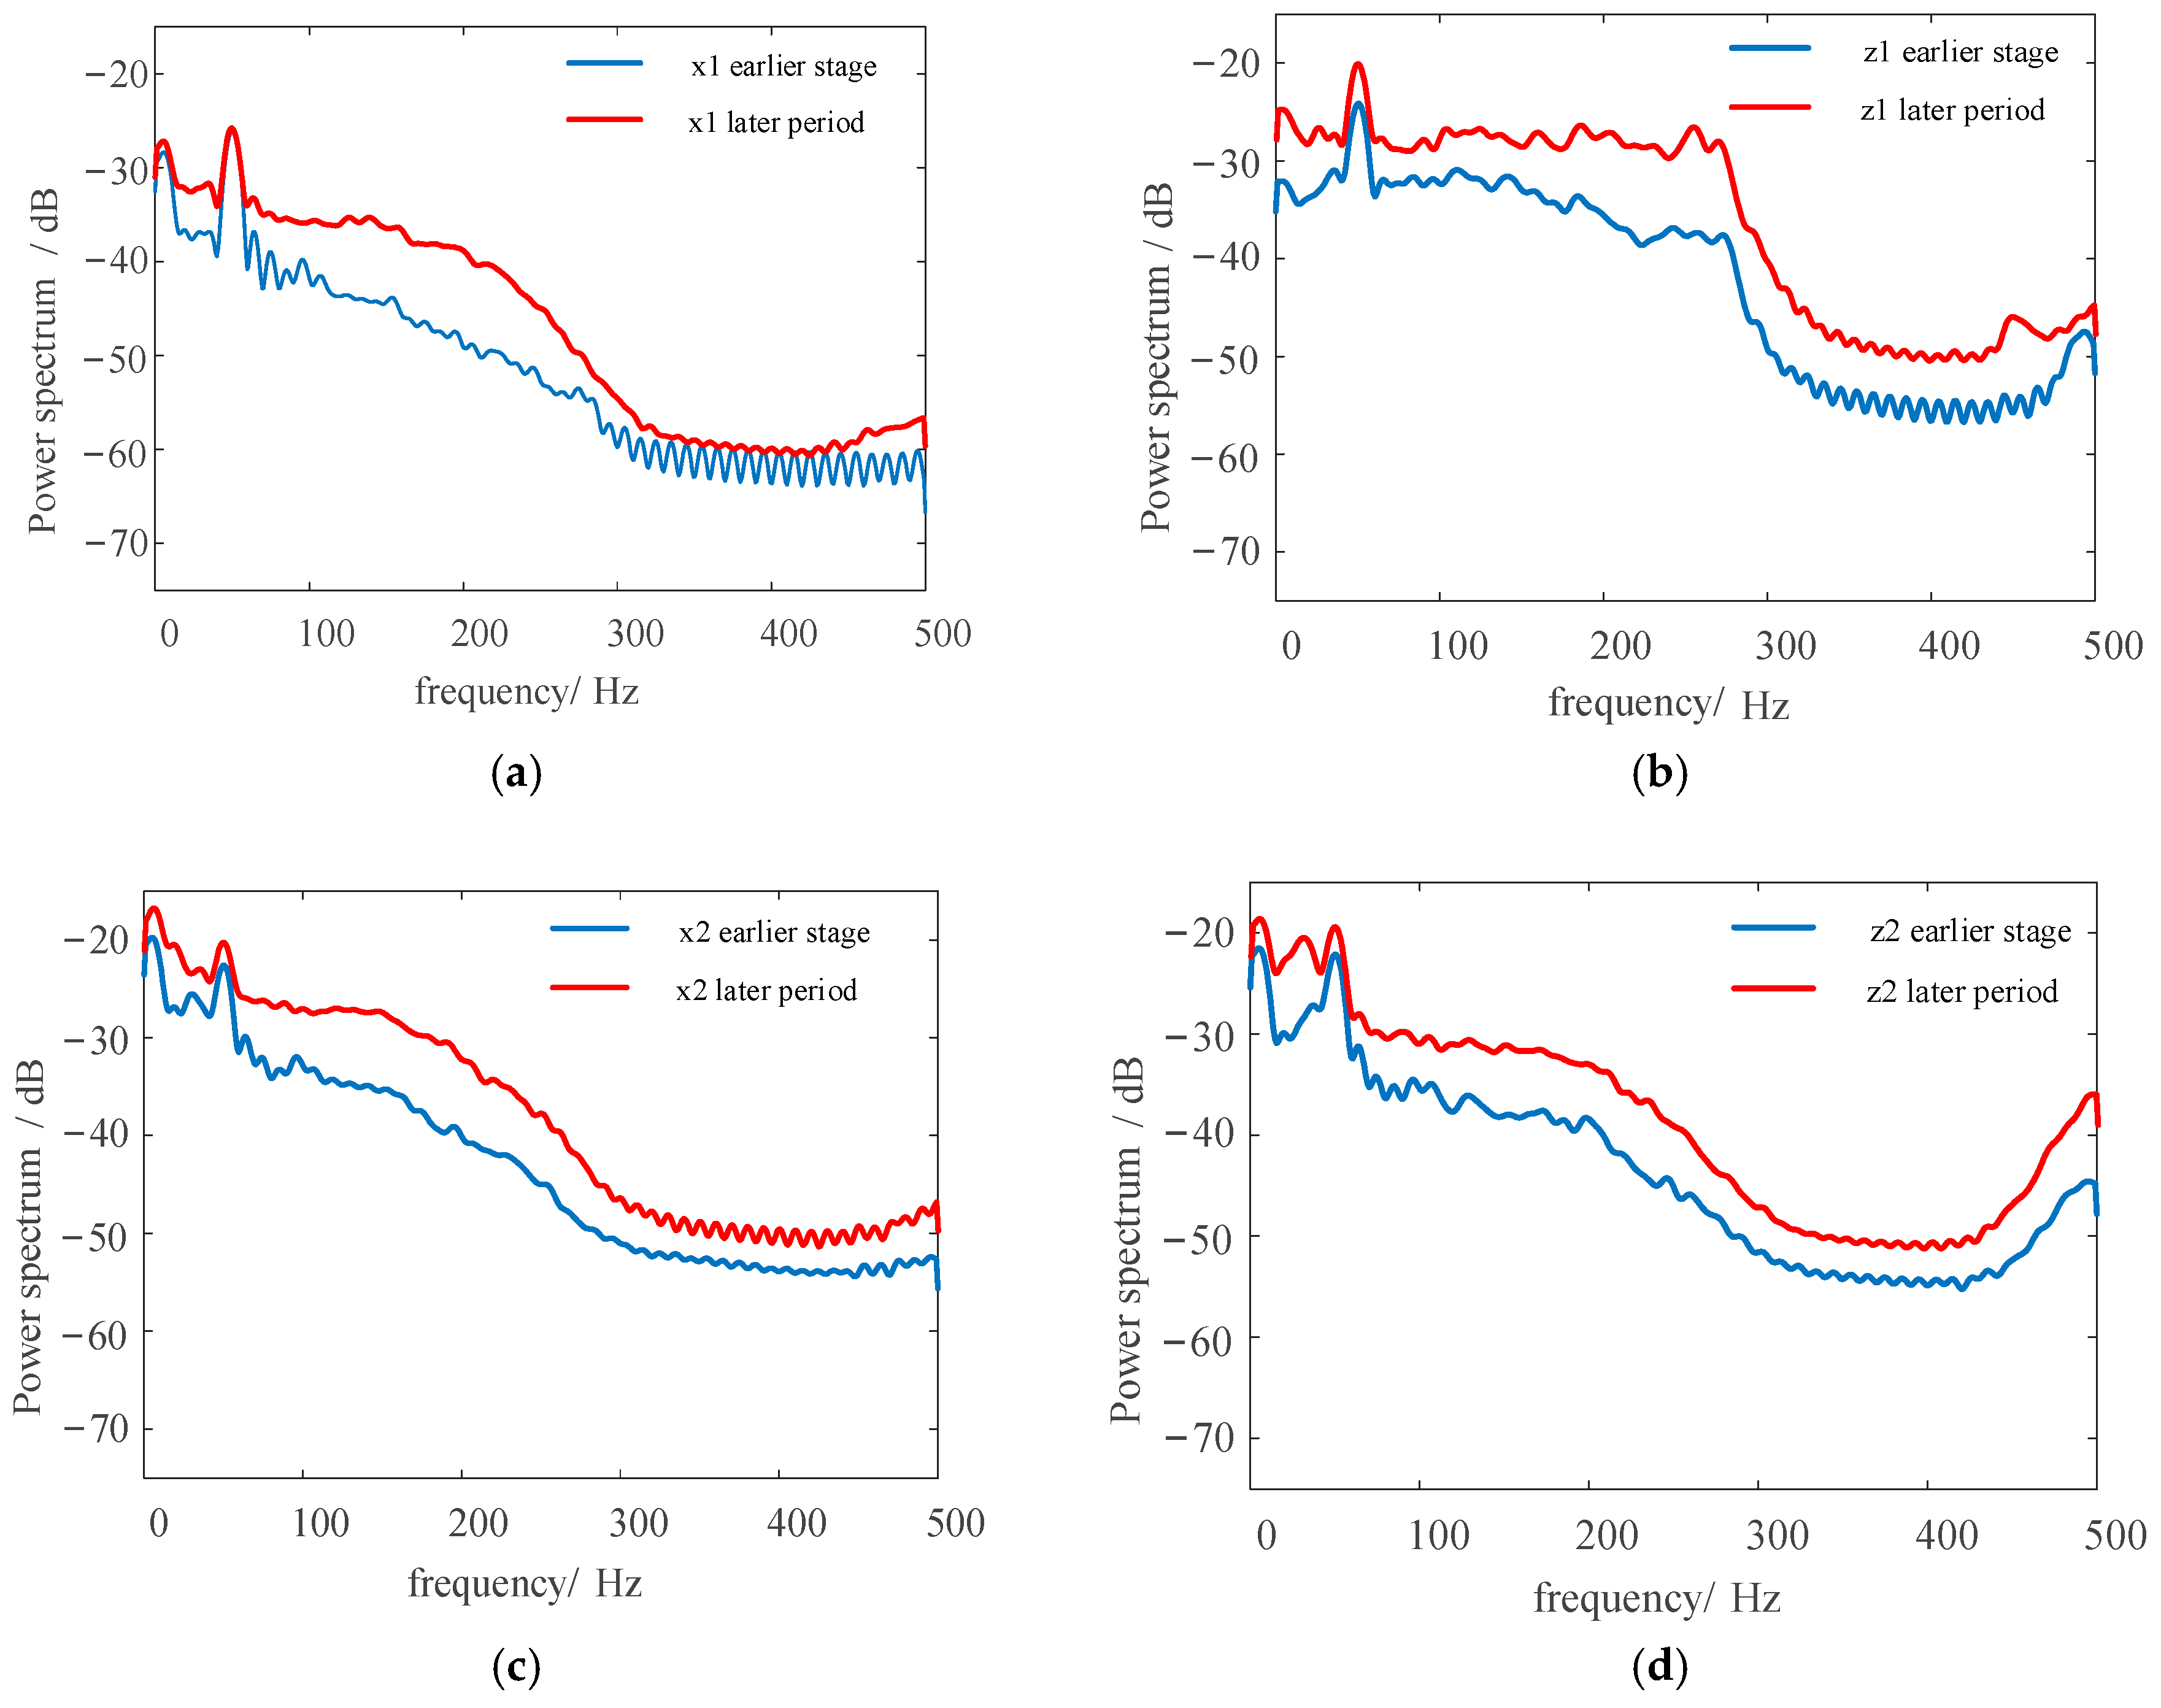
Via a finite element simulation analysis and bench test, it was found that, among the components of the cleaning sieve, the front part of the sieve frame, the shaking plate, and the baffle part of the rear sieve are greatly affected by vibration. In addition, there is also a large stress near the front bearing and the side wall of the sieve. In terms of abnormal vibration signal monitoring, the sensor near the front bearing is more sensitive in the z-axis direction, and it is also easier for the sensor near the chute plate to monitor the abnormal vibration signal in the 0–50 Hz frequency band in the x- and z-axis directions. In addition, the position of the rear sieve support plate is sensitive to abnormal strain signals. Therefore, sensors can be installed in these locations to promptly detect abnormal conditions and predict the life of the equipment, which is of great value.
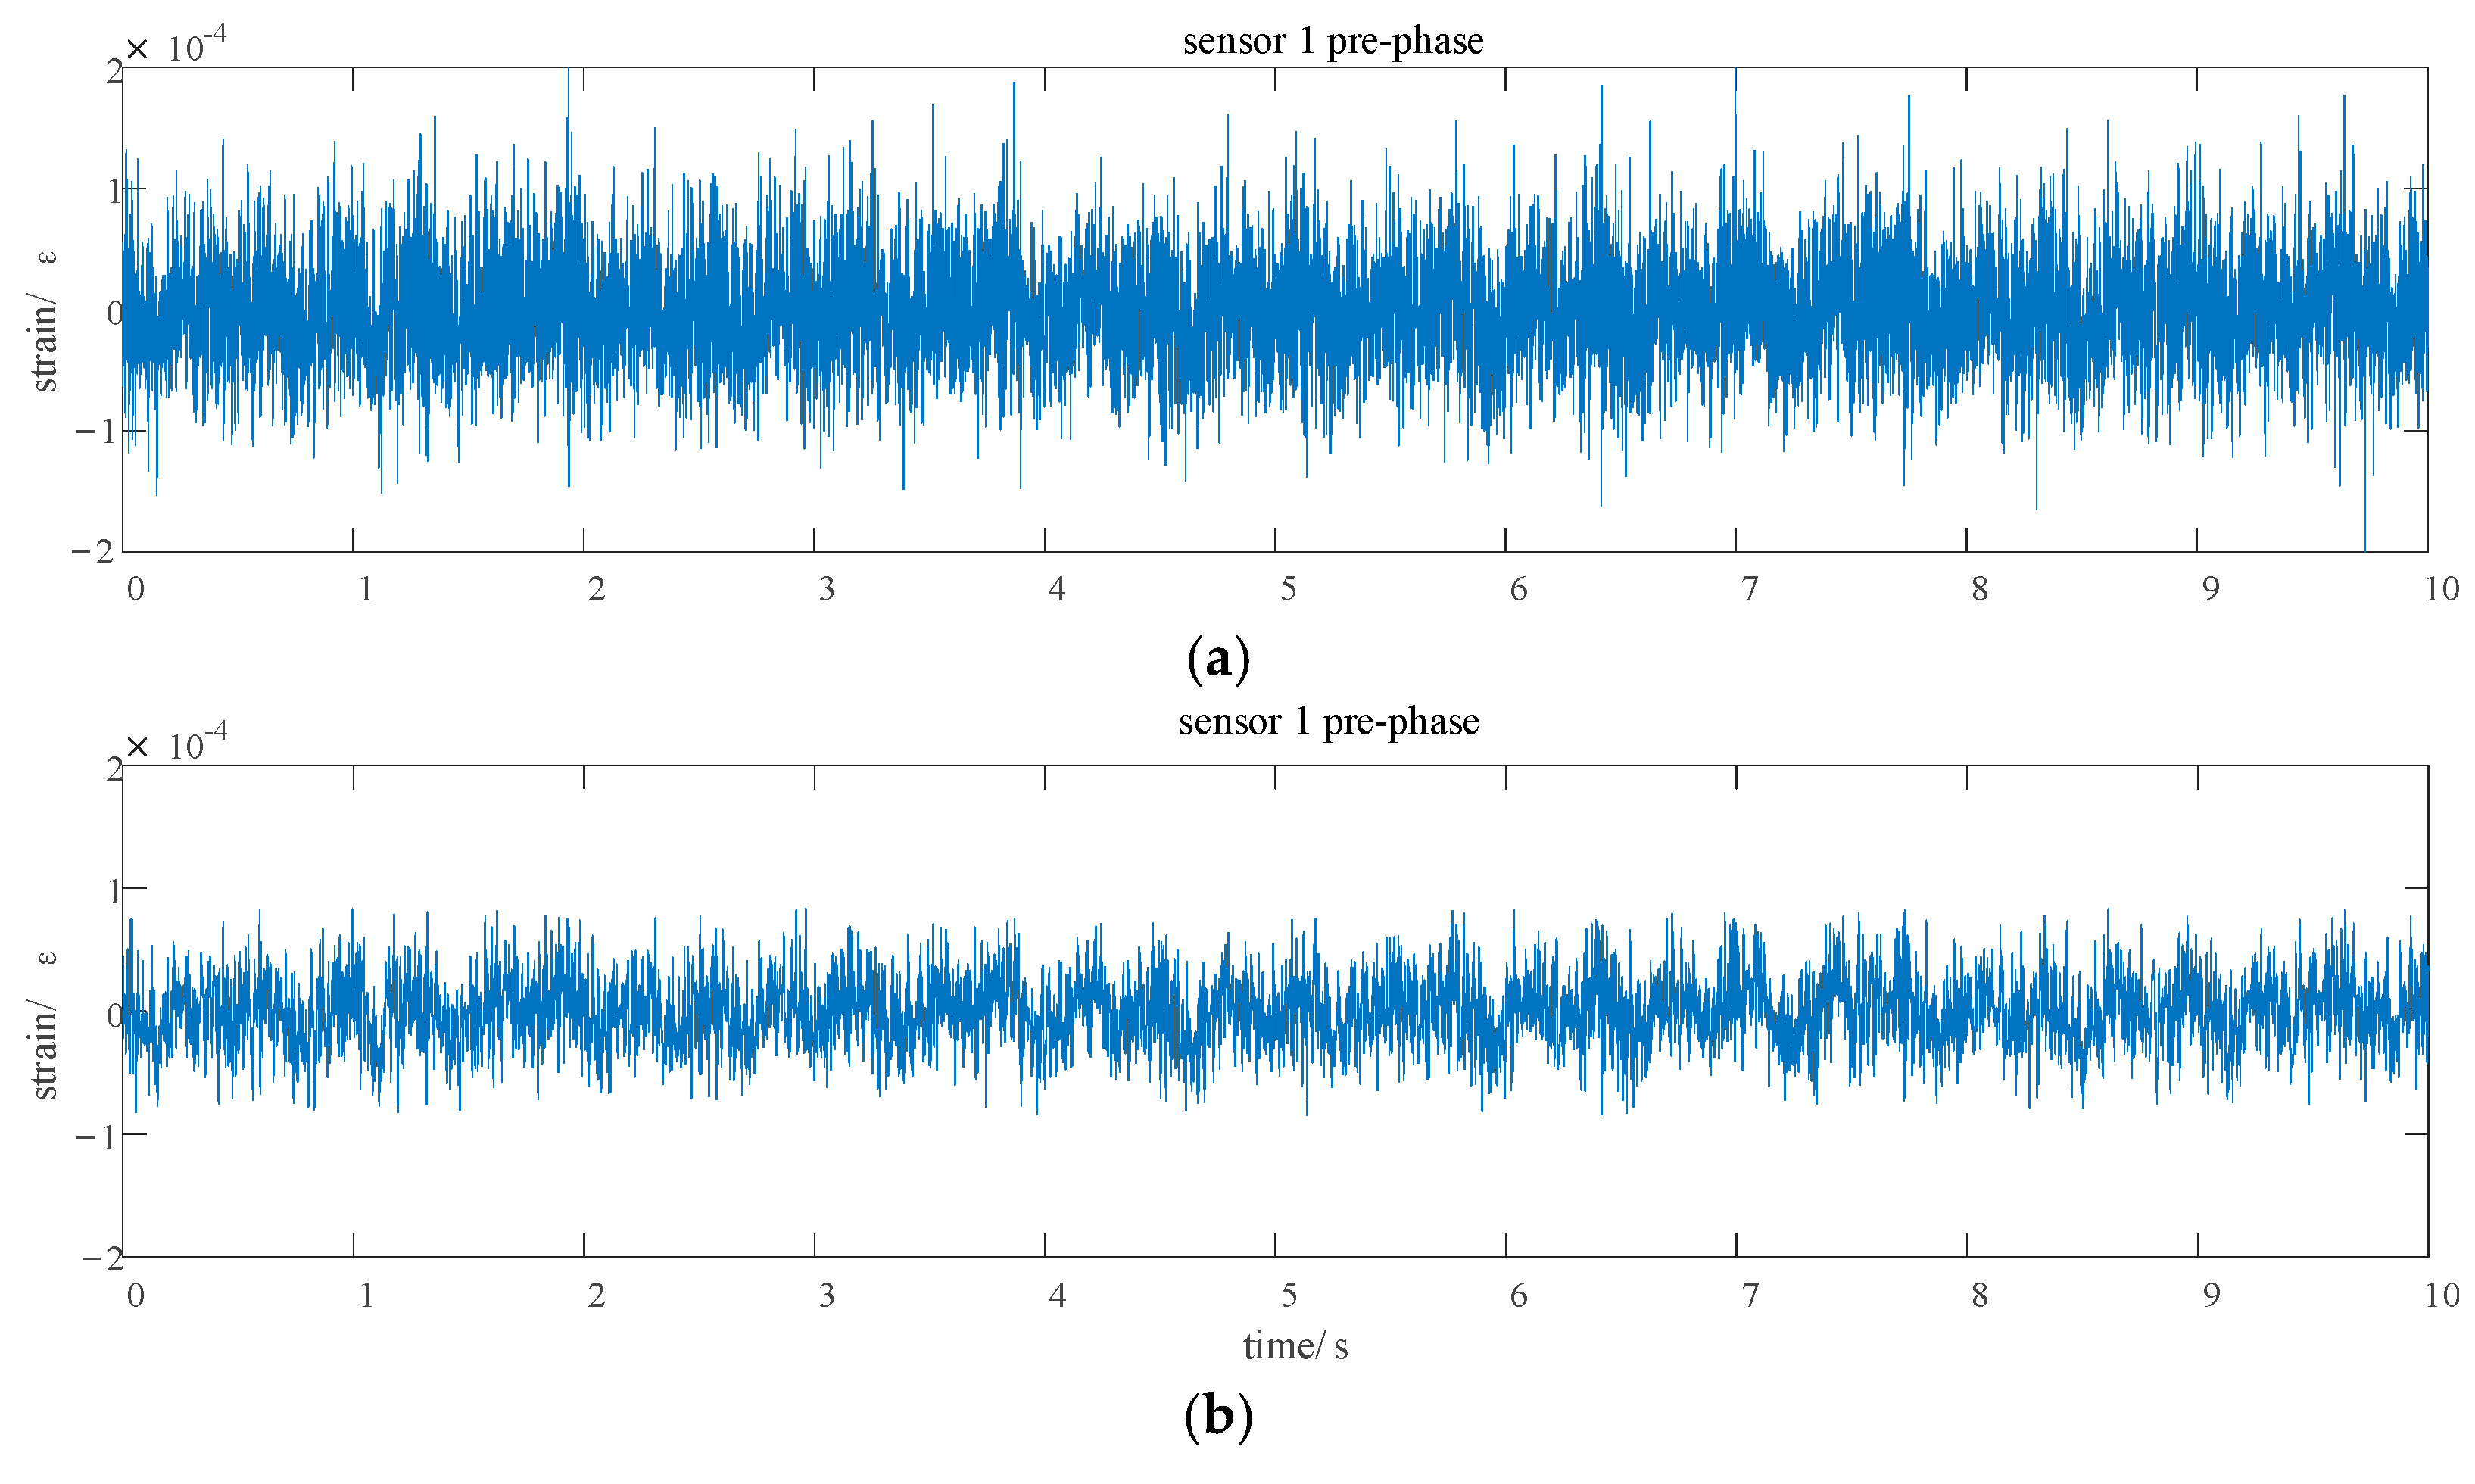
The analysis of vibration signals in the time and frequency domains revealed that the vibration signal of the cleaning sieve mainly includes the base frequency of the driving speed of 5 Hz and the frequency doubling of 50 Hz. After fault occurrence, the amplitude of the vibration signal increases significantly; in particular, the peak amplitude of the 50 Hz frequency-doubling signal increases by more than 86.3%, which can be used to detect the health of the cleaning sieve. However, the large increase in the amplitude also indicates that the motion of the sieve is more intense, which can lead to the further expansion of subsequent injury.
The analysis of the strain signal in the time and frequency domains demonstrated that the power spectrum of each sensor first decreases and then increases with the increase of the frequency. After the occurrence of the abnormal state, the amplitude of the stress received at the connection position between the side plate and the top sieve increases significantly near 10 Hz, which represents the risk of damage. The position of the rear sieve support plate has the greatest strain. Thus, this location can be monitored for signals with a frequency above 300 Hz to determine whether there is any damage.


