1. Introduction
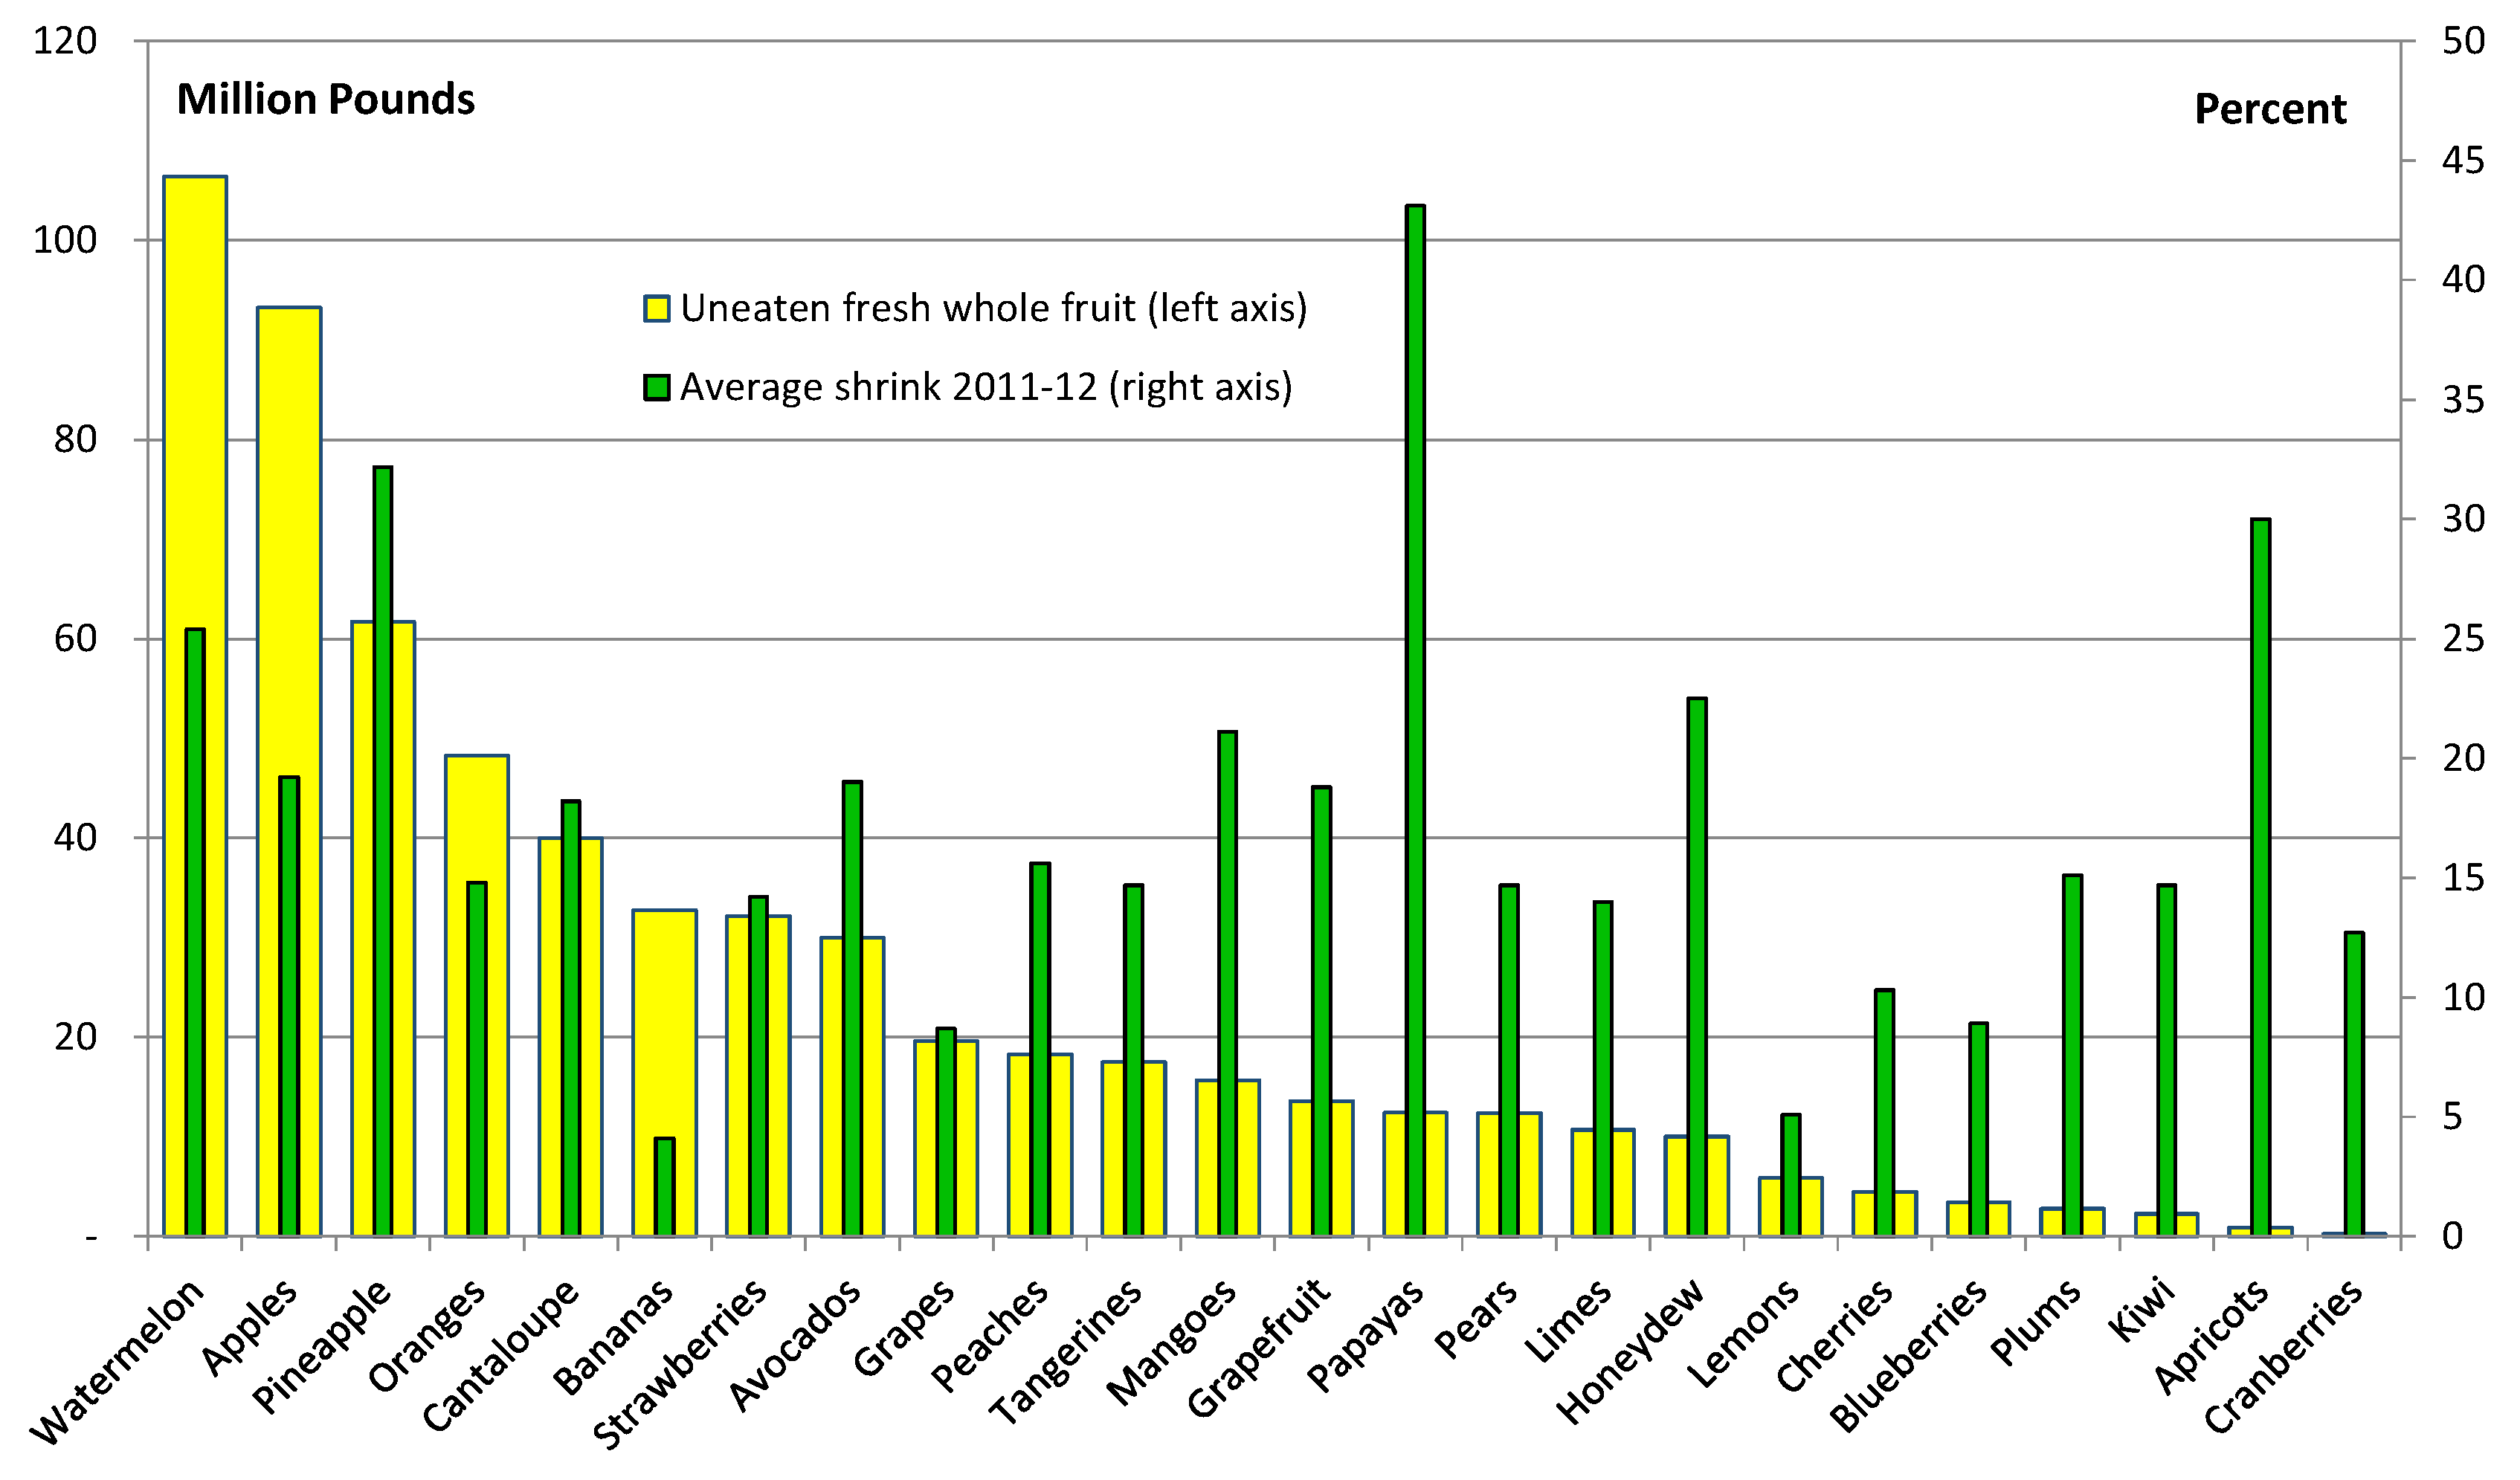
Understanding the amount of fresh fruits and vegetables that goes unsold in supermarkets is important to understanding the extent that food loss reductions could be made to increase a supermarket’s profitability. This amount could also be considered the upper bound on the potential amount of produce that could be donated to food banks and other hunger-relief organizations.
Shrinkage is a term that sometimes is used for wholesale and retail losses [
1].
Shrink is the shorthand version of shrinkage and is defined here as the produce that is delivered into supermarkets for sale but is not sold for any reason. Shrink includes both the edible and inedible portions of food (e.g., peels, pits).
Taking a broader view of all food and non-food items sold in U.S. supermarkets, the Food Marketing Institute (FMI) and the Retail Control Group analyzed the causes or drivers for shrink and estimate that 64 percent of shrink in 2012 was caused by operational breakdowns and 36 percent was caused by theft and misdeeds [
2]. These estimates are in terms of retail sales in U.S. dollars. The study size was 64 supermarket companies/chains in the United States [
3]. The
operations category (
i.e., operations breakdowns) includes loss due to ordering inefficiencies, production planning, product handling errors, employee/cashier errors, poor rotation, damaged/unsaleable goods, scanning errors by cashier, and accounting errors. The
theft category includes loss due to shoplifting, cashier theft, general employee theft, and vendor theft [
2] but “these are all high ticket items that are also in demand. Items like: razor blades, family planning items, high end creams, tobacco, liquor,
etc.” [
3]. The shrink for produce departments was the second-highest shrink by department (after the meat department) contributing to 16 percent of total store shrink. The average total shrink for produce departments was 4.8 percent of retail sales. Theft is a problem for the meat department and the relatively high prices per pound for meat department items compared to the prices per pound of foods items in other departments (e.g., items in the produce department) may make shrink look relatively worse for meat department items when calculated in terms of retail sales. The shares of these estimates specifically for food loss of produce, in general, and for damaged/unsaleable produce were not specified.
Food loss is a much narrower concept than shrink. The U.S. Department of Agriculture’s Economic Research Service (USDA/ERS) defines
food loss as the edible amount of food, postharvest, that is available for human consumption but is not consumed for any reason. It includes cooking loss and natural moisture loss; loss from mold, pests, or inadequate climate control; and food waste. ERS uses the term food loss since it represents a broader category of components in the data than the term food waste and because food waste is a value-laden term—a term that doesn’t reflect the remaining economic value in some products (e.g., value for feeding animals, composting, or to make biofuels). Because retail-level food loss estimates are lacking in the United States for all of the individual commodities in the ERS Loss-Adjusted Food Availability data (LAFA) series, ERS uses supermarket shrink estimates (
i.e., rates) for individual fresh fruits, vegetables, meat, poultry, and seafood to represent food loss at the retail level for these foods [
4]. The primary purpose of this data series is to provide estimates of food availability as a proxy for consumption in the United States for roughly 215 commodities. The LAFA series is also used to estimate the amount, value, and calories of food loss at the retail and consumer levels in the United States [
5,
6,
7]. Currently, ERS uses 2005–06 shrink estimates for 24 individual fresh fruits and 31 individual fresh vegetables in U.S. supermarkets in the LAFA data series documented in Buzby
et al. [
8] (Buzby
et al. (2009) predominately use the term “food loss” because the shrink estimates are used as food loss assumptions in LAFA but here, we use the term
shrink because it is the more precise term for what the current data collection captures). This study found that annual supermarket shrink in the United States for 2005 and 2006 averaged 11.4 percent for fresh fruit and 9.7 percent for fresh vegetables by weight (
i.e., not value of retail sales). The primary purpose of the current study is to help determine which fresh fruits and vegetables have the highest amount of food loss and thus would be potential candidates for loss-reducing strategies (
i.e., technologies and practices, such as better inventory management systems). The shrink estimates for these fresh fruits and vegetables may be used in the future by ERS to update the underlying 2005–2006 retail-level loss assumptions in the LAFA data series.
Reliable U.S. food loss data for each fresh fruit and vegetable in LAFA at the retail level is not available and thus supermarket shrink for these commodities is used as a proxy. We recognize that using produce shrink estimates as a proxy for food loss is a limitation to some unquantified extent. Shrink is a broader category than food loss as described above and includes several components that have little relevance to food availability, loss, or waste (e.g., theft). Thus, shrink is an upper bound for food loss. Given the perishable nature of fresh fruits and vegetables, we presume that food loss is a large component of supermarket shrink for these items and that supermarket shrink for fresh produce is an adequate proxy for food loss of fresh produce items at the retail level. Supporting this notion is the finding that the meat department and the produce department were the two departments found to have the highest shrink in the FMI study—and that these and perhaps the dairy, bakery, and deli departments are those departments with the greatest relative perishability of all supermarket or retail departments leading us to assume that food loss is a major component for these departments. In the future, greater information about shrink, such as the ultimate destination of product counted as shrink, would help clarify the appropriateness of shrink as a proxy for food loss. For example, theft of fresh fruit and vegetables may ultimately lead to the consumption of these products so stolen product would not be considered food loss. However, with that said, produce is not a high ticket item, relative to meat, poultry, and seafood and many other non-food products in supermarkets: the implication is that theft is likely not a notable issue for fresh produce.
1.1. Aim and Scope of This Study
This article provides two kinds of data and information on fresh fruit and vegetables in U.S. supermarkets. First, this article provides estimates of the percent or share of shrink for 24 individual fresh fruit and 31 individual fresh vegetables in U.S. supermarkets in 2011 and 2012. Second, this article provides ERS estimates of the amount of retail-level food loss for these fresh fruits and vegetables using the new shrink estimates in the LAFA data series.
1.2. Definitions and the Difficulty Comparing Findings across Studies
Definitions of food loss and waste vary among studies worldwide and this complicates the comparison of estimates and the identification of trends [
5]. Recognizing the variation in food loss and waste definitions (and sometimes the same term has different meanings) and that there are benefits to a harmonized approach, the United Nation’s Food and Agriculture Organization (FAO) Global Initiative on Food Loss and Waste Reduction published a 2014 working paper that provides a draft definitional framework for food loss as a global reference for stakeholders [
9]. This 2014 FAO working paper defines
food loss as the “decrease in quantity or quality of food” where quantitative reductions are decreases in mass/weight (p. 3) and qualitative reductions are decreases in “nutritional value, economic value, food safety, and/or consumer appreciation” [
9] (p. 2). This FAO working paper considers food waste an important although not sharply distinguished component of food loss and indicates that
food waste “refers to the removal from the FSC (food supply chain) of food which is fit for consumption, by choice, or which has been left to spoil or expire as a result of negligence by the actor–predominantly, but not exclusively the final consumer at household level” [
9] (p. 4). Previously, FAO distinguished food loss as occurring from the producer through manufacturing/processing and food waste as discards later in the food supply chain (
i.e., from retail to consumption (e.g., [
10] citing [
11]). Another study defines food waste as “any solid or liquid food substance, raw or cooked, which is discarded, or intended or required to be discarded. Food waste includes the organic residues (such as carrot or potato peels) generated by the processing, handling, storage, sale, preparation, cooking, and serving of foods” [
12]. The current study focuses solely on the quantitative loss in terms of pounds and percent shrink. It does not provide information on the value of shrink and food loss, the shrink percentages in terms of sales or calories, or the natural and monetary depreciation of fresh produce over time.
In addition to the lack of common definitions, there are other factors which make it difficult to precisely and meaningfully compare the data and information across studies. Not only are there different definitions of the measured variable (e.g., shrink, food loss, and food waste) but studies may also use different reference bases (e.g., volume of sales
vs. food supply values
vs. quantities or weight delivered; edible
vs. non-edible food), and different areas of coverage (e.g., stages in the farm-to-fork chain, such as at the farm, retail, or consumer levels, or the specific fruits, vegetables, and mixtures covered) in the analyses. For example, Kader [
13] provides loss estimates for fruits and vegetables “between production and consumption sites” and not specifically at supermarkets.
Additionally, data in other studies may not be sufficiently disaggregated for comparison with the estimates for individual fruits and vegetables provided here. For example, Nahman and De Lange [
14] provide estimates of the amount of food waste along the value chain in South Africa but do not provide loss estimates for individual foods, only food groups (e.g., fruits and vegetables combined). Additionally, Nahman and de Lange provide estimates for the ‘distribution’ stage and not for the retail level specifically. However, some studies delve deeper into individual commodities and provide a wealth of data and technical information, such as for papaya loss by Paull
et al. [
1].
The Waste Resources Action Programme (WRAP) in the United Kingdom analyzes food and drink waste along the food supply chain. Some WRAP studies place food losses in three categories: unavoidable, possibly avoidable, and avoidable waste [
15] while other WRAP studies use two categories (
i.e., unavoidable and avoidable) [
16]. Some other studies use these or similar categories, such as Beretta
et al. [
17], which use unavoidable, possibly avoidable, and avoidable “losses”. Even if it was possible to compare WRAP’s unavoidable category with the non-edible portions (e.g., peach pits, bones, and peels) in the LAFA data series, U.S. data and information is lacking to disaggregate the U.S. food loss estimates into possibly avoidable and avoidable loss or waste. Additionally, food loss comparisons across studies can be hindered when one study includes multi-ingredient foods (e.g., lasagna) and another only includes individual commodities (e.g., wheat flour, beef, and eggs). Also, studies may handle the inclusion of the packaging weight differently.
1.3. The Causes of Produce Loss and the Retail Environment
As background,
Box 1 provides examples of the causes or drivers for the narrower categories of food loss and waste in developed countries at the retail level (e.g., in supermarkets). Some of these may occur at more than one stage of the farm-to-fork chain (e.g., spoilage can occur at each stage) and many are similar across developed countries (e.g., consumer confusion over date labeling). Whereas, some causes have greater variation, such as the socio-demographic characteristics and cultural traditions manifested through individual behavior [
5]. For example, one study found that Spanish retail managers did not perceive food waste as an important problem, whereas managers in the United Kingdom were more conscious and concerned about food waste [
18].
Box 1. Causes or drivers for food loss and waste at the retail level in developed countries.
Consumption or damage by insects, rodents, or microbes (e.g., molds, bacteria) [
19],
Un-purchased holiday foods,
Damage due to poor or excessive handling (e.g., bruised fruit due to rough handling) and spillages (e.g., apples accidentally dropped to the floor),
Dented cans and damaged packaging (e.g., crushed containers of blueberries).
Damage from inappropriate packaging (e.g., abrasion which bruises or otherwise damages produce) [
11],
Produce packaging (i.e., if some fresh apples within a bag are rotten and cannot be removed, the whole bag may be discarded),
Product-specific issues that decrease the longevity of certain foods, such as exposure to light leading to in-store food waste [
20],
Supply chain inefficiencies, such as poor coordination between manufactures, distributors, wholesalers, and retailers leading to food waste and potentially shifting food waste across the supply chain [
20],
Damage from equipment or technical malfunction (e.g., faulty cold or cool storage) [
19],
Damage from excessive or insufficient temperature (e.g., inadequate cold or cool storage or when the temperature settings are inappropriate) [
19],
Sprouting (e.g., tubers) and biological aging in fruit, [
19], vegetables, and other fresh foods.
Seasonal factors, such as heat damage during harvest, transportation, or display near the retail store doors where fresh produce is more exposed to outside temperatures,
Out of shelf life product [
18] in depot (e.g., imported produce expired in transit) or in store (e.g., expired packaged salads) [
21]
Difficulty predicting number of buyers/customers leading to overstocking or over-preparing,
Insufficient shelf space available [
18],
Consumer confusion over “use-by” and “best before” dates and other date labeling [
20], which can result in the discard of edible, within-date, packaged food. (See [
22] for more information on date labeling.)
Marketing standards [
20] and out-grading of blemished, misshapen, or wrong-sized foods by retail stores in an attempt to meet consumer demand for high quality, cosmetically-appealing, and convenient foods,
Consumer demand for high cosmetic standards leading to produce going unsold,
Some promotions by retailers can cause food waste in retail stores due to reduced forecasting accuracy [
18] or later at the consumer level if more food with short-shelf life is purchased than can be eaten (e.g., buy one get one free promotions),
Unsold fragile produce at the end of the day.
Shrink to retailers means lost revenue and decreased profitability. Therefore, retailers in developed countries routinely incorporate strategies to reduce shrink, food loss and waste. For example, Saucede
et al. [
23] found that department upkeep (
i.e., state of displays experienced by shoppers) and shrinkage control are the two important variables to optimize the performance of retail produce departments in France. Shrinkage control in Saucede
et al. [
23] mostly refers to internal actions by retailers, such as retailers removing produce damaged by shoppers’ sorting and handling when making their selections so that the department displays remain attractive to shoppers. The handling of produce and sometimes destructive testing for ripeness at the grading stage or by consumers can accelerate product deterioration and lead to high levels of waste. For example, avocadoes can be damaged when tested for ripeness [
24]. Vigneault
et al. provide greater background on temperature, humidity, and other factors affecting produce quality and systems to preserve quality during transportation, many of which have implications later in the supply chain [
25]. Tight inventory control (
i.e., stock management) and good coordination between manufacturers, wholesalers, distributors, and retailers can help reduce food waste [
20]. Mena
et al. [
18] provide a more complete description of trends in the marketplace, natural causes of food waste, and management-related causes that can be acted upon to reduce spoilage (e.g., training retail staff about good practices for stock rotation and handling).
It is important to understand that some level of food loss may be economically justifiable and it is unrealistic to think that food loss will ever be entirely eliminated [
7] and the same could be said more specifically for supermarket shrink in produce. Technical factors (e.g., perishable nature of most foods), spatial factors (e.g., time and distance to food markets or food banks), and economic factors limit how much food supermarkets and other food retailers can realistically reduce or prevent, recover and donate for human consumption, or reuse for an alternative purpose (e.g., composting, energy generation). Some loss is inevitable because spoiled, deteriorated, or potentially contaminated food must be discarded to ensure the safety and wholesomeness of the food supply. For example, at the end of the day, any leftover cut-up fresh fruit offered as samples to supermarket shoppers are appropriately discarded out of health considerations. Also, some meat, poultry, and other foods are recalled when there are health or safety concerns. Additionally, supermarkets may see a decrease in their marginal or incremental returns or benefit of implementing additional food-loss reducing technologies and practices (
i.e., diminishing returns). Supermarkets will adopt new food-loss reducing technologies and practices when it makes economic sense to do so.
1.4. Earlier Studies on Food Loss and Waste at the Retail Level
There are few peer-reviewed articles on national food loss and waste for developed countries and the estimates that do exist vary widely [
11]. This is particularly true for articles on food loss or waste generated on farms [
26] and at the food manufacturer/retail level more broadly [
18,
27] and for the subset of articles on national fresh produce loss and waste at the retail level. There are also data gaps by individual causes of food loss and waste. The amount of food loss and waste worldwide is substantial. Gustavsson
et al. estimate that global food loss and waste tally about 1.3 billion tons per year or about one-third of all food produced for human consumption [
10]. According to a food waste study for the European Commission, food waste generated in the EU27 totaled around 89 million mt in 2006, using EUROSTAT data and available best estimates by member states [
20]. Of this amount, 3.8 million mt were for the wholesale/retail sector and the remainder was for three other sectors (manufacturing, food service/catering, and consumer). (Retail estimates were not provided separately from wholesale.) In another study on the EU27, estimated food loss and waste in the wholesale/retail sector was 3.6 percent of the total losses in the supply chain but data was limited for this sector so the authors emphasize that this estimate should be treated with caution [
28]. In the United States, some studies (such as those by ERS) have focused on food loss as defined previously (
i.e., which is broader than food waste). For example, a recent ERS study found that in the United States, food loss accounted for 31 percent—or 133 billion pounds—of the 430 billion pounds of the available food supply at the retail and consumer levels in 2010, and of this amount, retail-level losses represented 10 percent (43 billion pounds) [
7].
Another study in the United States narrowed the focus to food waste. The Food Waste Reduction Alliance contracted with BSR to conduct an analysis of food waste in the United States among food manufacturers, retailers, and wholesalers (The Food Waste Reduction Alliance (FWRA) is an industry-wide initiative in the United States to address food waste in food manufacturing, retail stores, and restaurants. The Grocery Manufacturers Association (GMA), the Food Marketing Institute (FMI), and the National Restaurant Association (NRA) lead this effort). This study defined food waste as “any solid or liquid food substance, raw or cooked, which is discarded, or intended or required to be discarded. Food waste includes the organic residues (such as carrot or potato peels) generated by the processing, handling, storage, sale, preparation, cooking, and serving of foods” [
12] (p. 5). The BSR study estimates that the total amount of food waste in both retail and wholesale sectors in the United States combined was 3.8 billion pounds. Of this amount, 55.6 percent or 2.1 billion pounds was diverted from landfills and incineration to higher uses,
i.e., donations (17.9 percentage points) and recycling (37.7 percentage points). Data in the study is extrapolated from 10 retailers and 3 wholesalers, representing 30 percent of those U.S. industries by revenue. The study does not provide information for individual commodities and does not provide information for retailers separately [
12].
There are some national studies or sources of data. For example, 2013–2014 supply balance sheet spreadsheets by Statistics Austria provide loss estimates for individual foods available for domestic consumption (e.g., 728 tonnes of cauliflower) and for aggregated food groups (e.g., 168,752 tonnes for all vegetables) though the data do not reveal what share of these losses represents edible food or where the losses occur along the farm-to-fork chain [
29]. Greater detail on the extent of food loss and waste by world region can be found in a report by the High Level Panel of Experts on Food Security and Nutrition [
30].
Looking more closely at the literature on food loss and waste for fresh fruits and vegetables, Mena
et al. [
24] provide estimates for ‘retail loss and waste’ as a percent of total weight for 11 select fruits and vegetables categories in the United Kingdom, ranging from 0.5–1 percent for onions to 2.5–5 percent for avocadoes. Meanwhile Eriksson
et al. [
31] estimated that in six Swedish retail stores, fruit and vegetables wasted in relation to quantities delivered was 4.3 percent by mass. Gustavsson and Stage [
27] provide retail-level waste estimates for 16 popular fruits and vegetables in Sweden as a percent of sales, and found that small stores are more prone to higher produce waste than larger stores. Lebersorger and Schneider [
32] estimate that food loss accounts for 4.2 percent of sales of fruits and vegetables in retail outlets in Austria. (This study also provides a more thorough comparison of retail-level loss estimates worldwide.) Beretta
et al. [
17] (p. 770) estimated that in Switzerland, fruit and vegetable losses in retail stores comprised 8 to 9 percent by calorific content. They also report that less than 1 percent (0.35 to 0.44 percent) of delivered product are lost due to transportation damage, spoilage, and unsatisfactory quality and caution that most substandard produce are sorted out earlier in the food supply chain. Again, the differences in the studies challenge meaningful comparisons among estimates (Eriksson
et al. (2012), for example, considered whole fruits and vegetables and did not distinguish between edible and non-edible food). Consequently, we are unable to validate our estimates against data from most of the other related peer-reviewed studies. One exception is Buzby
et al. (forthcoming) [
33], which will compare the estimates presented here with the previous estimates for 2005–2006 from Buzby
et al. [
8].
Additionally, there is a lack of literature worldwide about food donations by retailers due to the lack of data [
34]. Lebersorger and Schneider [
32] estimate that in Austria, 7 percent of food loss in retail stores is donated to social services and that 38 percent of retailers do not donate any food to organizations that serve those in need. Beretta
et al. [
17] cite studies in Switzerland that estimate that food donations comprised 0.15 percent of the amount of food consumed at the retail level, suggesting that there is a great deal of room for improvement. The BSR estimate for the United States was relatively higher at roughly 18 percent of the amount of food waste generated in the retail and wholesale sectors was donated in 2011 [
12]. Although food donations are not counted as part of shrink (
i.e., they are on a different part of profit and loss balance sheets), it would be helpful to understand the scale of these donations and the ultimate destination (e.g., consumption) because of the implications for the total amounts of food available for consumption.
2. Data and Methods
In late fall 2013, the ERS commissioned Nielsen Perishables Group to repeat the data collection from Buzby
et al. [
8] to obtain the two most recent years of shrink rate data available (
i.e., 2011 and 2012) for fresh fruits, vegetables, meat, poultry, and seafood. The primary purpose of the contract was to obtain updated shrink estimates of individual fresh foods for use as food loss assumptions at the retail level in the LAFA data series. In the current article, we focus on fresh fruit and vegetable shrink with a particular emphasis on the use of these estimates to calculate food loss for these products at the retail level in the United States. Greater detail on the foundation study can be found in Buzby
et al. (forthcoming) [
33], which focuses on: (1) comparing the new estimates with the 2005–2006 estimates from Buzby
et al. [
8] as a validation step and to obtain some perspective on changes over time; and (2) using the 2011–2012 estimates to calculate the amount of fresh fruit, vegetables, meat, poultry, and seafood availability (
i.e., the amounts of food available for consumption) at the retail level in the United States.
2.1. Commodity Coverage
This study provides shrink estimates for 24 fresh fruits and 31 fresh vegetables in U.S. supermarkets in 2011 and 2012. Processed or preserved fruits and vegetables (
i.e., canned, frozen, dried, dehydrated, and juiced) were not included in this study because Nielsen Perishables Group was not able to estimate shrink levels in these fruits and vegetables. In Buzby
et al. [
7], the relative contribution of processed produce to total retail-level lossin the United States in 2010 (
i.e., calculated from total poundage) was 3.7 percent for processed fruit (compared to 10.1 percent for fresh fruit) and 4.2 percent for processed vegetables (compared to 12.1 percent for fresh vegetables). Had shrink estimates been available for these processed items, then these estimates could have been used to update the LAFA data series and this would change the resulting estimates of food availability and food loss. The unavailability of these data do not influence the findings in the current study which focuses only on fresh fruits and vegetables. However, if the data were available, they would change the percentages mentioned above in this paragraph.
Data on both random-weight and UPC-coded items were included. Retailer categories were aggregated where necessary to develop data on the fresh fruits and vegetables in this study that match the commodities in the LAFA data series. For example, data on all random-weight apples (e.g., Gala, Granny Smith, McIntosh, Red Delicious, and Golden Delicious etc.) were combined with UPC-coded apples to develop the overall category for “fresh apples”. UPC-coded apples included packaged apples sold in a bag or “value-added” ones such as pre-sliced apples. Data were only used for apples by themselves, that is, the data did not include caramel or candy-coated apples or sliced apples mixed with other kinds of fruit. Sliced or otherwise minimally processed fresh apples were included if they were not mixed with other fruit and if they were still sold as fresh apples.
Nielsen Perishables Group did not include mixtures of fresh fruit or vegetables (e.g., fruit salad, platters of vegetable sticks, and pre-packaged salads made from both leafy greens and fruit) in their calculations of quantitative data for individual commodities due to the lack of data on the share or weight of the different fruits and vegetables in each mixture. Fresh fruit and vegetable mixtures vary widely from retailer to retailer, and composition shares of the various fruits and vegetables are not consistent. Additionally, separate data categories for mixed fresh fruit and mixed fresh vegetables were not included in the study because the primary purpose of this study was to obtain updated retail-level loss estimates for individual fresh commodities for use in the LAFA data series, which contains only the core individual commodities, not mixtures as that would lead to double counting of product. Therefore, it is not possible to estimate these mixtures’ contribution to total produce shrink.
2.2. Method
In order to be used in the analysis sample, data from each store under consideration had to have both weekly shipment data on a particular food commodity (e.g., pounds of fresh cucumber shipments sent from a supplier to the store) and corresponding point-of-sale data on consumer purchases in the Nielsen Perishables Group’s proprietary FreshFacts® point-of-sale database (e.g., scanner data showing the pounds of fresh cucumbers sold). Combined, these two types of information enabled Nielsen Perishables Group to aggregate the data across all stores in the sample and match total shipment data to total sales data for each fresh commodity so that amount (i.e., as the residual) and percentage of shrink could be calculated for 2011 and 2012. The average shrink for each commodity for 2011–2012 was then calculated.
Both the shipment data and the point-of-sale data were reported and aligned at the item level for each fresh commodity. For example, a 1-pound bag of fresh carrots would be identified by its UPC-code and its purchase by a particular store. Therefore, the data can be aggregated to the appropriate product level at a particular store and year and a loss rate can be calculated. For example, “Fresh carrots” consist of Universal Product Code (UPC)-coded baby carrots, shredded carrots, and 1-, 3-, and 5-pound bags of whole carrots, plus whole carrots sold by random weight.
The 2011–2012 shrink data for fresh produce are based on true aggregates of each store’s data for the individual covered fresh fruits and vegetables, not projections or subjective interviews. Specifically for a given year, the shrink percentage for each commodity was calculated as the total pounds (or other appropriate unit) of a particular product that came into the stores in the sample but were not sold (i.e., the “residual food loss”), divided by the total pounds (or other appropriate unit) of that product that came into the sample stores. This methodology yields actual, as opposed to estimated, shrink rates and provides accurate tracking of shrink trends across fresh produce categories. This methodology and the data sources offer the most accurate possible depiction of retail-level shrink activity for fresh fruit and vegetable items on a national level.
2.3. Supplier Shipment Data
For this study, Nielsen Perishables Group leveraged its existing business relationships to recruit a sample of retail chains in the United States to provide their supplier shipment data on the specific fresh fruits and vegetables covered in the study. Nielsen Perishables Group ensured a good cross section of retailers by developing a sample of retail chains which included: (1) larger national chains and smaller regional chains; (2) retailers from all regions of the country; and (3) traditional supermarkets along with mass merchandisers/super stores. Once Nielsen Perishables Group created the target list, the retailer’s main Nielsen contact made the initial contact to request study participation via email to retailers at the corporate level, typically to the Vice President of Produce or Director of Produce for the entire chain. The email explained the purpose of the study and invited them to participate. Retailers were incentivized to participate in the study by a PowerPoint presentation created and delivered to them, which includes national trends found in the study as well as details about how well each retailer’s shrink levels ranked compared to the multi-retailer average. Nielsen Perishables Group then conducted phone interviews with those who chose to participate. Participants typically shared their shipment figures for the covered commodities and years by sending a spreadsheet via email. The supermarket retailers ultimately included in the data portion of this study were five large national and regional food retail chains located in all four U.S. regions—East, South, Central, and West—to allow for a geographically-representative sample. We asked a total of 7 retail chains to participate in the shipment data portion of the project and 5 participated, thus we had a 71 percent response rate.
2.4. Point of Sale Data
Nielsen Perishables Group routinely collects point-of-sale data from approximately 18,000 stores in retail supermarkets across the United States and uses this information to develop its proprietary FreshFacts® point-of-sale database. Nielsen Perishables Group sales data tracks weight and package size attributes for produce, meat, poultry, and seafood thus enabling reporting by weight.
In the United States, the food channel (including grocery stores, mass/supercenters and club stores) in total represents 90 percent of the dollar sales for the channels where fresh food is sold. The remaining 10 percent of fresh food sales are from the convenience, dollar, drug and military channels and certain other retail chains. Nielsen Perishables Group used a sample of supermarket retailers in the United States from its proprietary FreshFacts
® point-of-sale database to estimate fresh fruit and vegetable shrink at the retail level for 2011–2012. Only stores from the food channel were included, in order to best compare to the sample used in the 2005–2006 food loss analysis documented in Buzby
et al. [
8]. Specifically, this point-of-sale database includes retail census sales data for key grocery, club and mass/supercenter stores chains in the U.S. with $2 million or more annual all-commodity value (ACV) sales per store. ACV stands for “all-commodity volume”, which is a variable on a product’s distribution that takes into account differences in the size of a store [
35]. The database does not include independent grocers, convenience stores, mom-and-pop grocers, and certain retail chains, such as: Whole Foods, Trader Joe’s, Aldi, Costco, HEB, and Hy-Vee (please note this list is not inclusive of all excluded retailers). The sample size was limited by the number of stores providing shipment data, not by the number of retail store coverage in the point-of-sale data.
The study ultimately included 5 national and regional chains with around 2,900 stores in the sample to estimate fresh fruit and vegetable shrink. These stores comprised roughly 16 percent of the approximately 18,000 stores in Nielsen Perishables Group’s available universe. Due to data limitations on the entire food sales market, we do not have an estimate of how much of the entire market is covered by the Nielsen Perishables Group proprietary FreshFacts® point-of-sale database or how much is covered by the sample of stores for the shipment and point-of-sales data pairings.
2.5. Data Quality
The shipment data was cleaned and validated for accuracy at the item-level by each retailer. The data input quality varied by retailer, as each had different internal ordering and accounting systems. Data cleaning criteria included aligning weekly sales and procurement receipts for the time period for each individual item sold, and identifying and removing anomalous data points (i.e., shrink levels above 80 percent or below zero). Anomalous data points were primarily driven by the accuracy of the retailer’s internal tracking systems for procurement. For example, these outliers can be attributed to procurement receipt reporting discrepancies, longer than expected time in the supply chain, product repurposing in-store (e.g., cutting up fruit to remove blemishes and make fruit salad), or local store procurement outside of the main ordering process. Outliers were found across fruit and vegetable categories, and varied by retailer. After cleaning the data, Nielsen Perishables Group processed the data to meet internal sales data quality standards across all retailer data sets included in the study.
2.6. Food Loss Calculations
Estimates of uneaten food at the retail level in pounds in the United States were first calculated for each covered “whole” (here, meaning edible and nonedible portions combined) fresh fruit and vegetable by multiplying: (1) the per capita retail weight for a given whole commodity in LAFA in 2012; (2) the U.S. population in 2012; and (3) 2011–2012 average shrink estimate for that commodity. We then applied the nonedible share used in the LAFA data series to the resulting amount of uneaten food at the retail-level for each commodity to calculate the amount of food loss in supermarkets after the nonedible portions of fresh fruits or vegetables have been removed. Data on the nonedible share are from the National Nutrient Database for Standard Reference, compiled by USDA’s Agricultural Research Service [
36] (In the LAFA data series, the nonedible share is removed at the consumer level. It is removed here at the retail level for illustrative purposes).
The resulting food loss estimates may be of interest to the food industry by highlighting possible areas or commodities to target for loss reductions and opportunities for firms to develop and market new loss-reducing technologies, such as innovative packaging for particular types of produce. It is important to note that here, like in Buzby
et al. [
8], we are assuming that the estimated shrink rate equals the actual food loss rate for each fresh fruit and vegetable. This means that the resulting loss estimates are an upper bound since some unknown share of fresh produce go unsold for some reason other than food loss as defined here (e.g., theft).
The food loss estimates may also be of interest for determining the upper bound number of servings that could be donated to feed hungry people.
4. Discussion and Outlook
The supermarket shrink estimates provided here are high compared to food shrink, loss, and waste estimates reported in other studies both internationally and in the United States. The estimates presented here are higher than the estimates in Mena
et al. [
24]. For example, the estimate for strawberries in the United Kingdom was 2 to 4 percent compared to 14.2 percent in the current study for strawberries in the United States. The estimates presented here are much higher than 4.3 percent of fruits and vegetables by mass reported in Eriksson
et al. [
31] in six Swedish retail stores and slightly higher than the 2005–2006 estimates in Buzby
et al. [
8]. The estimates are not directly comparable to those based on the percent of sales or calories. The overall average supermarket shrink rates here (
i.e., weighted by commodity value) were 1.2 percentage point higher for fresh fruit and 2.2 percentage points higher for fresh vegetables than in 2005–2006 [
8]. Although, individual estimates often varied considerably from the corresponding average estimates for 2005–2006, the relative position of individual foods in terms of low or high shrink levels remained similar for both fresh fruits and vegetables. For example, estimated shrink for papayas and mustard greens were high in both studies out of all fresh fruits and vegetables respectively.
The LAFA data series continues to be considered
preliminary or work in progress as there are a series of initiatives underway to improve the data structure and underlying assumptions, including the current study on fresh fruit and vegetable shrink at the retail level. Another recent initiative is that ERS contracted with the National Research Council and the Institute of Medicine of the National Academies of Sciences (NAS) to review the Food Availability Data System (which contains LAFA) and the resulting food availability and loss estimates. This contract led to a workshop held by NAS in April 2014 and a follow-up meeting on food donations in the United States held in March 2015. The proceedings from the NAS workshop has been published and one finding of the workshop was that obtaining a better assessment of the magnitude of food donations, rendering, and transfers to thrift stores would be beneficial [
39] (p. 125). It was recognized that the ultimate destination of the product that went unsold in retail stores is important. For example, food donated by retail stores may end up ultimately being consumed by people so the LAFA could take this into account in the future so as to not overestimate loss and underestimate consumption. (The same could be said for theft of food.) (As an aside, some animal feed and other non-food uses during production and manufacturing are removed earlier in the core Food Availability data. Unsold food at the retail level diverted to animal feed could be considered part of food loss by ERS’ definition but by some definitions it is not food waste as it has some economic use.) The proceedings from the food donations expert meeting is being developed. The current study improves the understanding of shrink and that component which is food loss but clearly this is an area in need of additional research. For example, more research is needed to determine if fresh produce shrink in supermarkets is dependent on the assortment offered for sale, including the variety of products of a particular fresh fruit or vegetable at different value levels (e.g., lower-, average-, and higher-priced bagged spinach or salad greens).
In this study, we assumed that shrink for fresh fruits and vegetables was food loss. Future research is needed to understand if any of the operational or theft components mentioned previously from the FMI and Retail Control Group study play a notable role. If there are more important factors in produce shrink than food loss, this could partly explain why our estimates are higher than suggested elsewhere in the literature. As previously mentioned, that study does not suggest that theft is a problem for fresh fruits and vegetables but this could be explored further. Future research could also investigate the extent and amount of edible food that supermarkets donate to food banks, soup kitchens, and other places and organizations that serve people in need.
A more thorough investigation of the amounts of and differences in food shrink and loss among retail stores in developed countries could unveil the portion of food shrink that is food loss. Better estimates of shrink and loss could then help identify the potential opportunities to reduce food shrink and loss in retail stores in the future and may spur innovation in food loss-reducing technologies and strategies [
40]. Of course, more information on shrink and food loss rates and amounts for particular foods provides information on potential areas to target for shrink and food loss reductions but it does not provide information on what loss-reducing strategies to take or the underlying causes. Supermarkets would need additional information, such as on available and cost-effective loss-reducing technologies and practices (e.g., culling practices for fresh produce displays), to determine which loss-reducing strategies to implement.
Future scientific research questions to be addressed include: How can the scientific community help further food loss prevention in practice? What existing technologies can be refined or transferred to novel applications to reduce food loss? For example, how can new developments in nanotechnology be improved and made more affordable? These nanotechnologies include nanosilver (
i.e., has antimicrobial properties) in fresh food packaging containers [
41] and nanosensors that can detect storage temperature abuse or trace amounts of gasses or contaminants potentially indicating that food products may not be safe to eat [
42]. Also, given that there will always be some level of food loss, what is the next best economic use for uneaten food (e.g., composting, animal feed, and anaerobic digesters) and what cost-effective technologies are needed? Should national or local governments change the economic incentives to reduce food loss or recover uneaten food, such as through taxes or legal liability? How can we better measure food loss on a national level?
There are multiple collaborations under way to improve understanding of food loss and waste and to reduce and prevent food waste. For example, the European Union-funded “Food Use for Social Innovation by Optimising Waste Prevention Strategies” (FUSIONS) alliance with 21 partners across Europe is developing standard approaches for defining food waste [
43]. And, the World Resources Institute’s Food Loss and Waste Protocol is coordinating the development of a global approach to define and measure food loss and waste [
44]. Although food waste is a data-poor area, assessment among some of the larger retailers and food service companies has shown it to be possible [
21] (p. 16). Another collaboration is the U.S. Department of Agriculture and the U.S. Environmental Protection Agency’s U.S. Food Waste Challenge launched in June 2013, which calls on entities across the food chain–farms, agricultural processors, food manufacturers, grocery stores, restaurants, universities, schools, and local governments–to join efforts to:
Reduce food waste by improving product development, storage, shopping/ordering, marketing, labeling, and cooking methods.
Recover food waste by connecting potential food donors to hunger relief organizations like food banks and pantries.
Recycle food waste to feed animals or to create compost, bioenergy and natural fertilizers.
Retail stores and chains in developed countries vary in their operations (e.g., inventory and pricing reduce food loss and waste would not be appropriate for all stores and chains. Multiple strategies to reduce food loss and waste would likely be needed to make meaningful progress in national or global loss reductions. For example, some issues like waste management priorities, can be addressed at a local level, others require a higher level of consideration, such as the waste of environmental and economic resources represented by food waste [
21] (p. 5 and 8). Addressing national and global food loss and waste will likely take the combined efforts of individual stores, retail food chains, consumers, national governments, politico-economic bodies like the European Union and associated agencies, such as the FAO, and international forums like the Nordic Council [
45] and Asia-Pacific Economic Cooperation (APEC) [
46].


