Article

Temperature Impact on the Forage Quality of Two Wheat Cultivars with Contrasting Capacity to Accumulate Sugars

by
Máximo Lorenzo
1,
Silvia G. Assuero
2,* and
Jorge A. Tognetti
2,3
1
INTA, Estación Experimental Balcarce, C.C. 276, Balcarce 7620, Argentina
2
Laboratorio de Fisiología Vegetal, Facultad de Ciencias Agrarias, Universidad Nacional de Mar del Plata, C.C. 276, Balcarce 7620, Argentina
3
Comisión de Investigaciones Científicas de la Provincia de Buenos Aires, La Plata 1900, Argentina
*
Author to whom correspondence should be addressed.
Submission received: 26 May 2015 / Revised: 26 May 2015 / Accepted: 10 August 2015 / Published: 17 August 2015
(This article belongs to the Special Issue Forage Plant Ecophysiology)

Abstract

:
Wheat is increasingly used as a dual-purpose crop (for forage and grain production) worldwide. Plants encounter low temperatures in winter, which commonly results in sugar accumulation. High sugar levels might have a positive impact on forage digestibility, but may also lead to an increased risk of bloat. We hypothesized that cultivars with a lower capacity to accumulate sugars when grown under cold conditions may have a lower bloat risk than higher sugar-accumulating genotypes, without showing significantly lower forage digestibility. This possibility was studied using two wheat cultivars with contrasting sugar accumulation at low temperature. A series of experiments with contrasting temperatures were performed in controlled-temperature field enclosures (three experiments) and growth chambers (two experiments). Plants were grown at either cool (8.1 °C–9.3 °C) or warm (15.7 °C–16.5 °C) conditions in field enclosures, and at either 5 °C or 25 °C in growth chambers. An additional treatment consisted of transferring plants from cool to warm conditions in the field enclosures and from 5 °C to 25 °C in the growth chambers. The plants in the field enclosure experiments were exposed to higher irradiances (i.e., 30%–100%) than those in the growth chambers. Our results show that (i) low temperatures led to an increased hemicellulose content, in parallel with sugar accumulation; (ii) low temperatures produced negligible changes in in vitro dry matter digestibility while leading to a higher in vitro rumen gas production, especially in the higher sugar-accumulating cultivar; (iii) transferring plants from cool to warm conditions led to a sharp decrease in in vitro rumen gas production in both cultivars; and (iv) light intensity (in contrast to temperature) appeared to have a lower impact on forage quality.

1. Introduction

Wheat is increasingly cultivated as a dual-purpose crop in several main wheat areas of the world, including the USA southern Great Plains [1,2], Australia [3,4], China [5] and the Argentinean Pampas region [6,7,8]. The reasons for this expansion are mainly the capacity of wheat to provide forage early in winter without excessively decreasing grain production. This practice increases the profitability at the whole-farm system level and additionally reduces the risk associated with both price and climate variability [9,10,11,12,13,14,15].
Wheat is often considered a high quality, cool season forage when consumed at earlier developmental stages due to the high digestibility of young leaf blades, which is in turn associated with a low lignin content [16]. In general, forage is considered high quality when the in vitro digestibility of dry matter (IVDMD) is higher than 600 g·kg−1 DM [17]. Accordingly, values higher than 800 g·kg−1 DM IVDMD have been reported for wheat at the pre-stem elongation stage [16,18]. Nevertheless, several reports have related the intake of wheat and other annual winter grasses to bloat risk due to high levels of rapidly fermentable components (i.e., soluble protein and sugars [19,20,21]). Pasture bloat takes place when the grazing animal’s capacity to expel gases produced by fermentation is exceeded [22], and gases become trapped in bio-film complexes [21,23].
In vitro rumen gas production has been positively correlated with plant protein fractions and IVDMD when incubated with mixed rumen microorganisms [24]. However, this correlation is not necessarily straightforward. The concentration of soluble protein and sugars in wheat leaves may vary, depending on genotypic and environmental conditions [25,26,27,28]. Exposure of grasses to low temperature induces a steady accumulation of both components, while reversion to non-chilling conditions determines a very rapid decline in their concentration [25,29]. Considerable variation in the capacity to accumulate sugars and proteins exists among wheat cultivars: cultivars which undergo deeper cold-acclimation (winter hardy cultivars) are able to accumulate substantially higher amounts of compatible solutes in their cells compared with less hardy cultivars [26,27,28]. Because of the transient nature of solute accumulation under cold conditions, the ratio between rapidly fermentable non-structural carbohydrates and proteins, and structural components of grass cells may vary with temperature, and thus wheat pastures might present a variable bloat risk while maintaining a constantly high IVDMD.
In addition to temperature, light intensity may also play a role in determining IVDMD and bloat risk. A reduction in light intensity has been associated with reduced forage quality in some evergreen species [30]. However, there are conflicting reports regarding the influence of light intensity on lignin content, even though most studies suggest that higher intensities favor an increase in lignin levels [31].
In the present work, we studied the forage composition of two wheat cultivars with contrasting capacity to accumulate solutes when grown under cold conditions, in parallel with IVDMD and in vitro gas rumen production, as affected by temperature and light intensity. A set of experiments with contrasting temperatures was conducted in both field enclosures (high irradiance, three experiments) and growth chambers (low irradiance, two experiments) to test the following hypotheses: (i) low temperature increases the concentration of soluble and structural components of wheat leaf blades; (ii) low temperature increases in vitro rumen gas production, without a significant effect on forage digestibility; (iii) the effect of low temperature on in vitro rumen gas production is stronger in a cultivar with a higher capacity to accumulate solutes; and (iv) low temperature effects on in vitro rumen gas production and IVDMD are enhanced under higher light intensity conditions.

2. Experimental Section

2.1. Plant Material

Two wheat (Triticum aestivum L.) cultivars were selected for their contrasting morpho-physiological responses to low temperature, which have been described elsewhere [29,32,33]. Briefly, ProINTA Pincén is a winter hardy wheat that reduces its growth more and accumulates higher sugar concentration than Buck Patacón under low temperatures. In all experiments, seeds were soaked in tap water for 24 h at ambient temperature prior to sowing.

2.2. Experimental Layout

2.2.1. Field Enclosure Experiments

Three experiments were conducted in field enclosures during the winter seasons of 2005, 2006 and 2008 at the Facultad de Ciencias Agrarias campus (Universidad Nacional de Mar del Plata, Balcarce, Argentina, 37°45′47.94″ S, 58°17′38.82″ W, 130 m a.s.l.) under a natural photoperiod. The enclosures were constructed of pipe structures covered with polyethylene film (100 μm thick) (Figure S1). Plants were grown up to the fourth fully expanded leaf stage in polyethylene containers with a 0.1-m diameter and a 0.6-m height filled with a uniform mixture of soil (topsoil of a Typic Argiudol) and vermiculite (1:1 v/v) located in an excavation within the enclosures in order to maintain the top of the containers at soil level. Twenty-four containers were placed in each enclosure (12 for each cultivar, from which three were monitored during development and harvested, three were used for water status determination and the rest were used as borders). The substrate was saturated at sowing with ½-strength, and irrigated daily thereafter with ¼-strength Hoagland’s solution [34]. Seeds (12 per container) were germinated and seedlings were thinned to 6 plants per container after emergence. Two electrical fan heaters with a thermostatic control (set to turn on under 16 °C) were located at opposite corners of one of the enclosures (warm treatment) at sowing. Accordingly, two electrical fans were located at opposite corners of the other enclosure (cool treatment) where the roof permanently covered the plants while the sidewalls were opened during the diurnal period and closed during the night. Air temperature was measured using thermistors and recorded using a data logger (Meteo, Cavadevices, Buenos Aires, Argentina) every 30 min. Thermistors were protected by shields to prevent absorption of solar radiation. The fourth channel of the data logger was used to record the photosynthetically active radiation. In the three experiments, the mean temperatures measured in the cool environment were very similar (ranging between 8.1 °C–9.3 °C), as were those of the warm enclosures (15.7 °C–16.5 °C) (Table 1). Daily mean air temperature dynamics during the 2006 field enclosure experiment, as well as the air temperatures recorded on one typical day of the same experiment, are shown in Figure S2 to illustrate the temperature conditions in the field enclosures. The average photosynthetic daily light integral (DLI) values diverged between cool and warm because of the different duration of the growing periods (Table 1). In 2008, a third treatment consisting of transferring plants from cool to warm conditions at the third leaf stage was applied. Plants were harvested early in the morning following a developmental criterion (i.e., when 100% of plants attained the third fully expanded leaf stage for the cool and warm treatments, or the fourth fully expanded leaf stage for the cool-warm treatment); therefore, the harvest dates differed between the treatments.
Table 1. Average (± SD) daily mean air temperature and photosynthetic daily light integral (DLI) in the cool and warm field enclosures for the 2005 (sown on 20 June), 2006 (sown on 19 June) and 2008 (sown on 12 June) experiments. The cool-warm (C-W) data correspond to the post-transferred period only.
Mean air temperature (°C)DLI (mol photons m−2·day−1)
Field EnclosureCoolC-WWarm CoolC-WWarm
20058.5 ± 2.816.5 ± 1.712.7 ± 5.717.8 ± 7.8
20069.3 ± 3.215.7 ± 2.212.7 ± 3.411.1 ± 4.1
20088.7 ± 3.316.6 ± 2.316.3 ± 1.914.0 ± 5.312.2 ± 3.911.9 ± 3.6

2.2.2. Growth Chamber Experiments

Two complete independent experiments were carried out in growth chambers at either 5 °C ± 0.5 °C or 25 °C ± 1 °C, under otherwise similar environmental conditions: 200 μmol photon m−2·s−1 (photosynthetically active radiation, PAR) at the canopy level provided by fluorescent lamps (Osram Lumilux 21–840), 50% ± 10% relative humidity and a 12-h photoperiod. The average photosynthetic DLI (for both experiments) was 8.5 ± 0.1 and 8.6 ± 0.1 (mol photons m−2·day−1) at 5 °C and 25 °C, respectively. Twenty-four plastic containers (0.1-m diameter, 0.3-m depth) filled with vermiculite and saturated with ½-strength Hoagland’s solution [34] were placed in the chamber (12 for each cultivar, from which three were monitored during development and harvested, three were used for water status determination and the rest were used as borders). Seeds (twelve per container) were germinated and seedlings were thinned to 6 plants per container after emergence. Plants were harvested as described above for the field experiment.
The time in days and the thermal time from sowing to harvest for both field enclosures and growth chamber experiments are shown in Table S1.

2.3. Determinations

2.3.1. Plant Development

The number of fully expanded leaves was recorded at least twice a week.

2.3.2. Relative Water Content

The relative water content (RWC) at harvest was determined on the youngest fully expanded leaf of the mainstem as described by Equiza et al. [32]. Sampling was performed early in the morning in parallel with harvesting for other determinations. In all experiments (the field enclosures and the growth chambers), irrespective of cultivars and temperature treatments, the RWC values at harvest were higher than 96%. Therefore, differences in the concentrations of the cell components, when expressed per unit of fresh mass, are not attributable to variation in water status among cultivars or treatments.

2.3.3. Dry matter content and sugar concentration

The dry matter content was expressed as g·DM·kg−1 FM. The total sugar concentration (TSC) in the leaf blades (mainly fructan, sucrose and monosaccharides) was quantified spectrophotometrically according to the phenol-sulfuric acid procedure [35]. Briefly, oven-dried leaf blades were ground, weighed and extracted in boiling distilled water (10 mg·DM·mL−1) for 10 min. The mixtures were centrifuged at 1000 g, and supernatants were used for analysis. The reaction mixture contained 0.57 mL of a 5% phenol solution and 2.85 mL of H2SO4 in a total volume of 4 mL. The mixture was stirred and incubated for 20 min in a bath at 25 °C, agitated and after 15 min at ambient temperature, the absorbance at 490 nm was read using a UV-1700 PharmaSpec spectrophotometer (Shimadzu Corp., Kyoto, Japan). A glucose solution was used as a standard. All samples were run in duplicate, and the values are expressed on a fresh mass (FM) basis.

2.3.4. Cell Wall Components

The neutral detergent fiber (NDF) and acid detergent fiber (ADF) contents were determined using F57 filter bags (ANKOM A200, ANKOM Technology Corp., Fairport, NY, USA) according to Komareck et al. [36] and Komareck et al. [37], respectively. The lignin (ADL) content was determined using the acid detergent fiber permanganate lignin method [38]. The cellulose (ADF-ADL) and hemicellulose (NDF-ADF) contents were estimated by the difference. All values are expressed on a FM basis.

2.3.5. Crude Protein

The crude protein (CP) concentration was determined from the nitrogen levels (CP = 6.25 × N) using a LECO FP-528 (LECO Corporation, St. Joseph, MI, USA) nitrogen auto-analyzer [39]. The values are expressed on a FM basis.

2.3.6. True in Vitro Dry Matter Digestibility (IVDMD)

This procedure followed the ANKOM-DAISY procedure [40]. Samples (0.5 g DW) were weighed directly into F57 filter bags that were sealed with a heater and placed in a DaisyII Incubator (ANKOM Technology Corp., Fairport, NY, USA) digestion jar. Buffered rumen fluid was prepared according to Goering and Van Soest [38] and transferred into the jars containing the bags. The jars were then placed in the DaisyII Incubator at 39 °C, with continuous rotation. After 48 h of incubation in buffered rumen fluid, the bags were gently rinsed under cold tap water and placed in an ANKOM200 Fiber Analyzer to remove microbial debris and any remaining soluble fractions using neutral detergent solution so that true digestibility could be determined. Incubations were performed in duplicate.

2.3.7. In Vitro Rumen Gas Production

Fresh wheat leaf blade samples were cut into 5-mm long pieces prior to all in vitro experiments. In vitro rumen gas production was determined following the general procedure described previously by Fay et al. [41] and Min [21,24], with modifications. The method consisted of measuring a syringe plunger displacement (ml) in 0–6-h incubation periods over a period of 28 h. Total in vitro rumen gas production was corrected to blank incubations (i.e., no ruminal fluid). The rumen fluid was collected from a cannulated steer continuously receiving an alfalfa diet, mixed and strained through four layers of cheesecloth and flushed with CO2 gas for in vitro rumen incubation. The in vitro rumen incubation procedure consisted of placing 2.5 g of minced fresh forage in 100-mL volumetric flasks containing 50 mL of rumen fluid diluted with artificial saliva [42], buffered to pH 6.8, saturated with CO2 gas and maintained at 39 °C. Luer-type syringes (30 mL) with a 50/18 hypodermic needle, previously lubricated with distilled water to ensure consistent plunger resistance and movement to avoid gas losses, were inserted into the flask rubber stoppers. All gases were collected from the in vitro rumen incubation for gas production analyses. In vitro incubation was undertaken in duplicate.

2.4. Experimental Design and Statistics

A completely randomized design with three replicates (containers) per combination of two cultivars and two or three growth temperatures (depending on the experiment) was used. The temperature effect on plant carbon status (dry matter content and total sugar concentration), cell wall components (cellulose, hemicellulose and lignin), crude protein and in vitro rumen gas production at 28 h was analyzed using two-way ANOVA (Statistica 7, StatSoft Inc., Tulsa, OK, USA). Means were separated using Tukey’s test at a significance level of 5%. No attempt was made to compare the effect of light intensity because of differences in temperature conditions between the field enclosure and the growth chamber experiments.

3. Results

3.1. Forage Composition

3.1.1. Forage Dry Matter Content

Significantly higher leaf blade dry matter content (DMC) values were found in the cool than in the warm environments for both cultivars (Table 2); the increase induced by lower temperatures was more pronounced in winter hardy Pincén than in Patacón (between 23%–29% and 15%–19%, respectively, for field enclosures, and averaging 47% and 16%, respectively, for growth chambers). Accordingly, Pincén had a higher DMC in cool environments. Conversely, no significant differences were found between the two cultivars under warm growing conditions. Transferring the plants from cool to warm conditions resulted in a significant decrease in DMC in Pincén but not in Patacón for both the field enclosures and growth chamber experiments.
Similar DMC values between the field enclosures and the growth chamber experiments were found for Pincén, while in Patacón, the growth chamber values were approximately 12% lower than their counterparts in the field enclosures.
It is well known that during cold acclimation of grasses, cellular dry matter content increases due to a transient deposition of many solutes, including non-structural carbohydrates, proteins, amino acids, etc., while the cell water content may not be affected [43]. Since the RWC in our experiments was close to saturation (i.e., higher than 96%) and was unaffected by temperature treatments or cultivars, the changes in DMC reflected the variation in the C concentration, not the plant water status. Because not all components are accumulated in the same proportion, the concentration of a component that accumulates less than the average could be seen as diminishing when expressed on a dry matter basis. For this reason, the concentrations of the different forage components listed below are expressed on a fresh mass basis, as in similar experiments reported elsewhere [44].

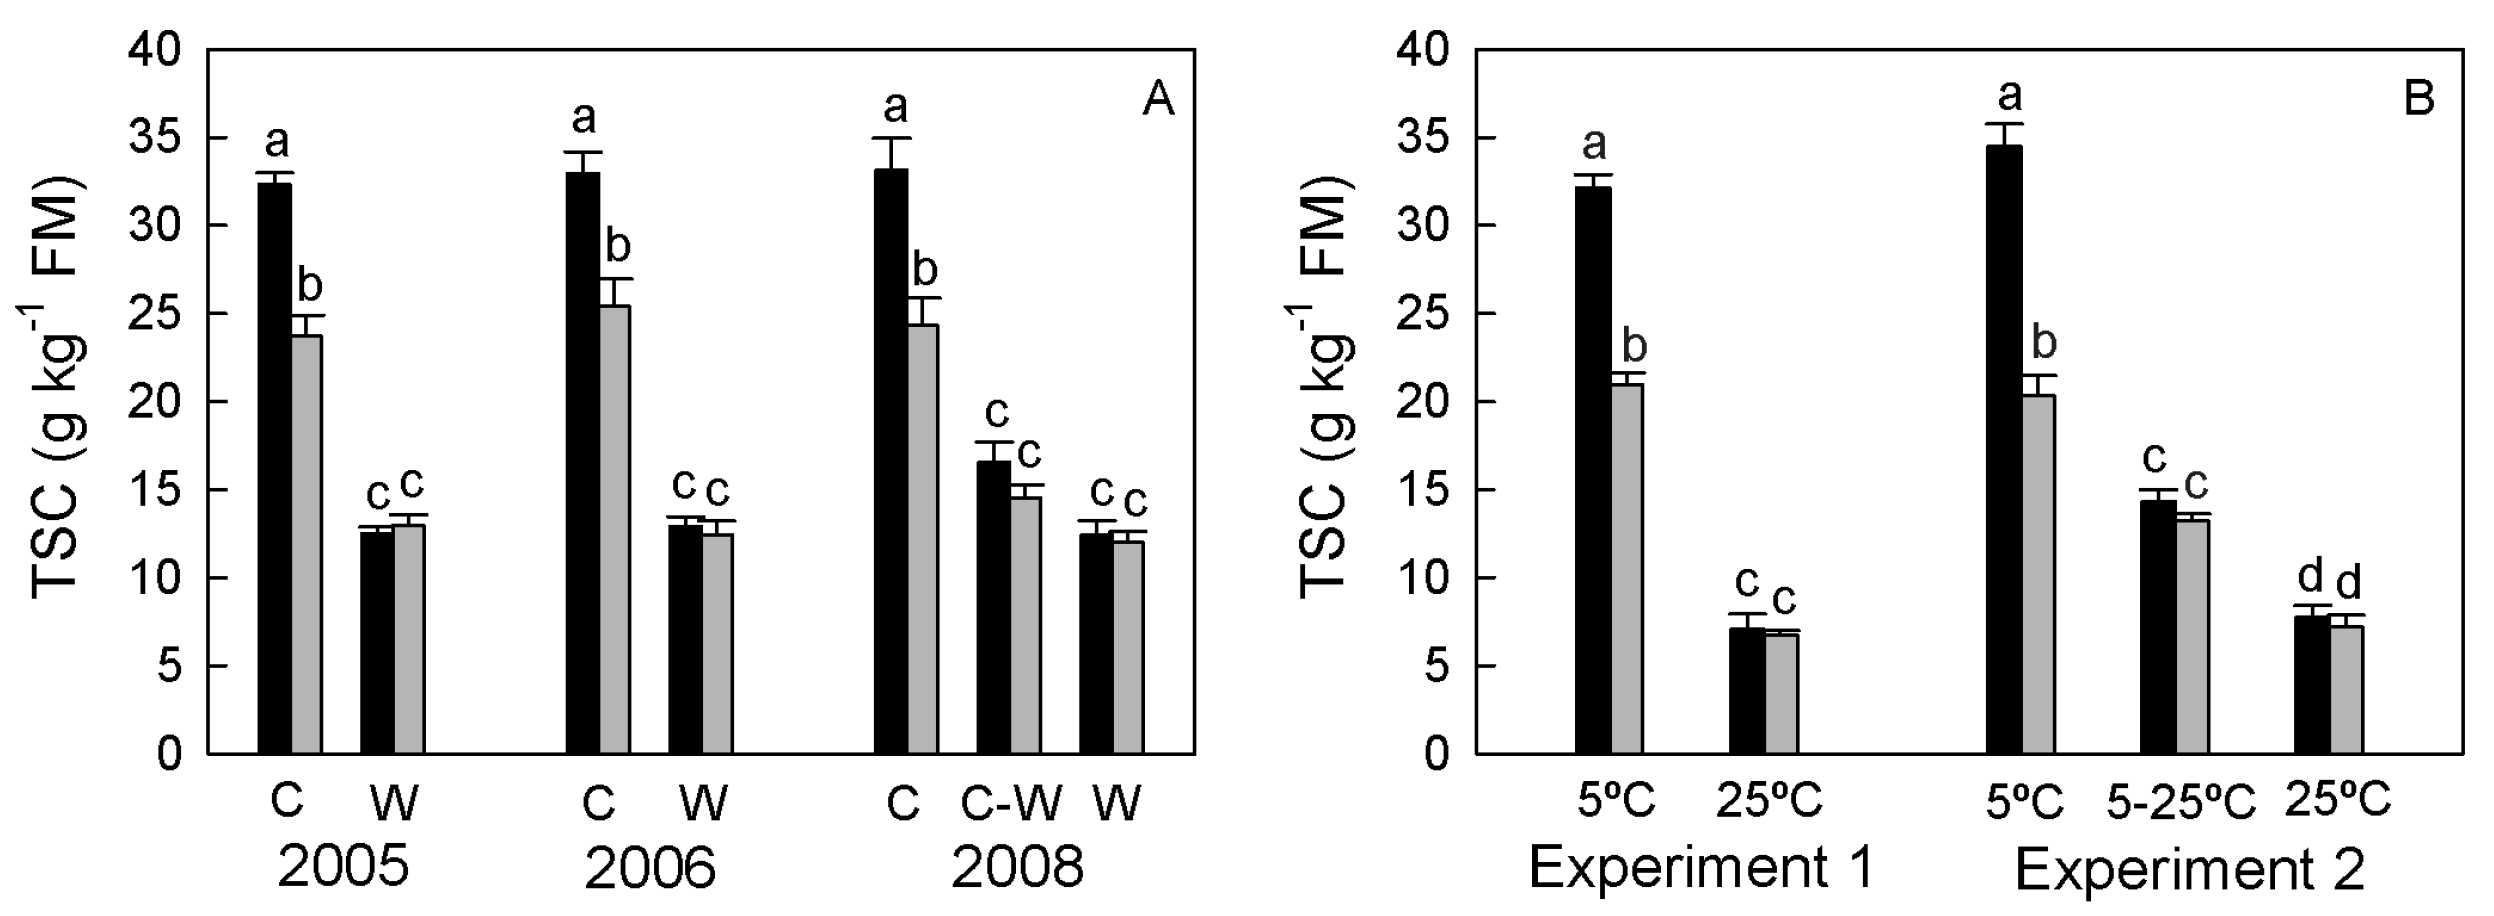
3.1.2. Total Sugar Concentration (TSC)

In general, the TSC results were similar to those of the DMC, with higher leaf blade TSC in cool than in warm treatments for both cultivars in all experiments (Figure 1), but the cold-induced increases were larger than for the DMC (between 155%–167% and 83%–100%, for Pincén and Patacón, respectively). Within each experiment and under cool conditions, Pincén showed the highest values.
For both cultivars, similar TSC values between the field enclosures and the growth chamber experiments were attained under the cooler environments. On the other hand, plants grown in growth chambers under warm conditions had TSC values that were approximately 40% lower than their counterparts in the field enclosures.
Table 2. Dry matter content (DMC, g kg−1 FM) of leaf blades of wheat cv. Pincén and cv. Patacón grown in cool (8.1 °C–9.3 °C) or warm (15.7 °C–16.5 °C) field enclosures in the 2005, 2006 and 2008 experiments, and in growth chambers at either 5 °C or 25 °C. Plants were harvested at the 3rd fully expanded leaf stage, or at the 4th fully expanded leaf stage for plants that were transferred from cool to warm and from 5 °C to 25 °C in the 2008 field enclosure experiment and in the second growth chamber experiment, respectively. Values are the means (± SE) of three replicates. Within each experiment, different letters indicate significant differences (p < 0.05).
PincénPatacón
Field enclosureCoolCool-WarmWarmCoolCool-WarmWarm
2005179 ± 6.9 aN.D.146 ± 7.3 c161 ± 8.3 bN.D.140 ± 6.7 c
2006176 ± 7.1 aN.D.141 ± 3.6 c159 ± 8.5 bN.D.140 ± 6.0 c
2008175 ± 2.3 a162 ± 6.7 b136 ± 2.9 c159 ± 6.1 b155 ± 4.6 b134 ± 8.9 c
Growth Chamber5 °C5 °C–25 °C25 °C5 °C5 °C–25 °C25 °C
Experiment 1189 ± 10.3 aN.D.128 ± 7.3 c141 ± 8.7 bN.D.123 ± 8.6 c
Experiment 2183 ± 9.0 a156 ± 5.6 b125 ± 6.1 d142 ± 2.3 c133 ± 8.9 cd121 ± 8.9 d
N.D.: Not determined.
Figure 1. Total sugar concentration (TSC, g·kg−1 FM) of leaf blades of wheat cv. Pincén (black bars) and cv. Patacón (grey bars). (A) plants grown in cool (C, 8.1 °C–9.3 °C) or warm (W, 15.7 °C–16.5 °C) field enclosures in the 2005, 2006 and 2008 experiments. (B) plants grown in growth chambers at 5 °C or 25 °C. Plants were harvested at the 3rd fully expanded leaf stage, or at the 4th fully expanded leaf stage for plants that were transferred from cool to warm (C-W) and from 5 °C to 25 °C in the 2008 field enclosure experiment and in the second growth chamber experiment, respectively. Vertical bars indicate SE (n = 3). Within each experiment, different letters indicate significant differences (p < 0.05).
Agriculture 05 00649 g001

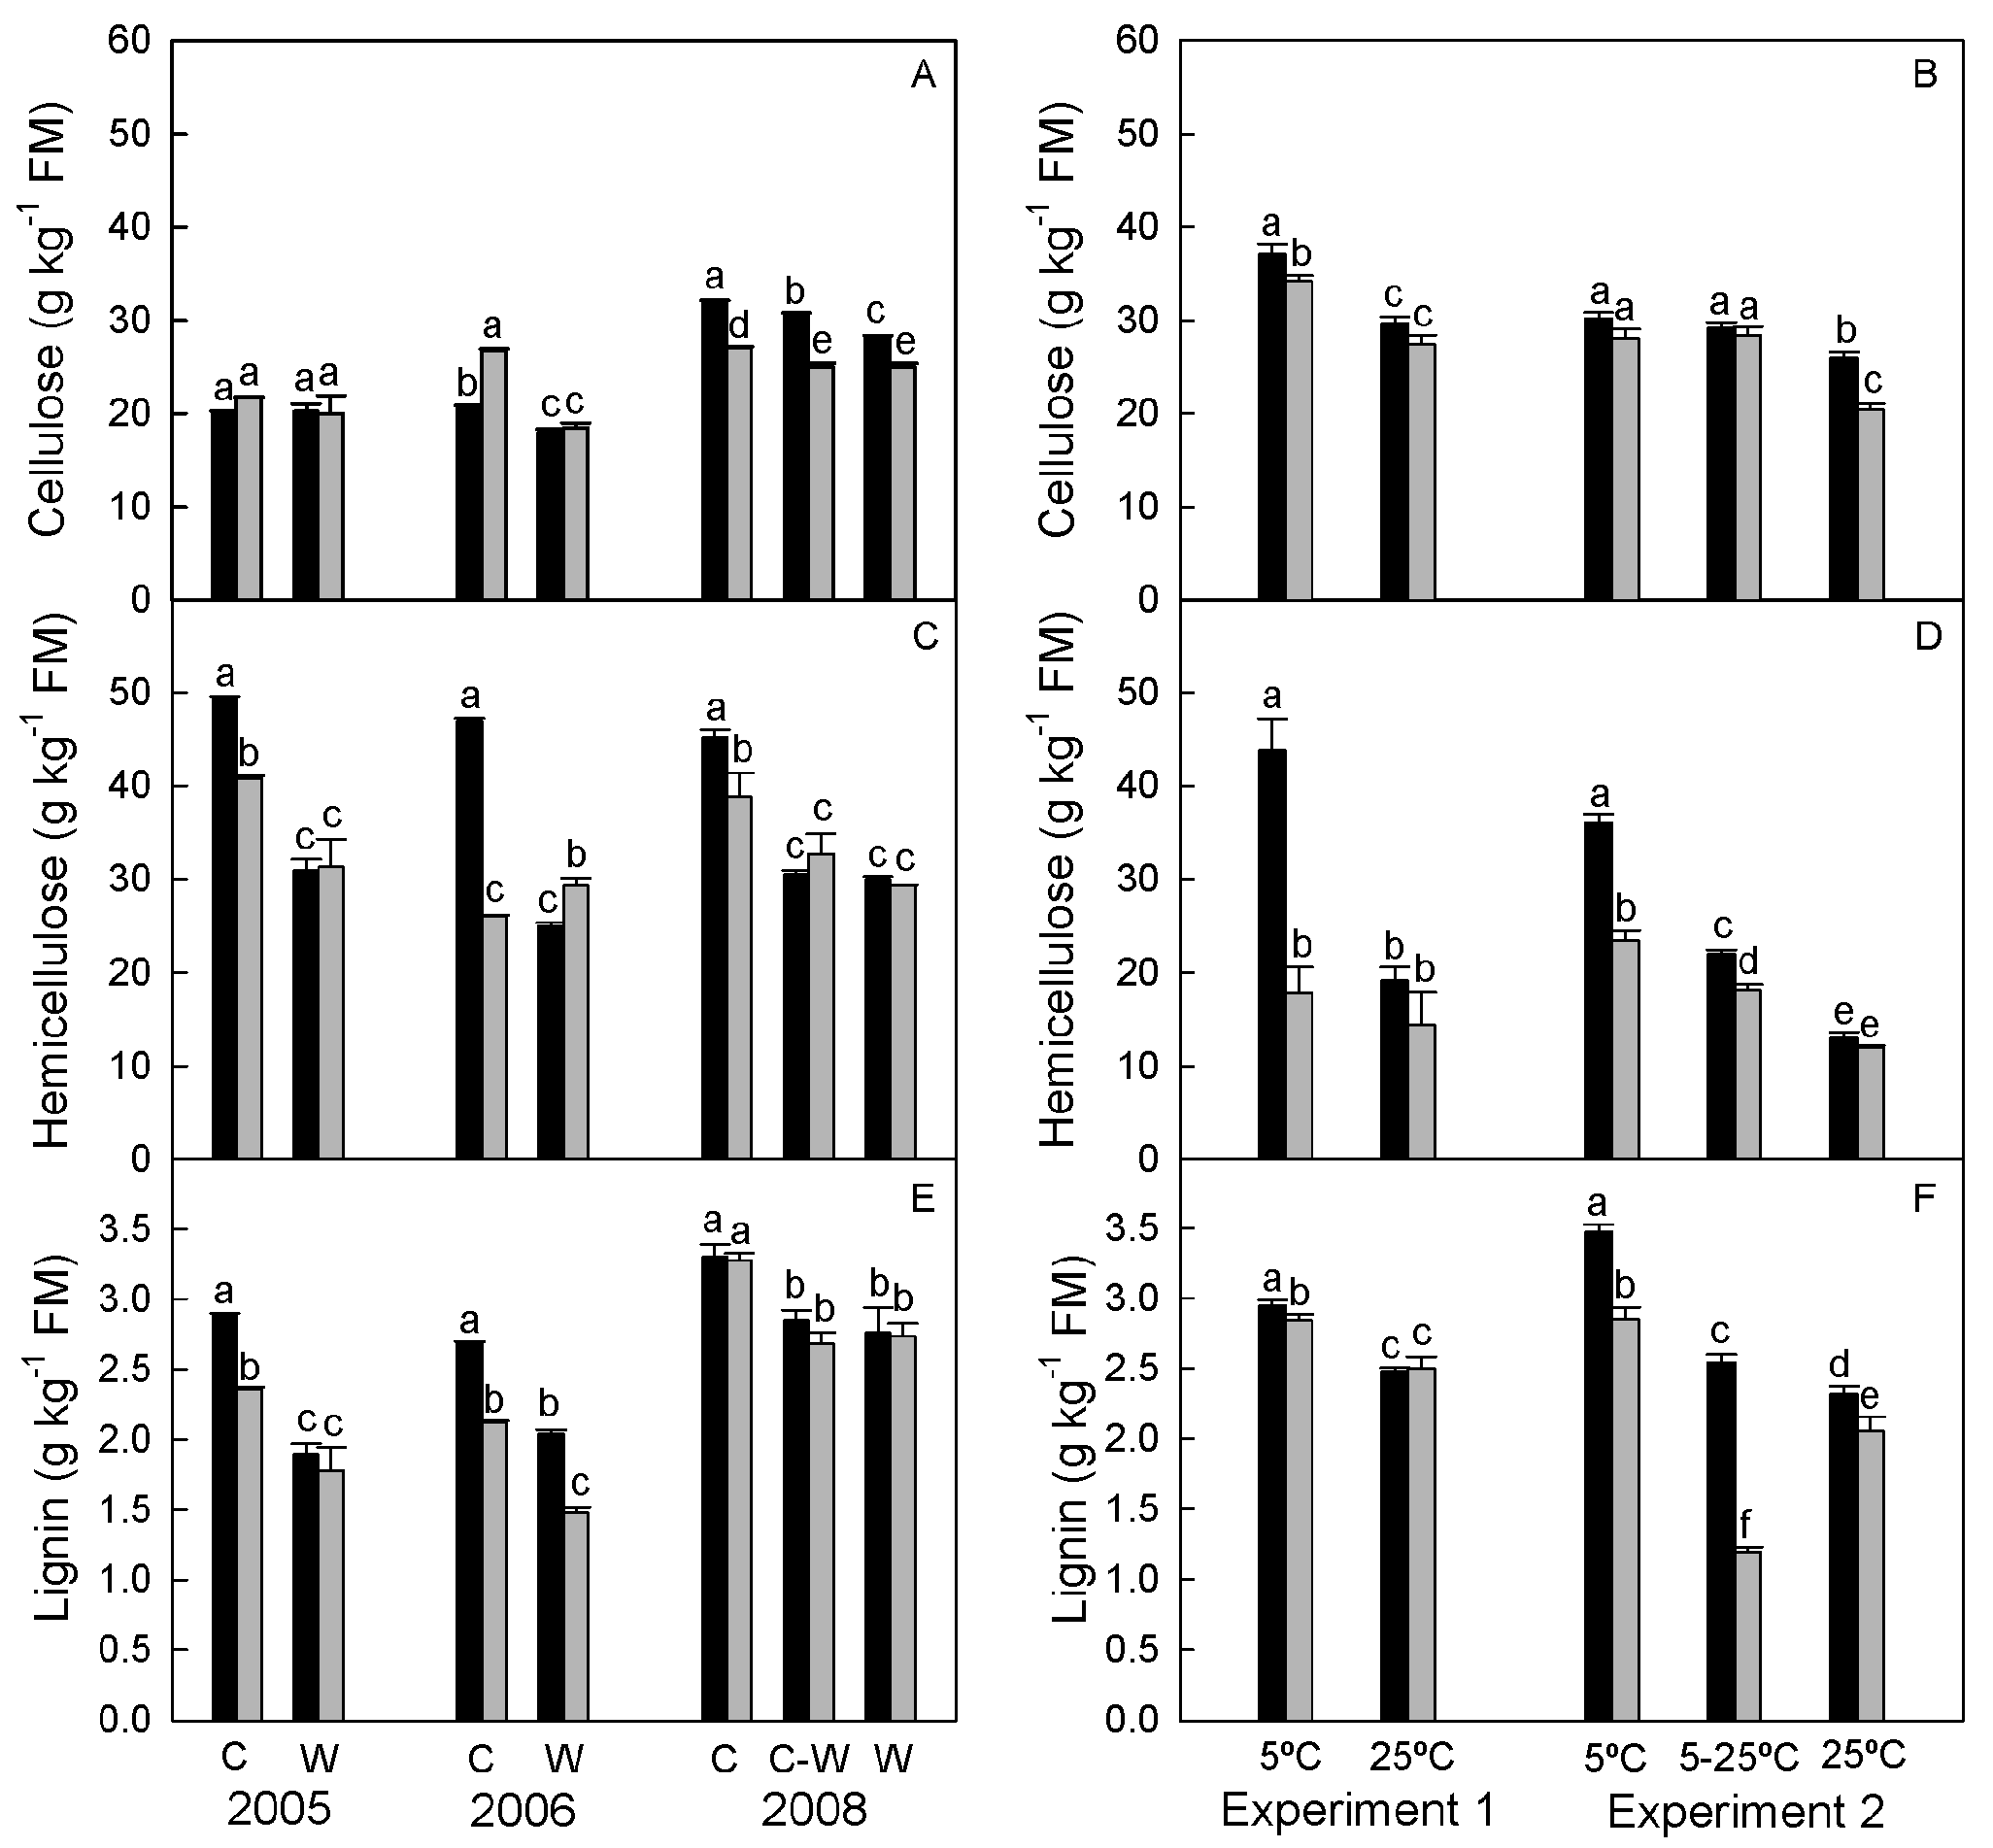
3.1.3. Structural Carbohydrates and Lignin

Cellulose and hemicellulose were the main cell wall components, ranging between 18 and 37 g·kg−1 FM, and 12 and 49 g·kg−1 FM, respectively (Figure 2). The lignin content was generally low, ranging between 1.2 and 3.5 g·kg−1 FM.
For both cultivars, the cellulose content of the leaf blades increased slightly under cooler conditions (between 13% and 25%, and 8% and 45% for cool vs. warm conditions for Pincén and Patacón, respectively, Figure 2A,B) except in the 2005 field enclosure experiment when no significant differences were found between temperatures. In the field enclosures, transferring plants from cool to warm conditions resulted in a slight (4%–7%) but significant decrease in the cellulose content of the leaf blades. The values obtained in the growth chamber experiments tended to be similar or higher than their counterparts in the field enclosures.
Hemicellulose varied most among the temperature treatments and cultivars (Figure 2C,D). Similar to cellulose, the hemicellulose values were generally higher under cool conditions (between 51% and 177%, and between 24% and 95% higher than the warm condition values for Pincén and Patacón, respectively) with the sole exception of Patacón in the 2006 experiment (−11%). The hemicellulose values of the transferred plants decreased and approached those of the warm-grown plants. The hemicellulose values in the growth chamber experiments tended to be lower than those in the field enclosures, particularly under warm conditions.
The lignin content of the leaf blades was higher under cool conditions (between 19% and 53%, and 12% and 44% higher than the warm condition values for Pincén and Patacón, respectively, Figure 2E,F). Transferring plants from cool to warm conditions resulted in a 14%–58% reduction in lignin concentrations, which approached the values of warm-grown plants or were even lower in one case (Figure 2F). The lignin values in the growth chamber were similar to those for the field enclosures, with the exception of the transferred plants of Patacón in Experiment 2, which, for unknown reasons, presented a rather low value.
Figure 2. Cellulose (g·kg−1 FM, A,B), hemicellulose (g·kg−1 FM, C,D) and lignin (g·kg−1 FM, E,F) contents of leaf blades of wheat cv. Pincén (black bars) and cv. Patacón (grey bars). (A,C,E): plants grown in cool (C, 8.1 °C–9.3 °C) or warm (W, 15.7 °C–16.5 °C) field enclosures in the 2005, 2006 and 2008 experiments. (B,D,F): plants grown in growth chambers at 5 °C or 25 °C. Plants were harvested at the 3rd fully expanded leaf stage, or at the 4th fully expanded leaf stage for plants that were transferred from cool to warm (C-W) and from 5 °C to 25 °C in the 2008 field enclosure experiment and the second growth chamber experiment, respectively. Vertical bars indicate SE (n = 3). Within each experiment, different letters indicate significant differences (p < 0.05).
Agriculture 05 00649 g002

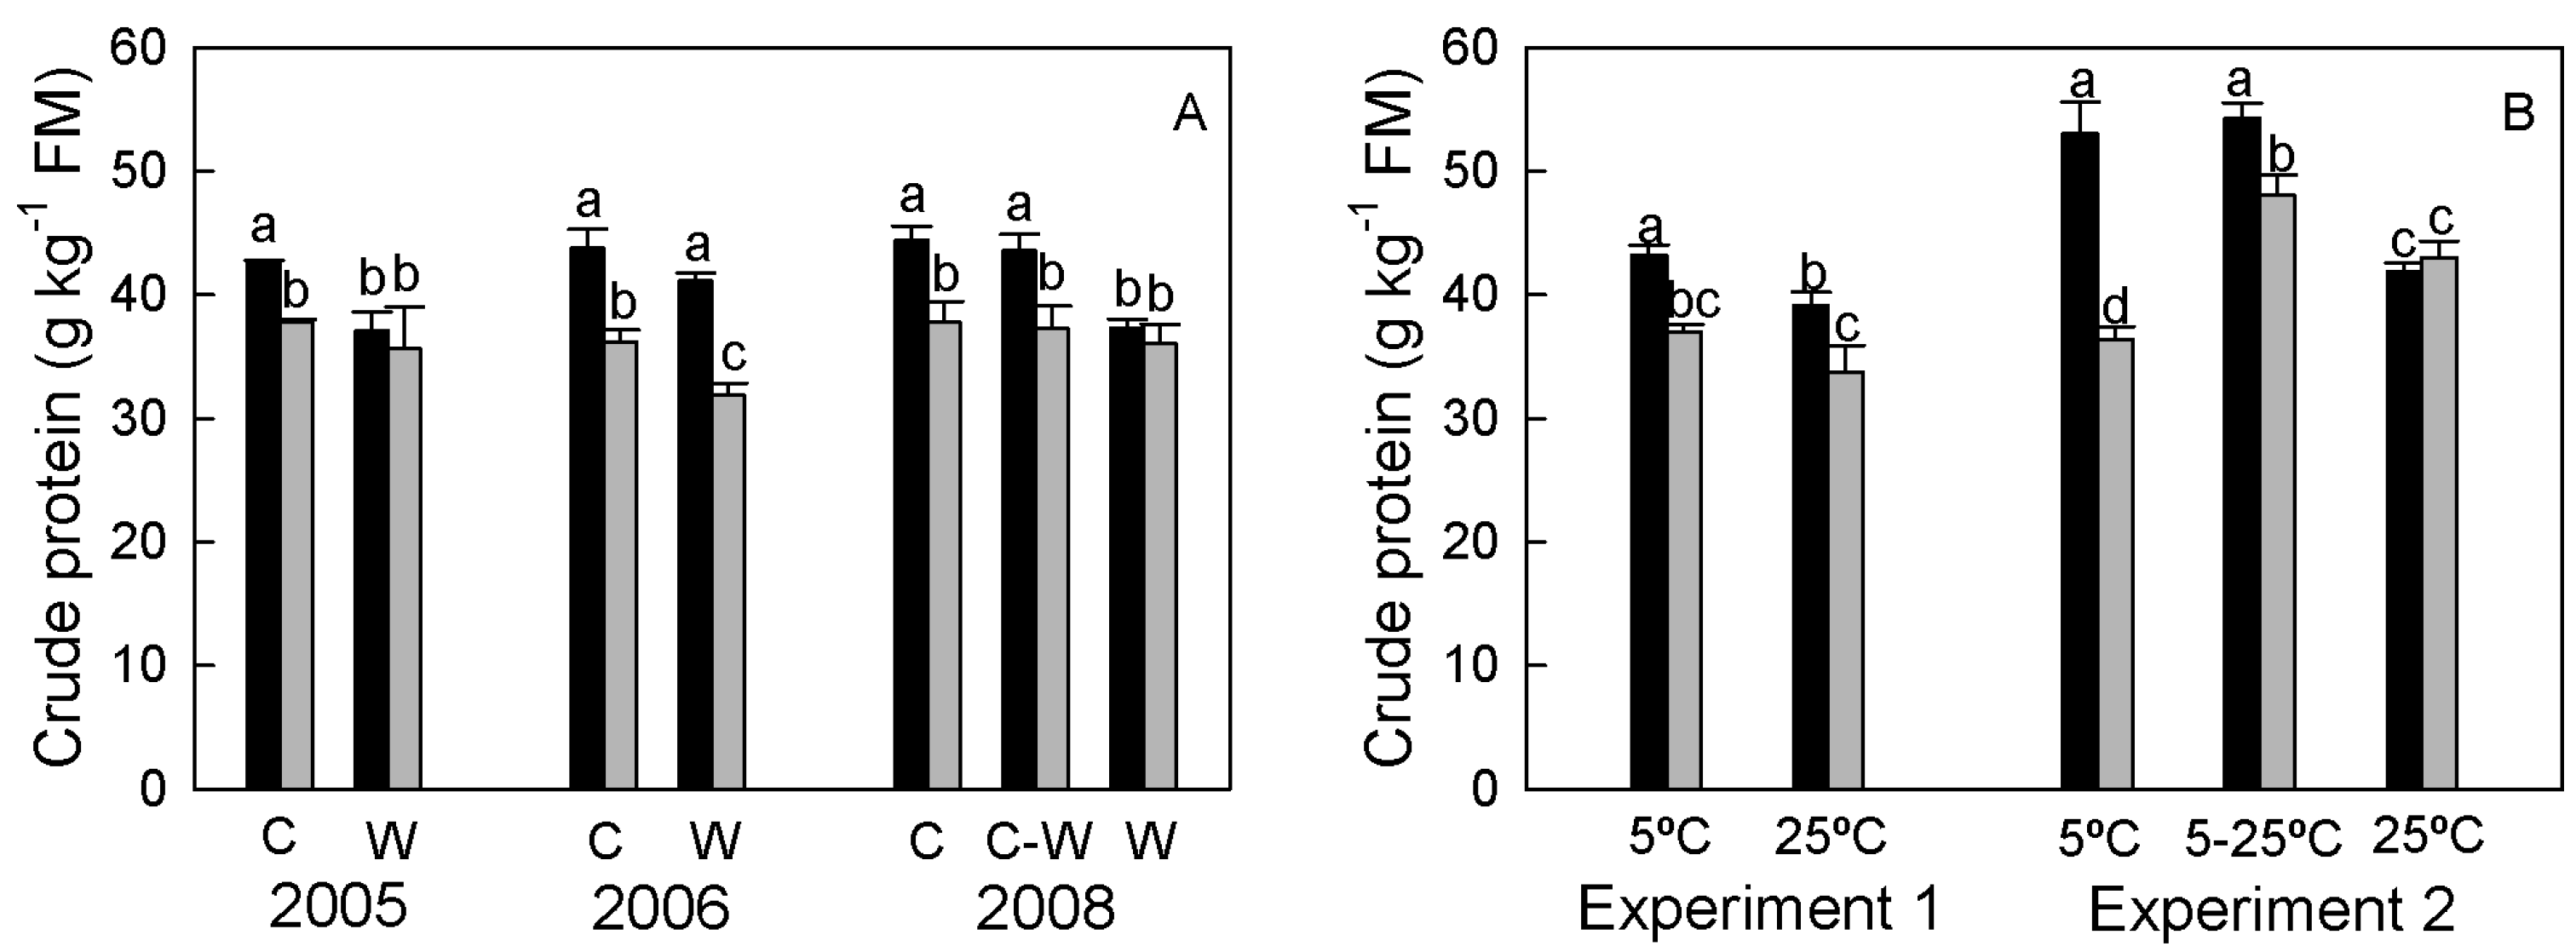
3.1.4. Crude Protein Concentration

The crude protein (CP) concentration in the leaf blades ranged between 37 and 54 g·kg−1 FM, and 32 and 48 g·kg−1 FM for Pincén and Patacón, respectively. The values for winter hardy Pincén were significantly higher under cooler conditions in both the field enclosures and the growth chamber experiments, except for the 2006 experiment when the difference was not significant (Figure 3). In contrast, no cold-induced increase in CP concentration was observed in Patacón except for the 2006 experiment. Transferring Pincén plants from cool to warm conditions did not significantly modify the CP concentration in either the field enclosures or the growth chamber experiments. No straightforward trend was observed for the CP concentration in Patacón. In general, similar values were found in the field enclosure and the growth chamber experiments, except that for Experiment 2, somewhat higher values were observed, especially for Pincén.
Figure 3. Crude protein content (g·kg−1 FM) of the leaf blades of wheat cv. Pincén (black bars) and cv. Patacón (grey bars). (A) plants grown in cool (C, 8.1 °C–9.3 °C) or warm (W, 15.7 °C–16.5 °C) field enclosures in the 2005, 2006 and 2008 experiments. (B) plants grown in growth chambers at 5 °C or 25°C. Plants were harvested at the 3rd fully expanded leaf stage, or at the 4th fully expanded leaf stage for plants that were transferred from cool to warm (C-W) and from 5 °C to 25 °C in the 2008 field enclosure experiment and in the second growth chamber experiment, respectively. Vertical bars indicate SE (n = 3). Within each experiment, different letters indicate significant differences (p < 0.05).
Agriculture 05 00649 g003

3.2. Forage Quality

3.2.1. True in Vitro Dry Matter Digestibility (IVDMD)

The IVDMD values were consistently high (above 75%, Table 3) irrespective of temperature, light environment, and cultivar. Although in some experiments significant differences were found among treatments, a straightforward pattern was not observed. In addition, the actual differences were small, even between the most contrasting treatments (approximately 70 and 40 g·kg−1 DM for the field enclosures and growth chambers, respectively).
Table 3. True in vitro dry matter digestibility (IVDMD, g·kg−1 DM) of leaf blades of wheat cv. Pincén and cv. Patacón grown in cool (8.1 °C–9.3 °C) or warm (15.7 °C–16.5 °C) field enclosures in the 2005, 2006 and 2008 experiments, and in two growth chamber experiments at 5 °C or 25 °C. Plants were harvested at the 3rd fully expanded leaf stage, or at the 4th fully expanded leaf stage for plants that were transferred from cool to warm and from 5 °C to 25 °C in the 2008 field enclosure experiment and in the second growth chamber experiment, respectively. Values are the means (± SE) of three replicates. Within each experiment, different letters indicate significant differences (p < 0.05).
PincénPatacón
Field EnclosureCool Cool-WarmWarmCoolCool-WarmWarm
2005913 ± 1.6 aN.D.917 ± 13.4 a894 ± 4.9 aN.D.912 ± 14.0 a
2006951 ± 33.2 aN.D.868 ± 13.4 a942 ± 28.4 aN.D.905 ± 23.4 a
2008754 ± 38.4 b783 ± 4.3 ab820 ± 3.9 ab842 ± 7.5 a830±2.6 ab838 ± 2.9 ab
Growth chamber5 °C5 °C–25 °C25 °C5 °C5 °C–25 °C25 °C
Experiment 1941 ± 1.6 cN.D.972 ± 2.1 a953 ± 1.8 bcN.D.962 ± 3.4 ab
Experiment 2975 ± 4.6 a963±1.4 ab936 ± 2.3 d954 ± 2.1 bc910±3.5 e946 ± 3.1 cd
N.D.: Not determined.

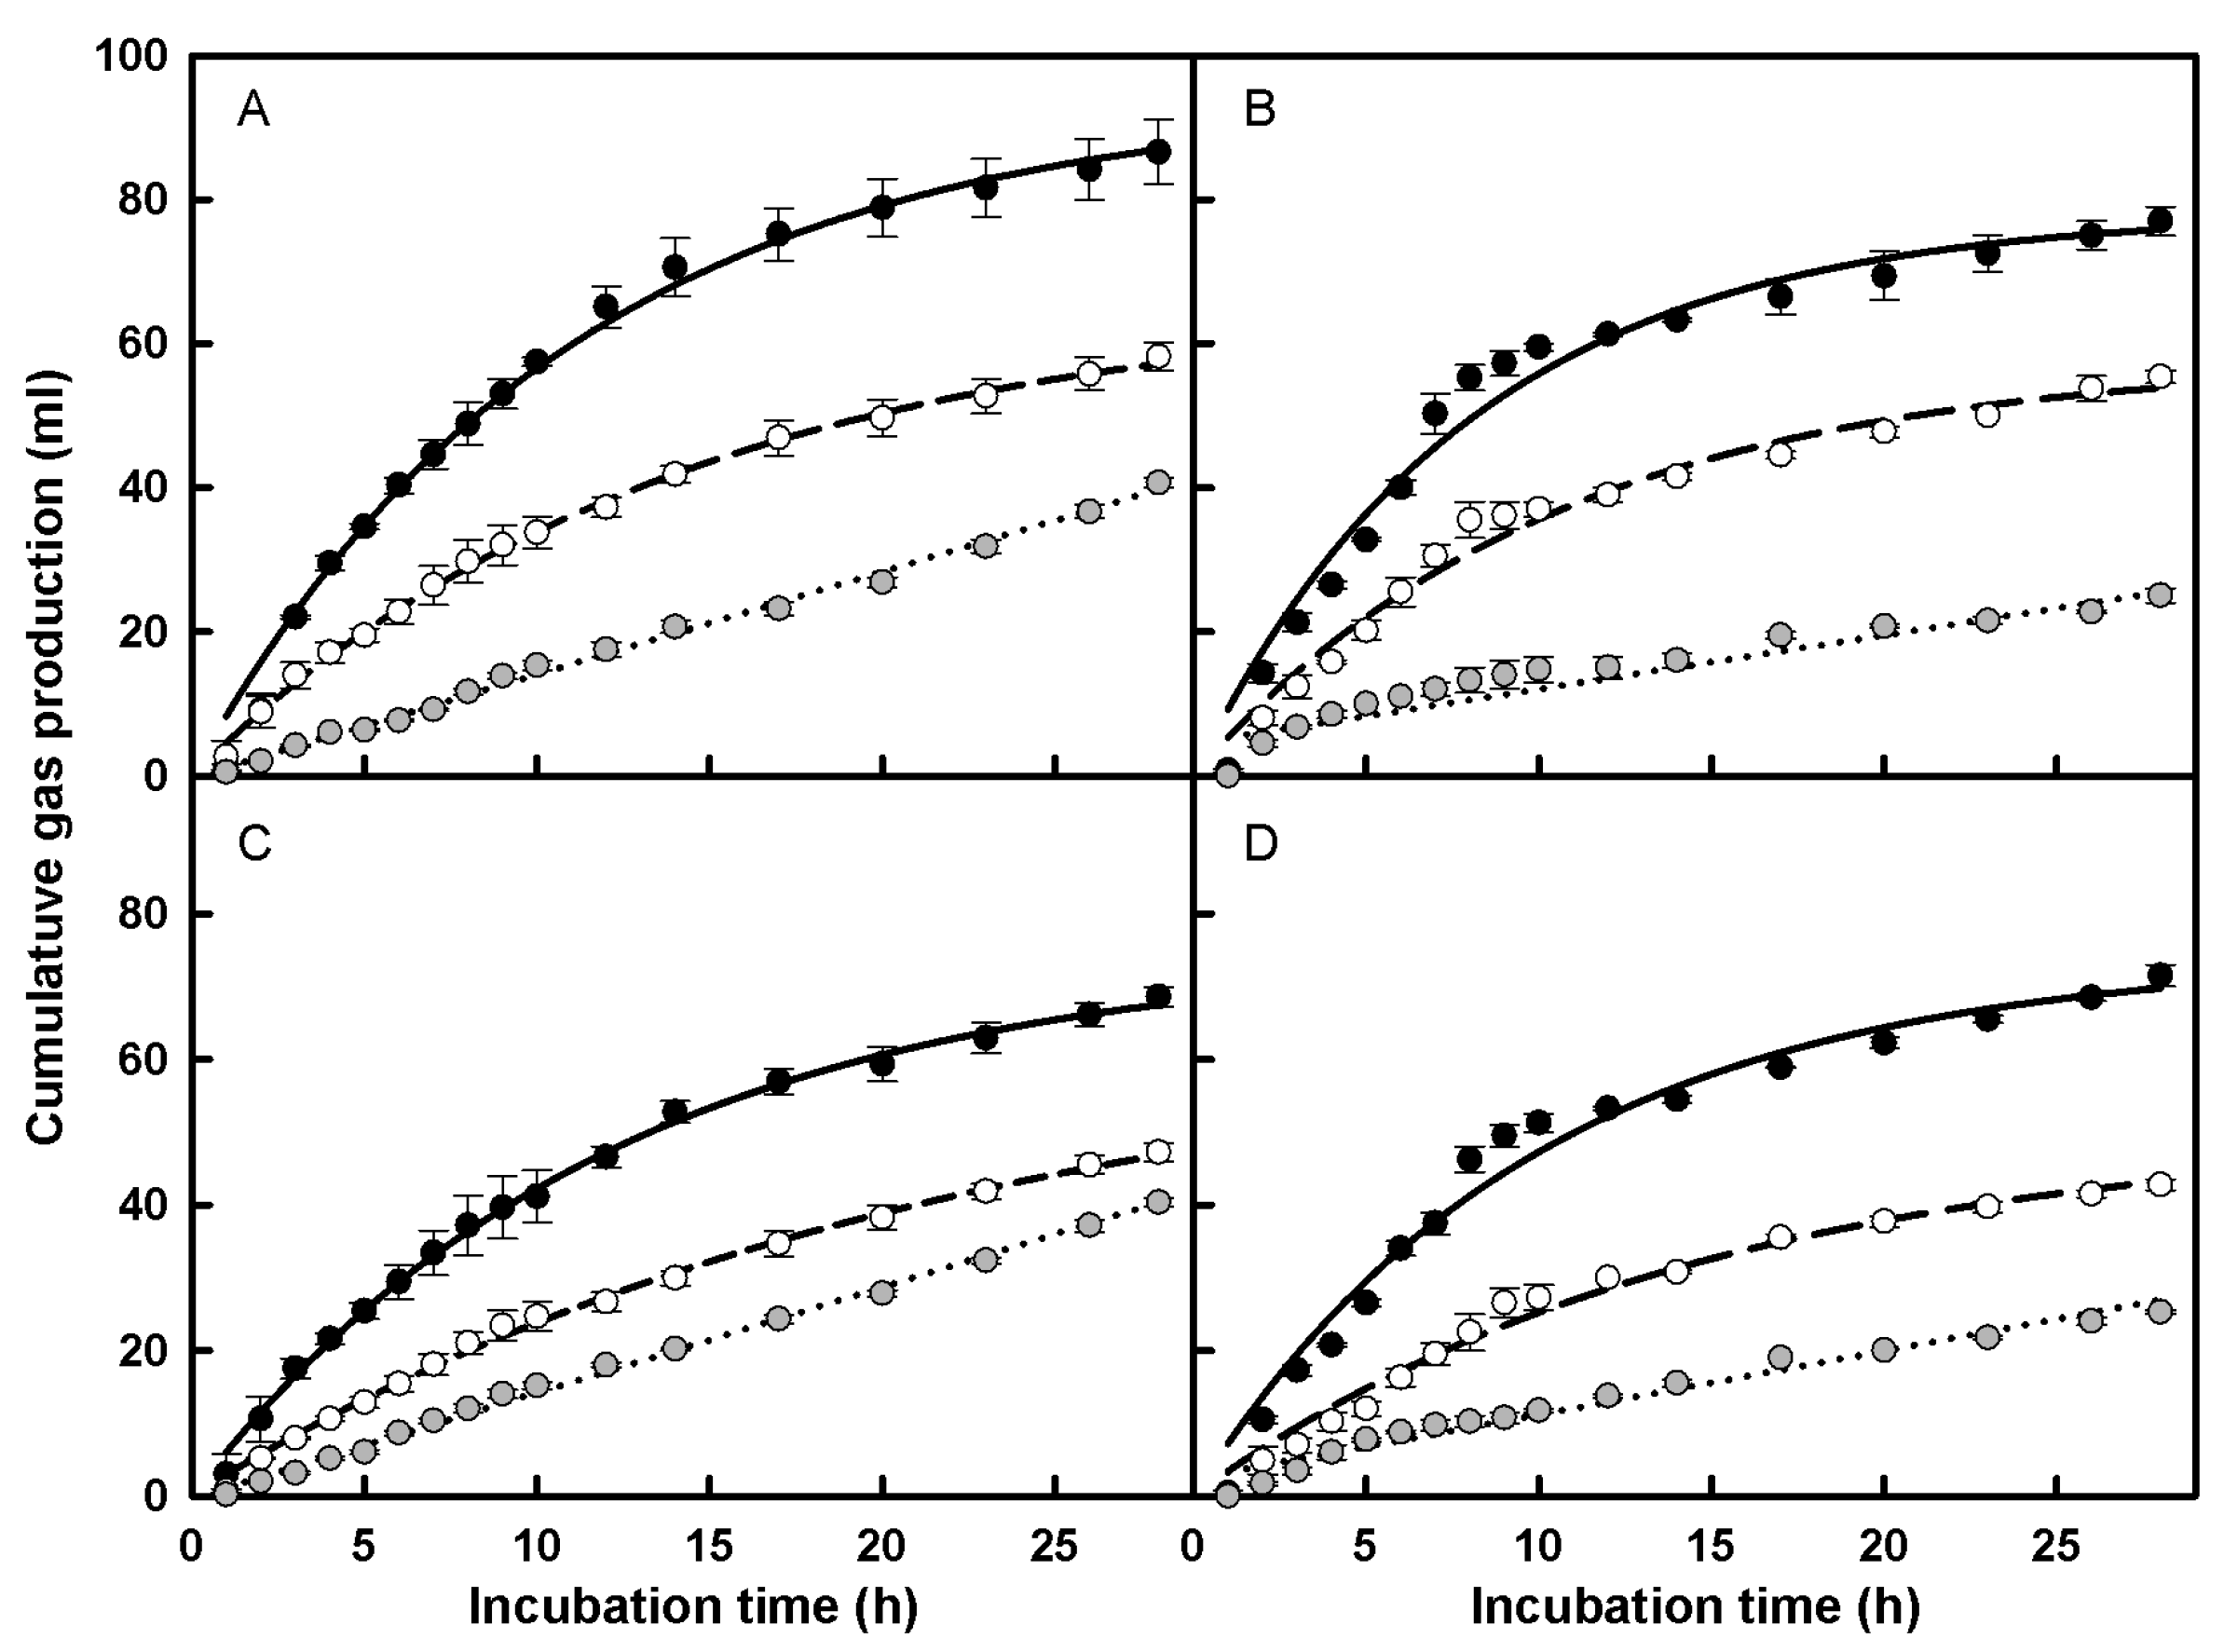
3.2.2. In Vitro Rumen Gas Production

In vitro rumen gas production analysis of leaf blades was performed for the 2008 field enclosure experiment and in the growth chamber Experiment 2. Curvilinear relationships were obtained between cumulative gas production and time up to 28 h of incubation irrespective of temperature, light environment and cultivar for plants grown at constant temperature (Figure 4).
Different gas production profiles were observed between temperatures and cultivars under constant temperature. After the first 4–5 h, the cumulative gas production from plants grown under cool conditions was approximately 65%–70% (field enclosures) or 55%–78% (growth chambers) higher than the values observed in warm environments for both cultivars. Moreover, Pincén cumulative gas production after this period was always higher than that observed for Patacón (approximately 35% in the field enclosures and 17% in the growth chambers).
Linear relationships best fit the data of plants transferred from cool to warm conditions. Cumulative gas production was considerably reduced in transferred plants, i.e., to values markedly lower than those of plants grown under warm conditions (−30% and −56% for Pincén, and −15% and −44% for Patacón for field enclosures and growth chamber experiments, respectively, at 28 h of incubation).
On the other hand, slight differences were found between the light environments for plants of either cultivar grown at constant temperatures (i.e., at 28 h, the field enclosure values were between −3% and +11% of the equivalent treatments in the growth chambers).
Figure 4. Cumulative gas production (ml) of leaf blades of wheat cv. Pincén (A,B) and cv. Patacón (C,D). (A,C): plants were grown in cool (8.1 °C–9.3 °C, black symbols, solid line) or warm (15.7 °C–16.5 °C, white symbols, dashed line) field enclosures in the 2008 experiment. (B,D): plants were grown in growth chambers at 5 °C (black symbols, solid line) or 25 °C (white symbols, dashed line) in Experiment 2. Plants were harvested at the 3rd fully expanded leaf stage except those that were transferred (grey symbols, dotted line) from cool to warm conditions in the 2008 field enclosure experiment (A,C) or from 5 °C to 25 °C (B,D) in the second growth chamber experiment, in which the plants were harvested at the 4th fully expanded leaf stage. Values correspond to the incubation of 2.5 g of minced fresh forage (mean ± SE of three replicates). The fitted models are y = a × (1 − exp(−b × t)) [45], where y is the volume of gas produced at time t, a is the final asymptotic gas volume, and b is the fractional rate of gas production and, for transferred plants, y = a + b × t, where a is the y-axis value at t = 0 and b is the rate of gas production.
Agriculture 05 00649 g004

4. Discussion

Plant components that affect forage quality, including readily digestible ones (soluble carbohydrates and crude protein, which are associated with bloat risk [19,20,21]) and non-digestible ones (lignin) generally increased under cooler conditions. This led to an increase in the dry matter content of the leaf blades, which was more pronounced in Pincén than in Patacón (Table 2). In the present work, soluble carbohydrates showed the most important changes while cellulose showed the least pronounced ones (Figure 1). In addition, changes were generally more marked in winter hardy cv. Pincén than in cv. Patacón. An increase in soluble carbohydrate concentration in cold temperatures is a very well known phenomenon in temperate grasses, which results from photosynthesis being less affected than growth by cold [46]. This response, which is associated with the capacity of plants to develop freezing tolerance [47,48,49], has been reported previously for the wheat cultivars studied here [25,32]. Transferring plants from cool to warm conditions led to a sharp decrease in TSC (Figure 1). This response may be the consequence of either a decreased TSC concentration in pre-existing leaves, or of a low concentration in the leaves developed under warm conditions, or more likely a combination of both. In any case, preliminary observations indicate that a peak in respiration within the first 24 h after transfer occurs in Pincén but not in Patacón [50].
Much less is known about the changes in the concentration of structural components due to temperature. An increase in cell wall thickness in grasses acclimated to cold has been reported [32,51]. Our finding of increased hemicellulose and lignin and, to a lesser extent, cellulose concentrations under cooler conditions (Figure 2) might be associated with this anatomical response. In plants transferred from cool to warm environments, the concentration of the different compounds tended to decrease toward values close to those of warm-grown plants. Since the proportion of the different components of leaf blades remained unmodified by ontogeny (at least up to the fifth leaf stage; data not shown) under continuous environmental conditions, the observed changes in forage composition in transferred plants could be solely attributable to the effect of temperature.
On the other hand, the light environment appeared to have only a marginal effect on the concentration of forage constituents. It has been argued that because of energy balance factors, low temperature and high light environments modify grass morpho-physiological characters in a similar manner (i.e., promoting compactness of growth habit [52], and a comparable redox state of photosystem II [53]). Nevertheless, it has been noted that freezing tolerance (measured as LT50) depends on low temperature exposure that is independent of irradiance levels [54]; therefore, the observed marked increase in TSC due to cold rather than to light is in agreement with the corresponding winter hardiness of Pincén and Patacón. While cold promotes a strong C accumulation due to an altered balance between growth and C utilization [46], it has been shown that light intensity not only favors assimilate availability but also plant growth (i.e., higher shoot fresh mass at harvest in the field enclosures compared with the growth chambers [28]), thus preventing a substantial carbohydrate accumulation. Consequently, within each temperature treatment (i.e., cool and 5 °C or warm and 25 °C), plants grown under higher irradiances (field enclosures) were larger than those grown under low irradiances (growth chambers), as shown previously [28].
Both parameters of forage quality, i.e., IVDMD and gas production, had markedly different responses to growing conditions and cultivar (Table 3 and Figure 4). A low correlation between both parameters was reported previously [55]. A first possible reason for the divergence between the two parameters could be the different incubation times. IVDMD was assessed at the end of a 48 h-incubation period while cumulative gas production assessed the dynamics of forage degradation up to 28 h, which is sensitive to changes in the proportion of forage constituents that differ in digestion rates. A 48 h-incubation period exceeds the ruminal retention time of high quality feeds in animals of high potential production (e.g., < 24 h) [56]. However, a second major factor is that fresh tissue was used for analyzing gas production, in contrast with IVDMD, which uses dry matter. Thus, variation in the dry matter content of the tissue is likely to modify only in vitro rumen gas production. There is strong evidence indicating that voluntary consumption of fresh forage by ruminants is closely related to forage volume (which in turn is related to fresh mass), and not to dry mass [57,58]. Therefore, in vitro rumen gas production from fresh forage incubation may more closely reflect what is actually happening in the animal rumen.
Despite large variations in the concentration of the forage components, IVDMD was almost unaffected by changes in temperature, light environment or cultivar (Table 3). There are reports indicating that cool temperatures may increase IVDMD. For example, this response has been found in tall fescue [59], timothy [60,61], and six other temperate grasses [61]. However, in other cases, no consistent effect of temperature on IVDMD was found [62]. A possible explanation for the lack of IVDMD increase at low temperature here is that even under warm environments, the values were high (ranging from 820 to 917 g·kg−1 DM in the field enclosures and 936 to 972 g·kg−1 DM in the growth chambers). The high values of IVDMD were expected since we evaluated the forage quality of the leaf blades of very young wheat plants in this study. It is well known that IVDMD decreases with leaf age [63,64].
Contrasting results have been reported with respect to the effect of light on IVDMD [65]. It has been suggested that only shade-intolerant species have their quality reduced by shade, mainly because of a decrease in total soluble carbohydrate concentration [66]. In our experiments, plants from the growth chambers (i.e., lower light intensity) tended to show higher IVDMD values than those from the field enclosures (Table 3).
On the other hand, in vitro rumen gas production was largely modified by temperature and, to a lesser extent, by cultivars (Figure 4). In general, variation in gas production was in agreement with the changes in TSC (Figure 1). This is expected since gas is produced as the result of fermentation by ruminal fluid. The only exception was observed in transferred plants, which exhibited the lowest gas production despite showing TSC values that were higher than those of warm grown plants. In this sense, it has been shown that a high proportion of TSC in cold-acclimated plants consists of fructans that are inserted into the lipid headgroup region of the plasma membrane and help to stabilize it under freezing stress [67,68,69]. Given the fact that fructans may represent as much as 80% of TSC in cold-acclimated wheat [70], a hypothesis for further study is that part of the fructans inserted in the plasma membranes during growth at low temperature could remain there for a certain time after plants have been subjected to warmer conditions. This category of fructans might be less easily fermented by ruminal enzymes, but still captured in the chemical quantification of TSC. Because gas production is associated with bloat risk, information from further research into these points could be useful for grazing management of dual-purpose wheat crops grown in environments with changing temperatures in the autumn-winter period, conditions commonly found in the Argentinean Pampas.
It is well known bloat risk is tightly related to high sugar levels [19,20,21], but in turn, the latter are required for high freezing tolerance [47,48,49]. Consequently, it appears that simultaneously improving wheat for both low bloat risk and freeze hardening may be difficult. However, if the hypothesis that fructan inserted into the plasma membranes is less readily fermented in the rumen is supported, then studying genotype-associated variation in fructan partitioning between soluble and membrane-bound fractions could provide useful information for breeding purposes.

5. Conclusions

In parallel with the expected increase in sugar accumulation, low temperatures led to an increase in hemicellulose and crude protein concentration. This response was more marked in the hardy cultivar Pincén. While negligible changes in response to temperature were observed in in vitro dry matter digestibility, in vitro rumen gas production was much higher at cooler temperatures, especially in the higher sugar accumulating cultivar. This effect was rapidly reversed in plants transferred from cool to warm conditions. In contrast to temperature, light intensity appeared to have a lower impact on forage quality. Future experiments should focus on the remobilization of cool-induced membrane-bound fructans and their association with rumen gas production in animals.

Supplementary Files

Supplementary File 1

Acknowledgments

This work, which is part of Máximo Lorenzo’s PhD thesis at Universidad Nacional de Mar del Plata (UNMdP), Argentina, is supported by a grant from UNMdP (AGR-360). The authors thank Patricio Fay for his assistance with the in vitro rumen gas production analyses.

Author Contributions

All co-authors contributed equally to this work.

Conflicts of Interest

The authors declare no conflict of interest.

References

  1. Hossaina, I.; Epplin, F.M.; Krenzer, E.G. Planting date influence on dual-purpose winter wheat forage yield, grain yield, and test weight. Agron. J. 2003, 95, 1179–1188. [Google Scholar] [CrossRef]
  2. Butchee, J.D.; Edwards, J.T. Dual-purpose wheat grain yield as affected by growth habit and simulated grazing intensity. Crop Sci. 2013, 53, 1686–1692. [Google Scholar] [CrossRef]
  3. Dove, H.; McMullen, G. Diet selection, herbage intake and liveweight gain in young sheep grazing dual-purpose wheats and sheep responses to mineral supplements. Anim. Prod. Sci. 2009, 49, 749–758. [Google Scholar] [CrossRef]
  4. Kelman, W.M.; Dove, H. Growth and phenology of winter wheat and oats in a dual-purpose management system. Crop Pasture Sci. 2009, 60, 921–932. [Google Scholar] [CrossRef]
  5. Tian, L.H.; Bell, L.W.; Shen, Y.Y.; Whish, J.P.M.; Nan, Z.B. Dual-purpose use of winter wheat in western China: Cutting time effects on forage production and grain yield. Crop Pasture Sci. 2012, 63, 520–528. [Google Scholar] [CrossRef]
  6. Arzadun, M.J.; Arroquy, J.I.; Laborde, H.E.; Brevedan, R.E. Grazing pressure on beef and grain production of dual-purpose wheat in Argentina. Agron. J. 2003, 95, 1157–1162. [Google Scholar] [CrossRef]
  7. Arzadun, M.J.; Arroquy, J.I.; Laborde, H.E.; Brevedan, R.E. Effect of planting date, clipping height, and cultivar on forage and grain yield of winter wheat in Argentinean Pampas. Agron. J. 2006, 98, 1274–1279. [Google Scholar] [CrossRef]
  8. Peralta, N.; Abbate, P.E.; Marino, A. Effect of the defoliation regime on grain production in dual purpose wheat. Agriscientia 2011, 28, 1–11. [Google Scholar]
  9. Morant, A.E.; Merchán, H.D.; Lutz, E.E. Comparación de la producción forrajera de cultivares de trigo para doble propósito. Rev. Argent. Prod. Anim. 1998, 18, 213–214. [Google Scholar]
  10. Lutz, E.E.; Merchán, H.D.; Morant, A.E. Carne y grano de un trigo doble propósito en condiciones semiá-ridas. Phyton (Buenos Aires) 2000, 67, 195–200. [Google Scholar]
  11. Lutz, E.E.; Merchán, H.D.; Morant, A.E. Estado de desarrollo de la planta de trigo (var. ProINTA Pincén) al momento de la última defoliación y su rendimiento en grano. Phyton (Buenos Aires) 2000, 68, 83–87. [Google Scholar]
  12. Bainotti, C.T.; Gomes, D.; Masiero, B.; Salines, J.; Fraschina, J.; Bertram, N.; Navarro, C. Evaluación de Cultivares de trigo como Doble Propósito. Available online: http://agrolluvia.com/wp-content/uploads/2010/05/INTA-Marcos-Ju%C3%A1rez-Evaluaci%C3%B3n-de-cultivares-de-trigo-como-doble-prop%C3%B3sito1.pdf (accessed on 18 May 2015).
  13. Morant, A.E.; Merchán, H.D.; Lutz, E.E. Evaluación de genotipos de trigos para doble propósito. Fecha de siembra y producción de grano. Rev. Argic. Prod. Anim. 2003, 23, 222–223. [Google Scholar]
  14. Lutz, E.; Merchán, H.; Morant, A. Mezcla de variedades de trigo para doble propósito. Phyton (Buenos Aires) 2008, 77, 217–223. [Google Scholar]
  15. Bell, L.W.; Moore, A.D. Mixed Crop-livestock Businesses Reduce Price- and Climate-induced Variability in Farm Returns: A Model-derived Case Study. Available online: http://aciar.gov.au/files/node/13992/mixed_crop_livestock_businesses_reduce_price_and__20972.pdf (accessed on 3 August 2015).
  16. Walker, D.W.; West, C.P.; Bacon, R.K.; Longer, D.E.; Turner, K.E. Changes in forage yield and composition of wheat and wheat-ryegrass mixtures with maturity. J. Dairy Sci. 1990, 73, 1296–1303. [Google Scholar] [CrossRef]
  17. Paterson, J.A.; Bowman, J.P.; Belyea, R.L.; Kerley, M.S.; Williams, J.E. The impact of forage quality and supplementation regimen on ruminant animal intake and performance. In Forage Quality, Evaluation, and Utilization; Fahey, G.C., Ed.; American Society of Agronomy, Crop Science Society of America, Soil Science Society of America: Madison, WI, USA, 1994; pp. 59–114. [Google Scholar]
  18. Kelman, W.M.; Dove, H.; Flint, P. The Potential of Winter Wheat Cultivars and Breeding Lines for Use in Dual-purpose (Grain and Graze) Systems. Available online: http://www.regional.org.au/au/asa/2006/poster/systems/4613_kelmanw.htm (accessed on 18 May 2015).
  19. Howarth, R.E.; Horn, G.W. Wheat pasture bloat of stocker cattle: A comparison with legume pasture bloat. In Proceedings of the National Wheat Pasture Symposium; Division of Agriculture, Oklahoma State University: Stillwater, OK, USA, 1984; pp. 24–25. [Google Scholar]
  20. Horn, G.W. Growing cattle on winter wheat pasture: Management and herd health considerations. Vet. Clin. North Am. Food A 2006, 22, 335–356. [Google Scholar] [CrossRef] [PubMed]
  21. Min, B.R.; Pinchak, W.E.; Mathews, D.; Fulford, J.D. In vitro rumen fermentation and in vivo bloat dynamics of steers grazing winter wheat to corn oil supplementation. Anim. Feed Sci. Technol. 2007, 133, 192–205. [Google Scholar] [CrossRef]
  22. Mayland, H.F.; Cheeke, P.R.; Majak, W.; Goff, J.P. Forage-induced animal disorders. In Forages, 6th ed.; Nelson, C.J., Moore, K.M., Collins, M., Eds.; Blackwell Publication: Ames, IA, USA, 2007; Volume 2, pp. 687–707. [Google Scholar]
  23. Malinowski, D.P.; Pitta, D.W.; Pinchak, W.E.; Min, B.R.; Emendack, Y.Y. Effect of nitrogen fertilisation on diurnal phenolic concentration and foam strength in forage of hard red wheat (Triticum aestivum L.) cv. Cutter. Crop Pasture Sci. 2011, 62, 656–665. [Google Scholar] [CrossRef]
  24. Min, B.R.; Pinchak, W.E.; Fulford, J.D.; Puchala, R. Wheat pasture bloat dynamics, in vitro ruminal gas production, and potential bloat mitigation with condensed tannins. J. Anim. Sci. 2005, 83, 1322–1331. [Google Scholar] [PubMed]
  25. Tognetti, J.A.; Calderón, P.L.; Pontis, H.G. Fructan metabolism: Reversal of cold acclimation. J. Plant Physiol. 1989, 134, 232–236. [Google Scholar] [CrossRef]
  26. Tognetti, J.A.; Salerno, C.L.; Crespi, M.D.; Pontis, H.G. Sucrose and fructan metabolism of different wheat cultivars at chilling temperatures. Physiol. Plant. 1990, 78, 554–559. [Google Scholar] [CrossRef]
  27. Equiza, M.A.; Miravé, J.P.; Tognetti, J.A. Differential root versus shoot growth inhibition and its relationship with carbohydrate accumulation at low temperature in different wheat cultivars. Ann. Bot. 1997, 80, 657–663. [Google Scholar] [CrossRef]
  28. Lorenzo, M.; Assuero, S.G.; Tognetti, J.A. Low temperature differentially affects tillering in spring and winter wheat in association with changes in plant carbon status. Ann. App. Biol. 2015, 166, 236–248. [Google Scholar] [CrossRef]
  29. Equiza, M.A.; Tognetti, J.A. Morphological plasticity of spring and winter wheats under changing temperatures. Funct. Plant Biol. 2002, 29, 1427–1436. [Google Scholar] [CrossRef]
  30. Blair, R.M.; Alcaniz, R.; Harrell, A. Shade intensity influences the nutrient quality and digestibility of southern deer browse leaves. J. Range Manag. 1983, 36, 257–264. [Google Scholar] [CrossRef]
  31. Moura, J.C.; Bonine, C.A.; de Oliveira Fernandes Viana, J.; Dornelas, M.C.; Mazzafera, P. Abiotic and biotic stresses and changes in the lignin content and composition in plants. J. Integr. Plant Biol. 2010, 52, 360–376. [Google Scholar] [CrossRef] [PubMed]
  32. Equiza, M.A.; Miravé, J.P.; Tognetti, J.A. Morphological, anatomical and physiological responses related to differential shoot vs. root growth inhibition at low temperature in spring and winter wheat. Ann. Bot. 2001, 87, 67–76. [Google Scholar] [CrossRef]
  33. Assuero, S.G.; Lorenzo, M.; Pérez, N.M.; Velázquez, L.; Tognetti, J.A. Tillering promotion by paclobutrazol in wheat and its relationship with plant carbohydrate status. N. Z. J. Agric. Res. 2012, 55, 347–358. [Google Scholar] [CrossRef]
  34. Hoagland, D.R.; Arnon, D.I. The water-culture method for growing plants without soil. Calif. Agric. Exp. Stn. Circ. 1950, 347, 1–32. [Google Scholar]
  35. Dubois, M.; Gilles, K.A.; Hamilton, J.K.; Rebers, P.A.; Smith, F. Colorimetric method for determination of sugars and related substances. Anal. Chem. 1956, 28, 350–356. [Google Scholar] [CrossRef]
  36. Komareck, A.R.; Robertson, J.B.; van Soest, P.J. Comparison of the filter bag technique to conventional filtration in the Van Soest NDF analysis of 21 feeds. In Proceedings of the National Conference on Forage Quality, Evaluation and Utilization, Lincoln, NE, USA, 13–15 April 1994; Fahey, G.C., Ed.; Nebraska University: Lincoln, NE, USA, 1994. [Google Scholar]
  37. Komareck, A.R.; Robertson, J.B.; Van Soest, P.J. A comparison of methods for determining ADF using the filter bag technique versus conventional filtration. J Dairy Sci. 1993, 77, 24–26. [Google Scholar]
  38. Goering, H.K.; van Soest, P.J. Forage fiber analyses (Apparatus, Reagents, Procedures and Some Applications). In USDA-ARS Agricultural Handbook 379; US Government Printing Office: Washington, DC, USA, 1970; p. 20. [Google Scholar]
  39. Horneck, D.A.; Miller, R.O. Determination of total nitrogen in plant tissue. In Handbook of Reference Methods for Plant Analysis; Kalra, Y.P., Ed.; CRC Press: London, UK, 1998; pp. 75–83. [Google Scholar]
  40. ANKOM Tecnology. Analytical Methods in vitro True Digestibility Method (IVTD-Daisy). Available online: https://ankom.com/sites/default/files/document-files/Method_3_Invitro_0805_D200%2CD200I.pdf (accessed on 3 August 2015).
  41. Fay, J.P.; Cheng, K.-J.; Hanna, M.R.; Howarth, R.E.; Costerton, J.W. In vitro digestion of boat-safe and boat-causing legumes by rumen microorganisms: Gas and foam production. J Dairy Sci. 1980, 63, 1273–1281. [Google Scholar] [CrossRef]
  42. McDougall, E.I. Studies on ruminant saliva. 1. The composition and output of sheep’s saliva. Biochem. J. 1948, 43, 99–109. [Google Scholar] [CrossRef] [PubMed]
  43. Tanino, K.; Weiser, C.J.; Fuchigami, L.H.; Chen, T.H. Water content during abscisic acid induced freezing tolerance in bromegrass cells. Plant Physiol. 1990, 93, 460–464. [Google Scholar] [CrossRef] [PubMed]
  44. Wanner, L.A.; Junttila, O. Cold-induced freezing tolerance in Arabidopsis. Plant Physiol. 1999, 120, 391–400. [Google Scholar] [CrossRef] [PubMed]
  45. Ørskov, E.R.; McDonald, I. The estimation of protein degradability in the rumen from incubation measurements weighted according to rate of passage. J. Agric. Sci. 1979, 92, 499–503. [Google Scholar] [CrossRef]
  46. Pollock, C.J. The response of plants to temperature change. J. Agric. Sci. 1990, 115, 1–5. [Google Scholar] [CrossRef]
  47. Levitt, J. Responses of plants to environmental stress. In Chilling, Freezing, and High Temperature Stresses, 2nd ed.; Academic Press: New York, NY, USA, 1980; p. 447. [Google Scholar]
  48. Tarkowski, Ł.P.; van den Ende, W. Cold tolerance triggered by soluble sugars: A multifaceted countermeasure. Front. Plant Sci. 2015, 6, 203. [Google Scholar]
  49. Van den Ende, W. Multifunctional fructans and raffinose family oligosaccharides. Front. Plant Sci. 2013, 4, 247. [Google Scholar] [PubMed]
  50. Panelo, J.S.; Redi, W.I.; Lorenzo, M.; Tognetti, J. Efecto del Incremento de la Temperatura Sobre la Fotosíntesis y la Respiración en Plantas de Trigo Aclimatadas a Bajas Temperaturas. Available online: http://fisiologiavegetal.org/fv2014/abstract-index/abstracts/#905 (accessed on 21 September 2014).
  51. Huner, N.P.A.; Palta, J.P.; Li, P.H.; Carter, J.V. Anatomical changes in leaves of Puma rye in response to growth at cold-hardening temperatures. Bot. Gaz. 1981, 142, 55–62. [Google Scholar] [CrossRef]
  52. Huner, N.P.A.; Oquist, G.; Sarhan, F. Energy balance and acclimation to light and cold. Trends Plant Sci. 1998, 3, 224–230. [Google Scholar] [CrossRef]
  53. Ndong, C.; Danyluk, J.; Huner, N.P.; Sarhan, F. Survey of gene expression in winter rye during changes in growth temperature, irradiance or excitation pressure. Plant Mol. Biol. 2001, 45, 691–703. [Google Scholar] [CrossRef] [PubMed]
  54. Gray, G.R.; Chauvin, L.P.; Sarhan, F.; Huner, N.P. Cold acclimation and freezing tolerance (A complex interaction of light and temperature). Plant Physiol. 1997, 114, 467–474. [Google Scholar] [PubMed]
  55. Getachew, G.; Robinson, P.H.; DePeters, E.J.; Taylor, S.J. Relationships between chemical composition, dry matter degradation and in vitro gas production of several ruminant feeds. Anim. Feed Sci. Technol. 2004, 111, 57–71. [Google Scholar] [CrossRef]
  56. Lopez-Guisa, J.M.; Satter, L.D. Effect of forage source on retention of digesta markers applied to corn gluten meal and brewers grains for heifers. J. Dairy Sci. 1991, 74, 4297–4304. [Google Scholar] [CrossRef]
  57. John, A.; Ulyatt, M.J. Importance of dry matter content to voluntary intake of fresh grass forages. Proc N. Z. Soc. Anim. Prod. 1987, 47, 13–16. [Google Scholar]
  58. Cabrera Estrada, J.I.; Delagarde, R.; Faverdin, P.; Peyraud, J.L. Dry matter intake and eating rate of grass by dairy cows is restricted by internal, but not external water. Anim. Feed Sci. Technol. 2004, 114, 59–74. [Google Scholar] [CrossRef]
  59. Allinson, D.W. Influence of photoperiod and thermoperiod on the IVDMD and cell wall components of tall fescue. Crop Sci. 1971, 11, 456–458. [Google Scholar] [CrossRef]
  60. Bertrand, A.; Tremblay, G.F.; Pelletier, S.; Castonguay, Y.; Bélanger, G. Yield and nutritive value of timothy as affected by temperature, photoperiod and time of harvest. Grass Forage Sci. 2008, 63, 421–432. [Google Scholar] [CrossRef]
  61. Thorvaldsson, G.; Tremblay, G.F.; Tapani Kunelius, H. The effects of growth temperature on digestibility and fibre concentration of seven temperate grass species. Acta Agric. Scand. Sect. B 2007, 57, 322–328. [Google Scholar] [CrossRef]
  62. Crasta, O.R.; Cox, W.J.; Cherney, J.H. Factors affecting maize forage quality development in the northeastern USA. Agron. J. 1997, 89, 251–256. [Google Scholar] [CrossRef]
  63. Agnusdei, M.G.; di Marco, O.N.; Nenning, F.R.; Aello, M.S. Leaf blade nutritional quality of rhodes grass (Chloris gayana) as affected by leaf age and length. Crop Pasture Sci. 2012, 62, 1098–1105. [Google Scholar] [CrossRef]
  64. Di Marco, O.N.; Harkes, H.; Agnusdei, M.G. Calidad de agropiro alargado (Thinopyrum ponticum) en estado vegetativo en relación con la edad y longitud de las hojas. RIA 2013, 39, 105–110. [Google Scholar]
  65. Reynolds, S.G. Pasture-Cattle-Coconut Systems; FAO RAPA Publication: Bangkok, Thailand, 1995; p. 668. [Google Scholar]
  66. Samarakoon, S.P.; Wilson, J.R.; Shelton, H.M. Growth, morphology and nutritive quality of shaded Stenotaphrum secundatum, Axonopus compressus and Pennisetum clandestinum. J Agric. Sci. 1990, 114, 161–169. [Google Scholar] [CrossRef]
  67. Livingston, D.P., III; Hincha, D.K.; Heyer, A.G.; Norio, S.; Noureddine, B.; Shuichi, O. The relationship of fructan to abiotic stress tolerance in plants. In Recent Advances in Fructooligosaccharides Research; Norio, S., Noureddine, B., Shuichi, O., Eds.; Research Signpost: Kerala, India, 2007; pp. 181–199. [Google Scholar]
  68. Valluru, R.; van den Ende, W. Plant fructans in stress environments: Emerging concepts and future prospects. J. Exp. Bot. 2008, 59, 2905–2916. [Google Scholar] [CrossRef] [PubMed]
  69. Livingston, D.P., III; Hincha, D.K.; Heyer, A.G. Fructan and its relationship to abiotic stress tolerance in plants. Cell Mol. Life Sci. 2009, 66, 2007–2023. [Google Scholar] [CrossRef] [PubMed]
  70. Vágújfalvi, A.; Kerepesi, I.; Galiba, G.; Tischner, T.; Sutka, J. Frost hardiness depending on carbohydrate changes during cold acclimation in wheat. Plant Sci. 1999, 144, 85–92. [Google Scholar] [CrossRef]

