1. Introduction
European Commission defined soil sealing as: “… the permanent covering of an area of land and its soil by impermeable artificial material, such as asphalt and concrete” [
1]. Many studies analyze urban growth and its implications for planning and land use. Urban development often prioritizes viability and economic profitability over environmental criteria. In periods of a significant decline in agricultural, livestock farming and forestry activities, little attention has been paid by urban planning to soil quality, and considerable sealing of high or medium quality soils has taken place. This is a serious environmental problem that has been analyzed by various authors on different scales. Estimated soil loss from sealing was 9% in Europe from the mid-1980s to the late 1990s [
2], 7% in the city of Nanjing in China 1984–2003 [
3], and 4.5% in the US during the 1990s [
4]. Soil sealing is a direct result of urban growth and is seldom included in environmental impact assessments. Some of the changes that it triggers in ecosystems have been minimized, including variations in the water balance [
5]. Sealing alters the water cycle and increases flood risk due to ground impermeability. This impermeability is irreversible when sealing is due to artificial materials, but where there is only soil compaction with no artificial cover, it may be reversible. This is more important in areas with a Mediterranean climate where extreme precipitation events may occur. For this reason it is essential to maintain open, unsealed zones in urban areas or, where sealing is unavoidable, to use “semi-sealing” which leaves some infiltration capacity in green spaces, recreation areas,
etc. The most serious impact occurs when the underlying subsoils are highly permeable [
6] and the greater surface run-off increases the quantity of sediments and contaminants. It would therefore be preferable to build on low-infiltration-capacity soils (clays) and minimize the sealing of the most permeable soils (sands) to facilitate infiltration. Urban planning should take hydrological properties or soil permeability into account to a greater extent [
7,
8].
This study analyzes soil sealing and its repercussion on the loss of fertile soils, which are most appropriate for agricultural use. Soil sealing also has a negative impact in terms of increased flood risk. A methodology is proposed to monitor and evaluate soil sealing using satellite images available worldwide [
9]. These land monitoring techniques should be incorporated into thematic cartography for use by local authorities.
In methodological terms, this article includes a digital analysis (radiometric, spectral and spatial enhancement) of Spot images, compared with only the visual interpretation of satellite images to detect and measure soil sealing in Spain. This study also evaluates soil loss, taking into account the soil type and its agrological capacity.
For this case study, a highly dynamic area of urban development in central Spain was selected, where soil sealing has increased significantly over the last 30 years. Remote sensing facilitated the location of the sealed areas and the continuous monitoring of the changes that have occurred, although it is often difficult to define these areas exactly unless high spatial resolution images are available. This problem was solved using information obtained from large-scale aerial photos and in situ verification. However, the lower temporal resolution of photogrammetric flights (at five- or ten-year intervals in Spain) versus the continuous updating of satellite images led to the conclusion that detecting soil sealing by processing satellite images is a better approach.
Mapping soil sealing using images is not always straightforward due to the heterogeneity of built-up surfaces, which are often mixed with natural areas, and to the wide range of construction types: housing, industrial buildings, communication routes, recreation areas,
etc. Other authors have attempted to solve this problem proposing different analysis methods, with significantly different results depending on the required precision and the case study environment. Ridd considers that soil texture is an important factor to take into account in a model using remote sensing and considers the V-I-S (vegetation-impervious-soil) model useful for urban studies [
10]. Nizeyimana uses the Soil Rating for Plant Growth SRPG model based on the Digital General Soil Map of the United States (STATSGO) soil and landscape attributes and climate [
11]. Wu, 2004, developed a normalized spectral mixture analysis SMA method to quantify urban composition within the framework of the V-I-S model [
12]. Valera
et al. used photointerpretation of aerial photographs and Geographical Information System GIS-based map analysis to establish changes in land use from 1956–2006 in a Mediterranean area [
13]. Kampouraki
et al. used a maximum likelihood classification of Normalized Difference Vegetation Index (NDVI) images derived from QuickBird data and aerial photographs [
14]. For this study, the NDVI was selected and supervised classification was carried out using the parametric rule of minimum distance as this obtained the best results in a semi-arid area with sand- and clay-rich detritic sediments [
15].
The main objectives of this paper are to:
Assess the surface areas that still allow some soils to be used for agriculture.
Calculate the percentage of soil sealed over the last 50 years from a multi-temporal analysis of satellite images and aerial photographs.
Determine what type of land is affected by the sealing process.
Analyze the surface horizons of the most fertile soils to discover the physical and chemical properties lost through sealing.
Perform a semi-automatic classification of sealed surfaces from the image obtained with the most suitable spectrum improvement.
Compare results of the classifications with the actual terrain and available digital cartography.
2. Study Area
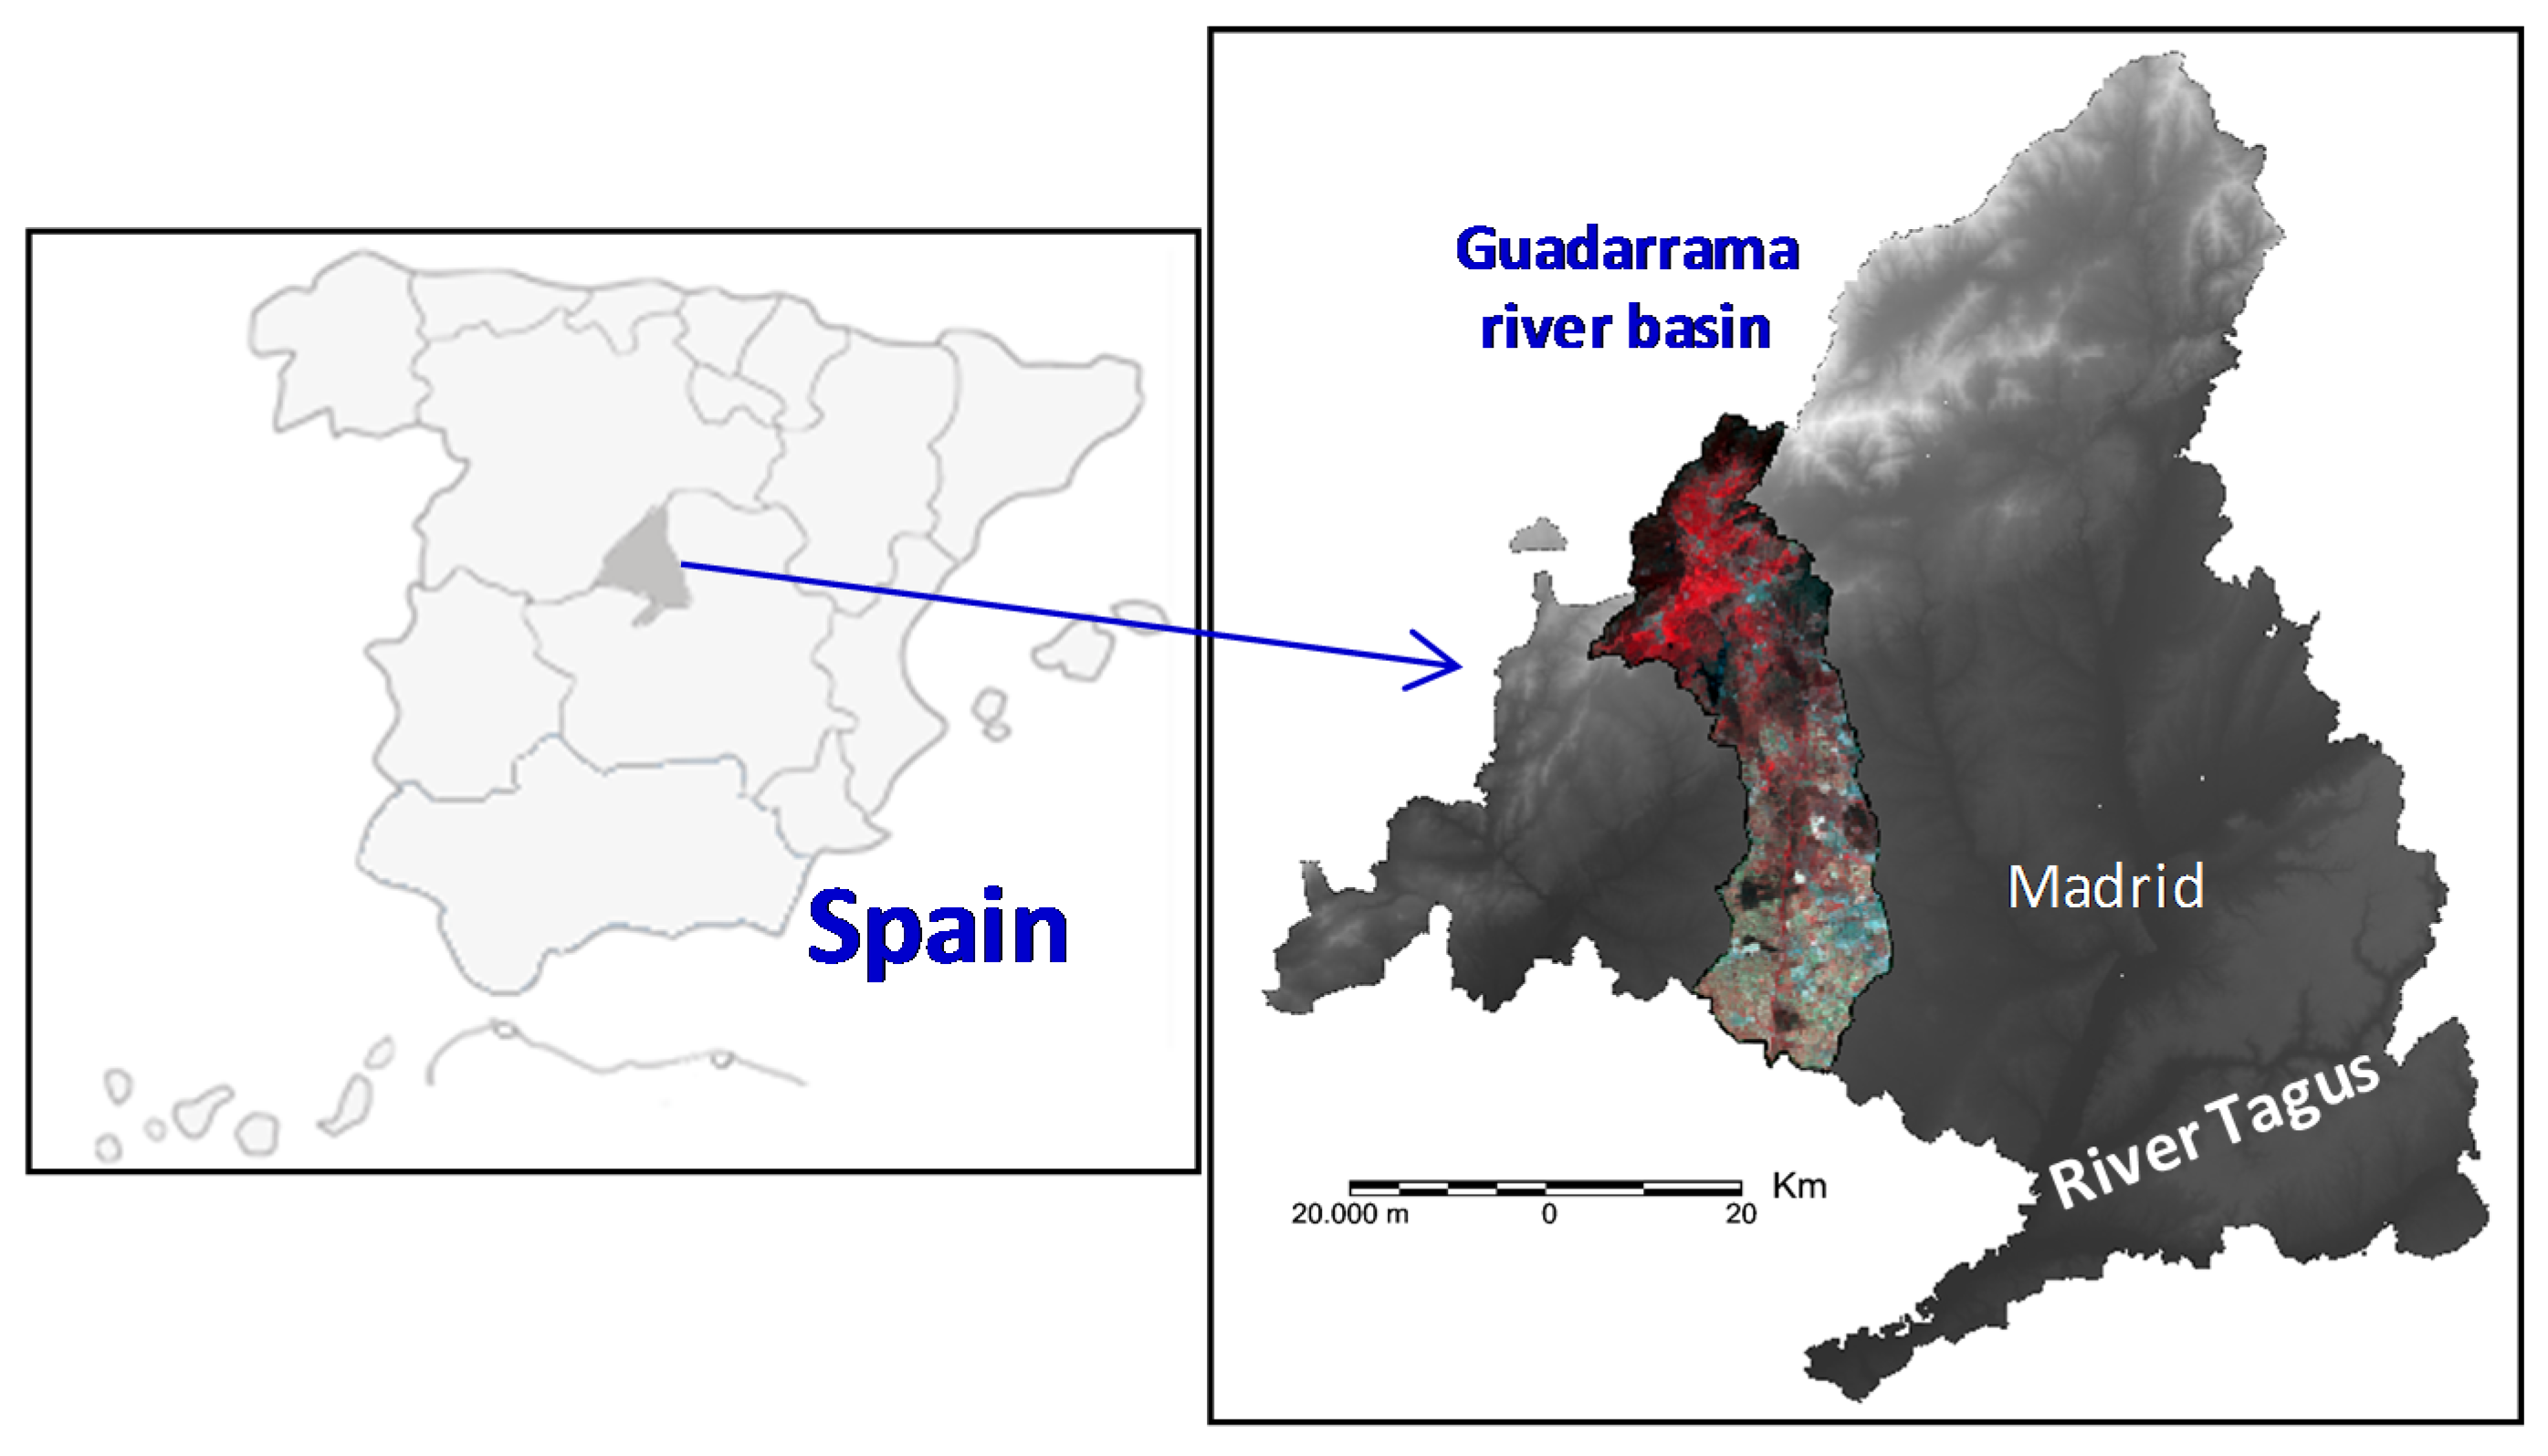
Here sealing is analyzed for soils in the Guadarrama River Basin near Madrid, Spain (40°47’45’’ N/4°03’40’’ W–40°12’25’’ N/3°56’35’’ W) (
Figure 1), with an area of 98,364 ha. This area of highly permeable soils has undergone a significant increase in sealing in recent years. The supply to the Guadarrama River is nivopluvial, with a maximum daily flow rate of 255 m
3/s and a maximum instantaneous flow rate of 418 m
3/s. However, its mean flow is only 7.3 m
3/s, implying significant periods of low flow.
Although the flood risk in the Guadarrama Basin is relatively low, the presence of buildings in some parts of the flood plain is a matter of concern, as historic water levels have risen more than 1 m. In addition, a reservoir at the basin head would represent an increased risk in a possible dam failure scenario. The deforestation of some areas, the extraction of aggregates and, in extreme cases, massive water discharges from a reservoir in the upper reach of the river also increase the flood risk. In 1996–1997, floods did affect the area, caused by problems that may recur in very wet hydrological years or if water is released from the reservoir.
Figure 1.
Study area: Guadarrama River Basin, Madrid, Spain.
Figure 1.
Study area: Guadarrama River Basin, Madrid, Spain.
The basin lithology is highly homogeneous and is formed by two main groups. The headwaters in the Sierra flow through Late Hercynian granites and glandular gneiss. The rest of the basin is formed by arkosic sands with gravel and clay layers prone to alteration. There is also a clear decrease in sand grain sizes and more clays towards the lower reaches of the river, increasing the risk of erosion. The river channel is confined within a gently sloping valley, flanked by remnants of multiple terraces; the highest of these are predominantly gravels, gradually becoming increasingly sandy downstream. In the lower reaches the valley widens and becomes flatter, blurring the outline of the terraces. Here the slope contributions and remobilization of material by lateral fans become especially significant and are fundamental in the channel supply during flooding. The flood plain is not well defined and has a maximum width of 1 km in the lower reach [
16].
Two features condition the flood risk: in this river the morphological and sedimentological limits between the high water channel and the flood plain are not clearly defined and the sandy banks are very unstable, facilitating remobilization. Another significant effect is the subsurface bank erosion process resulting from the sandy composition, the intercalations of clay materials, and the elimination of protective vegetation. The result is that gullies of up to tens of meters long have formed on the banks, with various housing developments built on them.
3. Material and Methods
In this paper, the two thematic classifications to calculate the loss of soil due to sealing in the last 50 years are compared. The surface affected by soil sealing on the dates analyzed was obtained by photointerpretation and digital image processing. The urban core and road infrastructures on different dates are digitalized and the surface of discontinuous sealing (between 5%–50%) and continuous sealing (>50%) is calculated. Further, in the satellite images the urban surfaces of other non-sealed soil cover are separated (bare soil, wasteland and vegetation). These classes cannot be manually separated in the aerial photography due to the limitations of scale and the lack of infrared channels that would add spectral information about the vegetation.
Aerial photographs were used for the period 1961–1967 [
17]. Panchromatic, multispectral Spot-5 satellite images from 27 August and 28 November 2011 were obtained from the National Geographical Institute.
Soil loss from sealing in the 1960s was measured from the visual interpretation and manual digitization of aerial photographs in the Guadarrama Basin. The image obtained is a mosaic of the existing photos from 1961–1967. Although the dates do not coincide throughout the basin, there is no other existing material to build the image of this period.
The Guadarrama Basin, where the soil sealing was analyzed, was overlaid on the Digital Terrain Model (DTM) and all the images were geo-referenced to Universal Transverse Mercator UTM coordinates (grid zone 30T) and Datum ETRS89. The DTM was obtained from the Shuttle Radar Topography Mission, Global Land Cover Facility Internet server [
18], with a Capture Resolution of 3 arc second (90 m of spatial resolution) [
18,
19].
The Spot images were processed with Erdas Imagine-2011 software, carrying out different spectral enhancements (NDVI, principal components and band combinations), radiometric enhancement (histogram equalization) and spatial enhancements (convolution filter 3 × 3 and the resolution merge of panchromatic and multispectral images). These techniques attempt to highlight different land uses in the images and are based on the following parameters:
- -
NDVI (Normalized Difference Vegetation Index): this index differentiates the high spectral response of vegetation in the near-infrared band from the low response in the red. Sealed soils have negative values. The mathematical algorithm is:
- -
The principal components factor analysis is based on summarizing a large number of variables into a smaller group, with hardly any loss of information, taking the variance matrix into account. In remote sensing, the variables will be the different sensor bands and this analysis is used to obtain a new image, in which the first components will represent almost the entire variability. The urban land always has a regular geometric or spatial pattern.
- -
Equalization enhances the contrast in the image. In this operation the grayscale color is assigned by the digital pixel value and also by the frequency distribution of the orthogonal digital numbers, so that the visual number assigned to each digital number is proportional to its value and frequency. Although histogram equalization is a routine method, it has been selected in this case because it clearly shows the different soil covers, highlighting anthropic elements (buildings and infrastructure).
- -
The convolution filter enables improved separation of the linear elements, as these are poorly represented in the original images. This filter sums the values of a pixel and its 3 × 3 neighborhood to obtain a better spatial representation of cultivated cropland, riverbank vegetation and garden surfaces.
- -
Resolution merges between panchromatic and multispectral channels: To improve the detail in the final image the multispectral image has been merged with the panchromatic satellite image.
Previous work has shown that part of the surface digitized as sealed soils corresponds to an open urban type, which leaves large non-built (
i.e., non-sealed) areas [
20,
21]. To assess the real surface with irreversible loss of soil infiltration capacity, supervised classifications by the parametric rule of minimum distance were carried out by setting up five categories of soil occupation, three of which are related to sealing and two are related to undeveloped land: bare soil (<5% sealed soil), discontinuous sealing (5%–50% sealed soil), continuous sealing (>50% sealed soil), vegetation, wasteland, in the photos and images dating from 1961–1967 and 2011, respectively.
A confusion matrix was used to check the accuracy of the classifications, contrasting the results with the existing maps on both dates [
17] and with the ground truth data verified in September 2011. Although the most recent orthophotos of Madrid (Madrid Community, 2011; Scale 1:5000) enable high precision visual interpretation confirming the field data, 50 random sampling points were chosen and their accuracy was checked. These samples were taken only on surfaces classified as sealed soil (continuous and discontinuous) with a random distribution of points.
Calculation of the sealed soil surface also included the digital processing of road infrastructures, as the vectorial layers with this information tend to refer to lines. It was considered that the soil used for linear infrastructure should not be ignored in the soil sealing analysis.
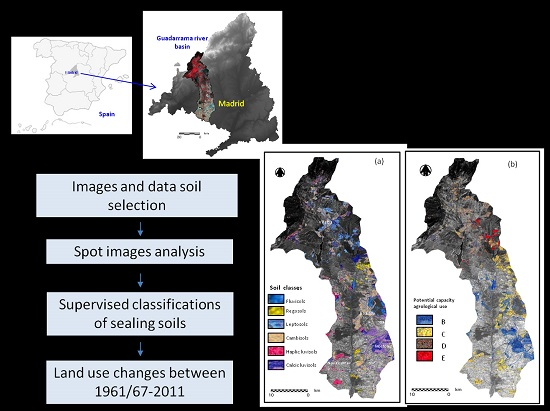
To detect which soil types have been affected by sealing, the surfaces obtained from the 1961–1967 and 2011 images were overlaid on the soil association and potential capacity for use maps drawn up by Monturiol and Alcalá [
22,
23]. The agrological map shows five soil types, A, B, C, D and E, which correspond to the eight agrological classes established by Klingebiel and Montgomery in 1961 [
24]: Type A corresponds to Class I and the best soils of Class II; Type B to the poorest soils of Class II and to Class III; Type C to Class IV; Type D to Class V and VI; and Type E to Class VII and VIII (
Table 1).
Table 1.
Capability classification (Klingebiel and Montgomery’s classification ranges from Class I and II: very fertile soils, to Class VII and VIII: very poor soils).
Table 1.
Capability classification (Klingebiel and Montgomery’s classification ranges from Class I and II: very fertile soils, to Class VII and VIII: very poor soils).
| Monturiol and Alcalá, 1990 | Klingebiel and Montgomery, 1961 |
|---|
| A | I, II |
| B | II, III |
| C | IV |
| D | V, VI |
| E | VII, VIII |
To support the soil mapping for this study, samples of horizontal soil surface were analyzed in summer 2012. The samples were collected from the most fertile soils, as these are the soils which are being lost. The measurements taken were texture (Robinson’s pipette international method), pH (paste saturated with water and KCl), organic material (Walkley and Black method), carbonates (Bernard calcimeter) and electrical conductivity (aqueous soil extract and 1:1 soil/water ratio), to define the properties of the soils affected by sealing. Five analyses of each sample were performed to obtain the mean.
4. Results and Discussion
The availability of small-scale aerial photos enabled the detection and measurement of soil sealing between 1961 and 1967 in the whole Guadarrama Basin in the Madrid Autonomous Community. During this decade the villages in this area remained small and compact, with under 10,000 inhabitants in the lower reaches of the river and 1000 in the Sierra. Houses were not built near the river bed and no flood risk was detected in the built-up areas.
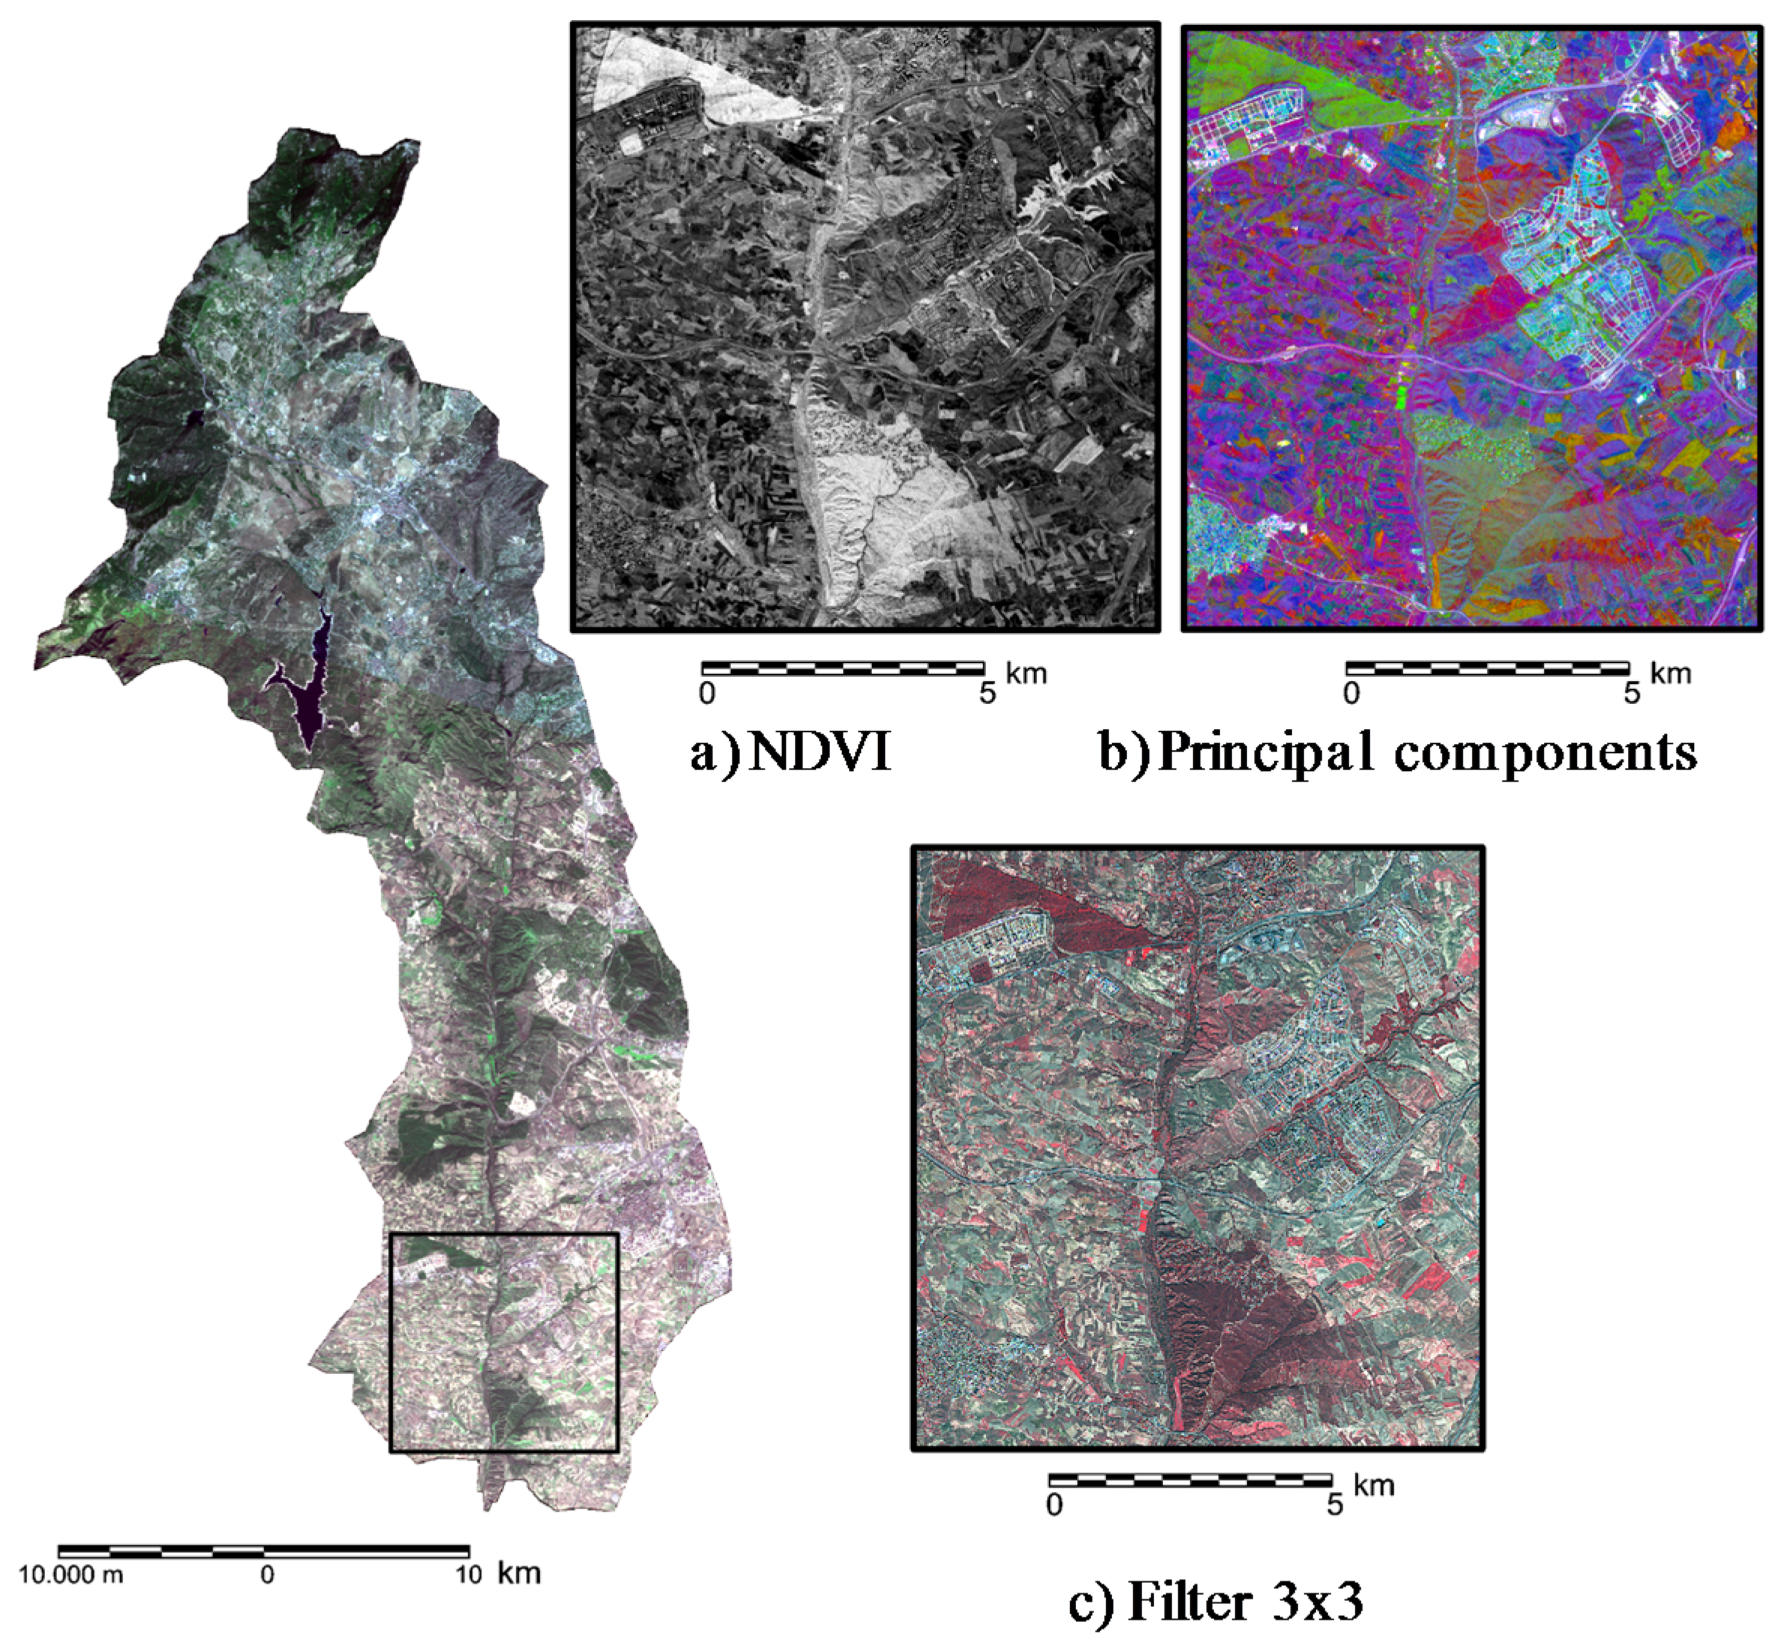
To detect and measure soil loss in 2011, the Spot image spatial resolution was improved by merging the panchromatic and multispectral images.
Figure 2 shows the false-Spot image of the Guadarrama Basin and, in detail, the main digital image processing used to highlight sealed soil. In
Figure 2 the NDVI highlights natural and cultivated vegetation in very light shades. The NDVI image was very useful in the digital processing of the areas sealed in 2011, as it allowed areas of open urban development to be differentiated from more compact areas, as this index differentiates different vegetation patterns (woodland, pastureland, wasteland, urban parkland, gardens,
etc.). This index facilitates visual differentiation of urban areas because of their regular spatial pattern, and also digital differentiation as it obtains intermediate values between bare soil and vegetation mass. Urban parks are also well represented in the NDVI on account of their clearly marked limits and high values.
Road infrastructure and different urban typologies are clearly shown in the principal components image (
Figure 2b), and non-sealed surfaces are clearly differentiated, even in the Sierra. This digital processing enables the clear identification of urban core and new buildings in blue shades.
The image obtained using filters facilitates the detection of linear features (motorways, roads and streets) which are also included in measurements of sealed soil. Soil loss from road infrastructure is not normally included when sealing is measured, as these linear features are not usually measured as areas.
Figure 2.
Digital analysis of Spot image.
Figure 2.
Digital analysis of Spot image.
Supervised classification using five information classes allowed the mapping of continuous and discontinuous soil sealing, including most of the communication networks. The best supervised classification was obtained using the parametric rule of minimum distance as this obtains fewer errors in the contingency test. Classification using the parametric rule of maximum probability offers great confusion in the discontinuous sealing category. The confusion matrix applied in this classification showed 94.1% accuracy. As the error was less than 6%, reclassification of the image was not required. The error is mainly produced in the discontinuous sealing class which affects the small open and gardened urbanization developments in which it is harder to differentiate the edifications of the non-sealed soils.
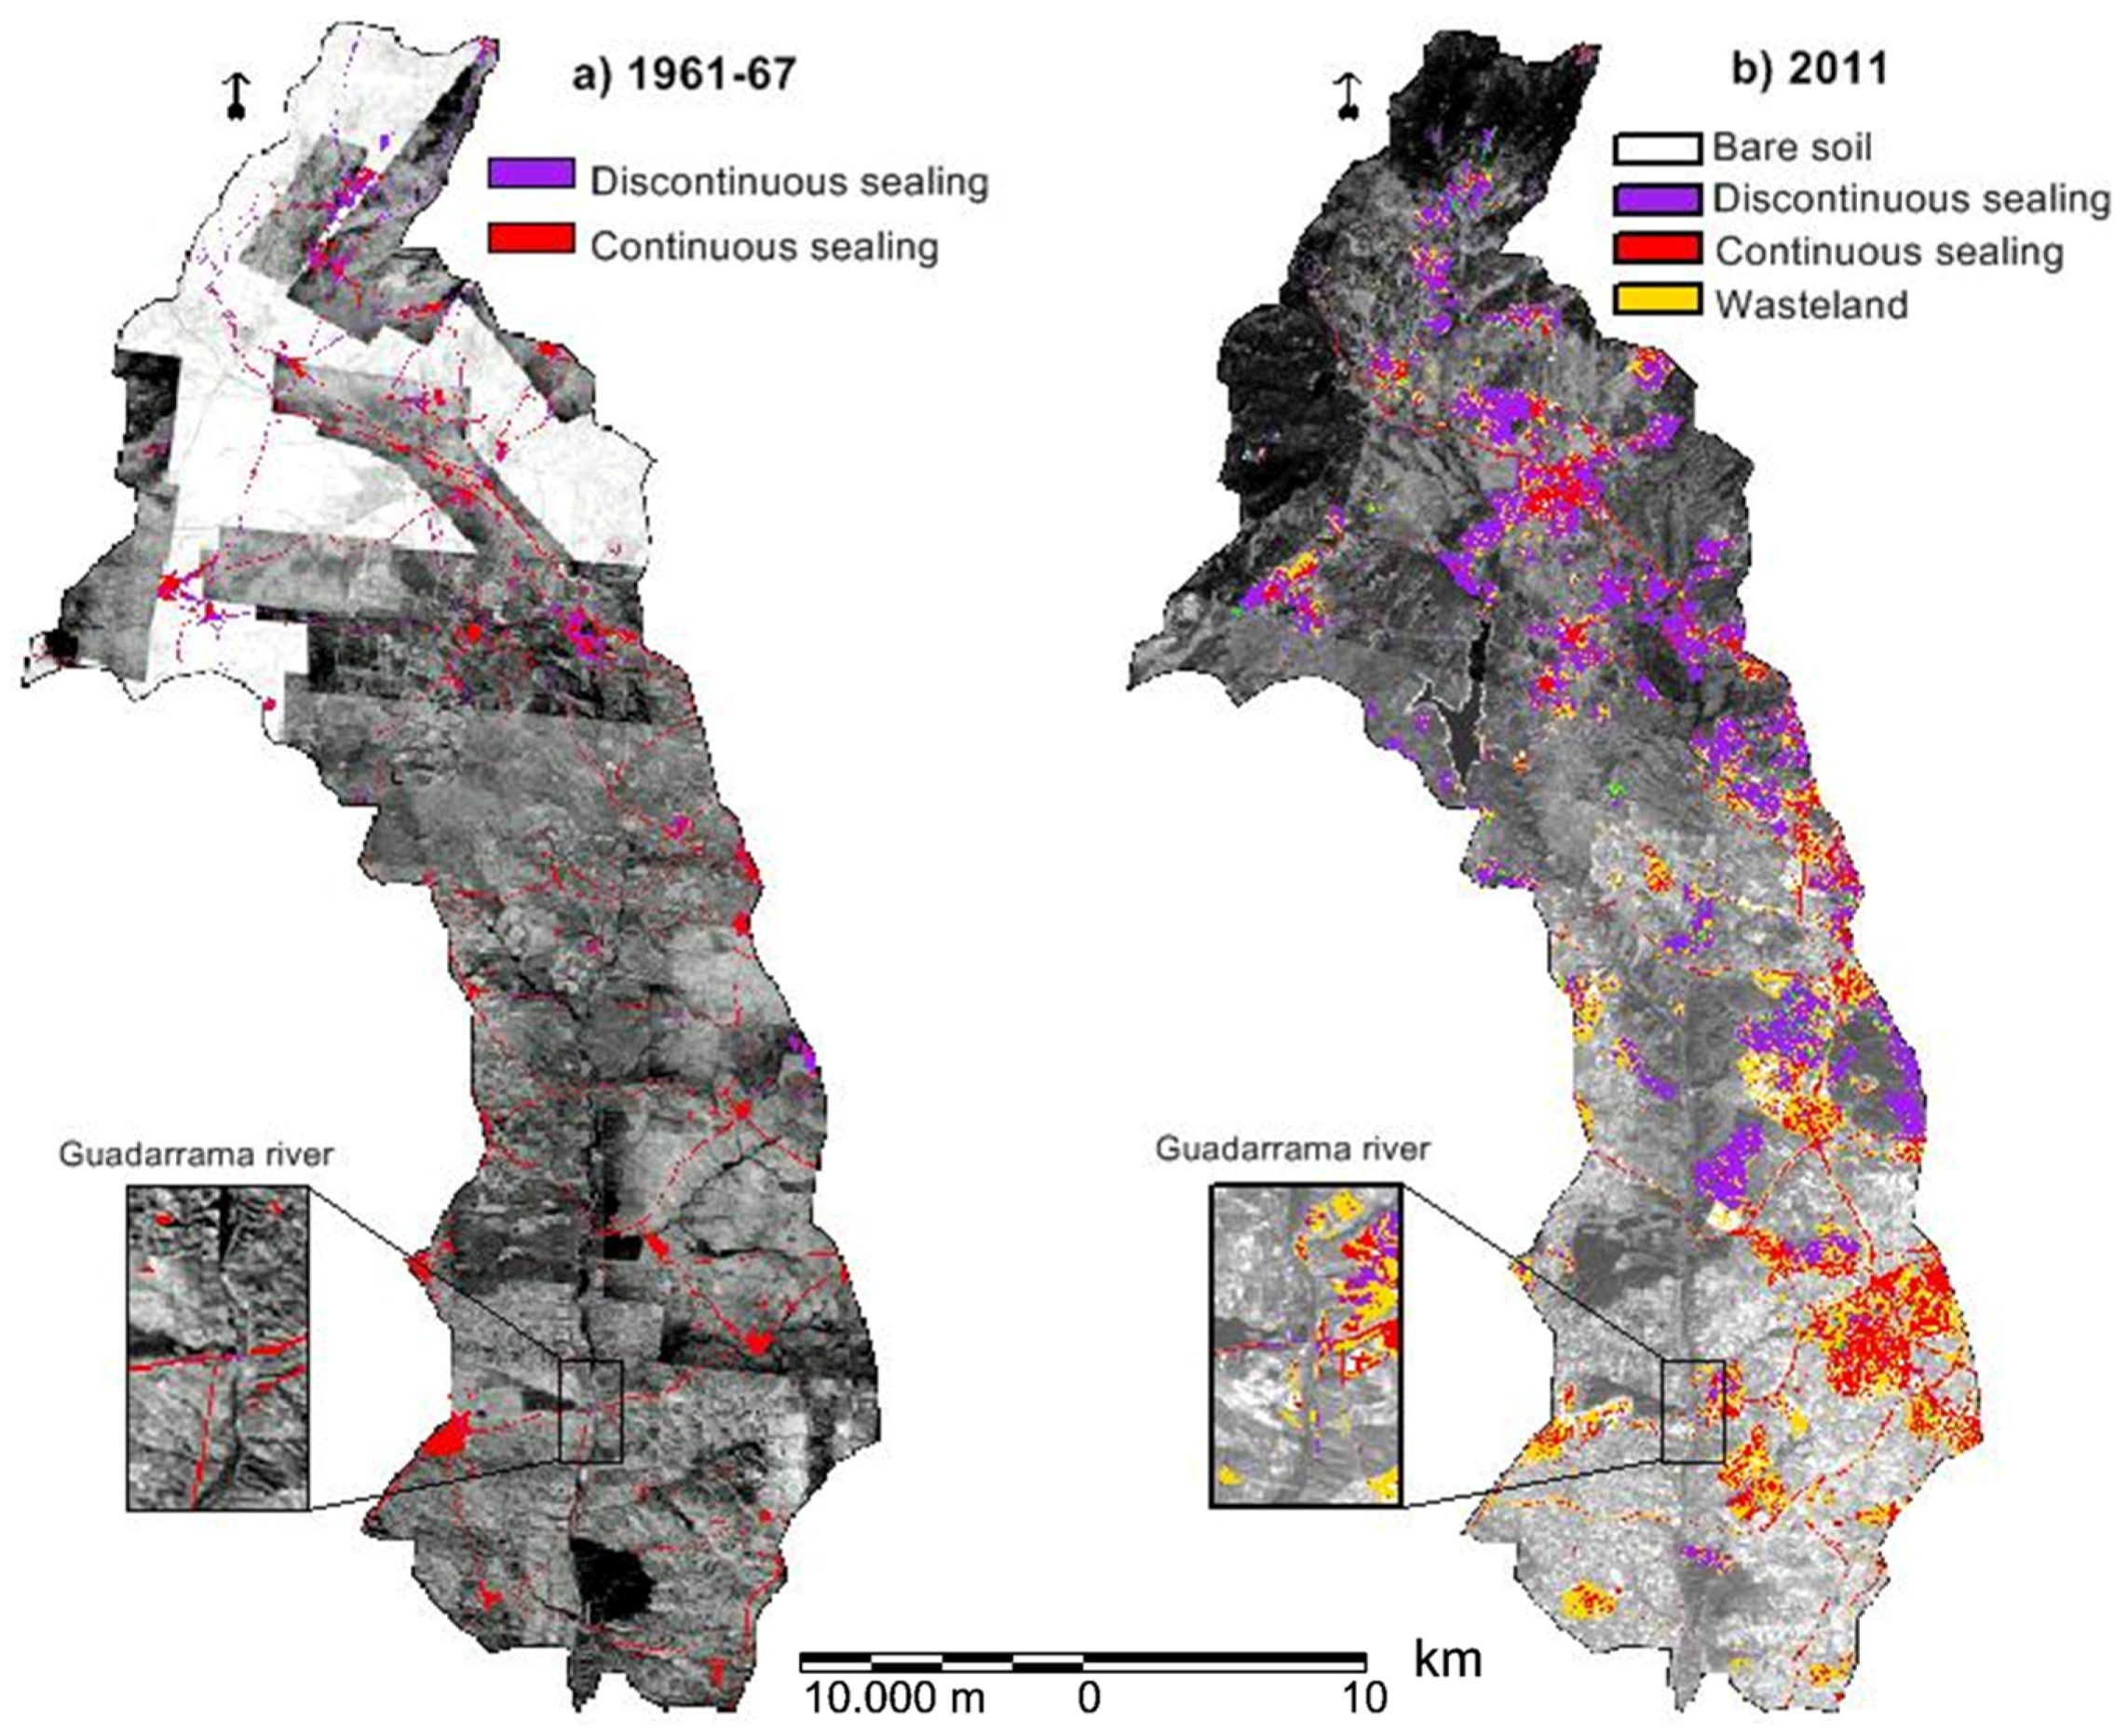
The estimated surface affected by sealing over the last 50 years is shown in
Table 2 and
Figure 3a,b.
Table 2.
Estimated soil sealing.
Table 2.
Estimated soil sealing.
| Soil Sealing | 1960–1967 | 2011 |
|---|
| Discontinuous sealing (<50%) (ha) | 1157 | 6526 |
| Continuous sealing (>50%) (ha) | 3126 | 5665 |
| Total soil sealing (ha) | 3705 | 8928 |
| Guadarrama Basin-Madrid Community (ha) | 98,364 | 98,364 |
| Estimated soil loss (%) | 4 | 9 |
It is interesting to note here the significant increase in sealing in the Guadarrama Basin, from 4% to 9% in 50 years (125%), especially on the left bank, which is closer to the city of Madrid. Soil sealing is similar to other European and Asiatic cities. Regions such as the Mediterranean coastal areas underwent a 10% increase in soil sealing during the 1990s [
2]. In the Urban Agglomeration around Hangzhou Bay (UAHB), China, the percentage of sealed soils increased from 2.7% in 1994 to 4.7% in 2003 and to 8.7% in 2009 [
25]. As indicated by Kasanko
et al., 2006, urban development in Europe is a result of various factors, and when it occurs along a river it creates a very different type of development from other locations [
26]. This also occurs in the area analyzed here, as the plots are highly fragmented and include areas with trees, pastureland and/or wasteland and riverbank vegetation. Construction is limited by the flood plain and the sandy materials with significant gully formation.
Figure 3.
(a) Soils sealed in 1961–1967; (b) Soils sealed in 2011.
Figure 3.
(a) Soils sealed in 1961–1967; (b) Soils sealed in 2011.
There is also an evident contrast between the type of urban development in the higher areas in the Sierra, and those in the south in open countryside. In the north, sealing is predominantly discontinuous, since an increasing number of houses with gardens facilitate water infiltration. To adjust soil loss from sealing in open housing areas, a correction factor of 0.5 was applied as an intermediate value between large and small residential plots. In the lower Guadarrama Basin the sealing is much more compact, causing greater problems of infiltration and more run-off, which increases erosion.
Four soil profiles were analyzed (
Table 3 and
Figure 4): the texture is sandy loam. These soils are poor in clay and organic matter so that their structure is unstable, favoring erosion processes. These soils are permeable, neutral or slightly acid, with few carbonates and very few salts. Although these soils are not particularly fertile, they are the most productive in the area analyzed. Their loss also implies reduced water infiltration, increasing surface run-off. The destruction of the vegetation cover accelerates this erosion. The loss of highly productive agricultural soils due to soil sealing is an indicator for assessing land degradation in Spain [
27].
The significant increase in soil sealing over this 50-year period, especially in the southern half of the basin with its more permeable soils [
6], implies a greater flood risk. This risk is higher for the residential complexes and the illegal buildings on the flood plain. In 2011, this affected two clusters, one with upscale housing and the other with illegal settlements. In the satellite images these two types of housing can be visually identified from their spatial pattern: the former by large plots, large buildings and extensive green areas and the latter by an irregular spatial distribution, housing agglomeration and few green areas. This information was also validated
in situ with the ground truth. An evident recovery of vegetation mass between the 1960s and 2011 was noted, although some specific erosion problems were pinpointed. This problem has been accelerated by building on sandy materials and by increased surface run-off in garden areas, causing deep gullies which put the stability of the buildings themselves at risk. An evident recovery of the mass of vegetation between the 1960s and 2011 was noted, although some specific erosion problems were pinpointed. This has been accelerated by building on sandy materials and by increased surface run-off in garden areas, causing deep gullies which put the stability of the buildings themselves at risk.
Table 3.
Analytical soil data for four surface soil horizons in the Guadarrama Basin.
Table 3.
Analytical soil data for four surface soil horizons in the Guadarrama Basin.
| Sample | 1 | 2 | 3 | 4 |
|---|
| Location | Cotorredondo | Vega Guadarrama | Navalcarnero | Villanueva |
|---|
| Gravel (%) | 34.78 | 34.4 | 16.02 | 27.86 |
| Sand (2–0.5 mm) (%) | 47.5 | 16.7 | 34.2 | 31.4 |
| Sand (0.5–0.05 mm) (%) | 28.45 | 52.62 | 45.52 | 43.67 |
| Silt (%) | 6.00 | 10.02 | 6.85 | 9.00 |
| Clay (%) | 18.05 | 20.65 | 13.43 | 15.93 |
| pH (H2O) | 6.3 | 6.65 | 6.4 | 7.51 |
| pH (KCl) | 5.08 | 5.73 | 5.14 | 6.74 |
| Organic matter (%) | 1.37 | 2.69 | 1.32 | 6.56 |
| CaCO3 (%) | 1.03 | 0.93 | 0.99 | 1.25 |
| Electrical conductivity (dS/m) | 0.23 | 0.38 | 0.11 | 0.55 |
Figure 4.
(a) Soil associations sealed in 2011 and sample location; (b) Sealing in 2011 classified by potential capacity for agricultural use.
Figure 4.
(a) Soil associations sealed in 2011 and sample location; (b) Sealing in 2011 classified by potential capacity for agricultural use.
The greatest increase in soil sealing has occurred in discontinuous sealing, which implies fewer environmental problems [
2,
11]. Rising standards of living have led to types of urban development that place greater importance on gardens and wooded areas.
A contrast can be observed between the two banks of the river in terms of the types and classes of sealed soils. On the right bank, the sealing mostly affects haplic luvisols. On the left bank, the sealing affects calcic luvisols, calcaric regosols, eutric and dystric cambisols and some eutric fluvisols. The medium and coarse texture soils over the tertiary sands and arkoses are highly permeable, and pose a moderate erosion risk, which is higher in the regosols. The fluvisols and some luvisols generated on the flood plain present hydromorphic problems. The impact is much lower in the northern half of the basin for those soils over Paleozoic materials and soils characterized by associations of leptosols and dystric cambisols.
When the sealed soil polygons are superimposed on the map of agrologic classes, it can be seen that in the Guadarrama Basin there are no Class A soils with maximum potential for agricultural use. However, there are considerable areas with highly fertile Class B soils which have been subjected to significant sealing. On the arkose deposits Class C soils have also been sealed. On the Paleozoic materials the sealing is less extensive and corresponds to less fertile soils (Class D and E). Therefore, the most intense degradation process in the basin has taken place on the most fertile Class B soils.
5. Conclusions
Remote sensing for the assessment and monitoring of soil sealing provides up-to-date and highly reliable information. This technique allows one to evaluate the potential impact of soil sealing in agricultural areas. Mapping and quantifying soil sealing using high spatial resolution satellite images gives very good results, as this study shows. These images enable the correct identification of different urban typologies, although delimiting soil sealing in open urban development with wooded areas is problematic.
The digital processing of linear communication routes using polygons (not lines) allows for a more accurate calculation of soil loss from sealing. In the immediate surroundings of large cities these infrastructures can be significant.
These land-monitoring techniques should be incorporated into the tools used by the relevant local authorities.
Soil sealing in the Guadarrama Basin from 1961–1967 and in 2011 increased from 4% to 9%. Soil loss caused by sealing has particularly affected the left bank of the river nearest the city and two areas were detected with buildings on the flood plain and with high flood risk.
Soil loss occurs to a greater extent in highly permeable soils (sands) and in the most fertile Class B soils in the Guadarrama Basin in the Madrid Community. The main sealed soil associations are luvisols (alfisols), regosols (entisols) and cambisols (inceptisols).


