Article

Investigating the Influence of Biochar Particle Size and Depth of Placement on Nitrous Oxide (N2O) Emissions from Simulated Urine Patches

by
Ainul Faizah Mahmud
1,2,*,
Marta Camps-Arbestain
1 and
Mike Hedley
1
1
New Zealand Biochar Research Centre, Massey University, Private Bag 11222, Palmerston North 4442, New Zealand
2
Department of Land Management, Faculty of Agriculture, Universiti Putra Malaysia, 43400 UPM Serdang, Selangor, Malaysia
*
Author to whom correspondence should be addressed.
Submission received: 30 September 2018 / Revised: 22 October 2018 / Accepted: 1 November 2018 / Published: 7 November 2018
(This article belongs to the Special Issue Biochar and Soil: What Is behind Its Impacts?)

Abstract

:
The use of biochar reduces nitrous oxide (N2O) emissions from soils under specific conditions yet the mechanisms through which interactions occur are not fully understood. The objectives of this glasshouse study were to investigate the effect of (i) biochar particle size, and (ii) the impact of soil inversion—through simulated mouldboard ploughing—on N2O emissions from soils to which cattle urine was applied. Pine biochar (550 °C) with two different particle sizes (<2 mm and >4 mm) was mixed either into the top soil layer at the original 0–10 cm depth in the soil column or at 10–20 cm depth by inverting the top soil to simulate ploughing. Nitrous oxide emissions were monitored for every two to three days, up to seven weeks during the summer trial and measurements were repeated during the autumn trial. We found that the use of large particle size biochar in the inverted soil had significant impact on increasing the cumulative N2O emissions in autumn trial, possibly through changes in the water hydraulic conductivity of the soil column and increased water retention at the boundary between soil layers. This study thus highlights the importance of the role of biochar particle size and the method of biochar placement on soil physical properties and the implications of these on N2O emissions.

1. Introduction

The primary sources of nitrous oxide (N2O) emissions from New Zealand pastoral soils are excreta (urine and dung) from grazing animals, followed by urea and farm dairy effluent applied to soils [1]. Excreta deposited by grazing animal alone contributed to 14.2% (5503.3 kt CO2-e) of total N2O emissions from the agricultural sector, which represent a 7.2% increase since 1990 [2]. In 2013, the New Zealand Government adopted the unconditional targets of reducing greenhouse gas (GHG) emissions to 5% below the 1990 level by year 2020, followed by post-2020 commitments to reduce greenhouse gas emissions to 11 and 50% below the 1990 level by year 2030 and 2050 [3], respectively, which forces the need to develop economically and technically feasible options in order to achieve such goal.
Nitrous oxide can be produced in soil via nitrification, denitrification and nitrifier-denitrification. The nitrification process involves the oxidation of ammonium (NH4+) into nitrite (NO2) and this into nitrate (NO3) producing N2O as by-product, while the denitrification process involves the reduction of NO3 into gaseous nitrogen (N) compounds, mainly N2O and dinitrogen gas (N2). Nitrifier-denitrification by NH4+-oxidizing bacteria may also contribute to the formation of N2O in soils [4,5]. Environmental conditions influencing N2O emissions include soil mineral N concentration, soil moisture, dissolved organic carbon (C) concentration, temperature, and pH [4,6], all of them being highly variable over short-time periods and having a strong seasonality.
The application of biochar—charcoal intended to be used to simultaneously mitigate climate change by contributing to carbon (C) sequestration and improving soil functions [7]—has been suggested as a potential tool to reduce N2O emissions from soil [8]. Several laboratory and field studies have reported decreases in N2O emissions from soil upon biochar application and attributed this to the ability of biochar to (i) modify soil physical properties and soil aeration thus changing oxygen (O2) concentration [9,10]; (ii) reduce NH4+ and NO3 concentrations through either induced microbial immobilization or adsorption mechanisms [11,12]; (iii) increase soil pH; and/or (iv) acting as “electron shuttle” [13]. However, other studies have reported either no effect [14] or elevated N2O emissions upon addition of biochar, the latter attributed to an enhanced N mineralization upon application [15,16].
These mixed results could be, in part, attributed to the different experimental conditions used by the different researchers, such as the use of various types of biochar [17], different biochar application rates [18], or dissimilar experimental settings (field trial vs. laboratory/glasshouse experiments) [19]. The use of different wetting and irrigation regimes may also have influenced N2O emissions, most likely in response to changes in water-filled pore space (WFPS) and thus in soil aeration [20,21,22]. The simultaneous addition of biochar with other organic amendments, such as manure and poultry litter [23] and/or inorganic fertilizers, and differences in their rates of application, may also have determined the availability of labile C and N, and thus affected N2O production [24,25,26].
A more mechanistic understanding of the effect of biochar on nitrification and denitrification could help determine whether this amendment is suitable as a tool to mitigate N2O emissions from agricultural systems, and more specifically from pastoral systems under humid-temperate climate. The few publications available in the literature on how the addition of biochar to urine patches influences N2O emissions have reported inconsistent patterns. Clough et al. [27] observed a temporary increase in N2O emissions when applying a pine biochar produced at high temperature (600 °C) and of a particle size <5 mm to a silt loam soil. In contrast, Taghizadeh-Toosi et al. [28] observed a decrease in N2O emissions also using a pine biochar, but produced at low temperature (<400 °C) [29] and of a generally larger particle size to another silt loam soil. The reductions in the second study were attributed to a reduced availability of NO3 caused by NH3 adsorption on biochar particles. Yet the potential role of biochar particle size on the different results obtained in N2O emissions studies cannot be disregarded, as already highlighted by Cayuela et al. [30].
A practical farming aspect is how the biochar amendment to soil is made, e.g., (i) surface spreading and incorporation by shallow tillage or (ii) application to depth by use of a mouldboard plough. By mouldboard ploughing, the top soil (and the biochar) becomes buried deeper in the profile, which contrasts with a top application of biochar followed by cultivation, in which the biochar remains in the topsoil without soil inversion. A recent short-term study of Calvelo Pereira et al. (unpublished) [31] revealed that the addition of pine biochar while mouldboard-ploughing the soil (e.g., biochar and top soil placed below the top 10 cm of soil) caused a 30% reduction in N2O emissions following urea application compared to an inverted soil without biochar addition.
In the present soil column study, we investigated the effect of biochar particle size and the impact of soil inversion—through simulated mouldboard ploughing—on N2O emissions from soils to which cattle urine was applied. For this, a pine biochar with a low atomic H/Corg ratio (and thus rich in condensed aromatic C) with a low ash content was chosen, so that the influence of labile C, nutrient content, and/or liming ability of the biochar was minimized. We hypothesized that (i) the application of biochar may affect N2O emissions through changes in soil physical properties, specifically soil aeration and water retention; and (ii) the effects of biochar addition on these properties may differ depending on their particle size (e.g., a larger particle size may increase soil aeration whereas a smaller particle size may clog pores), and their placement in soil (e.g., the incorporation of a large particle size-biochar at depth may promote water movement from the top layer and increase the overall drainage of the soil).

2. Materials and Methods

2.1. Biochar

Biochar was produced from untreated pine wood residue (Pinus radiata D. Don) (Foxton, New Zealand). The pine wood residue was pre-dried at 60 °C and pyrolysed in a gas fired, rotating drum kiln (25 L) to a highest heating temperature (HHT) of 550 °C. After production, it was stored in a steel barrel for three years. The biochar was left to dry until its moisture content was reduced to ~7% before the trial was set up. Thereafter the biochar was crushed and sieved into two different particle sizes (<2 mm and >4 mm). The chemical characteristics of biochar with two different particle sizes were examined and reported in Table 1. Briefly, the pH was measured at a ratio of 1:20 (w:v) solution of biochar:deionized water equilibrated for 1.5 h prior to measurement according to Rajkovich et al. [32]. Calcium carbonate equivalence (liming equivalence, % CaCO3-eq) was determined according to IBI standards (2015), which was modified from the method proposed by Rayment and Higginson [33]. Biochar samples were analyzed for their elemental C, H, and N composition (Elementar Analysensyteme GmbH, Hanau, Germany) and thereafter the elemental composition was recalculated on a dry-ash-free (daf) basis. Concentration of O (% daf) was then estimated by difference (100%-C%-N%-H%). Moisture, volatile matter (VM), fixed C (FC) and ash contents (wt. %) of samples was determined using a thermogravimetric analyzer (SDT Q600, TA Instruments, Melbourne, Australia) according to Calvelo Pereira et al. [34]. Total P, K, Ca and Mg were determined using Atomic Absorption Spectroscopy (AAS, GBC 904 Avanta Ver 1.33, Australia) after digestion following modified dry ashing [35]. Available P was determined using formic acid extraction [36] and available N was measured using 6 M HCl [37]. Cation exchange capacity (CEC) was measured with strontium chloride (SrCl2), as described in Calvelo Pereira et al. [38]. Overall, the chemical properties of the biochar were similar for the two particle size fractions, with a high C content (>82% w/w)—mostly as condensed aromatic C, as reflected by the low atomic H/Corg ratio (≤0.5) and high fixed C content (>70% (w/w) [39]—low ash content (<3% w/w), and a pH close to neutrality. According to the classification system developed by Camps-Arbestain et al. [40], this pine biochar had relatively low liming (class 0) and fertilizer (class 0) values.

2.2. Soil

The soil used in this experiment was collected from the Pasture and Crop Research Unit of Massey University at Palmerston North (40°23′20.37″ S, 175°36′32.33″ E), New Zealand. It classifies as Tokomaru silt loam Pallic soil according to the New Zealand soil classification system [41] and Typic Fragiaqualf according to Keys to Soil Taxonomy [42]. The soil was sampled at 0–10 cm (topsoil), 10–20 cm and 20–40 cm (subsoils). The physicochemical properties of the top layers are reported in Table 2. Soils were then thoroughly mixed, sieved to 5 mm, and stored in the cold room (temperature 4 °C) until used.

2.3. Glasshouse Experiment

PVC columns of 20 cm diameter and 40 cm depth attached to 1.3 m PVC drainage collection columns or Flux meters [43] were used in this soil column study. Soil columns were prepared as follows: (i) for the biochar-amended soils, the 0–10 cm soil layer was hand-mixed with either <2 mm or >4 mm biochars (2% w/w or ~20 t ha−1) (Supplementary Information; Figure S1); (ii) the 0–10 cm soil layer of all treatments received NPK fertilizer (60 kg N ha−1; 60 kg P ha−1 and 50 kg K ha−1); (iii) soil (with or without biochar) was then repacked into the soil column either at the original 0–10 cm depth (simulating incorporation by shallow tillage) or inverting the top soil (simulating incorporation by mouldboard ploughing) and placing it at 10–20 cm depth (Supplementary Information; Figure S2). Soil layers without biochar amendment were repacked to the original bulk density; soil layers with biochar amendment were repacked to a recalculated bulk density (considering the bulk density of biochar particles and application rate added). Additional two columns were prepared for destructive sampling to represent time zero (soil core prior to seeding). Overall, there were 26 cores (24 + 2) from six treatments with four replicates for each treatment, and the two time zero columns. The treatments were the following: un-inverted control (UC), un-inverted small particle size biochar (US), un-inverted large particle size biochar (UL), inverted control (IC), inverted small particle size biochar (IS), and inverted large particle size biochar (IL). The experiment was conducted in a glasshouse at the Plant and Growth unit of Massey University at Palmerston North from October 2014 to September 2015, following the time line described in Supplementary Information; Table S1.
Annual ryegrass (Lolium multiflorum L.) was seeded in all columns and thinned to 20 seedlings per column upon germination. During the experiment, ryegrass was cut nine times (four in summer and five in autumn) to five cm height to simulate cattle grazing. Urine applications were carried out in December 2014 (referred to as summer trial) and April 2015 (referred to as autumn trial) at rates of 354 kg N ha−1 and 563 kg N ha−1, respectively, so that the N2O measurements could reflect changes associated with seasons (Figure 1). Accordingly, the average WFPS of the soil was maintained at ~40–50% and ~70–80% for summer and autumn trial, respectively.

2.4. Nitrous Oxide Emissions Measurement

N2O fluxes were measured (at 0, 30, and 60 min) before urine application and then thereafter for every two to three day, up to seven week during the summer trial and measurements were repeated during the autumn trial. The gas sampling was carried out between 12 and 3 pm using a gas chamber with headspace volume of 3.4 L. Fifty ml of gas sample were collected at each sampling time using a syringe, and transferred into evacuated glass vials. In each sampling event, two ambient samples (i.e., outside the chamber) were taken to check for background emission. Concentration of N2O was measured using gas chromatography (GC-2010 Plus, Shimadzu, Japan) with a carrier gas N2 flow of 30 mL min−1, a column temperature of 70 °C and detector temperature of 315 °C. The increase in N2O concentration within the gas chamber headspace was calculated using linear regression and the cumulative N2O emissions were calculated using linear integration of daily fluxes [44,45].

2.5. Leachate Collection

During the summer trial, no leachates were produced, given the WFPS of the soils (40–50%) and the high ambient temperature. Once this ended, water was applied routinely to keep the grass growing while waiting for the autumn trial to begin. To minimize carryover N from the summer application to the autumn trial, all cores were leached twice (first and second leaching events) with copious amount of water prior to the second application of urine. This also allowed the WFPS of the soil to increase up to ≥70% as needed for the autumn trial. During the autumn trial, no leachate was collected as there were no fluctuations in the irrigation scheduled. By the end of week seven for autumn trial, all cores were leached (third leaching event) and one more N2O fluxes measurement were taken to check for any extended N2O emission. Drainage water collected after each of these leaching events was measured and analyzed colorimetrically for inorganic N content (NO3-N and NH4-N) using a Technicon Auto Analyser [46].

2.6. End-of-Trial Sampling

All the columns were dismantled in September 2015, 327 d after the beginning of the trial. Soil cores were taken from the center of each column using slide hammer (45 mm diameter) (Supplementary Information; Figure S3). Each soil core was then scanned using a modified contact probe of ASD FieldSpec 3 Vis-NIR Spectrometer [47] to predict root density and soil C content (results not included in this study). After scanning, each 10-cm soil layer (for the 0–10 and 10–20 cm depth layers—the bottom soil was not characterized) was sliced into layers 3, 3 and 4 cm thick (Supplementary Information; Figure S3). Each slice was weighed, then halved evenly and re-weighed. One half was used to determine root density (mg cm−3) by wet sieving [47]; part of the other half was used to determine soil moisture and soil water holding capacity (WHC), while the rest was air-dried, homogenized, and ground for soil chemical characterization. Soil bulk density was calculated for each soil slice using the internal diameter of the corer (43.5 mm), the slicing depth, and the weight of the soil oven dried at 105 °C.
Soil total C and N were analyzed using a Vario MACRO cube CHNS elemental analyzer (Elementar Analysensyteme GmbH, Hanau, Germany). Soil pH was measured in water at a soil:water ratio of 1:2.5 (w:v) [46]. The WHC was measured at −15, −1 and −0.3 bar matric potentials using a pressure plate [48]. The moisture content was gravimetrically determined and then converted to volumetric basis using the bulk density. The plant-available water content (AWC) was calculated as the difference in volumetric water content at −0.3 and −15 bar.

2.7. Other Measurements

Daily soil temperature was recorded using sensors installed in randomly selected columns (Figure 1). The WFPS was calculated based on the ratio of the volumetric soil water content to the total pore space (particle density assumed to be 2.65 Mg m−3). Each column was weighed periodically, and the amount of water added to each column and the rate at which this was evaporated—measured using evaporation pans placed inside the glasshouse—were recorded on daily basis.
Freshly harvested swards were weighed, dried at 70 °C for 48 h and re-weighed to calculate the dry matter (DM) yield. Then the dried swards were ground, acid-digested and analyzed for total N based on the colorimetric auto-analysis procedure using a Technicon Auto Analyser [46].

2.8. Statistical Analysis

Cumulative N2O was calculated by assuming that changes in fluxes between measurements were linear. Data were tested for normality and the homogeneity of variance using the Kolmogorov-Smirnov and Multiple Comparison test, respectively. Data that did not fulfill the assumptions were log-transformed before further statistical analysis. The effect of each treatment: (i) biochar application (control vs. small biochar particle size vs. large biochar particle size); and (ii) soil inversion (un-inverted and inverted) were assessed separately using one-way ANOVA, followed by LSD post-hoc test if significant difference were detected at p < 0.10. Means and standard error of the mean (SEM) were also reported. All statistical analyses were conducted using Minitab 16 (Minitab Inc., State College, PA, USA).

3. Results

3.1. Dry Matter (DM) Yield, N Concentrations in Plant and N Plant Uptake

Cumulative ryegrass DM yields at the end of the summer trial (range: 374 to 401 g m−2) were twice to three times larger than those of the autumn trial (range: 137 to 179 g m−2) (Table 3). There were no significant effects of either biochar addition (regardless of particle size) or soil inversion on DM yield. This is consistent with the general lack of changes in soil chemistry (e.g., soil pH, Supplementary Information; Table S2) caused by the addition of biochar to the system and the lack of nutrient value of this amendment (Table 1). Ryegrass grown during the summer season had a lower N concentration (range: 3.2% to 3.6%–w/w) than that grown during autumn (range: 5.1% to 5.4%–w/w), yet the amount of N taken up by the swards was larger in the former (range: 11.9 to 13.5 g m−2) than in the latter (range: 7.3 to 9.2 g m−2). This was consistent with the higher growth of swards in the warmer season, which led to an overall greater plant N uptake. While biochar addition had no effect on plant N, soil inversion caused an increase in N plant uptake in all summer treatments, although the effect was only significant for the control (UC: 12.7 g N m−2; IC: 13.4 g N m−2: p = 0.018) (Table 3).

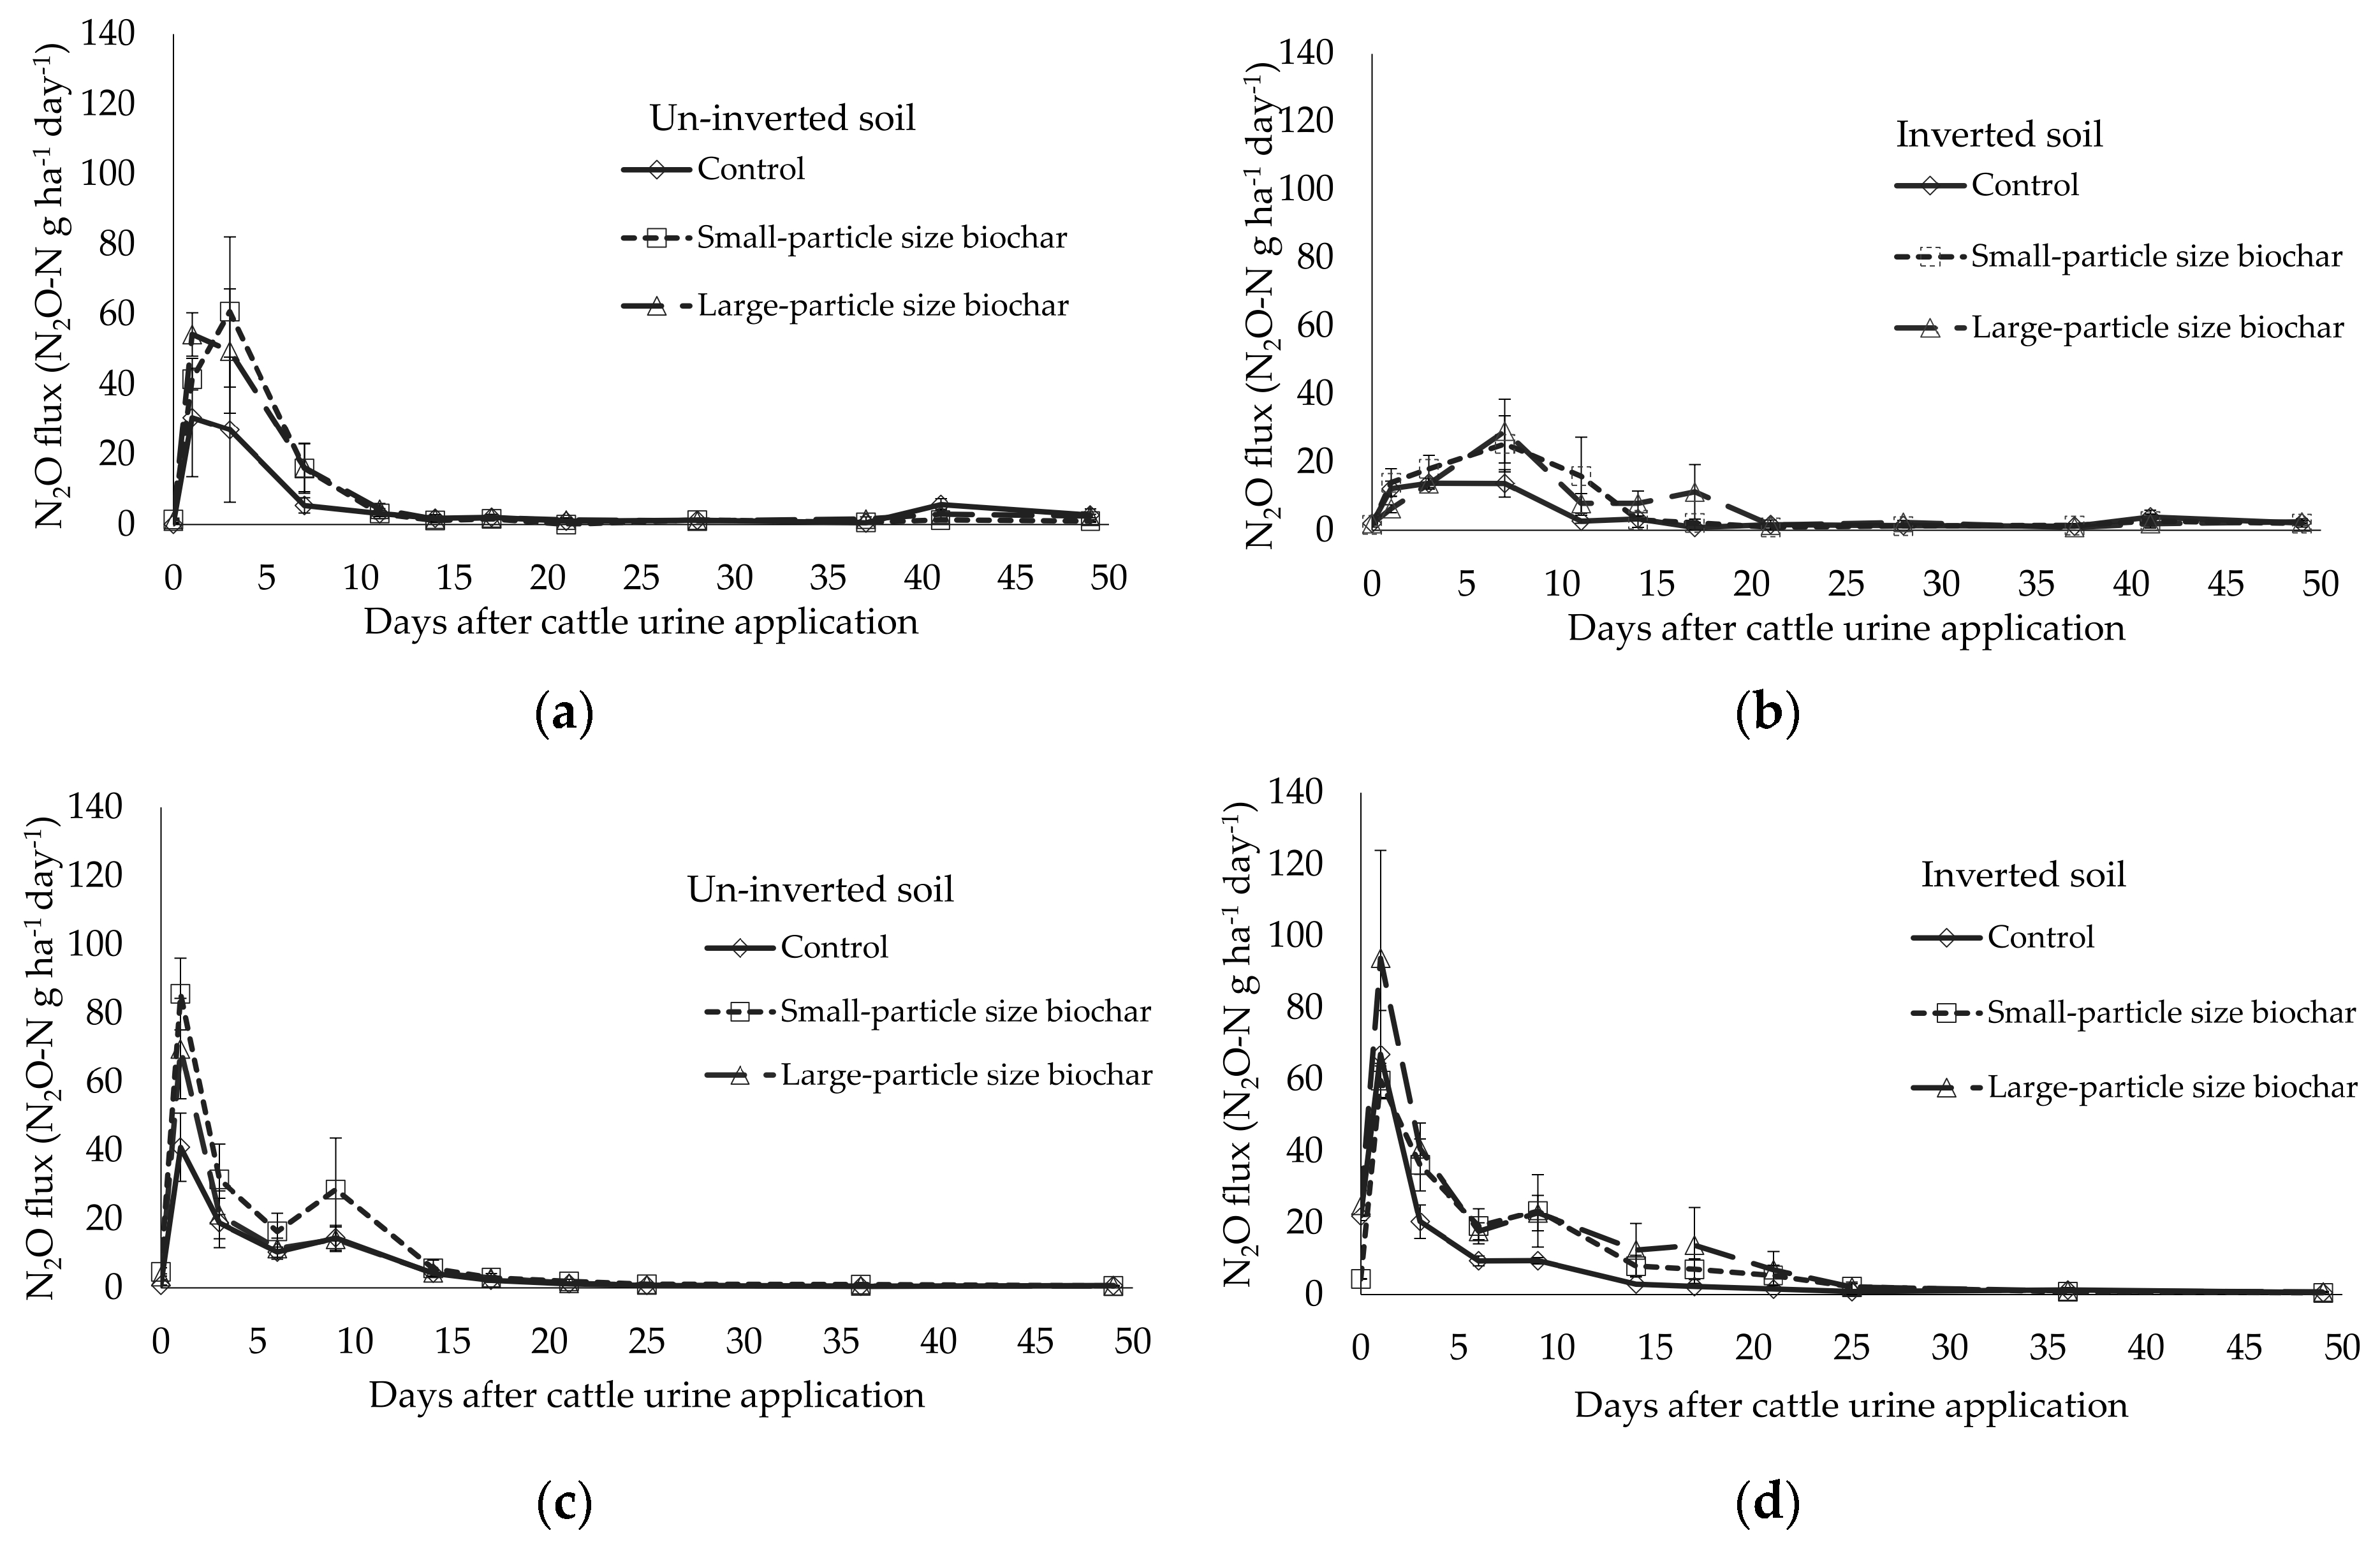
3.2. N2O Emissions Fluxes

During both summer and autumn, the average N2O emission prior to urine application from un-inverted cores (summer: 0.1 to 1.5 N2O-N g ha−1 day−1; autumn: 0.8 to 4.6 N2O-N g ha−1 day−1) were lower than those from the inverted cores (summer: 1.6 to 2.1 N2O-N g ha−1 day−1; autumn: 4.4 to 24.8 N2O-N g ha−1 day−1), with differences being significant between the un-inverted and inverted controls of both seasons, and also for the treatment with large particle biochar run during autumn (Figure 2, Supplementary Information; Table S3).
Shortly after the application of urine, all treatments displayed a peak in N2O emissions (Figure 2), these being generally higher in biochar-amended treatments (US, UL, IS, IL) compared to their respective controls (UC, IC), although differences were not significant. The time at which the peak occurred was influenced by (i) the season under consideration, and (ii) whether the soils were inverted or not. During summer, N2O emissions from the un-inverted soils always peaked (30.5 to 60.7 N2O-N g ha−1 day−1) within the first five day after urine application, whereas when inverted, peaks were smaller (13.9 to 29.1 N2O-N g ha−1 day−1), and displaced to day seven. During autumn, both un-inverted and inverted treatments showed a first peak within the first five day after urine application (40.7 to 93.8 N2O-N g ha−1 day−1), and a second and smaller peak by day 10 (9.4 to 28.6 N2O-N g ha−1 day−1), but no significant differences detected between treatments for both un-inverted and inverted soils (Figure 2, Supplementary Information; Table S3). Also, for the inverted soil, both treatments with biochar had an extended duration of N2O emission (21 days in summer and 25 days in autumn) compared with controls, which subsided after 11 days in summer and 17 days in autumn, while for un-inverted soils, all treatments including controls have similar duration of N2O emission in both seasons (14 days in summer and 17 days in autumn).
When comparing between seasons, N2O emissions were always higher in autumn than in summer from all treatments for both un-inverted and inverted cores, as expected, given the higher WFPS and higher amount of N added in autumn than in summer. However, when N2O emissions were reported as percentage of added N emitted as N2O, no significant differences were found between seasons.

3.3. Cumulative N2O Emissions

For the summer trial, the average cumulative N2O emissions from all treatments ranged from 200 to 372 N2O-N g ha−1 (Figure 3a), which accounted for 0.06% to 0.11% of applied N (354 kg N ha−1). The addition of biochar (regardless of particle size) caused a consistently higher cumulative N2O emission than the corresponding controls in both un-inverted and inverted treatments, although the differences were not significant. Soil inversion did not have a significant effect on cumulative N2O emissions either.
For the autumn trial, the average cumulative N2O emissions from all treatments ranged from 239 to 558 N2O-N g ha−1, which accounted for 0.04% to 0.10% of applied N (563 kg N ha−1) (Figure 3b). Here, variability between replicates was larger than during summer, which made difficult the detection of significant differences between treatments. However, the combined effect of biochar (of large particle size) addition and soil inversion, IL, did cause a significant increase in N2O emissions, compared with the un-inverted soil, UL. No significant differences were detected between seasons when comparing the cumulative N2O emissions out of total N added for each treatment.

3.4. Leachate Volume and Soil Water Holding Capacity

The volume of leachates after the first leaching event was smaller in the biochar-treated soils than in the non-treated (UC: 41, US: 17 and UL: 23 mm; p = 0.017; IC: 27, IS: 10 and IL: 13 mm; p = 0.062) (Table 4). Differences in leachate volume between biochar-amended and non-amended soils were still evident for the inverted treatments after the second leaching event (IC: 27, IS: 20 and IL: 14 mm; p = 0.060), but not for the un-inverted ones. After the third leaching event, no significant differences were observed between biochar-amended and un-amended treatments (Table 4). Overall, out of the total N applied, ≤0.2% was lost as mineral N in the form of NO3 (NH4+ concentrations in leachates were negligible) with no significant differences between treatments (Supplementary Information; Table S4).
At the end of the experiment, there were no significant differences in soil bulk densities between treatments (Supplementary Information; Table S5). The same was so for the volumetric soil moisture content at the different water potential tested (−0.3, 1 and 15 bar; Supplementary Information; Table S6) with the exception of the 6–10 cm layer, in the un-inverted soil, and the 10–13 cm layer, in the inverted one at three matric potentials (Figure 4). Interestingly, these layers corresponded to those of biochar-amended soils that were at the boundary with the non-biochar soil, and the effect was particle size-dependent (Figure 4; Supplementary Information; Figure S2). Specifically, in the un-inverted soil, it was the small particle size biochar that significantly retained the highest amount of water at −0.3 and −1 bar. In the inverted soil, it was the large particle size biochar that caused the largest water retention at the 10–13 cm depth, this difference being significant at all moisture tensions. The control soil always had the smallest water content at the different tensions studied (Figure 4).

3.5. Nitrogen Mass Balance

A mass balance indicated the amount of urine-N taken up by ryegrass plants was <40% in summer and <20% in autumn, the amount of urine-N lost as N2O was 0.7% to 0.13% of the N applied for both trials.

4. Discussion

4.1. Dry Matter Yield (DM), N Concentrations in Plant and N Plant Uptake

The apparent differences in the growth of swards during the summer period compared to that during the autumn was mostly attributed to differences in temperature (summer mean = 32.5 ± 2.8 °C; autumn mean = 20.4 ± 1.4 °C). Although annual ryegrass is a cool-season grass [49], the low total DM from autumn trial may also have been caused by the lack of fertilizer use over the course of this trial and in addition pasture scorching, caused by the high concentration urine applied, inhibited early growth [50,51]. The addition of biochar did not cause differences in plant growth or N uptake, as expected, given the low fertility value of the biochar and high stability of the C in biochar, which minimized N immobilization. Also, the relatively low CEC (~1.12 cmolc kg−1 at the beginning of the experiment) of biochar would make any possible additional retention of NH4+ to be negligible. Soil inversion, on the other hand, did have an effect causing a greater N plant uptake compared to the un-inverted soil during summer. This could be attributed to the fact that the new top horizon—being impoverished in soil C—there was less urine N immobilization than in the un-inverted soil, and thus increased the short-term N availability to plants.

4.2. N2O Emissions

4.2.1. N2O Emissions during the Summer Trial

Denitrification is expected to be the dominant N2O formation pathway in soil with WFPS >60% [52], which were the moisture conditions of the soils during autumn (70–80%). The WFPS during summer was considerably smaller (40–50%), but still the percentage of N2O-N loss out of urine-N added was similar during both seasons. Denitrification may have also contributed to N2O emissions during summer, in addition to nitrification—given that anaerobic microsites have been shown to be also present at WFPS ~45% [53]. In the inverted soils though, denitrification was probably less favored at the early stages of the experiment (i.e., summer), as the top layer of the inverted soils had small organic matter content. This was to some extent supported by the different pattern in the daily N2O emissions—with a delayed and broader peak—that these soils had compared with the un-inverted ones.
During summer, biochar addition to soil had no significant effect on N2O emissions. Yet N2O emissions from biochar-amended and inverted soils showed a larger and delayed larger peak compared with just inverted soils, which could be attributed, at least in part, to denitrification occurring once the urine reached the organic matter-rich and biochar-amended layer, as favored by a larger retention of water in it [54,55]. The greater water retention in biochar layers was supported by the fact that, in the first leaching events, biochar-amended soils drained a smaller amount of water than the non-biochar treatments, and this was more accentuated in the inverted treatments. Volumetric soil moisture contents measured in biochar-amended soils also showed significant greater values (p < 0.05) compared to un-amended ones but only at the boundary soil layers (Supplementary Information; Table S6), as discussed in Section 4.2.3.

4.2.2. N2O Emissions during the Autumn Trial

Emissions of N2O during autumn were generally larger than those during summer, which was attributed to the larger urine application, greater water content of the soil, and the smaller N uptake by the plants. In contrast to summer time, soil inversion did not have an effect on the shape of the curve of daily N2O emissions. This could be explained by the fact that by that time, ryegrass roots had already contributed to increase soil organic matter content (Supplementary Information; Tables S7 and S8), along with the fact that WFPS during autumn was larger, conditions that favored denitrification as soon as nitrate was made available. The immediate N2O emission after urine application suggests that this was mainly produced through denitrification [56].
The cumulative effect of the inversion treatment on N2O emissions only caused significant differences when in combination with large particle size biochar and during this wet season. In fact, this was the only treatment combination in which biochar amendment had a significant effect on N2O emissions, although overall, biochar-amended soils consistently generated greater N2O emissions compared with the treatments without biochar.

4.2.3. Effect of Biochar Particle-Size and Soil Inversion on Soil Moisture: Implications on N2O Emissions

The differences in water retention encountered at the boundary layers of soils amended with biochar suggests that, the effect of biochar on soil water retention was not only on the amount of water retained within biochar porosity, but also on the water hydraulic conductivity of the soil column. Soil inversion per se had an effect on water hydraulic conductivity, as noted during the first leaching events, in which the collected water was considerably smaller than the un-inverted soils. Burying the organic matter-rich surface horizons might have slowed down the flow of water due to hydrophobicity effects caused by organic molecules and produced a transient perched water layer during the autumn experiment. Moreover, biochar seemed to have caused a boundary effect in the un-inverted soil mixed with biochar of small particle size (US treatment) and in the inverted soil mixed with biochar of large particle size (IL treatment). The accumulation of water at the boundaries of these soil layers (Supplementary Information; Figure S2) may explain the higher volumetric moisture content of those specific biochar layers, as that may have caused an impregnation of biochar pores with water (to a larger extent than the operational wetting of soil samples prior to the use of the pressure plate). This may in turn explain that, in autumn, the US treatment was the un-inverted treatment with the largest N2O emissions, and the IL was the inverted treatment with the largest N2O emissions, yet only in the latter differences were significantly different. While a priori, the presence of a large biochar particle size would be thought to facilitate water drainage through this buried soil layer in the IL treatment, it is probable that in this study it had the opposite effect. The presence of a subsurface soil layer with large particle size biochar and greater aggregation may have caused a need for a larger water potential at the contact zone between the two soil layers in order to drain through the subsurface layer. It has been reported that when a fine-textured layer overlaying a coarse-textured one, the water movement in the profile is hindered i.e., the infiltration rate decreased when the water reached the interface between layers, allowing water to be stored in the fine-textured layer for a longer time [57,58]. Overall, the results highlights the important effect that biochar particle size has on soil physical properties as already reported by Lim et al. [59].

5. Conclusions

This soil column study has shown that, compared to a simulated standard re-grassing of soil using a shallow cultivation technique, the combination of soil inversion and addition of biochar to a soil had no major impact on ryegrass growth and N recovery from soil. However, these treatments caused changes in soil physical properties that were associated with higher N2O emissions after the application of cattle urine, specifically in the treatment in which a larger particle size biochar was used in combination with soil inversion. Field experiments with longer duration are needed to evaluate to what extent the changes in soil physical properties caused by soil inversion and application of biochar (with special attention to particle size) may affect the N2O emissions from soil in the long term.

Supplementary Materials

The following are available online at https://0-www-mdpi-com.brum.beds.ac.uk/2077-0472/8/11/175/s1. Figure S1: <2 mm pine biochar (left) and >4 mm pine biochar (right), Figure S2: The soil in cores was packed as follows: (a) Un-inverted soil; UC-control un-inverted; US—Un-inverted 0–10 cm with <2 mm biochar; UL—Un-inverted 0–10 cm with >4 mm biochar; (b) Inverted soil; IC- Control inverted; IS—Inverted 0–10 cm with <2 mm biochar; IL—Inverted 0–10 cm with >4 mm biochar, Figure S3: End-of-trial sampling; (i) A soil core (subsample) was taken out from each core using a corer (diameter of 45 mm) from 0-38 cm depth; (ii) Each core was scanned with NIRS; (iii) soil was sliced according to designated depth; (iv) each sliced soil was cut into half and separated for analysis, Table S1: Time scale of the experiment, Table S2: Soil pH of each layer measured at the end of the experiment, Table S3: N2O emission fluxes measured during summer and autumn trial (data showed for selected days only), Table S4: Treatment effects on the amount of NO3-N measured for every leaching event, Table S5: Soil bulk density (g/cm−3) at each depth measured at the end of the experiment, Table S6: Volumetric soil moisture contents (%) at different matric potentials including the available water content (AWC) measured after the end of the experiment, Table S7: Soil total C (%) of each layer measured at the end of the experiment, Table S8: Dry root (mg cm−3) in each soil layer measured at the end of the experiment.

Author Contributions

Conceptualization, A.F.M., M.C.-A. and M.H.; Investigation, A.F.M.; Supervision, M.C.-A. and M.H.; Writing—Original Draft, A.F.M.; Writing—Review & Editing, M.C.-A. and M.H.

Funding

The scholarship for Ainul Faizah Mahmud was provided by Ministry of Higher Education of Malaysia and Universiti Putra Malaysia. The APC was funded by Massey University (Palmerston North), New Zealand.

Acknowledgments

Universiti Putra Malaysia and the Government of Malaysia are acknowledged for providing a postgraduate scholarship to Ainul F. Mahmud, who thanks the Institute of Agriculture and Environment, Massey University and New Zealand Biochar Research Centre for hosting, provided access to facilities, research funds and supporting the postgraduate programme.

Conflicts of Interest

The authors declare no conflict of interest. The founding sponsors had no role in the experimental design, data collection and analyses, interpretation of results, the writing of the manuscript, and the decision to publish the results.

References

  1. Van der Weerden, T.J.; Cox, N.; Luo, J.; Di, H.J.; Podolyan, A.; Phillips, R.L.; Saggar, S.; de Klein, C.A.M.; Ettema, P.; Rys, G. Refining the New Zealand nitrous oxide emission factor for urea fertiliser and farm dairy effluent. Agric. Ecosyst. Environ. 2016, 222, 133–137. [Google Scholar] [CrossRef]
  2. Ministry for the Environment. New Zealand’s Greenhouse Gas Inventory 1990–2016. Available online: http://www.mfe.govt.nz/sites/default/files/media/Climate%20Change/National%20GHG%20Inventory%20Report%201990-2016-final.pdf (accessed on 30 September 2018).
  3. About New Zealand’s Emissions Reduction Targets. Available online: https://www.mfe.govt.nz/climate-change/what-government-doing/emissions-reduction-targets/about-our-emissions-reduction (accessed on 30 September 2018).
  4. De Klein, C.A.M.; Sherlock, R.R.; Cameron, K.C. Nitrous oxide emissions from agricultural soils in New Zealand—A review of current knowledge and directions for future research. J. R. Soc. New Zeal. 2001, 31, 37–41. [Google Scholar] [CrossRef]
  5. Wrage, N.; Velthof, G.L.; Van Beusichem, M.L.; Oenema, O. Role of nitrifier denitrification in the production of nitrous oxide. Soil Biol. Biochem. 2001, 33, 1723–1732. [Google Scholar] [CrossRef]
  6. Tiedje, J.M. Ecology of denitrification and dissimilatory nitrate reduction to ammonium. In Biology of Anaerobic Microorganisms; John Wiley and Sons: New York, NY, USA, 1988; pp. 179–244. ISBN 0471882267. [Google Scholar]
  7. Lehmann, J.; Joseph, S. (Eds.) Biochar for Environmental Management: Science, Technology and Implementation; Routledge: Abingdon, UK, 2015. [Google Scholar]
  8. Van Zwieten, L.; Kammen, C.; Cayuela, M.L.; Singh, B.P.; Joseph, S.; Kimber, S.; Donne, S.; Clough, T.J.; Spokas, K.A. Biochar effects on nitrous oxide and methane emissions from soil. In Biochar for Environmental Management: Science and Technology, 2nd ed.; Lehmann, J., Joseph, S., Eds.; Routledge: Abingdon, UK, 2015; pp. 489–520. ISBN 1134489536, 9781134489534. [Google Scholar]
  9. Van Zwieten, L.; Kimber, S.; Morris, S.; Downie, A.; Berger, E.; Rust, J.; Scheer, C. Influence of biochars on flux of N2O and CO2 from Ferrosol. Aust. J. Soil Res. 2010, 48, 555–568. [Google Scholar] [CrossRef]
  10. Case, S.D.C.; McNamara, N.P.; Reay, D.S.; Whitaker, J. The effect of biochar addition on N2O and CO2 emissions from a sandy loam soil—The role of soil aeration. Soil Biol. Biochem. 2012, 51, 125–134. [Google Scholar] [CrossRef]
  11. Nelissen, V.; Saha, B.K.; Ruysschaert, G.; Boeckx, P. Effect of different biochar and fertilizer types on N2O and NO emissions. Soil Biol. Biochem. 2014, 70, 244–255. [Google Scholar] [CrossRef]
  12. Thomazini, A.; Spokas, K.; Hall, K.; Ippolito, J.; Lentz, R.; Novak, J. GHG impacts of biochar: Predictability for the same biochar. Agric. Ecosyst. Environ. 2015, 207, 183–191. [Google Scholar] [CrossRef]
  13. Cayuela, M.L.; Sanchez-Monedero, M.A.; Roig, A.; Hanley, K.; Enders, A.; Lehmann, J. Biochar and denitrification in soils: When, how much and why does biochar reduce N2O emissions? Sci. Rep. 2013, 3, 1732. [Google Scholar] [CrossRef] [PubMed]
  14. Angst, T.E.; Six, J.; Reay, D.S.; Sohi, S.P. Impact of pine chip biochar on trace greenhouse gas emissions and soil nutrient dynamics in an annual ryegrass system in California. Agric. Ecosyst. Environ. 2014, 191, 17–26. [Google Scholar] [CrossRef]
  15. Mukome, F.N.D.; Six, J.; Parikh, S.J. The effects of walnut shell and wood feedstock biochar amendments on greenhouse gas emissions from a fertile soil. Geoderma 2013, 200–201, 90–98. [Google Scholar] [CrossRef]
  16. Verhoeven, E.; Six, J. Biochar does not mitigate field-scale N2O emissions in a Northern California vineyard: An assessment across two years. Agric. Ecosyst. Environ. 2014, 191, 27–38. [Google Scholar] [CrossRef]
  17. Spokas, K.A.; Reicosky, D.C. Impacts of sixteen different biochars on soil greenhouse gas production. Ann. Environ. Sci. 2009, 3, 179–193. [Google Scholar]
  18. Bruun, E.W.; Müller-Stöver, D.; Ambus, P.; Hauggaard-Nielsen, H. Application of biochar to soil and N2O emissions: Potential effects of blending fast-pyrolysis biochar with anaerobically digested slurry. Eur. J. Soil Sci. 2011, 62, 581–589. [Google Scholar] [CrossRef]
  19. Schimmelpfennig, S.; Müller, C.; Grünhage, L.; Koch, C.; Kammann, C. Biochar, hydrochar and uncarbonized feedstock application to permanent grassland-Effects on greenhouse gas emissions and plant growth. Agric. Ecosyst. Environ. 2014, 191, 39–52. [Google Scholar] [CrossRef]
  20. Yanai, Y.; Toyota, K.; Okazaki, M. Effects of charcoal addition on N2O emissions from soil resulting from rewetting air-dried soil in short-term laboratory experiments: Original article. Soil Sci. Plant Nutr. 2007, 53, 181–188. [Google Scholar] [CrossRef]
  21. Singh, B.P.; Hatton, B.J.; Singh, B.; Cowie, A.L.; Kathuria, A. Influence of Biochars on Nitrous Oxide Emission and Nitrogen Leaching from Two Contrasting Soils. J. Environ. Qual. 2010, 39, 1224–1235. [Google Scholar] [CrossRef] [PubMed]
  22. Saarnio, S.; Heimonen, K.; Kettunen, R. Biochar addition indirectly affects N2O emissions via soil moisture and plant N uptake. Soil Biol. Biochem. 2013, 58, 99–106. [Google Scholar] [CrossRef]
  23. Rose, T.J.; Keen, B.; Morris, S.G.; Quin, P.; Rust, J.; Kearney, L.; Kimber, S.; Van Zwieten, L. Application of woody biochar and woody mulch to mitigate nitrous oxide emissions from a poultry litter-amended soil in the subtropics. Agric. Ecosyst. Environ. 2016, 228, 1–8. [Google Scholar] [CrossRef] [Green Version]
  24. Kammann, C.; Ratering, S.; Eckhard, C.; Muller, C. Biochar and Hydrochar Effects on Greenhouse Gas (Carbon Dioxide, Nitrous Oxide, and Methane) Fluxes from Soils. J. Environ. Qual. 2012, 41, 1052–1066. [Google Scholar] [CrossRef] [PubMed]
  25. Zheng, J.; Stewart, C.E.; Cotrufo, M.F. Biochar and nitrogen fertilizer alters soil nitrogen dynamics and greenhouse gas fluxes from two temperate soils. J. Environ. Qual. 2012, 41, 1361–1370. [Google Scholar] [CrossRef] [PubMed]
  26. Chen, J.; Kim, H.; Yoo, G. Effects of biochar addition on CO2 and N2O emissions following fertilizer application to a cultivated grassland soil. PLoS ONE 2015, 10, 1–17. [Google Scholar] [CrossRef] [PubMed]
  27. Clough, T.J.; Bertram, J.E.; Ray, J.L.; Condron, L.M.; O’Callaghan, M.; Sherlock, R.R.; Wells, N.S. Unweathered Wood Biochar Impact on Nitrous Oxide Emissions from a Bovine-Urine-Amended Pasture Soil. Soil Sci. Soc. Am. J. 2010, 74, 852–860. [Google Scholar] [CrossRef] [Green Version]
  28. Taghizadeh-Toosi, A.; Clough, T.J.; Condron, L.M.; Sherlock, R.R.; Anderson, C.R.; Craigie, R.A. Biochar incorporation into pasture soil suppresses in situ nitrous oxide emissions from ruminant urine patches. J. Environ. Qual. 2011, 40, 468. [Google Scholar] [CrossRef] [PubMed]
  29. Clough, T.J.; Lincoln University, Lincoln, New Zealand. Personal communication, 2018.
  30. Cayuela, M.L.; van Zwieten, L.; Singh, B.P.; Jeffery, S.; Roig, A.; Sanchez-Monedero, M.A. Biochar’s role in mitigating soil nitrous oxide emissions: A review and meta-analysis. Agric. Ecosyst. Environ. 2014, 191, 5–16. [Google Scholar] [CrossRef]
  31. Calvelo Pereira, R.; Wisnubroto, E.; Hedley, M.J.; Camps Arbestain, M.; Green, S.; Saggar, S. Can a deep application of biochar mitigate a pulse of greenhouse gas emissions after a fertilizer application to mature pastures? Unpublished work.
  32. Rajkovich, S.; Enders, A.; Hanley, K.; Hyland, C.; Zimmerman, A.R.; Lehmann, J. Corn growth and nitrogen nutrition after additions of biochars with varying properties to a temperate soil. Biol. Fertil. Soils 2012, 48, 271–284. [Google Scholar] [CrossRef]
  33. Rayment, G.E.; Higginson, F.R. Australian Laboratory Handbook of Soil and Water Chemical Methods; Inkata Press Pty Ltd.: Melbourne, Australia, 1992; ISBN 0909605688. [Google Scholar]
  34. Calvelo Pereira, R.; Kaal, J.; Camps Arbestain, M.; Pardo Lorenzo, R.; Aitkenhead, W.; Hedley, M.; Macías, F.; Hindmarsh, J.; Maciá-Agulló, J.A. Contribution to characterisation of biochar to estimate the labile fraction of carbon. Org. Geochem. 2011, 42, 1331–1342. [Google Scholar] [CrossRef] [Green Version]
  35. Enders, A.; Lehmann, J. Comparison of Wet-Digestion and Dry-Ashing Methods for Total Elemental Analysis of Biochar. Commun. Soil Sci. Plant Anal. 2012, 43, 1042–1052. [Google Scholar] [CrossRef] [Green Version]
  36. Wang, T.; Camps-Arbestain, M.; Hedley, M.; Bishop, P. Predicting phosphorus bioavailability from high-ash biochars. Plant Soil 2012, 357, 173–187. [Google Scholar] [CrossRef]
  37. Wang, T.; Camps Arbestain, M.; Hedley, M.; Bishop, P. Chemical and bioassay characterisation of nitrogen availability in biochar produced from dairy manure and biosolids. Org. Geochem. 2012, 51, 45–54. [Google Scholar] [CrossRef]
  38. Calvelo Pereira, R.; Arbestain, M.C.; Sueiro, M.V.; Macia-Agullo, J.A. Assessment of the surface chemistry of wood-derived biochars using wet chemistry, Fourier transform infrared spectroscopy and X-ray photoelectron spectroscopy. Soil Res. 2015, 53, 753–762. [Google Scholar] [CrossRef]
  39. Wang, T.; Camps-Arbestain, M.; Hedley, M. Predicting C aromaticity of biochars based on their elemental composition. Org. Geochem. 2013, 62, 1–6. [Google Scholar] [CrossRef]
  40. Camps-Arbestain, M.; Amonette, J.E.; Singh, B.; Wang, T.; Schmidt, H.P. A biochar classification system and associated test methods. In Biochar for Environmental Management: Science, Technology and Implementation, 2nd ed.; Lehmann, J., Joseph, S., Eds.; Routledge: Abingdon, UK, 2015; pp. 165–193. ISBN 1134489536, 9781134489534. [Google Scholar]
  41. Hewitt, A.; Dymond, J. Survey of New Zealand Soil Orders. In Ecosystem Services in New Zealand: Conditions and Trends; Dymond, J., Ed.; Manaaki Whenua Press: Lincoln, New Zealand, 2013; pp. 121–131. ISBN 9780478347364. [Google Scholar]
  42. Soil Survey Staff. Keys to Soil Taxonomy, 12th ed.; USDA-Natural Resources Conservation Service: Washington, DC, USA, 2014.
  43. Deurer, M.; Clothier, B.E.; Green, S.R.; Gee, G. Infiltration rate, hydraulic conductivity, preferential flow. In Soil Science: Step-by-Step Field Analysis; Logsdon, S., Caly, D., Moore, D., Tsegaye, T., Eds.; SSSA: Madison, WI, USA, 2008; pp. 221–234. ISBN 9780891188568. [Google Scholar]
  44. Luo, J.; Lindsey, S.B.; Ledgard, S.F. Nitrous oxide emissions from application of urea on New Zealand pasture. Biol. Fertil. Soils 2008, 44, 463–470. [Google Scholar] [CrossRef]
  45. Jones, S.K.; Famulari, D.; Di Marco, C.F.; Nemitz, E.; Skiba, U.M.; Rees, R.M.; Sutton, M.A. Nitrous oxide emissions from managed grassland: A comparison of eddy covariance and static chamber measurements. Atmos. Meas. Tech. 2011, 4, 2179–2194. [Google Scholar] [CrossRef]
  46. Blakemore, L.C. Soil Bureau Laboratory Methods. A. Methods for chemical analysis of soils. NZ Soil Bur. Sci. Rep. 1987, 80, 44–45. [Google Scholar]
  47. Kusumo, B.H.; Hedley, M.J.; Hedley, C.B.; Hueni, A.; Arnold, G.C.; Tuohy, M.P. The use of Vis-NIR spectral reflectance for determining root density: Evaluation of ryegrass roots in a glasshouse trial. Eur. J. Soil Sci. 2009, 60, 22–32. [Google Scholar] [CrossRef]
  48. Dane, J.H.; Hopmans, J.H. Water retention and storage. In Methods of Soil Analysis. Part 4. SSSA Book Ser. 5; Dane, J.H., Topp, G.C., Eds.; SSSA: Madison, WI, USA, 2002; pp. 671–717. [Google Scholar]
  49. Charlton, J.F.L.; Stewart, A.V. Pasture species and cultivars used in New Zealand—A list. Proc. New Zeal. Grassl. Assoc. 1999, 61, 147–166. [Google Scholar]
  50. Selbie, D.R.; Buckthought, L.E.; Shepherd, M.A. The Challenge of the Urine Patch for Managing Nitrogen in Grazed Pasture Systems; Elsevier Ltd.: Amsterdam, The Netherlands, 2015; Volume 129, ISBN 9780128021385. [Google Scholar]
  51. Baral, K.R.; Thomsen, A.G.; Olesen, J.E.; Petersen, S.O. Controls of nitrous oxide emission after simulated cattle urine deposition. Agric. Ecosyst. Environ. 2014, 188, 103–110. [Google Scholar] [CrossRef]
  52. Bateman, E.J.; Baggs, E.M. Contributions of nitrification and denitrification to N2O emissions from soils at different water-filled pore space. Biol. Fertil. Soils 2005, 41, 379–388. [Google Scholar] [CrossRef]
  53. Carter, M. Contribution of nitrification and denitrification to N2O emissions from urine patches. Soil Biol. Biochem. 2007, 39, 2091–2102. [Google Scholar] [CrossRef]
  54. Basso, A.S.; Miguez, F.E.; Laird, D.A.; Horton, R.; Westgate, M. Assessing potential of biochar for increasing water-holding capacity of sandy soils. GCB Bioenergy 2013, 5, 132–143. [Google Scholar] [CrossRef]
  55. Barnes, R.T.; Gallagher, M.E.; Masiello, C.A.; Liu, Z.; Dugan, B. Biochar-Induced Changes in Soil Hydraulic Conductivity and Dissolved Nutrient Fluxes Constrained by Laboratory Experiments. PLoS ONE 2014, 9, e0108340. [Google Scholar] [CrossRef] [PubMed]
  56. De Klein, C.A.; van Logtesjin, R.S.P. Denitrification and N2O emission from urine-affected grassland soil. Plant Soil 1994, 163, 235–241. [Google Scholar] [CrossRef]
  57. Hillel, D. Entry of Water into Soil. In Environmental Soil Physics: Fundamentals, Applications, and Environmental Considerations; Elsevier: Amsterdam, The Netherlands, 1998; p. 385. ISBN 0080544150. [Google Scholar]
  58. Si, B.; Dyck, M.; Parkin, G. Flow and Transport in Layered Soils. Can. J. Soil Sci. 2011, 91, 127–132. [Google Scholar] [CrossRef]
  59. Lim, T.J.; Spokas, K.A.; Feyereisen, G.; Novak, J.M. Predicting the impact of biochar additions on soil hydraulic properties. Chemosphere 2016, 142, 136–144. [Google Scholar] [CrossRef] [PubMed]
Figure 1. The maximum glasshouse and soil temperatures (at 10 cm depth) over the 49-day of both summer and autumn trials. In summer, cores were irrigated with 8 mm d−1 of deionized water to maintain initial soil WFPS% of 40–50% and the average daily evaporation rate was ~6 mm d−1. In autumn, cores were irrigated with 5 mm d−1 of deionized water to maintain initial soil WFPS % of 70–80% and the average daily evaporation rate was ~2 mm d−1. The cores were irrigated after gas measurements were taken. In summer, specific actions were taken to cool down the cores and the minimum glasshouse temperature during both summer and autumn trials was always maintained at ~17 °C.
Agriculture 08 00175 g001
Figure 2. Average N2O-fluxes (SEM (n = 4)) by day from soil columns after cattle urine application for summer (a,b), and autumn trials (c,d).
Agriculture 08 00175 g002
Figure 3. Cumulative N2O emissions from soil columns after cattle urine application for summer (a) and autumn (b) trials. Within a specific season and specific soil inversion treatment, different small letters indicate differences between biochar treatments (SEM (n = 4) and p < 0.10). Within a specific season and specific biochar treatment, different uppercase letters indicate differences between un-inverted and inverted treatments (SEM (n = 4) and p < 0.10).
Agriculture 08 00175 g003
Figure 4. Volumetric soil moisture contents (%) at different matric potentials; −15, −1 and −0.3 bar (in log scale) at (a) 6–10 cm depth (un-inverted soil) and (b) 10–13 cm depth (inverted soil) measured after the end of the experiment. Within a specific matric potential, different small letters indicate differences at p < 0.10 between treatments (SEM (n = 4)). In the un-inverted soil, biochar was at 0–10 cm depth; in the inverted soil biochar was at 10–20 cm depth.
Agriculture 08 00175 g004
Table 1. Chemical characteristics of pine biochar (feedstock source: Foxton, New Zealand) at the beginning of experiment.
PropertiesUnitsBiochar
SmallLarge
Particle sizemm<2 mm>4 mm
pH (H2O)-7.36.8
Liming Equivalence% CaCO3-eq−2.2−1.9
Bulk Density (BD)Mg m−30.200.17
Total Cg kg−1821826
Total Ng kg−12.92.5
Total Hg kg−130.834.5
Total Og kg−1146137
C/N ratio(w/w)285330
H/CorgAtomic ratio0.450.50
O/CorgAtomic ratio0.130.12
Ash%2.92.7
Volatile matter%18.617.8
Fixed C%74.676.5
CECcmolc kg−11.21.0
Total Pg kg−10.50.5
Total Kg kg−12.62.4
Total Mgg kg−11.71.6
Total Cag kg−15.55.5
Available Nmg kg−13640
Available Pmg kg−18480
Total O for biochar was determined by (100%-C%-N%-H%) and converted to g kg−1.
Table 2. Chemical characteristic of Tokomaru silt loam soil (Palmerston North, New Zealand) at the beginning of experiment.
PropertiesUnits0–10 cm10–20 cm20–40 cm
pH (H2O)-5.485.515.60
Bulk Density (BD)Mg m−31.051.291.43
Total Cg kg−135.222.613.0
Total Ng kg−13.42.21.2
C/N ratio(w/w)10.410.310.8
Cation Exchange Capacity (CEC)cmolc kg−120.018.015.0
Table 3. Treatment and soil inversion effects on dry matter yields, plant N concentration, plant N uptake, and percentage of the total N applied taken up by plant for summer and autumn trial.
Summer Trial
Properties
(Unit)
Soil InversionTreatments
ControlSmall-Particle Size BiocharLarge-Particle Size Biochar
Dry Matter (DM)
(g m−2)
Un-inverted374aA350aA351aA
Inverted374aA401aA386aA
Plant N concentration
(g N 100 g−1)
Un-inverted3.4aA3.4aA3.5aA
Inverted3.6aA3.2aA3.3aA
Plant N uptake
(g m−2)
Un-inverted12.7aB11.9aA12.3aA
Inverted13.5aA12.8aA12.8aA
N taken up out of added N
(354 kg N ha−1) (%)
Un-inverted36.0aB33.7aA34.7aA
Inverted38.0aA36.3aA36.1aA
Autumn Trial
Properties
(Unit)
Soil InversionTreatments
ControlSmall-Particle Size BiocharLarge-Particle Size Biochar
DM
(g m−2)
Un-inverted179aA137aA157aA
Inverted172aA172aA155aA
Plant N concentration
(g N 100 g−1)
Un-inverted5.1aA5.3aA5.4aA
Inverted5.2aA5.2aA5.3aA
Plant N uptake
(g m−2)
Un-inverted9.2aA7.3aA8.5aA
Inverted8.9aA8.9aA8.2aA
N taken up out of added N
(563 kg N ha−1) (%)
Un-inverted16.2aA13.0aA15.1aA
Inverted15.9aA15.9aA14.6aA
Within a specific season, (i) different small letters within a row indicate differences between biochar treatments (n = 4) and p < 0.10), and (ii) different uppercase letters within a column indicate differences between un-inverted and inverted treatments (n = 4 and p < 0.10).
Table 4. Treatment effects on the amount of drainage collected for every leaching event including cumulative drainage volumes.
Leaching EventLeaching Volume (mm) between Treatments
UCUSULp-ValueICISILp-Value
1st41a17b23b0.01727a10b13b0.062
2nd24a26a26a0.93927a20ab14b0.060
3rd35a38a32a0.75039a42a52a0.335
Cumulative101a81a80a0.10992a71.4a80a0.378
UC—control un-inverted; US—Un-inverted 0–10 cm with <2 mm biochar; UL—un-inverted 0–10 cm with >4 mm biochar; IC—control inverted; IS—inverted 0–10 cm with <2 mm biochar; IL—inverted 0–10 cm with >4 mm biochar. Different letters denote significant differences at p < 0.10 between treatments at each leaching event (n = 4).

