Article

Topology Optimization-Driven Design for Offshore Composite Wind Turbine Blades

College of Civil and Transportation Engineering, Shenzhen University, Shenzhen 518060, China
*
Authors to whom correspondence should be addressed.
J. Mar. Sci. Eng. 2022, 10(10), 1487; https://0-doi-org.brum.beds.ac.uk/10.3390/jmse10101487
Submission received: 28 March 2022 / Revised: 30 July 2022 / Accepted: 1 August 2022 / Published: 13 October 2022
(This article belongs to the Topic Marine Renewable Energy)

Abstract

:
With the increase in wind turbine power, the size of the blades is significantly increasing to over 100 m. It is becoming more and more important to optimize the design for the internal layout of large-scale offshore composite wind turbine blades to meet the structural safety requirements while improving the blade power generation efficiency and achieving light weight. In this work, the full-scale internal layout of an NREL 5 MW offshore composite wind turbine blade is elaborately designed via the topology optimization method. The aerodynamic wind loads of the blades were first simulated based on the computational fluid dynamics. Afterwards, the variable density topology optimization method was adopted to perform the internal structure design of the blade. Then, the first and second generation multi-web internal layouts of the blade were reversely designed and evaluated in accordance with the stress level, maximum displacement of blade tip and fatigue life. In contrast with the reference blade, the overall weight of the optimized blade was reduced by 9.88% with the requirements of stress and fatigue life, indicating a better power efficiency. Finally, the vibration modal and full life cycle of the designed blade were analyzed. The design conception and new architecture could be useful for the improvement of advanced wind turbines.

Graphical Abstract

1. Introduction

Wind energy is one of the most mature forms of renewable energy and is an effective strategy to alleviate energy shortages, reduce environmental pollution and improve climate conditions [1,2,3]. The utilization of onshore wind energy has encountered bottlenecks due to the restriction of land wind resources, noise and environmental pollution. Hence, in the last two decades, offshore wind farms have been rapidly growing. In 2021, new installations of more than 6 GW were generated all over the world [4]. For the offshore wind turbine, the blade is one of the most important components to convert wind kinetic energy into electrical energy. However, approximately 20% of the failures in wind turbine components occurs in the blades [5,6]. Nowadays, the blade length in offshore wind turbines has dramatically grown over 100 m, resulting in major concerns about the blades’ resistance to damage over a life period of 20–25 years [7]. Compared to the onshore wind turbine blades, offshore wind turbine blade damage may happen in different parts due to static, vibration and fatigue loadings [8,9]. Moreover, it is great of importance to lighten the weight of the blades to reduce transportation costs.
Extensive studies for the design of the optimal offshore wind turbine blades have been carried out in recent years [10,11,12,13]. Each blade includes skin and web structures, where the skin structure determines the aerodynamic characteristics and the web structure provides the stiffness and strength requirements of the blade. Naung et al. [14] proposed a highly efficient nonlinear frequency-domain solution approach for elaborating the aerodynamic and aeromechanical performances of an oscillating wind turbine blade aerofoil. In comparison to the time-domain method, the frequency-domain method was not only accurate but also computationally very efficient as the computation time was declined by 90%. Furthermore, Naung et al. [15] also investigated the influence of the wake of neighboring turbines on the aerodynamics of a wind turbine within windfarms based on the aforesaid frequency-domain method. The corresponding conclusions had been also obtained, namely that the frequency-domain solution method provided accurate results while reducing the computational cost by one to two orders of magnitude in comparison with the conventional time-domain method. In addition, Nakhchi and Naung et al. [16] also developed direct numerical simulations (DNS) to reveal the aerodynamic performance, transition to turbulence, and to capture the laminar separation bubble occurring on a wind turbine blade. Mamouri et al. [17,18] designed different shapes of wind turbine airfoil by incorporating entropy generation analysis. Chen et al. [19] performed the lay-up thickness size optimization for a 2 MW composite wind turbine blade with the objective of mass saving based on the particle swarm optimization method. Yet, only the blade stiffness and blade tip displacement were considered, and the extension of weight reduction was limited in accordance with the change of lay-up thickness. Ghiasi et al. [20] carried out the optimization design for the lay-up selection of a composite wind turbine blade with the objective of maximum stiffness. The results found that gradient-based methods were faster than others, but the optimal solution may be a local optimal value. In addition to the composite skin optimization, Zhang et al. [21] compared the maximum deformation, frequency and stress between the single-web and twin-web structures inside an 8 MW wind turbine blade, and the results showed that it was better to choose the twin-web structure form for large-size wind turbine blades. Liao et al. [22] employed an improved particle swarm algorithm (PSA) with the FAST program to optimize the thickness and location of the layers in the spar caps of wind turbine blades. The comparison of the results between the optimal and reference blades indicated that the optimization method was a feasible strategy to obtain the global optimization solution. The aforementioned studies focused on the local structural optimization design of wind turbine blades, whereas investigations on the structural optimization design of blades with the objective of weight reduction are considerably insufficient.
In the structural optimization design, topology optimization design is an effective way to obtain a reasonable internal layout of the blade, which can provide a new configuration and solution for engineering structural design [23]. Nowadays, the main topology optimization methods include the variable thickness method [24], homogenization method [25] and variable density method [26]. Generally, the variable thickness method and homogenization method are basically used for comparatively simple structures. For the variable density method, it has been integrated in finite element simulation software, i.e., ANSYS Workbench. Joncas et al. [27] adopted the topology optimization method to design the end part configuration of a thermoplastic composite wind turbine blade under waving moment and pendulum moment loading. Burton et al. [28] also adopted the topology optimization method to design the inner-surface structures of a wind turbine blade, and the optimization configuration was a non-prismatic structure. Yu et al. [29] designed a novel honeycomb-filled main beam cavity of a wind turbine blade based on the variable density topology optimization method [26], and a reasonable layout of honeycomb cells was obtained and the weight of the optimal blade was reduced by 8.41%. Zhang et al. [30] used the variable density topology optimization method to optimize the thickness and location of the main beam and twin-web of a wind turbine blade, and the optimal configuration showed that the webs play a key supporting role for maintaining the aerodynamic shape of the blade and the overall weight of blade obviously decreased though the dimension and location of the inner webs. However, the challenges remain about how many webs should be placed in the blades and the layout of the related webs.
To address this, Aage et al. [31] adopted the variable density topology optimization method to successfully design the internal structure of an aeroplane wing based on the full-scale internal structure. From this viewpoint, in this work, we report the design of the internal layout of a 5 MW offshore wind turbine blade with the objective of maximum stiffness using the variable density topology optimization method. The aerodynamic loads of blades were obtained though computational fluid dynamics (CFD) simulation. Afterwards, the internal structure of the blade was optimized using the variable density topology optimization, and two multi-web internal layouts were obtained through the reverse design inspired by the topology optimization results. Finally, by validating the performance indexes with respect to stress level, maximum displacement and fatigue life, the multi-web structural layout of the second generation optimal wind turbine blade was an optimal feasible structure, which answered the key scientific issues of how many webs should be placed inside the blade and where to array the related webs. We hope the design method and findings could provide novel and efficient routes to high-performance offshore wind turbine blades.

2. Analytical Preliminaries

2.1. Topology Optimization Method

The variable density topology optimization problem [32] can be expressed as follows:
min ρ e ϕ ( ρ ) = U T K U = e = 1 N ( ρ e ) P u e T k 0 u e s . t . { K U = F e = 1 N ρ e V e V * , 0 ρ min ρ e 1
where ϕ means a sum of each element’s compliance. U , K and F mean the global displacement, stiffness matrix and force vectors, respectively. k 0 and u e mean the element stiffness matrix and displacement vector. ρ means the design variable vector, viz element density vector. N means the element amount of design domain. V e and V * mean the unit element volume and total volume for the design domain. To make sure of the numerically stable iteration, ρ min = 0.001 is chosen as the lower limitation of design variable. Additionally, a convolution-type filtering operation is used to filter the holes, viz.
ρ e = i N e w ( r i , r e ) v i x i i N e w ( r i , r e ) v i
where N e = { i | r i r e R } means a neighborhood set within the radius, R . r i and r e mean the spatial central coordinate of elements i and e , respectively. w ( r i , r e ) = R r i r e means the weighting function. v i is the volume of element i .

2.2. CFD Model of Reference Composite Wind Turbine Blade

2.2.1. Control Equation, Geometric Model of Composite Wind Turbine Blade and Flow Field for CFD Simulation

In this work, the Navier–Stokes equation (RANS) based on Reynolds stress averaging was used to solve the flow field of the wind turbine blade, see Equation (1).
  t ( ρ u ) + ( ρ u u ) = p + ( μ ( u + u T ) 2 3 μ ( u ) ) + F
where F is the external force applied to the fluid.
The wind turbine in this work is the NREL offshore 5 MW baseline wind turbine developed by National Renewable Energy Laboratory (NREL) [33]. The length of composite blade in the NREL 5 MW machine is about 61.63 m. The blade is artificially divided into 17 airfoils from the root to the tip, namely: Cylinder, Du40, Du35, Du30, Du25, Du21 and NACA64, respectively. Note: The detailed geometric parameters corresponding to the aforesaid airfoils can be found in Table S1, Supporting Information (SI).
The geometric model of the composite wind turbine blade can be established as follows: ① Translate the aerodynamic center of the airfoil to the coordinate origin; ② Rotate and transform the airfoil coordinate in accordance with the twist and chord; ③ Calculate the 3D coordinate of nodes using the following equation:
{ x = c | x x Aero | x x Aero ( x x Aero ) 2 + y 2 cos ( arctan y x x Aero + β ) y = c | x x Aero | x x Aero ( x x Aero ) 2 + y 2 sin ( arctan y x x Aero + β ) z = r
where x and y mean the normalized coordinates; x and y mean the 3D coordinates; x Aero means the aerodynamic center of the airfoil to the coordinate origin; c and β mean the chord and twist. Based on the aforesaid method, the 3D geometric model of composite wind turbine blade can be established using the Siemens NX 10.0 software, see Figure 1a,b.
The flow domain for the CFD simulation of a composite wind turbine blade was defined as: ① The effects of tower and nacelle were not considered in this work; ② One-third model was chosen for the CFD simulation to reduce the computation time. Figure 1c exhibits the dimensions and boundary conditions of the CFD model, where the model consists of a rotation domain and a stationary domain. The data can be passed though the interface. The radiuses of the rotation and stationary domains were 70 m and 300 m, respectively. The inlet was 200 m from the hub center and the outlet was 500 m from the hub center.
The fluent mesh model for the CFD simulation of the composite wind turbine blade was obtained as follows: The aforesaid domains were meshed using unstructured tetrahedral element type based on the ANSYS Meshing tool. Note: although some scholars [34,35] meshed blades using the structured mesh, the unstructured mesh for blade and fluid is available by calculating Y+ values at different speeds and comparing the results of the output torque and power curves, which can obtain reasonable simulation results, see Figure 2. The mesh sizes for the rotation and stationary domains were 3 m and 1 m, respectively. Furthermore, the meshes in the symmetry surfaces, named Side_wai1 and Side_nei1, Side_nei1 and Side_nei2, were completely controlled by the periodic mesh matching using the periodic boundary constraint command to ensure that the periodic surface nodes correspond to each other, see Figure 1e,f. In order to better simulate the flow near the wall surface of the blade, the meshes around the blade surfaces were refined and fifteen expansion layers with a growth rate of 1.9 were set. The height of the first layer was 1 × 10⁻⁵ m, see Figure 1g.

2.2.2. Mesh Quality and Independence Verifications

The mesh quality of the constructed CFD model was checked by using the y + value [36], which can be calculated as:
y + = u * y / ν
where u * is the friction speed; y is the nearest wall; ν is the kinematic viscosity of fluid. If the y + is less than 1, the mesh quality is reasonable. The y + values were calculated under the wind speeds of 7 m/s, 11.4 m/s, 15 m/s, 20 m/s and 25 m/s, respectively, see Figure S1, SI. All the values were less than 1, indicating that the constructed CFD meshing models under different wind speeds were reasonable. Apart from the validation of mesh quality, the mesh independence was also carried out to find out an appropriate mesh size in this work. The case under the wind speed of 11.4 m/s was chosen, where the wind turbine speed is 12.1 RPM and the pitch angle is 0°. Four mesh sizes of 0.3 m, 0.2 m, 0.1 m and 0.07 m were adopted to mesh the blade surface, and the interface surface and outer surface meshes were set as 3 m and 6 m, respectively. After meshing, the amount of elements corresponding to the aforementioned mesh sizes were 3.63 million, 4.17 million, 578 million and 808 million, respectively. Table S2 (SI) shows the relationship between mesh number and calculated wind turbine torque. In view of the computation time and accuracy, the mesh size of 0.1 m was taken for the blade surface in the subsequent study of this work.

2.2.3. Calculation Method for the CFD Simulation

Considering that the subsequent topology optimization of wind turbine blade is a static solution question, the moving reference frame (MRF) method was adopted in this work. Specifically, the rotation speed of the wind turbine is attached to the rotation domain, and the flow fluxes originated from the stationary domain can be translated by the interface. Compared to the non-constant slip grid method, the MRF method is a constant calculation method, which is simpler, faster with less computation time to produce acceptable results in a short time. The method has been used in CFD simulations of static wind turbine blade [37,38].

2.3. Finite Element Model of Reference Composite Wind Turbine Blade

2.3.1. Mechanical Properties of Composite Materials of Wind Turbine Blades

Glass fiber reinforced resin unidirectional composites were used as the skin material of blade in this work. The mechanical properties and corresponding allowable values of composites can be found in Table 1.

2.3.2. Finite Element Model of Wind Turbine Blade

As the wind turbine blade has a complex geometric configuration, the ANSYS Meshing was used to generate tetrahedral elements for the internal room of the blade in this work. Furthermore, to weaken the influence of mesh dependence on the blade, the mesh size was chosen as 0.07 m. Finally, the total number of elements and nodes were 4.85 million and 6.69 million. The corresponding model can be found in Figure S2, SI.

2.4. Design and Validation Cases of Wind Turbine Blade

Three load cases are considered in this work, viz.:
(1)
DLC-1 (Worst working case)
According to the IEC 61400-1 standard [39], the reference wind turbine is in the 1A IWC wind class, which means it can only withstand wind gusts up to 21% of its rated speed. Therefore, the first load case is when the wind turbine is operating under rated case in severe gusts, in which the gusts suddenly occur so that the blades do not have enough time to change pitch. As it is of great importance for the safety of turbine, this case is also used as the design condition for topology optimization in this work. The related parameters are given in Table 2.
(2)
DLC-2 (Cut-out wind speed working case)
This case is the cut-out wind speed condition. This is the highest wind speed that the wind turbine can reach before opening the propeller to the downwind position and shutting it down. In this case, blade tip deflection is relatively small. The tip deflection acceleration is even less than that in DLC-1, and therefore the inertial load can be ignored in this case. In this work, this case was used as a verification design case, and the related parameters are listed in Table 2.
(3)
DLC-3 (Shutdown working case)
This case is the parking brake condition, at which the blade is in the downwind position and the incoming wind is typhoon speed (37.5 m/s). Here, the downwind position is the pitch angle of the blade that is not affected by any torque. In this work, this case was also adopted as a verification design case, and the relevant parameters are shown in Table 2.

3. Results

3.1. CFD Simulation of Wind Turbine Blade

In this work, two turbulence models, viz. k- ω SST and k- ε , were adopted to elaborate the rationality of CFD simulation. Furthermore, the rationality analyses in terms of output torque and power were compared with the results obtained from the FAST software. Figure 2a illustrates the output torque curves based on the k- ω SST and k- ε models and FAST as the increase in wind speed, and the corresponding data are also listed in Table 3. It can be seen from Figure 2a and Table 3 that the predicted torque values of turbine blade based on the k- ω SST and k- ε turbulence models under the different wind speeds were close to the values based on the FAST. The k- ω SST model had a higher prediction accuracy in comparison with the k- ε model. Compared to the values obtained from the FAST, the errors of output torque based on the k- ω SST model in the wind speed range of 7–25 m/s were less than 7%. The predicted values for the k- ε turbulence model at high wind speeds were relatively low, and the related errors in the wind speed range of 15–25 m/s were within 7–12%.
Apart from the output torque performance, the output power performance of the turbine blade based on the k- ω SST and k- ε models and FAST was also evaluated. The output power can be calculated as the following formula:
P = M ω
where M is the torque of blade; ω is rotation speed. Figure 2b and Table 4 show the output power values of the turbine blade based on the k- ω SST and k- ε models and FAST, respectively. It can be noted that both the models simulated the output power performance relatively well, and the maximum errors were basically within 10%. However, the error based on the k- ε model at the wind speed of 25 m/s was 11.16%, probably resulting in a relatively dangerous result. Consequently, the k- ω SST turbulence model was adopted in this work.

3.2. Structural Responses of Wind Pressure on the Surface of Wind Turbine Blade

According to the design case shown in Table 2 where the pitch angle of the wind turbine blade was adjusted to 0° and the meshing strategy discussed in Section 2.2.2, the structural responses of wind pressure on the surface of blade were obtained based on the k- ω SST turbulence model (Section 3.1). Figure 3 illustrates the pressure surface and suction surface contours of turbine blade under the aerodynamic external load. From Figure 2, the pressure was mainly concentrated in the blade root and trailing edge, while the suction force in the middle of the blade was mainly focused on the blade edge. The maximum pressure and suction force were 2723 and 5729 Pa, respectively.

3.3. Topology Optimization Results of Internal Configuration of Wind Turbine Blade

Figure 4 exhibits the topology optimization results of the wind turbine blade. The outer shell of the blade was completely retained (Figure 4a), and in the internal configuration appeared obvious strip-shaped “gap” and “hole” regions along the axial direction of the blade (Figure 4b), which indicated several webs should be set in these regions. Furthermore, from the left and right enlarged views, some vertical webs should be retained in order to improve the bending resistance. Figure 4c shows the specific internal views cut from 12 various locations from the root to the tip of blade. More obviously, some web-like structures were retained though the topology optimization design.
Based on the aforesaid analysis, the preliminary design of the webs inside the blade in accordance with the topology optimization (Figure 4b,c) was subsequently carried out, see Figure 5. Taking into account seven cross-sections at different locations along the axis direction, the internal web structure of the blade from the root to tip generally changes from the single-web mode to twin-web mode and then to the single-web mode (Figure 5a,b), respectively. However, there are some discontinuous regions among the transition regions of webs, see Figure 5a. Consequently, we proposed to connect the discontinuous region “①” by using a twin-web structure and also arranging the twin-web structure in the region “②”, but other regions were filled by the single-web structure. Four webs were reversely designed and the specific sizes of the web cross-sections were determined by the seven cross-sections shown in Figure 5b, in which the corresponding locations along the blade were at 6.70, 17.13, 28.18, 50.28, 56.69, 70.30 and 74.71%, respectively. Ultimately, according to the dimensions of the different cross-sections shown in Figure 5b, the first generation turbine blade inspired by topology optimization was constructed by Boolean operation between the designed web structures and blade boundary, see Figure 5c. The corresponding finite element model of the blade is exhibited in Figure 5c.

3.4. Validation of Performance Indexes for the First Generation Wind Turbine Blade

The designed first generation wind turbine blade was firstly validified in the DLC-1 case (Table 2) to ensure the feasibility of the reverse design structure. If it was a feasible solution, the design was further validified in the DLC-2 and DLC-3 cases. Otherwise, the aforesaid design strategy was repeated until all the work cases were satisfied.
Figure 6 and Table 5 show the simulation results of the first generation wind turbine blade in the DLC-1 case. From Figure 6a and Table 5, the stress levels in the X direction were the largest, resulting from the waving force (i.e., wind speed incoming flow direction). The maximum tensile and compressive stresses were 45.56 and 49.72 MPa, which are less than the corresponding allowable stress of GFRP. The maximum tensile and compressive stresses in the Y direction were 27.49 and 16.76 MPa, and the values in the Z direction were 17.66 and 12.72 MPa, respectively. The aforementioned stress values were within the allowable stress ranges. Moreover, the maximum displacement of the blade tip was 4.38 m, which was also less than 9 m. Thus, the overall stress and displacement indexes met the design requirements. Figure 6b illustrates the stress contours of the web of the first generation blade. The stresses in the X, Y and Z directions were less than the overall stresses, indicating that the reverse designed web structure satisfied the stress requirements. Figure 6c exhibits the local stress contours of the web in the X, Y and Z directions. It can be seen that the high stress levels were concentrated at the web notch location, which was due to the discontinuity of the designed web. Likewise, all the local stresses were within the requirements of stress. Based on the above-mentioned results, the preliminary design of the first generation turbine blade driven by the topology optimization was reasonable, but the blade is prone to fatigue damage in the long-term service. Thus, the fatigue life should be also considered as an important evaluation index of safety. Figure 6d and Table 5 demonstrate the fatigue life results in the X, Y and Z directions. The minimum fatigue lives in the X and Y directions were 1.27 × 10⁹ and 6.45 × 10⁸, both of which meet the fatigue life requirements. However, from Figure 6d, the fatigue life levels at the discontinuous location of the web were considerably lower. The minimum fatigue life in the Z direction was 8.97 × 10⁷, which does not meet the requirement. Therefore, the first generation blade structure at the local position should be further modified. In this work, we directly connected the middle discontinuous region using a web structure and the second generation wind turbine blade was generated, see Figure 6e.
Figure 7 shows the simulation results of the second generation wind turbine blade in the DLC-1, 2 and 3 cases. Table 6 compared results of performance indexes between the first and second generation wind turbine blades in the DLC-1 case. Compared with the performance indexes of the first generation blade in the DLC-1 case, the overall maximum tensile stress of the blade in the X direction was slightly changed, but the maximum compressive stress in the Y direction was reduced by 18.79%. It is worth noting that the maximum localized tensile and compressive stresses of the web in the Z direction were remarkably decreased by 97.05 and 95.17%, respectively. Furthermore, the maximum displacement of the blade tip was 4.03 m, which was also reduced by 7.99%. All the stress and displacement indexes met the design requirements. Importantly, after connecting the discontinuous region by the additional web, the minimal fatigue life of the web was 2.25 × 10⁸, significantly improved by 150.84%, which achieved the requirement of fatigue life.
In addition, the overall stress contours of the second blade in the X, Y and Z directions were similar to those of the first blade (Figure 7a,b). The stress levels in the X direction were higher than those in the Y and Z directions. From Figure 7c, the stress levels at the local region in three directions were relatively uniform, indicating that the stress concentration had been accommodated by adding additional web structure in this region. Furthermore, the maximum tensile stresses were still less than the allowable ones. In summary, the design strategy for the internal structure of the second generation wind turbine blade is a feasible solution. In the following discussion, the performance indexes of the blade are further evaluated in the DLC-2 and DLC-3 cases.
Figure 7 and Table 7 exhibit the validation results of the second blade in the X, Y and Z directions in the DLC-2 case. The overall stress distribution contours of the blade in the X, Y and Z directions were totally consistent with those of the first blade, and the maximum tensile and compressive stresses meet the stress requirements. The maximum displacement was only 1.18 m, which also meets the design allowable value. Compared to the performance indexes of the first blade, the stress and deformation responses of the second blade were relatively lower. It should be noted that the wind turbine obtained an additional torque in this case, and the outer part of the blade had a negative angle of attack which to some extent counteracted the internal lift. Although the turbine operated at a higher wind speed, the aerodynamic load acting at the blade tip was weaker than that in the DLC-1 case. Additionally, the minimal fatigue life also achieved the design requirement. Consequently, all the performance indexes of the second turbine blade met the design requirements, confirming that it was also a feasible solution in the DLC-2 case. In addition, Figure 7 and Table 7 also show the validation results of the second blade in the X, Y and Z directions in the DLC-3 case. In this case, the wind turbine was suffering from typhoon conditions, and the blade was in the down pitch stop state. The maximum displacement of blade tip was 2.28 m and the minimum fatigue life was 3.90 × 10⁸, both of which met the design requirements. Furthermore, it can be seen from the stress contours that the middle stress levels in the X direction were slightly higher, giving an indication of stress concentration in the region. However, those in the Y and Z directions were relatively uniform. All the stress indexes were within the requirements. Therefore, the second turbine blade was also a feasible design in the DLC-3 case.
In summary, a novel turbine blade with the optimal web structure guided by the topology optimization was accomplished.

4. Discussion

4.1. Comparison of Performance Indexes between the Novel and Reference Turbine Blades

Table 8 lists the compared results of the performance indexes between the novel and reference turbine blades. Overall, the stress levels of the novel blade were lower than those of the reference blade. Note: a positive value in Table 8 represents the increase in performance index. The displacement values of the novel blade in various load cases were larger than those of the reference blade, indicating that a more flexible blade was obtained in this work. Importantly, the weight of the novel blade was reduced by 9.88% relative to the reference blade, which is a significant benefit in decreasing the cost of turbine blades. Therefore, the novel wind turbine blade driven by topology optimization in this work has predictably better power efficiency than the reference blade without the loss of load-bearing capacity.

4.2. Modal Analysis of the Novel Wind Turbine Blade

As the decrease of blade weight, the vibration problem of the novel wind turbine blade should be discussed to further identify the dynamic properties. In this work, the modal analysis was also carried out based on the novel blade, see Figure 8 and Table 9. It can be seen from Figure 8, the first six orders of the novel turbine blade include: first order waving vibration, second order pendulum vibration, third order waving vibration, fourth order waving vibration, fifth order waving vibration and sixth waving pendulum, which are similar to those of the reference blade. The vibration types of the blade are mainly dominated by waving and pendulum vibrations. Moreover, from Table 9, it can be seen that the first six order frequencies were well in agreement with those of the reference blade, indicating that the designed internal layout is reasonable.

4.3. Full Life Cycle Assessment of the Novel Wind Turbine Blade

The service life of a wind turbine is generally more than 20 years. During long-term service, wind turbine blades are always subjected to complex aerodynamic loads induced by wind, with the result that it is very susceptible to fatigue damage and failure. Hence, to ensure the long-term service safety, a full life-cycle assessment of the novel wind turbine blade should be discussed in this work. According to the wind speed data of a full year in Guangdong Province, the wind speed range from 5–25 m/s was considered in this work, see Table 10. The statistical duration of wind speed in an hour can be obtained through the Weibull distribution, see Table S3, SI. Based on the finite element analysis given in Section 3, the stress responses of the novel blade were obtained, see Table 10. Considering the S-N curve of GFRP used as the shell composite material (Table S4, SI), the fatigue lives of turbine blades corresponding to the wind speed were calculated though the Goodman curve, see Table 10. Afterwards, the fatigue damage with respect to each wind speed was obtained via the ratio of stress range in the Weibull distribution and the related fatigue life (Table 10). Finally, the full life of the novel blade over 20 years was evaluated based on the linear P-M accumulative damage theory, viz:
Y = N N × ω × 60 = 1 / ( γ i / N i ) N × ω × 60 = 1 / ( 0.197 1.70 × 10 8 + 0.15 1.60 × 10 8 + 0.101 1.05 × 10 8 + 0.061 1.08 × 10 8 ) 7250 × 12.1 × 60 = 21.9 Year
where Y is the full life; ω is the rated speed of turbine blade, taken as 12.1 RPM (Table 2); N is the sum of duration of wind speed in hours; γ i is the stress range Weibull distribution; N i is the fatigue life corresponding to wind speed. Consequently, the full life over the 20 years is 21.9 years, which meets the design requirement of 20 years.

5. Conclusions

This work develops an innovative multi-web internal layout for the offshore wind turbine blade in accordance with the variable density topology optimization method, which theoretically answers the proposed scientific issues about how many webs need to be used inside the blade and where the related webs should be laid out. The following conclusions can be summarized as follows:
1.
The surface pressure was obtained based on the CFD simulation, and the two turbulence models, viz. k- ω SST and k- ε , were adopted. By comparing the output torques and power, the k- ω SST model was chosen to calculate the surface pressure distribution. Moreover, the simulation results obtained from the CFD were also validated in comparison with those calculated from the FAST.
2.
The topology optimization model was established based on the full-scale internal structure of offshore wind turbine blade, considering stress, displacement and fatigue life constraints.
3.
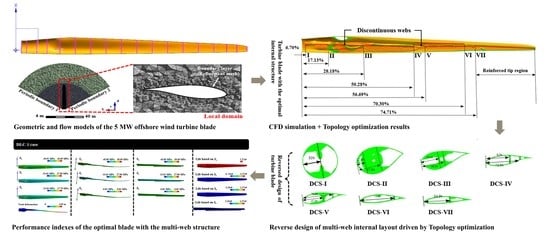
After the full-scale topology optimization, two multi-web layouts were theoretically obtained driven by the optimal topological configuration for the first time. By validation, the second generation optimal blade completely met all the requirements and the weight was reduced by 9.88% relative to the reference blade, which was a significant benefit in decreasing the cost of turbine blades.
4.
Vibration modal and full life cycle of the novel blade were also evaluated. The first six vibration types of the novel blade were consistent with those of the reference blade, further indicating that the designed internal layout was reasonable. Moreover, the full life cycle of the novel blade is 21.9 years, theoretically verifying that the novel blade is able to service more than 20 years in the given sea domain.

Supplementary Materials

The following supporting information can be downloaded at: https://0-www-mdpi-com.brum.beds.ac.uk/article/10.3390/jmse10101487/s1, Figure S1: y + values for evaluating the mesh quality under the different wind speeds; Figure S2: Illustration of the relationship between the amount of element and torque; Table S1: Distributed blade aerodynamic properties in NREL 5 MW wind turbine blade; Table S2: Mesh independence analysis; Table S3: Statistic duration of wind speed in hour; Table S4: S-N data of GFRP.

Author Contributions

J.S.: writing—original draft, reviewing, project administration and supervision; J.C.: writing—original draft, reviewing and validation; Y.W.: review, editing and validation; L.L.: conceptualization and supervision. All authors have read and agreed to the published version of the manuscript.

Funding

The support for this research has been provided by the National Natural Science Foundation of China (Grant No. 51905350), the Shenzhen Science and Technology Program (Grant No. KQTD20200820113004005), Shenzhen Key Laboratory of Structure Safety and Health Monitoring of Marine Infrastructures (Grant No. ZDSYS20201020162400001) and the National Natural Science Foundation of Guangdong Province (Grant No. 2022A1515011499) are gratefully acknowledged.

Institutional Review Board Statement

Not applicable.

Informed Consent Statement

Not applicable.

Data Availability Statement

Not applicable.

Conflicts of Interest

The authors declare that they have no known competing financial interests or personal relationships that could have appeared to influence the work reported in this paper.

References

  1. Oh, K.Y.; Nam, W.; Ryu, M.S.; Kim, J.Y.; Epureanu, B.I. A review of foundations of offshore wind energy convertors: Current status and future perspectives. Renew. Sustain. Energy Rev. 2018, 88, 16–36. [Google Scholar] [CrossRef]
  2. Liu, P.; Meng, F.R.; Barlow, C.Y. Wind turbine blade end-of-life options: An economic comparison. J. Clean. Prod. 2022, 180, 106202. [Google Scholar] [CrossRef]
  3. Mishnaevsky, L.; Johansen, N.F.; Fraisse, A.; Faster, S.; Jensen, T.; Bendixen, B. Technologies of Wind Turbine Blade Repair: Practical Comparison. Energies 2022, 15, 1767. [Google Scholar] [CrossRef]
  4. Dyrholm, M. GWEC|Global Wind Report; Global Wind Energy Council: Brussels, Belgium, 2021. [Google Scholar]
  5. Chou, J.S.; Chiu, C.K.; Huang, I.K.; Chi, K.N. Failure analysis of wind turbine blade under critical wind loads. Eng. Fail. Anal. 2013, 27, 99–118. [Google Scholar] [CrossRef]
  6. Liu, Y.; Hajj, M.; Bao, Y. Review of robot-based damage assessment for offshore wind turbines. Renew. Sustain. Energy Rev. 2022, 158, 112187. [Google Scholar] [CrossRef]
  7. Rafiee, R.; Hashemi, M.R. Failure analysis of a composite wind turbine blade at the adhesive joint of the trailing edge. Eng. Fail. Anal. 2021, 121, 105148. [Google Scholar] [CrossRef]
  8. Roh, C.; Ha, Y.J.; Ahn, H.J.; Kim, K.H. A Comparative Analysis of the Characteristics of Platform Motion of a Floating Offshore Wind Turbine Based on Pitch Controllers. Energies 2022, 15, 716. [Google Scholar] [CrossRef]
  9. Guo, Y.; Wang, H.; Lian, J. Review of integrated installation technologies for offshore wind turbines: Current progress and future development trends. Energy Convers. Manag. 2022, 255, 115319. [Google Scholar] [CrossRef]
  10. Asim, T.; Islam, S.Z.; Hemmati, A.; Khalid, M.S. A Review of Recent Advancements in Offshore Wind Turbine Technology. Energies 2022, 15, 579. [Google Scholar] [CrossRef]
  11. Ibrahimbegovic, A. Flexible Blades Wind-Turbines: Giant Installations and System-of-Systems Approach to Optimizing Wind-Energy Farms. In CIGOS 2021, Emerging Technologies and Applications for Green Infrastructur; Springer: Berlin/Heidelberg, Germany, 2022; pp. 3–27. [Google Scholar]
  12. Zhu, J.; Cai, X.; Ma, D.; Zhang, J.; Ni, X. Improved structural design of wind turbine blade based on topology and size optimization. Int. J. Low-Carbon Technol. 2022, 17, 69–79. [Google Scholar] [CrossRef]
  13. Chen, J.; Kim, M.H. Review of Recent Offshore Wind Turbine Research and Optimization Methodologies in Their Design. J. Mar. Sci. Eng. 2021, 10, 28. [Google Scholar] [CrossRef]
  14. Naung, S.W.; Erfanian Nakhchi Toosi, M.; Rahmati, M. An Experimental and Numerical Study on the Aerodynamic Performance of Vibrating Wind Turbine Blade with Frequency-Domain Method. J. Appl. Comput. Mech. 2021, 7, 1737–1750. [Google Scholar]
  15. Naung, S.W.; Nakhchi, M.E.; Rahmati, M. High-fidelity CFD simulations of two wind turbines in arrays using nonlinear frequency domain solution method. Renew. Energy 2021, 174, 984–1005. [Google Scholar] [CrossRef]
  16. Nakhchi, M.E.; Naung, S.W.; Rahmati, M. High-resolution direct numerical simulations of flow structure and aerodynamic performance of wind turbine airfoil at wide range of Reynolds numbers. Energy 2021, 225, 120261. [Google Scholar] [CrossRef]
  17. Mamouri, A.R.; Khoshnevis, A.B.; Lakzian, E. Entropy generation analysis of S825, S822, and SD7062 offshore wind turbine airfoil geometries. Ocean Eng. 2019, 173, 700–715. [Google Scholar] [CrossRef]
  18. Mamouri, A.R.; Khoshnevis, A.B.; Lakzian, E. Experimental study of the effective parameters on the offshore wind turbine’s airfoil in pitching case. Ocean Eng. 2020, 198, 106955. [Google Scholar] [CrossRef]
  19. Chen, J.; Wang, Q.; Shen, W.Z.; Pang, X.; Li, S.; Guo, X. Design, Structural optimization study of composite wind turbine blade. Mater. Des. 2013, 46, 247–255. [Google Scholar] [CrossRef]
  20. Ghiasi, H.; Fayazbakhsh, K.; Pasini, D.; Lessard, L. Optimum stacking sequence design of composite materials Part II: Variable stiffness design. Compos. Struct. 2010, 93, 1–13. [Google Scholar] [CrossRef] [Green Version]
  21. Zhang, Z.Y. Structural Design of Large Horizontal Axis Wind Turbine Blade Based on Fluid-Structural Interation. Ph.D. Thesis, Lanzhou University of Technology, Lanzhou, China, 2014. [Google Scholar]
  22. Liao, C.C.; Zhao, X.L.; Xu, J.Z. Blade layers optimization of wind turbines using FAST and improved PSO Algorithm. Renew. Energy 2012, 42, 227–233. [Google Scholar] [CrossRef]
  23. Song, J.; Zhang, Y.K.; Guo, X.; Hao, H.; Wen, W.D.; Cui, H.T. Topology and shape optimization of twin-web turbine disk. Struct. Multidiscip. Optim. 2022, 65, 1–20. [Google Scholar] [CrossRef]
  24. Rossow, M.P.; Taylor, J.E. A finite element method for the optimal design of variable thickness sheets. AIAA J. 1973, 11, 1566–1569. [Google Scholar] [CrossRef]
  25. Bendsøe, M.P.; Kikuchi, N. Generating optimal topologies in structural design using a homogenization method. Comput. Methods Appl. Mech. Eng. 1988, 71, 197–224. [Google Scholar] [CrossRef]
  26. Mlejnek, H.P.; Schirmacher, R. An engineer’s approach to optimal material distribution and shape finding. Comput. Methods Appl. Mech. Eng. 1993, 106, 1–26. [Google Scholar] [CrossRef]
  27. Joncas, S. Thermoplastic Composite Wind Turbine Blades: An Integrated Design Approach. Ph.D. Thesis, Delft University of Technology, Delft, The Netherlands, 2010. [Google Scholar]
  28. Buckney, N.; Pirrera, A.; Green, S.D.; Weaver, P.M. Structural efficiency of a wind turbine blade. Thin-Walled Struct. 2013, 67, 144–154. [Google Scholar] [CrossRef] [Green Version]
  29. Yu, X. Optimal Design of Vertical Axis Wind Turbine Blade Structure with Honeycomb Core Layer Inside the Main Beam. Ph.D. Thesis, Tianjin University of Technology, Tianjin, China, 2021. [Google Scholar]
  30. Zhang, Y.Y.; Zheng, Y.J.; Chen, Y.Y.; Sun, M.M.; Tang, J.M. Structural topology optimization design of wind turbine blade. Shanxi Archit. 2017, 43, 203–204. [Google Scholar]
  31. Aage, N.; Andreassen, E.; Lazarov, B.S.; Sigmund, O. Giga-voxel computational morphogenesis for structural design. Nature 2017, 550, 84–86. [Google Scholar] [CrossRef] [Green Version]
  32. Zuo, W.; Saitou, K. Multi-material topology optimization using ordered SIMP interpolation. Struct. Multidiscip. Optim. 2017, 55, 477–491. [Google Scholar] [CrossRef]
  33. Jonkman, J.; Butterfield, S.; Musial, W.; Scott, G. Definition of a 5-MW Reference Wind Turbine for Offshore System Development; National Renewable Energy Lab: Golden, CO, USA, 2009.
  34. Mamouri, A.R.; Lakzian, E.; Khoshnevis, A.B. Entropy analysis of pitching airfoil for offshore wind turbines in the dynamic stall condition. Ocean Eng. 2019, 187, 106229. [Google Scholar] [CrossRef]
  35. Mahrooghi, A.; Lakzian, E. Optimization of Wells turbine performance using a hybrid artificial neural fuzzy inference system (ANFIS)—Genetic algorithm (GA). Ocean Eng. 2021, 226, 108861. [Google Scholar] [CrossRef]
  36. Davidson, A.A.; Salim, S.M. CFD Modelling of Rotating Annular Flow Using Wall y+, International MultiConference of Engineers and Computer Scientists. Trans. Eng. Technol. 2018, 1, 318–330. [Google Scholar]
  37. Manatbayev, R.; Baizhuma, Z.; Bolegenova, S. Numerical simulations on static Vertical Axis Wind Turbine blade icing. Renew. Energy 2021, 170, 997–1007. [Google Scholar] [CrossRef]
  38. Son, C.; Kim, T. Development of an icing simulation code for rotating wind turbines. J. Wind Eng. Ind. Aerodyn. 2020, 203, 104239. [Google Scholar] [CrossRef]
  39. Madsen, P.H.; Risø, D.J.R.N.L. Introduction to the IEC 61400-1 Standar; Technical Standard; Risø National Laboratory, Technical University of Denmark: Kongens Lyngby, Denmark, 2008. [Google Scholar]
Figure 1. Establishment of 5 MW wind turbine blade. (a) Normalized section data of airfoils. (b) Wind turbine blade. (c) Geometric overall domain. (d) Geometric rotation and blade domains. (e,f) Stereogram and side view of fluent mesh models. (g) Local fluent mesh view of blade.
Jmse 10 01487 g001
Figure 2. Output responses of composite wind turbine blade based on the k- ω SST and k- models and FAST. (a) Output torque response. (b) Output power response. Note: the simulation model is one third of wind turbine.
Jmse 10 01487 g002
Figure 3. (a) Pressure surface contour. (b) Suction surface contour.
Jmse 10 01487 g003
Figure 4. Topology optimization results of the wind turbine blade. (a) External shell structure. Inset: the enlarged left and right views. (b) Retained materials in the internal blade. (c) Cross-section views at different axis locations.
Jmse 10 01487 g004
Figure 5. Reverse design of the wind turbine blade. (a) Turbine blade with the optimal internal structure. (b) Reverse design of turbine blade inspired by the topology optimization. (c) First generation turbine blade.
Jmse 10 01487 g005
Figure 6. Validation of performance indexes for the first generation wind turbine blade in the DLC-1 case. (a) Stress and deformation contours of overall turbine blade. (b) Stress contours of internal structure. (c) Stress contours of localized regions of internal structure. (d) Fatigue life contours of whole turbine blade (e) The second generation design of the wind turbine blade.
Jmse 10 01487 g006
Figure 7. Validation of performance indexes for the second generation wind turbine blade in the DLC-1, DLC-2 and DLC-3 cases. (a,e,i) Stress and deformation contours of whole turbine blade. (b,f,j) Stress contours of internal structure. (c,g,k) Stress contours of localized regions of internal structure. (d,h,l) Fatigue life contours of whole turbine blade.
Jmse 10 01487 g007
Figure 8. Vibration types of the novel and reference turbine blades.
Jmse 10 01487 g008
Table 1. Mechanical properties and allowable values.
Mechanical Properties of CompositesAllowable Values of Composites
ItemsValuesItemsValuesItemsValuesItemsValues
Ex4.5 × 104 MPaµxz0.3TSx1.1 × 103 MPaCSz−120 MPa
Ey1.0 × 104 MPaGxy5.0 × 103 MPaTSy35 MPaGSxy80 MPa
Ez1.0 × 104 MPaGyz3.8 × 103 MPaTSz35 MPaGSyz46 MPa
µxy0.3Gxz5.0 × 103 MPaCSx−680 MPaGSxz80 MPa
µyz0.4ρ2000 kg·m3CSy−120 MPa--
Note: “TS”, “CS” and “GS” indicate the tension, compression and shear strength.
Table 2. Operation parameters in different load cases.
Load CaseRotation Speed (RPM)Pitch Angle (°)Wind Speed (m/s)
DLC-1 (Design)12.1013.8
DLC-212.123.325
DLC-3089.337.5
Note: In DLC-1 case, wind speed = Rated wind speed + maximum allowable gust (11.4 + 21% × 11.4); in DLC-2 case, wind speed = cut-out wind speed; in DLC-3 case, wind speed = speed of typhoon.
Table 3. Output torques based on the k- ω SST and k- ε models and FAST.
Wind Speed (m/s)Pitch Angle (°)Wind Turbine Torque
FASTk- ω SST Errork- ε Error
70472.70479.051.34%473.610.19%
1001017.03976.364.00%976.364.00%
1101293.771238.204.30%1333.513.07%
1510.451393.371309.796.00%1289.057.49%
2017.471393.371302.966.49%1244.3210.70%
2523.571393.371300.846.64%1237.8611.16%
Table 4. Output power based on the k- ω SST and k- ε models and FAST.
Wind Speed (m/s)Pitch Angle (°)Wind Turbine Power
FASTk- ω SST Errork- ε Error
70419.20424.861.35%420.030.2%
1001217.671168.754.02%1168.754.02%
1101611.071541.704.31%1660.393.06%
1510.451765.531659.656.00%1633.377.49%
2017.471765.571651.006.49%1576.6910.70%
2523.571765.571648.306.64%1568.5011.16%
Table 5. Simulation results of the first generation wind turbine blade in the DLC-1 case.
DirectionOverall Stress of BladeLocalized Stress of WebMin. Fatigue LifeDisp. of Tip
Max. TSMax. CSMax. TSMax. CS
X45.56 MPa49.72 MPa39.16 MPa45.51 MPa1.27×1094.38 m
Y27.49 MPa16.76 MPa27.49 MPa16.76 MPa6.45×108
Z17.66 MPa12.72 MPa27.49 MPa16.76 MPa8.97×107
Table 6. Compared results of performance indexes between the first and second generation wind turbine blades in the DLC-1 case.
ItemOverall Stress of BladeLocalized Stress of Web Min. Fatigue LifeDisp. of Tip
Max. TSMax. CSMax. TSMax. CS
First X45.56 MPa49.72 MPa39.16 MPa45.51 MPa1.27×1094.38 m (first); 4.03 m (second); Δ = −7.99%
Second X45.77 MPa49.91 MPa36.69 MPa45.85 MPa1.27×109
Δ X+0.46%+0.38%−6.31%+0.75%0%
First Y27.49 MPa16.76 MPa27.49 MPa16.76 MPa6.45×108
Second Y27.86 MPa13.61 MPa27.86 MPa13.61 MPa6.24×108
Δ Y+1.35%−18.79%+1.35%−18.79%−3.26%
First Z17.66 MPa12.72 MPa27.49 MPa16.76 MPa8.97×107
Second Z17.70 MPa12.84 MPa0.81 MPa0.81 MPa2.25×108
Δ Z+0.23%+0.94%−97.05%−95.17%+150.84%
Table 7. Simulation results of the second generation wind turbine blade in the DLC-1, 2 and 3 cases. Unit in stress: MPa, in displacement of tip: m.
CaseDirectionOverall Stress of BladeLocalized Stress of Web Min. Fatigue LifeDisp. of Tip
Max. TSMax. CSMax. TSMax. CS
DLC-1X45.7749.9136.6945.851.27e94.03
Y27.8613.6127.8613.616.24e8
Z17.7012.840.810.812.25e8
DLC-2X24.8328.5324.1627.981.27e91.18
Y15.098.3715.098.361.27e9
Z9.707.060.500.515.98e8
DLC-2X32.8232.9024.1627.981.27e92.28
Y8.5317.7115.098.361.27e9
Z7.7110.370.500.513.90e8
Note: “Disp” means displacement. “TS” and “CS” mean tensile stress, compressive stress.
Table 8. Compared results of performance indexes between the novel and reference turbine blades. Unit in stress: MPa, in displacement of tip: m, in overall weight: kg.
CaseDir.ItemOverall Blade StressLocalized Web StressDisp. of TipOverall Weight
Max. TSMax. CSMax. TSMax. CS
DLC-1XRef. blade32.7030.6014.3016.003.42 (Ref.)
4.03 (New)
Δ:
17.84%
21,247
(Ref.);
19,148
(New)
Δ:
−9.88%
Nov. blade45.76949.9136.6945.85
Δ 39.97%63.10%156.57%186.56%
YRef. blade13.1019.5013.1019.50
Nov. blade27.8613.6127.8613.61
Δ 112.67%−30.21%112.67%−30.21%
ZRef. blade19.3013.600.150.18
Nov. blade17.7012.840.810.81
Δ −8.29%−5.59%440.00%350.00%
DLC-2XRef. blade18.9015.708.859.701.08
(Ref.)
1.18 (New)
Δ: 9.26%
Nov. blade24.8328.5324.1627.98
Δ 31.38%81.72%172.99%188.45%
YRef. blade7.1510.407.1510.40
Nov. blade15.098.3715.098.36
Δ 111.05%−19.52%111.05%−19.62%
ZRef. blade10.806.140.070.08
Nov. blade9.707.060.500.51
Δ −10.19%14.98%614.29%537.50%
DLC-3XRef. blade23.8025.506.085.611.94 (Ref.)
2.28
(New)
Δ: 17.53%
Nov. blade32.8232.9024.1627.98
Δ 37.90%29.02%297.37%398.75%
YRef. blade7.675.297.675.29
Nov. blade8.5317.7115.098.36
Δ 11.21%234.78%96.74%58.03%
ZRef. blade9.967.420.090.09
Nov. blade7.7110.370.500.51
Δ −22.59%39.76%455.56%466.67%
Note: “Dir.”, “Ref.” and “Nov.” mean “Direction”, “Reference” and “Novel”, respectively.
Table 9. Comparison of frequency between the novel and reference turbine blades.
OrderFrequency (Hz)OrderFrequency (Hz)
Ref. BladeNov. BladeRef. BladeNov. Blade
11.121.1645.215.22
21.681.6755.715.70
32.962.1668.707.63
Table 10. Wind speed distribution and fatigue damage in a year.
Wind Speed (m/s)Duration of Wind Speed (h)Max. Stress (MPa)Min. Stress (MPa)Stress Range Weibull DistributionFatigue Limitation (MPa)Fatigue LifeFatigue Damage
5152612.843.850.21040.4>2 × 1080
7161321.186.350.22240.4>2 × 1080
9142542.4312.730.19740.41.70 × 1081.16 × 10−9
11109042.6412.790.15040.41.60 × 1089.38 × 10−10
1373447.8614.360.10140.41.05 × 1089.62 × 10−10
1543942.5412.760.06140.41.08 × 1085.65 × 10−10
1723536.2410.870.03240.4>2 × 1080
1911333.8910.170.01640.4>2 × 1080
214923.877.160.00740.4>2 × 1080
231928.338.500.00340.4>2 × 1080
25733.39.990.00140.4>2 × 1080
Publisher’s Note: MDPI stays neutral with regard to jurisdictional claims in published maps and institutional affiliations.

