1. Introduction
With the structural complexity of offshore deep-water and ultra-deep-water platforms, the difficulty of structural safety assessment increases significantly [
1]. Flexible risers have been used in marine structures since 1970. In the process of deep-water oil and gas drilling, flexible risers connect the seabed and the platform structure, and transport the oil and gas resources extracted from the seabed. This structure plays a key role, and any damage will carry serious consequences [
2]. At present, most of the flexible risers are multilayer structures, and they are very complex [
3]. Interactions exists between each layer. This makes it difficult to study the fatigue strength of composite flexible risers. In the multilayer flexible composite riser, the structural load is mainly borne by the metal layer structure, including the tensile armor layer, compressive armor layer and so on, while other connection structures are polymeric materials and do not participate in load bearing [
4]. Therefore, these layers are generally not considered in the study of structural strength. In current research, the skeleton layer structure and the compressive/tensile layer structure are regarded as mutually orthogonal cylindrical structures. The structure simulation method is effective to obtain the circumferential pressure load, and the stress response process of the flexible riser under a circumferential load can be proposed [
5,
6].
Due to the existence of repeated loading in the deep-sea environment, the fatigue damage of the riser structure is also a focus of research. The fatigue damage analysis method of common riser structures has been studied so far. In the composite flexible riser, the spiral structure is the most prone to damage. Therefore, the research focus is usually on the helical structure. SKEIE [
7] focused on the stress and fatigue life of spiral components under the action of friction caused by stick and slip in the bending process, and he focused on the influence of friction stress on fatigue life. As for the effect of friction force, Sævik [
8] analyzed the nonlinear moment curvature relationship and sandwich beam theory; two theoretical models were proposed and verified via experiments. However, in the current research on riser fatigue damage, most of the research objects are the overall structures, and few are local structures. In his study, De Sousa [
9] proposed that, on the basis of calculating the overall stress response of the riser, the global response can be transferred to the local structures so as to calculate the stress of the local helix structure. In a further study, he considered the interlayer interaction of the flexible riser and proposed a theoretical calculation method for the overall fatigue life of the flexible riser. Kunpeng Wang et al. [
10] proposed a global analysis model of the flexible riser, conducted a global analysis of the structure, focused on the fatigue damage of the spiral steel wire near the touchdown point, and considered the interlayer friction.
However, in the process of fatigue life calculation, many variables are uncertain. This will affect the accuracy of the calculation. Therefore, these uncertainties also need to be taken into account in the research. In this paper, based on the analysis of multilayer flexible risers and the established model, the fatigue calculation method of marine structures is integrated into the existing system, the uncertainty in the fatigue analysis process is fully considered, and the solutions to various uncertain factors are given.
In this paper, the solution of load uncertainty is proposed through the spectral analysis method. The basic flow of spectrum fatigue analysis is introduced, the program of fatigue spectrum analysis is designed to calculate the fatigue damage according to the time history stress data, and the result is displayed in the form of a cloud diagram. Then, a nine-layer composite flexible pipe is taken as an example for calculation, and load-bearing structures are selected to analyze the distribution of fatigue damage. Then, considering uncertain factors, with the exception of load, a reliability analysis method is proposed. The results of fatigue spectrum analysis are combined with the analysis of other uncertain factors through reliability analysis, and the uncertain factors in fatigue research are taken into account in a more comprehensive and concrete manner. Finally, the future research directions of this work are proposed.
2. Fatigue Spectrum Analysis
Most previous fatigue studies adopted deterministic methods. In a given stress range, the cycle times of structural fracture were calculated via the S-N curve. However, we usually take approximate preliminary estimations by probabilistic method. There will be some uncertainty in the approximation algorithm. This uncertainty mainly arises from whether the S-N curve adopted is consistent with the material and welding form of the actual structure, and whether the cyclic load selected is consistent with the load form of the actual conditions [
11]. Due to the huge amount of time history load data, the calculation time will be greatly increased if the uncertainty of load is taken into account. In recent years, due to the rapid development of computing software, scholars have begun to take the accuracy of fatigue assessment into account [
12].
Fatigue spectrum analysis fully takes the randomness and uncertainty of loads into account [
13] and provides more reasonable statistics of the load cycle process on the structure by establishing a load response spectrum or stress response spectrum. This makes spectral analysis more reliable in the fatigue damage assessment of marine structures [
14]. Accordingly, spectral analysis also requires more detailed statistics of the load and fully considers its irregularity [
15].
This section introduces the whole process of fatigue spectrum analysis. Firstly, the appropriate wave load power spectrum is selected according to the environmental conditions of marine structures, and then the stress response spectrum is calculated according to the peak distribution of stress in an alternating process in a short-term sea state. Finally, the cumulative fatigue damage results are calculated through the Palmgren–Miner method.
2.1. Stress Response Spectrum
There are a large number of standardized spectra in marine structure design standards. The most common are the Pierson–Moskowitz spectrum (referred to as P-M spectrum) [
16] and JONSWAP spectrum [
17]. The power spectral density selected in this paper is the two-parameter P-M spectrum recommended by the International Ship Structure Conference (ISSC). The P-M spectrum can be written in the form of different parameters. If the two parameters of meaningful wave height
and mean span zero period
are used to express the wave spectrum, the expression is
In the analysis, the actual response frequency should be the encounter frequency
, which is related to the wave frequency
as follows.
where
θ is the wave direction angle (rad);
U is the sailing speed (Knot).
The energy of the corresponding wave frequency element is unchanged; the input wave energy spectrum should be transformed and expressed in the form of the encounter frequency and wave angle. The transformed expression is as follows
According to Equations (2) and (3), the wave energy spectrum expressed by the encounter frequency can be obtained as follows:
For the working condition with wave angle
θ, the response spectrum of stress can be obtained from Equation (4), which is expressed as
where
is the stress response transfer function.
2.2. Short-Term Distribution of Stress Range
The stress peak of the stress alternating process in the short-term sea state follows the Rayleigh distribution. The probability density function is
where
is peak stress;
is the zero-order moment of
, the power spectral density of the alternating stress process.
Then, the probability density function and distribution function of the corresponding stress range can be obtained, which can be expressed as
where
is the stress range.
When computing M, care should be taken to replace the frequency
with the encounter frequency
. When calculating the average cross-zero rate, the second moment of the response spectrum is also required, which can be expressed as
In order to obtain the number of stress cycles within a given time, it is necessary to give the average cross-zero rate
of the alternating stress process, i.e., the average number of times that we cross the zero mean with a positive slope in unit time. Its expression is as follows:
2.3. Stress Response Spectrum
For the local structure of risers, the stress amplitude and the average stress required in the fatigue analysis are scalars. However, the stress calculated by time history is a tensor, so it is necessary to calculate a scalar value based on the stress tensor for fatigue stress analysis. The calculated scalar value is fatigue stress, which is calculated via different methods according to different materials and structures. In the fatigue check in this study, the Von Mises stress of each position was calculated, and it was applied for fatigue analysis. Von Mises stress was calculated by the following formula:
Specifically, for the cylindrical riser structure with an isotropic structure, the stress–strain relationship can be expressed as follows [
2]:
where E is the Young’s modulus, υ is the Poisson’s ratio, and G is the shear modulus.
In this study, the local riser structure is mainly subjected to three types of loads: tension and compression, bending, and torsion. The stress response of the riser structure under the action of these three types of loads is studied separately. Finally, through the combined action of the three types of loads, the structural stress response of the riser structure under the overall load is studied.
The fatigue of structures is caused by cyclic dynamic loads, but a structure may be subjected to multiple complex loads at the same time during service. In this paper, the superposition method is used for load calculation. In the superposition method, it can be divided into several independent load conditions according to the load characteristics. If a structure is subjected to n load conditions at the same time, based on the maximum load
in the load conditions, then the time history load can be expressed as a time history process
with the maximum load as a coefficient. The superposition method is used to calculate the time history stress of the structure. We apply the maximum load in the working condition to the structure model, calculate the stress distribution
of the structure, and the time history stress of the structure under all loading conditions can be obtained by superposition:
2.4. Fatigue Calculation of Structure by Rain-Flow Counting Method
The rain-flow counting method is generally applied to deal with the time-calendar stress variation of structures. The method of transforming an irregular, random time history load into a series of cycles is called “cycle counting”. The simplified rain-flow counting method is suitable for a repeating course based on a typical load spectrum. Since the load is the repetition of a typical segment, taking the start and end of the maximum peak and valley as the typical segment will not cause a loss of generality, as shown in
Figure 1.
Based on the stress process statistics given by the rain-flow counting method, fatigue analysis can be carried out further. Specifically, the load cycle times
can be obtained from the variable amplitude load spectrum
. Then, the damage of the component
under the action cycle
under the stress level
can be calculated as
. Under the action of stress levels
and each cycle
, the total damage can be defined as follows:
The destruction criteria are
where
is the cycle number under the stress
, which is given by the load spectrum;
is the life cycle to destruction under the stress
, determined by the S-N curve.
3. Example of Fatigue Spectrum Analysis of Multilayer Riser Structure
The procedure of fatigue strength analysis for complex flexible riser structures at local locations is shown in
Figure 2.
Risers are subjected not only to external loading but also to internal loading. Much research has been done on the effect of internal pressure in multilayered risers and pipelines [
18,
19,
20,
21,
22]. The internal pressure usually does not have a significant effect on fatigue during stable oil and gas collection. Therefore, it is assumed in this paper that the influence of internal loading is ignored. The riser selected in this paper has a total of 9 layers. From the interior to exterior, they are the skeleton layer, internal sheath layer, compressive armor layer, internal anti-friction layer, internal tensile armor layer, external anti-friction layer, external tensile armor layer, four-fold anti-friction layer, and external sheath layer. Among them, the four-fold anti-friction layer is a four-fold structure, which is treated as one layer in the analysis. The solid structure of the riser is shown in
Figure 3.
The basic parameters of the riser are as
Table 1:
Figure 4 and
Figure 5 show the local segment model of the multilayer riser established in finite element analysis software ABAQUS.
Set geometric reference point RP1 at (0,0,0) and RP2 at (0,0,1000). Defined RP1 as the bottom and RP2 as the top of the riser respectively. All nodes of the bottom section of each layer were coupled to RP1, and all nodes of the top section of each layer were coupled to RP2. The coupling method was kinematic coupling.
RP1 boundary conditions were rigid and fixed, and RP2 is set according to different working conditions, shown as
Figure 6.
The loads studied include axial compression, bending moment, and torsion. The stress response of the structure under external pressure is also calculated. However, the external pressure load is constant and will not cause fatigue damage, so it is not considered in this paper. The load is obtained from the maximum force under conventional load conditions in the corresponding sea area. The loading situation is shown as
Table 2.
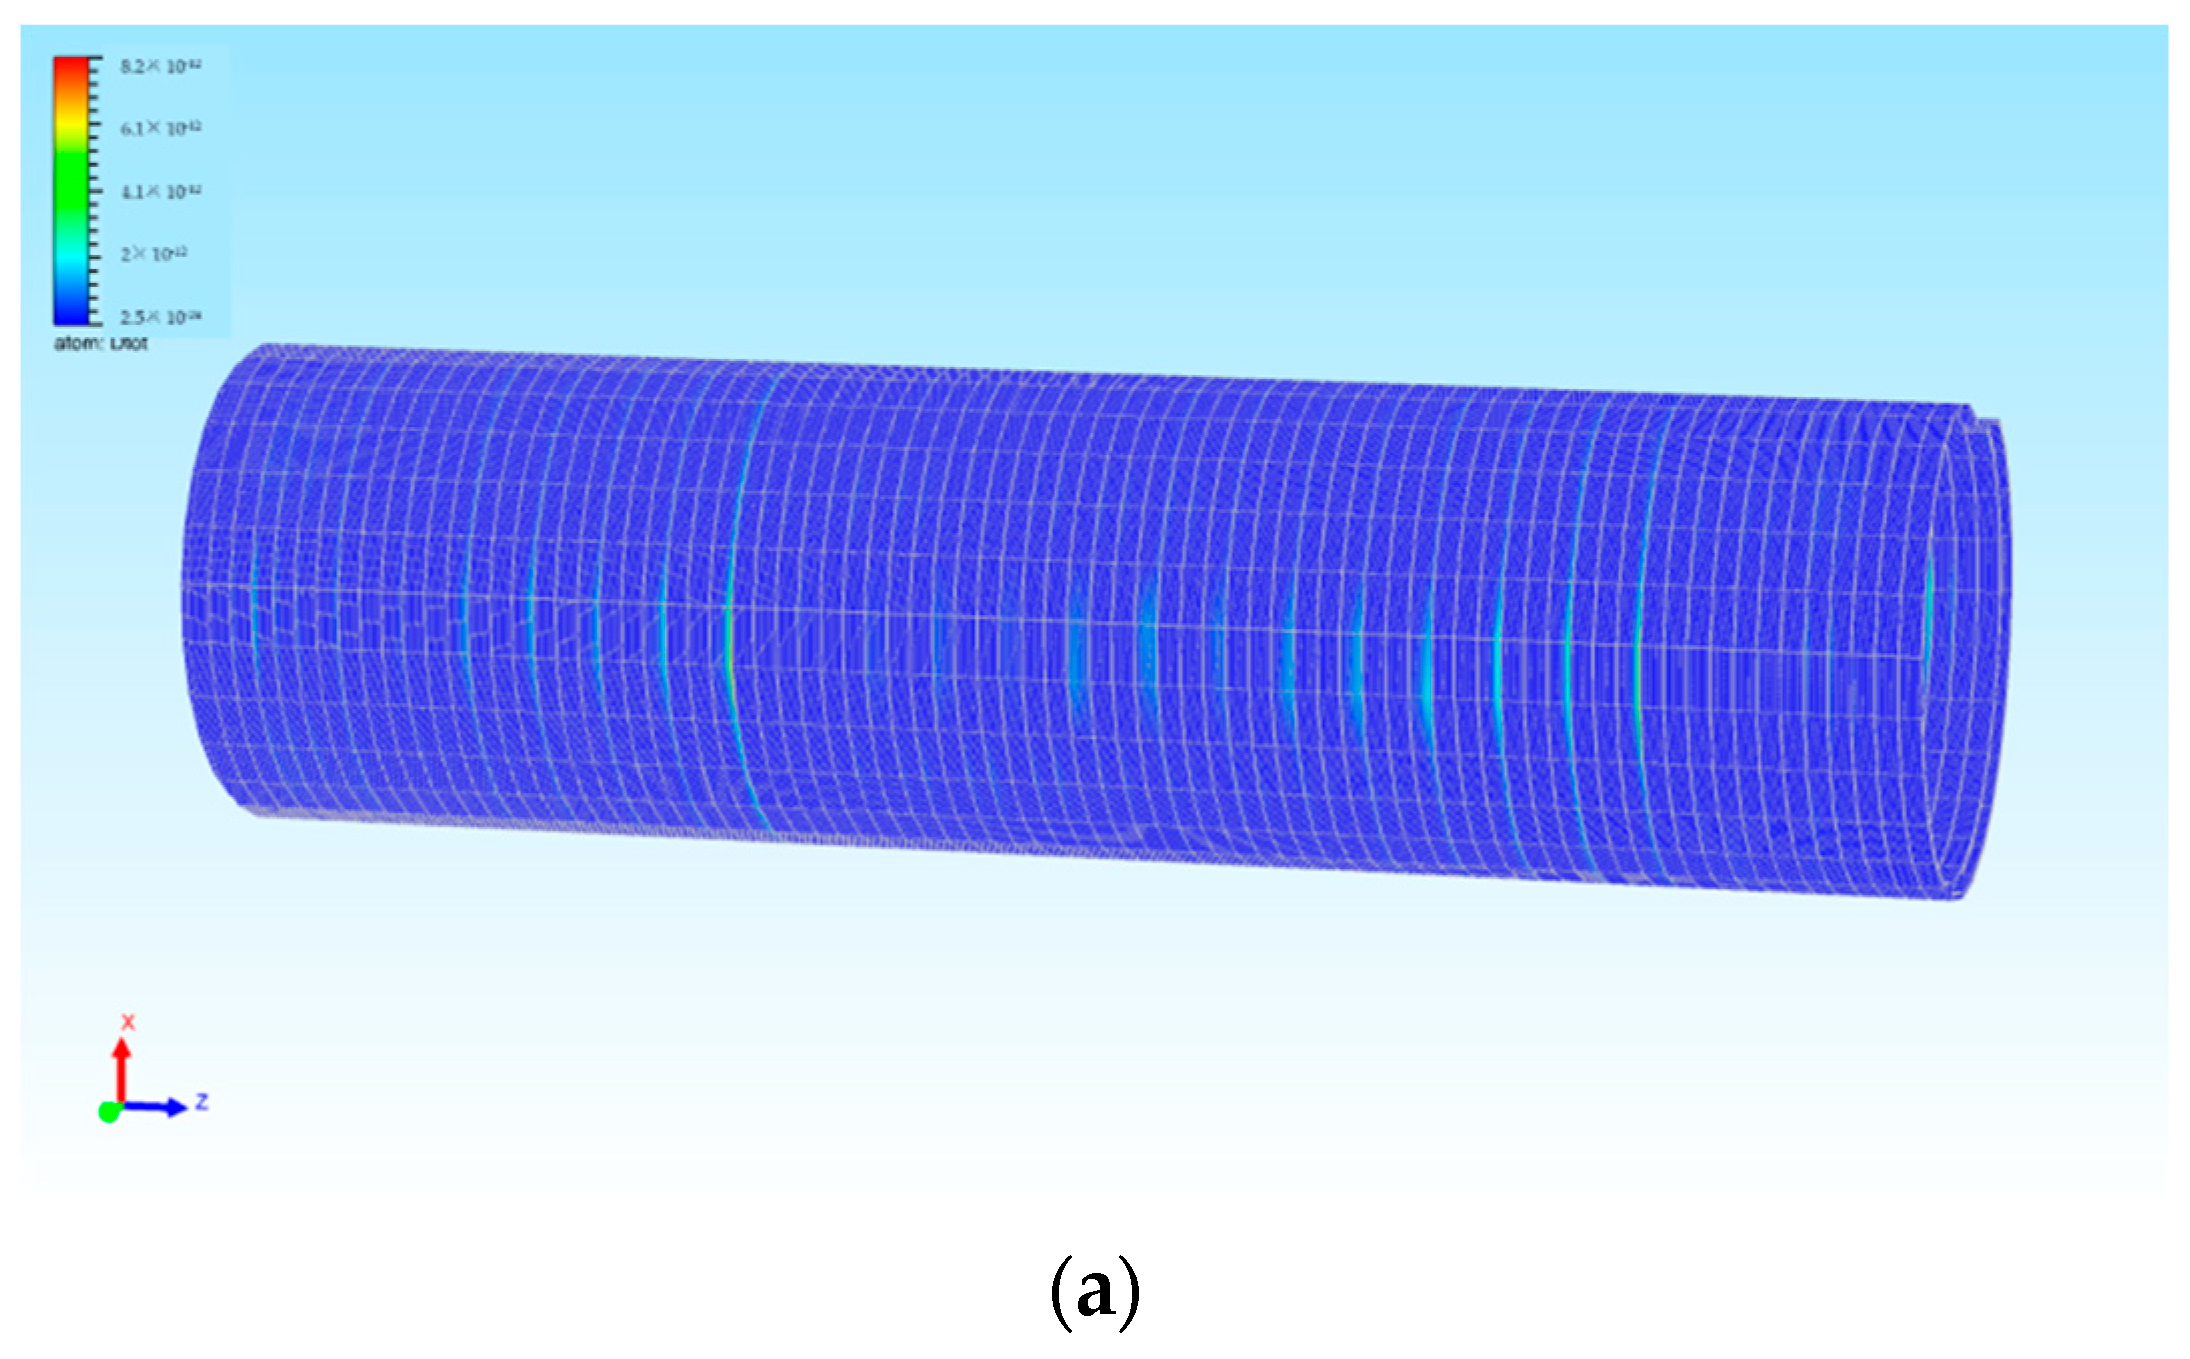
The structural stress of each metal layer under axial pressure is as
Figure 7.
The structural stress of each metal layer under the bending moment is as
Figure 8.
The structural stress of each metal layer under torsion is as
Figure 9.
Then, the fatigue reliability of the structure is analyzed on the premise of ensuring that the structure meets the ultimate strength requirements. The load of random wave action is assumed to be normally distributed. The Monte Carlo method is applied to form the time history load spectrum and simulate the time history load acting on the structure under the action of random waves during the design life of the structure.
In this paper, the stress response of each layer in the multilayer riser under maximum load is calculated by the finite element method. According to the fatigue spectrum analysis and calculation method described above, the cumulative fatigue damage degree of each layer is calculated by using a self-designed program of fatigue spectrum analysis. As mentioned above, the metal layers mainly play the bearing role in the multilayer riser, so the metal layers are mainly analyzed in this section. The stress calculated above is the maximum stress value under each load condition. Therefore, the fatigue stress response spectrum in this paper is the ratio ranges from 0 to 1 based on the maximum stress response. The stress response spectrum is shown in
Figure 10. Load transformation was carried out every 0.1 s, and 4000 s was set as a group of cycle. The stress response spectrum in the figure cycles 25 times.
In the multilayer riser structure, the high strength steel mainly bears the load of the structure. The S-N curve of the high strength steel structure is given in the specification. The material properties of steel structures in this paper are basically the same. In order to facilitate calculation, the same curve can be approximately used for calculation. According to the high-strength stress steel formula given by the DNV-RP-C203 specification [
23], the fatigue S-N curve equation should be selected for the complex flexible riser multilayer structure as follows:
The fatigue damage degree of each node is calculated. The results are visually expressed in the form of a cloud image in the self-programmed display software. The stress and fatigue damage cloud diagram of each metal layer is given and the results are analyzed.
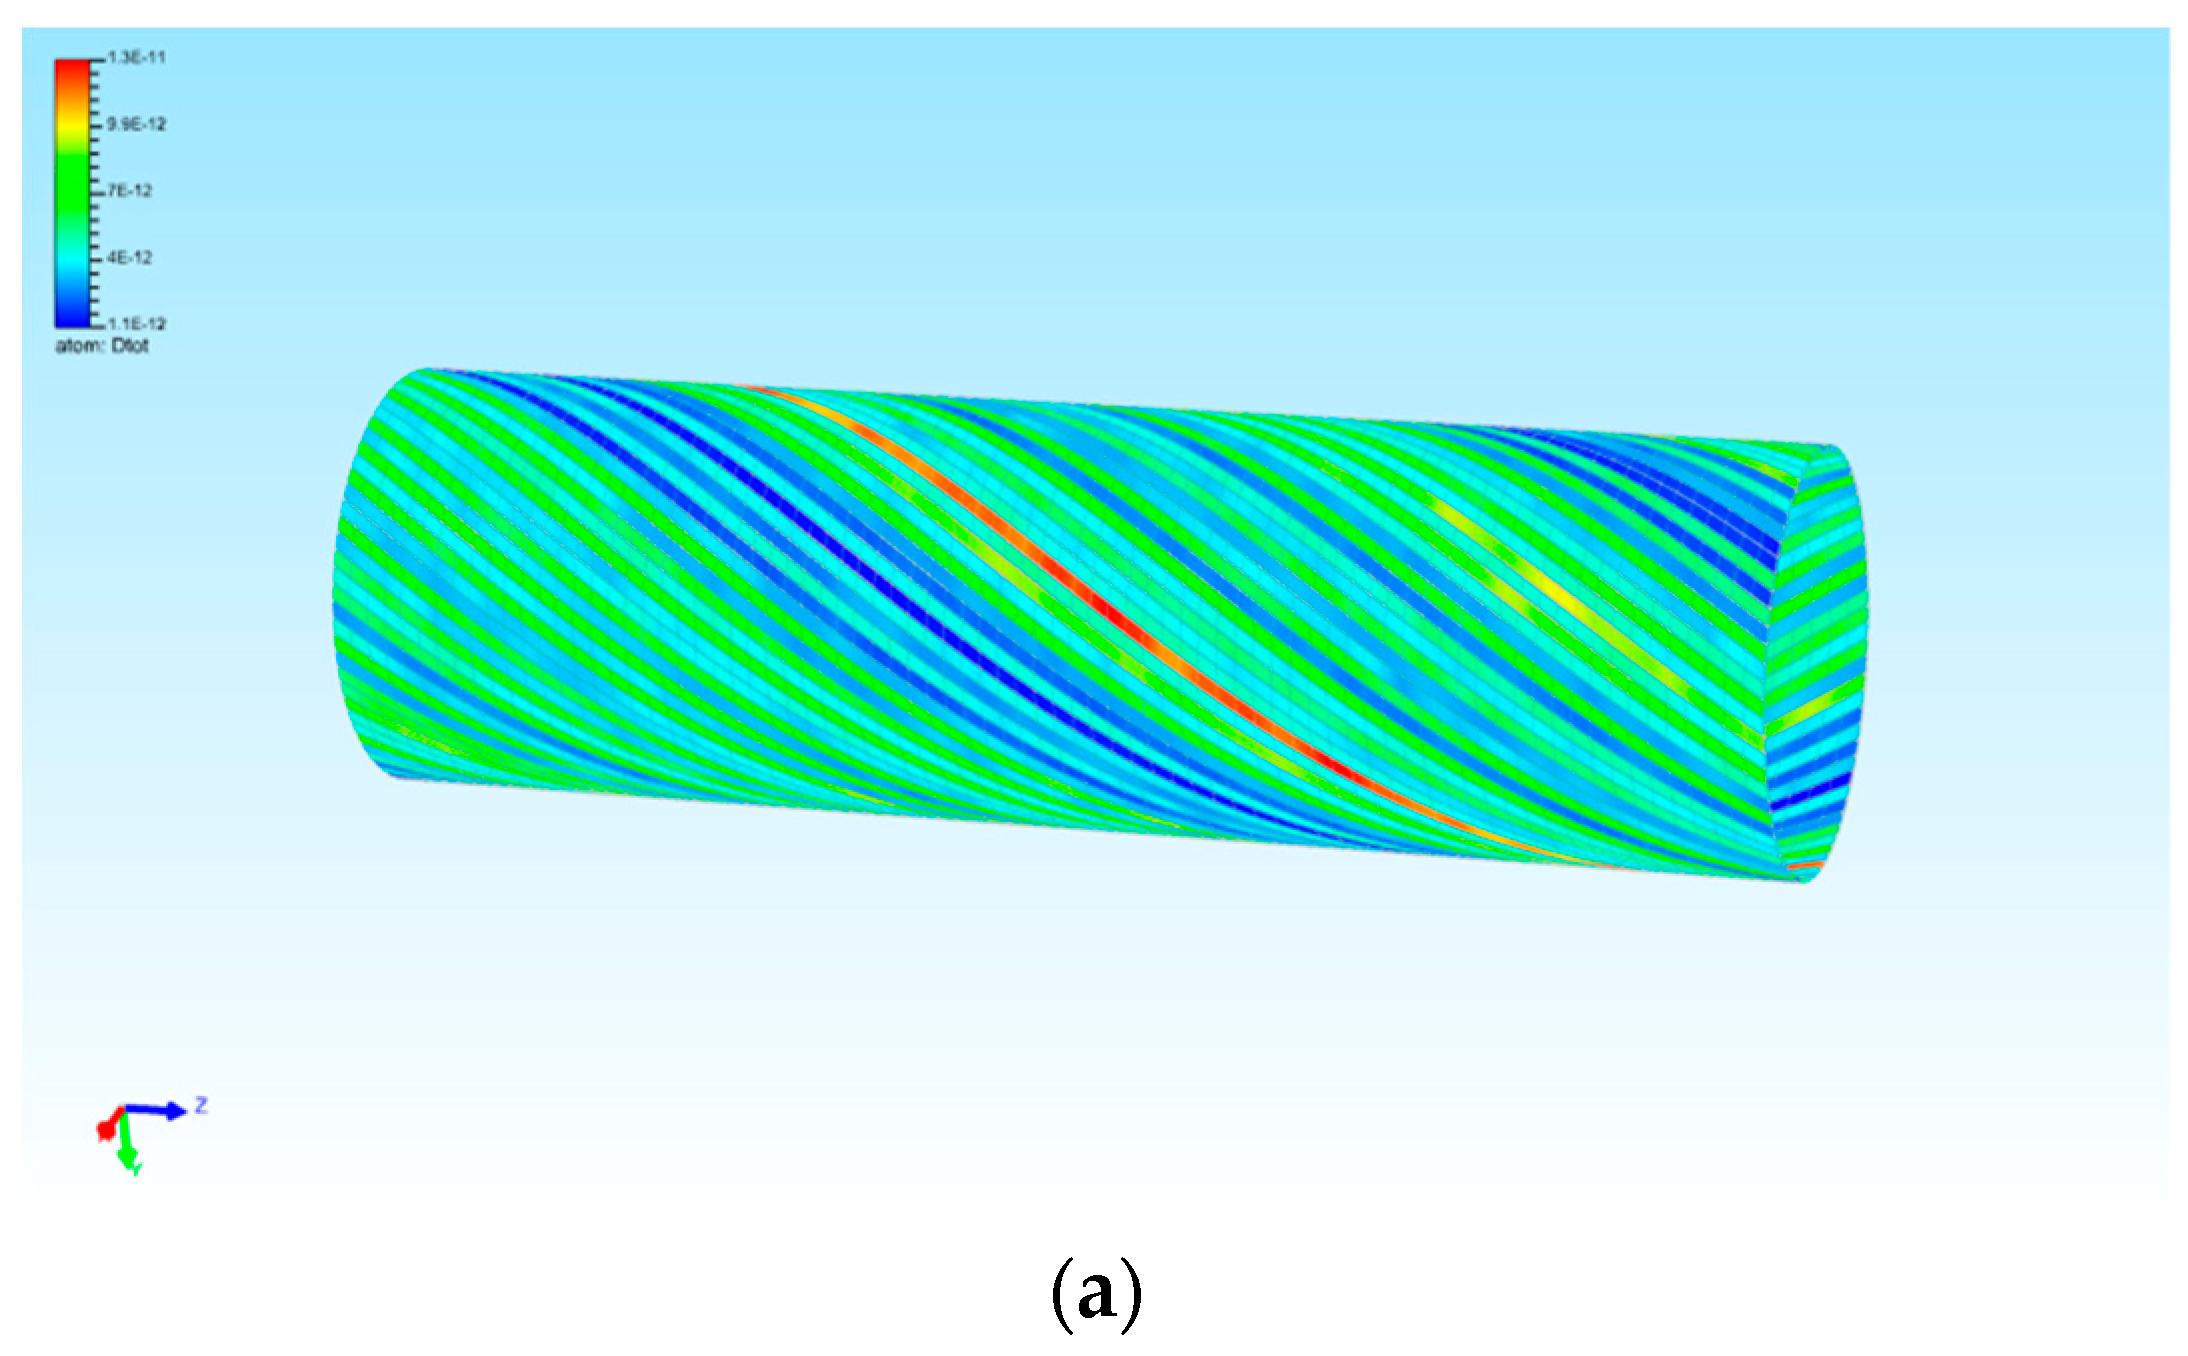
Under the action of tension and compression load, the fatigue damage nephogram of the skeleton layer and cumulative layer are as follows.
The fatigue damage nephograms of the skeleton layer under the three loads are as
Figure 11:
The fatigue damage nephograms of the compressive armor layer under the three loads are as
Figure 12:
The fatigue damage nephograms of the internal tensile armor layer under the three loads are as
Figure 13:
The fatigue damage nephograms of the external tensile armor layer under the three loads are as
Figure 14:
The maximum fatigue damage under the three loads is shown in
Table 3.
In the calculation results, there is a concentrated area of fatigue damage under torsion. This is mainly caused by stress concentration under torsion.
The stress concentration of the riser occurs in the middle position of the riser, and there will be greater fatigue damage at the stress concentration. Even in layers without helical form, such as the internal tensile armor and external tensile armor, the cumulative fatigue damage degree will also appear as a spiral form. In the stress cloud, no such spiral result exists. Especially for the tensile armor layer, its structure is completely symmetric, and, since the load applied in this section is also symmetric, both its stress response and fatigue cumulative damage should appear in a relatively symmetric form. However, the results presented in this section indicate that an interlayer interaction obviously exists and cannot be ignored in the analysis of multilayer riser structures. The structural form of the adjacent layers will cause the interlayer load, which will affect the fatigue damage of the structure.
When simulated by ABAQUS, it is observed from the stress cloud diagram of some structures that there is stress concentration in some positions of the structure. Especially in the case of a symmetrical load applied to the symmetrical structure, the stress concentration is not symmetric, which can also indicate the interaction between the layers. In
Figure 10 and
Figure 11, for example, the stress response is asymmetrical. However, in the stress response of some structures, this situation is not obvious. For example, in the stress cloud diagram obtained under the action of tension and compression load in FIG. 6, the stress situation is in a symmetric form on the whole, and there is no obvious stress concentration node. However, in the fatigue damage cloud image, it is obvious that the damage degree has a local concentration. In the stress response analysis, the structure is only loaded once. Although there is stress concentration in some locations, it is not obvious. This concentration may be reflected in numerical values, but it is difficult to determine in the stress distribution graph. However, after a large number of load cycles, the stress concentration effect is obviously enlarged, and finally the cumulative fatigue damage is concentrated.
In previous fatigue analyses, typical welding joints were mostly selected as calculation nodes [
24]. According to the specification, the selected nodes are usually located in the structural corners, large openings of coamings, and other positions where stress concentration can easily occur. On this basis, combined with the finite element analysis results of the whole structure, the stress concentration location was selected for fatigue analysis. Through the findings presented in this section, it can be observed that in the selection of fatigue nodes, this method cannot select all fatigue danger points. Some nodes without obvious stress concentration also have the possibility of developing concentrated fatigue damage, which affects the accuracy of fatigue analysis. In this section, the fatigue damage of all nodes is obvious in the form of the fatigue damage nephogram, which makes the fatigue analysis result more comprehensive and objective.
4. Time-Variant Fatigue Reliability Analysis of Multilayer Flexible Risers
The sources of uncertainty in the process of fatigue damage assessment have been discussed in many studies [
25,
26]. As for structure, comparing risers in practical engineering with finite element models, there may be some detail deviation in the materials and structures. Moreover, welding defects and residual stresses in the actual engineering processing cannot be predicted in numerical simulation analysis, which will cause the numerical simulation analysis results to be different from the structural stress in practical engineering, thus affecting the prediction of fatigue damage. As for loads, there is some randomness in the loads of practical structures. Regarding fatigue calculation methods, the widely used Palmgren–Miner linear cumulative damage theory holds that the structure is considered to be damaged as long as the linear sum of fatigue damage in all sea states reaches 1. However, this is an approximate method, and the cumulative damage degree is not always exactly 1 when the structure is damaged under practical circumstances. There are some studies on this shortcoming, and researchers are looking for alternative [
27]. This rule is linear and does not take into account the loading sequence effects. Therefore, the fatigue calculation above is based on the assumption of linear damage accumulation. Recently, some nonlinear fatigue models have been established [
28,
29]. However, the Palmgren–Miner criterion is still widely adopted in the evaluation of ships and marine structures due to its simplicity.
As for the load uncertainty, the Monte Carlo method is applied in the fatigue load spectrum simulation above, i.e., random numbers are used to simulate the random sea state. Therefore, the randomness of the load is not considered again in this section. In this section, considering the other two factors, the reliability method is applied to reduce the impact of uncertainty.
4.1. Establishment of Reliability Analysis Model
For the multilayer flexible riser structure considered in this paper, in order to ensure its safety, it is necessary that each layer structure is not damaged. As mentioned above, only metal layers are considered for fatigue assessment. Since the failure of each layer is independent, the multilayer riser can be regarded as a serial system. If there is fatigue failure in any layer, the entire multilayer flexible riser is considered to have failed. Thus, the structural reliability can be defined as
where
are the reliability of the skeleton layer, compressive armor layer, internal tensile armor layer, and external tensile armor layer.
When the fatigue life is shorter than the design life, fatigue failure occurs. The limit state equation is expressed as follows:
where
Z is the vector related to ∆, B, and D. Structural fatigue reliability is
The failure probability is
Due to the influence of uncertain factors in each layer of the structure, the fatigue life of each layer is dispersed and superimposed, resulting in great dispersion of the overall structure. Therefore, two uncertain factors in each layer should be quantified. At present, most research adopts the probability method to simulate this, i.e., quantifying the uncertainty through a random process and random variable.
Considering the uncertain factors, the fatigue life of the structure is
where
TA is the design life,
D is the fatigue reliability, ∆ is the random variable considering that the cumulative damage degree is not always 1 when fatigue damage occurs to the structure, and B is the random variable considering the influence of errors between modeling and practical structures. The reliability indicator is
4.2. Reliability Calculation
In the fatigue life prediction of marine structures, the fatigue reliability calculation process is as follows:
- (1)
Conduct random sampling and select samples according to the statistical characteristics of random variables;
- (2)
The random number obtained by random sampling is used as the initial parameter to calculate the fatigue life of the structure;
- (3)
According to the fatigue life of each considered detail, combined with the limit state equation, the reliability of the system is finally calculated.
Two types of uncertain factors are analyzed. Considering the uncertainty of the deviation between the model and the practical structures, it affects the fatigue damage calculation of the structure by affecting the stress results calculated. Therefore, its distribution type can be considered as the load distribution. Since the influence of load has been considered in the previous section, the mean coefficient of load here can be regarded as 1. The mean coefficient and variation coefficient of other parameters can be selected according to the study of Wirsching [
23]. The values are described in
Table 4.
According to the selection structure of this paper, and referring to the calculation results in
Section 2, we select nodes with the largest degree of fatigue damage in each calculation layer (numbered 1–4 from interior to exterior). Substituting the values of parameters from the preceding table into the formula, the reliability calculation results are as shown in
Table 5.
Based on the structural attenuation model of ships and marine structures summarized in previous studies [
30], and introducing the fatigue cumulative damage increasing function, the power function model was used to represent the annual increasing coefficient of cumulative fatigue damage. The expression is as follows:
where
is the cumulative damage after n years,
is the initial cumulative damage,
is the increasing coefficient of cumulative damage,
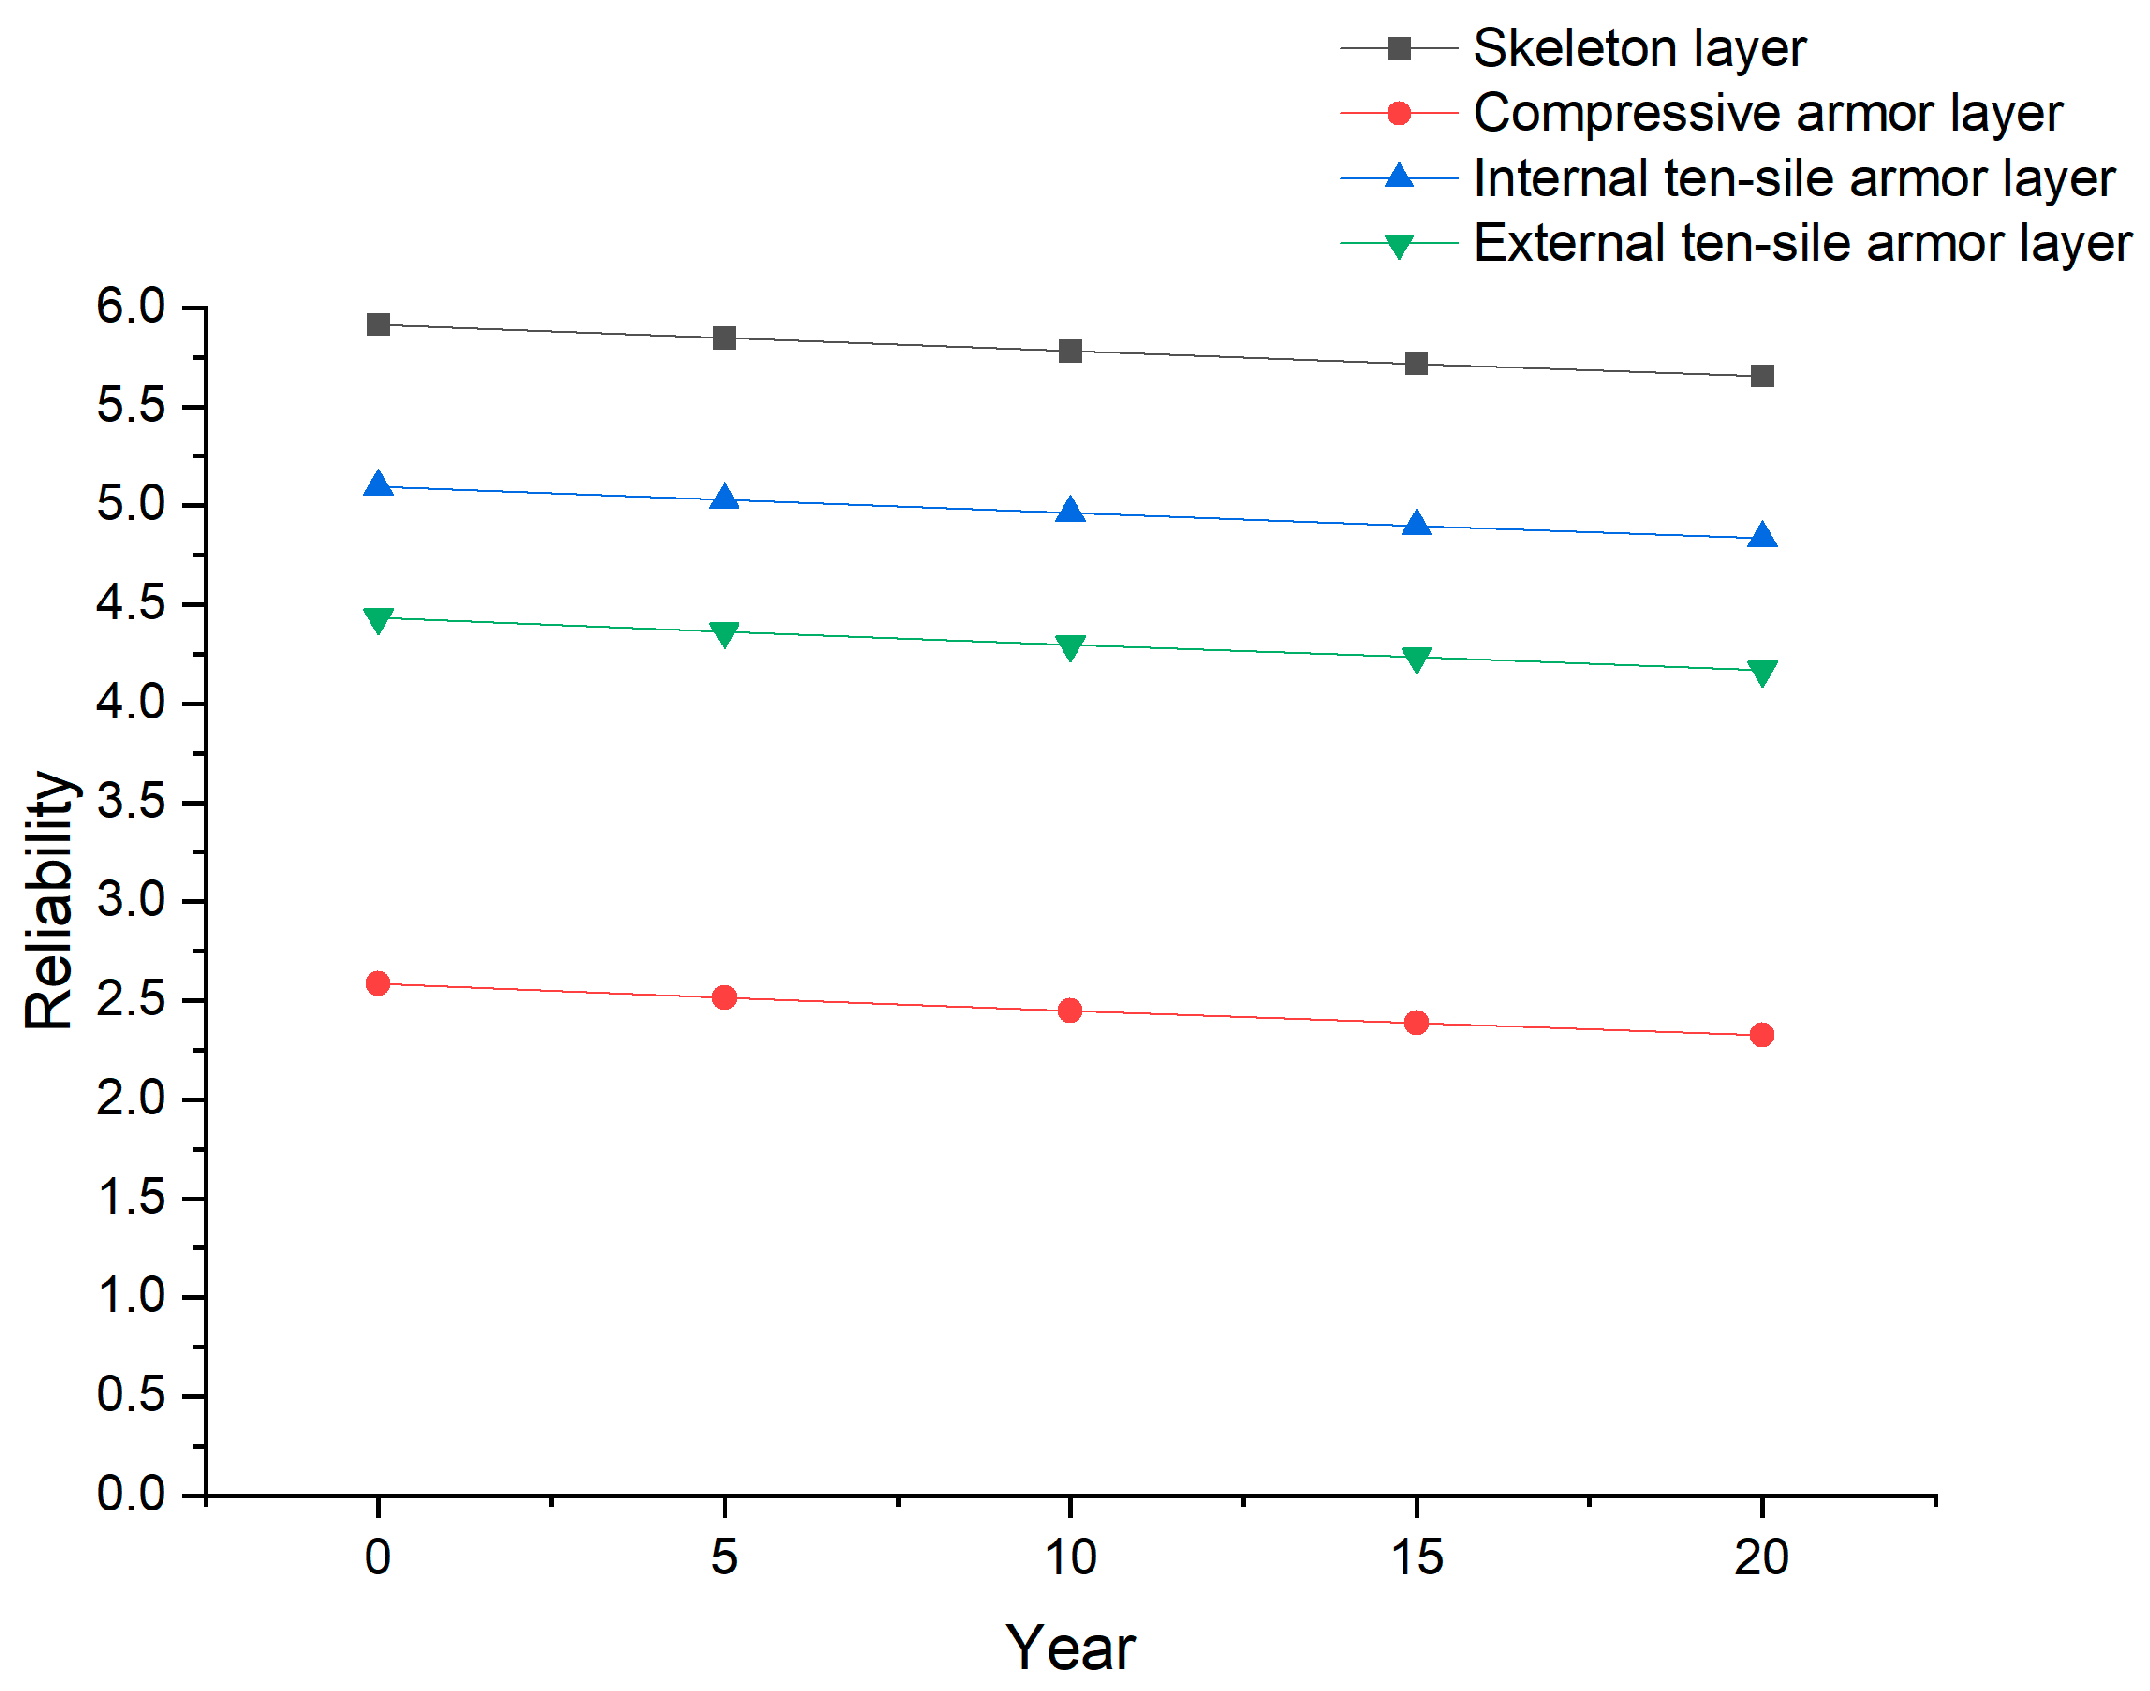
is the design life for structural fatigue. The design life of this structure is 20 years. The reliability index of the structure in the design life changes with the years of use, as shown in the following table. The reliability index of the structure in the design service life changes with time, as shown in the following table. The reliability index
of the structure in the design service life changes with the year, as shown in
Table 6. The higher the reliability index, the lower the probability of fatigue failure.
With the increase of service life, the structural reliability index decreases gradually.
Figure 15 shows the changes in the reliability indicators in different years.


