
Assessment of Sea Level and Morphological Changes along the Eastern Coast of Bangladesh


Abstract
:1. Introduction
2. Study Area
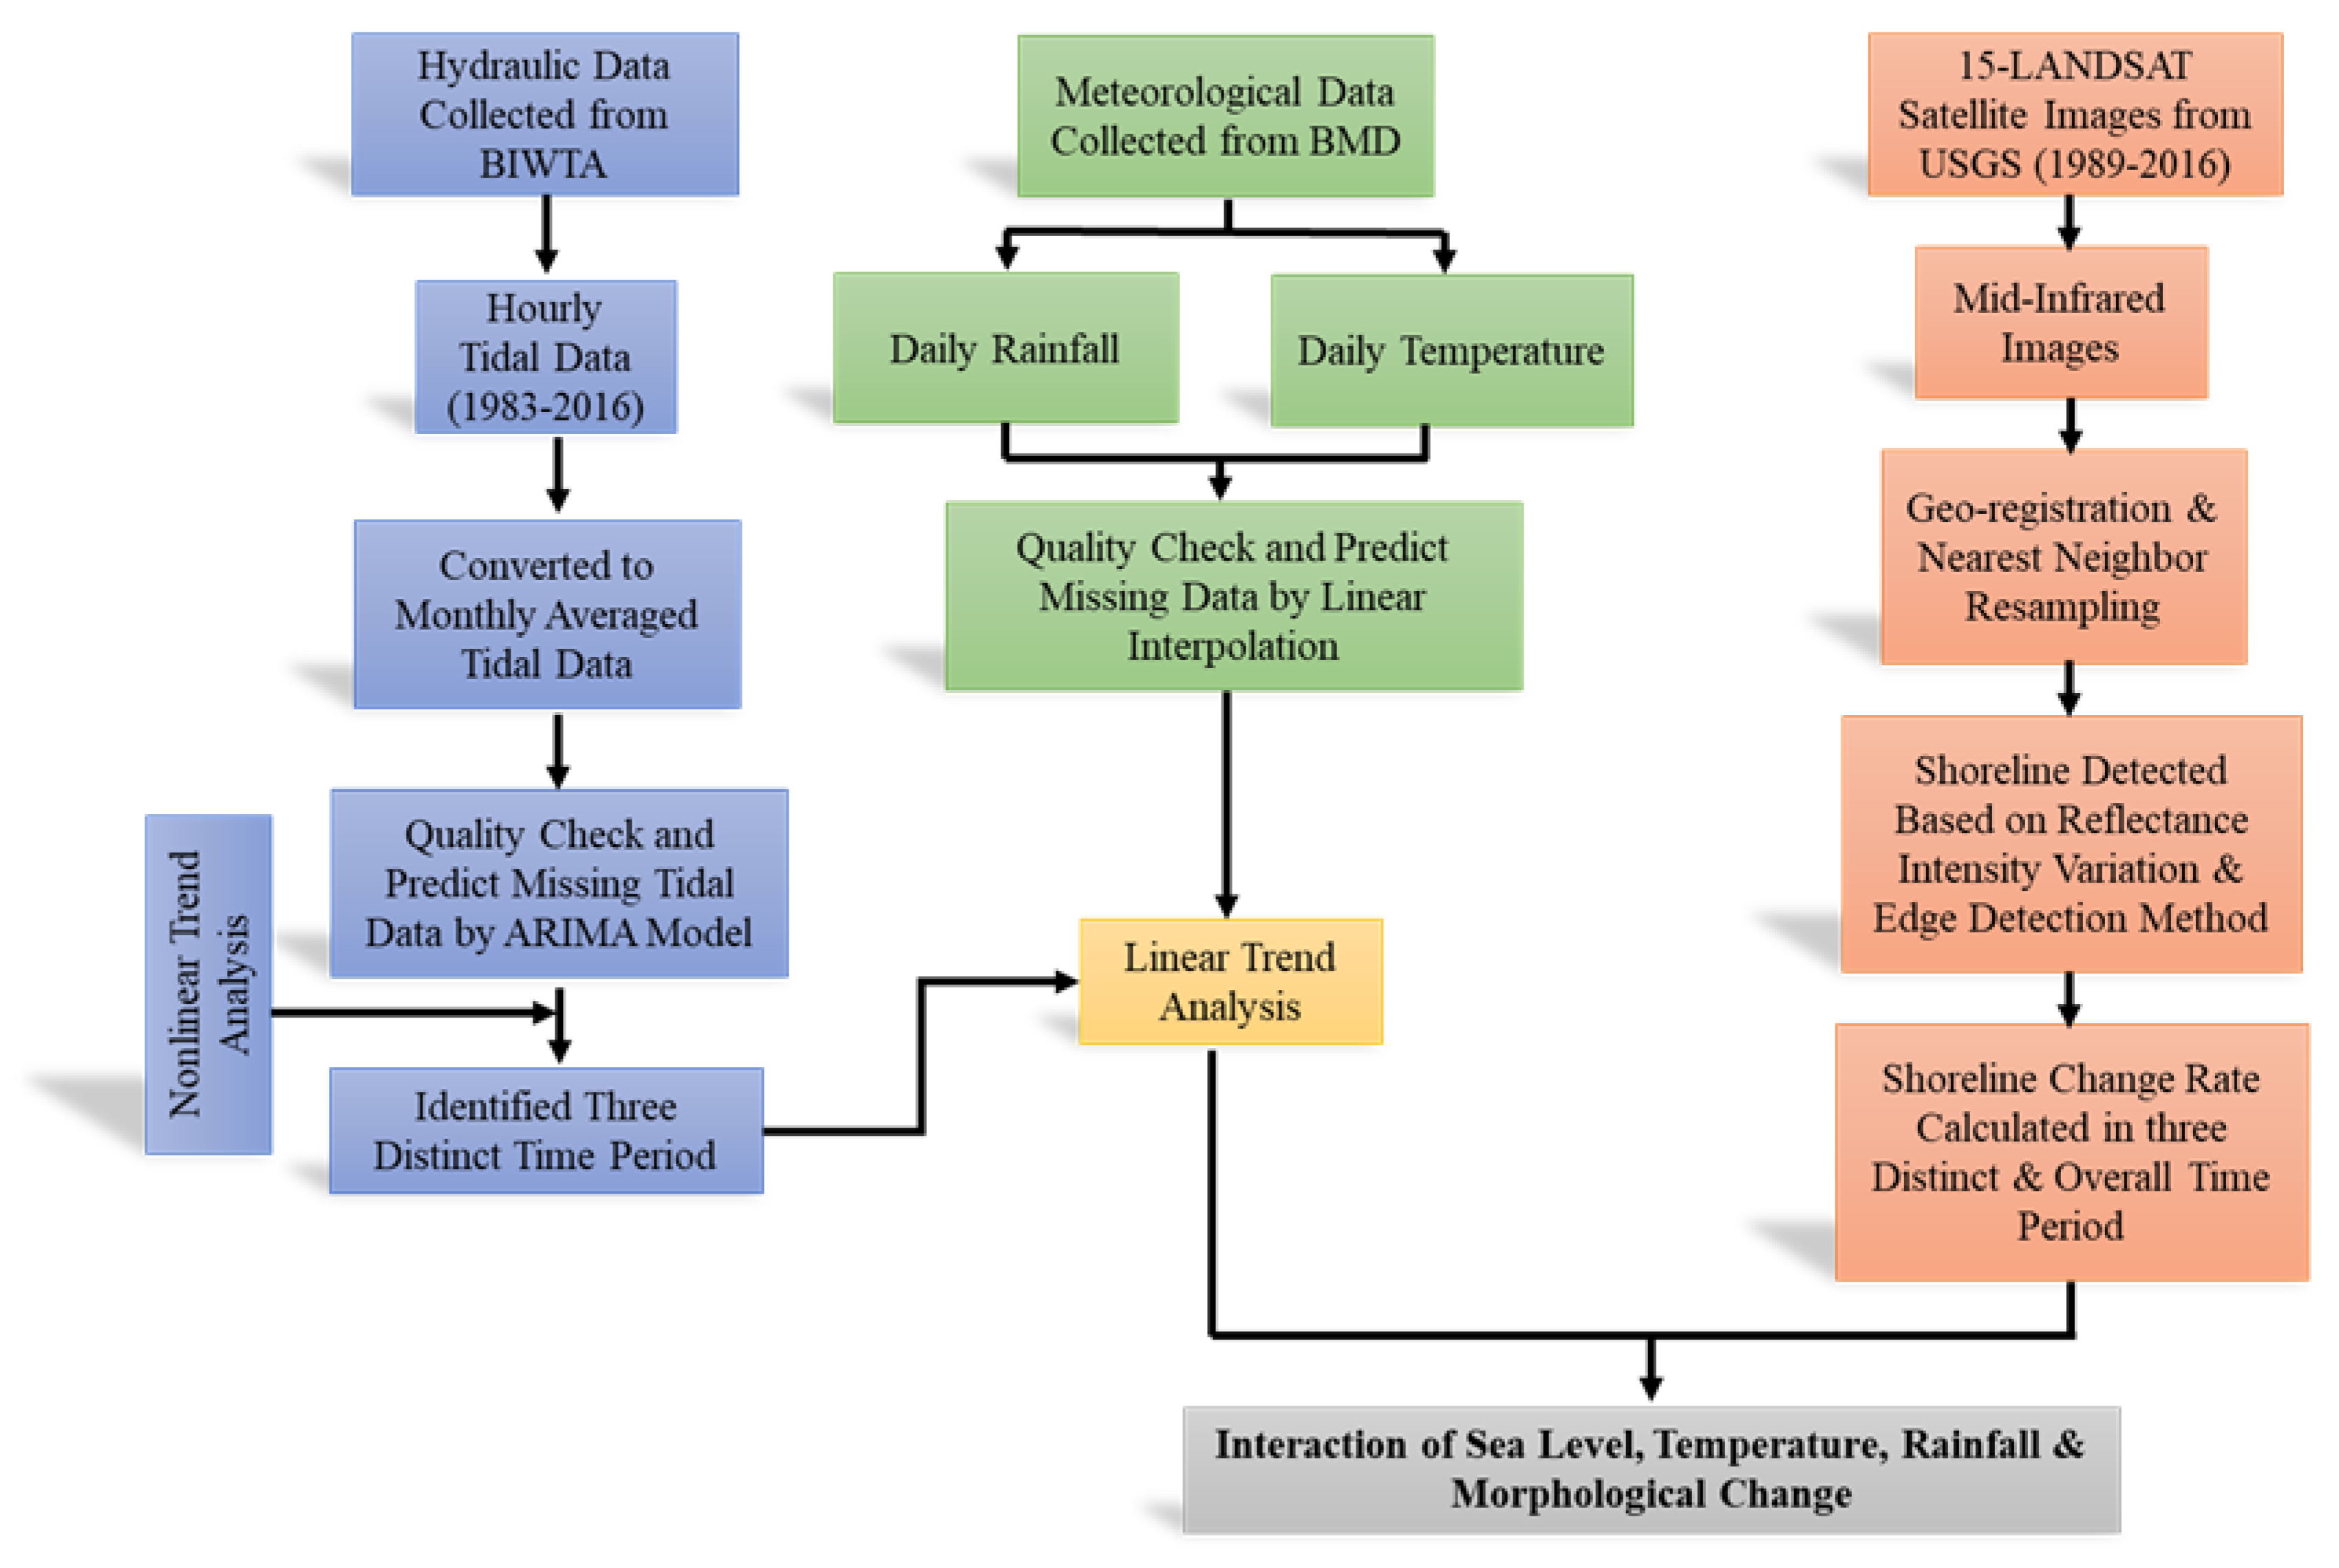
3. Methodology
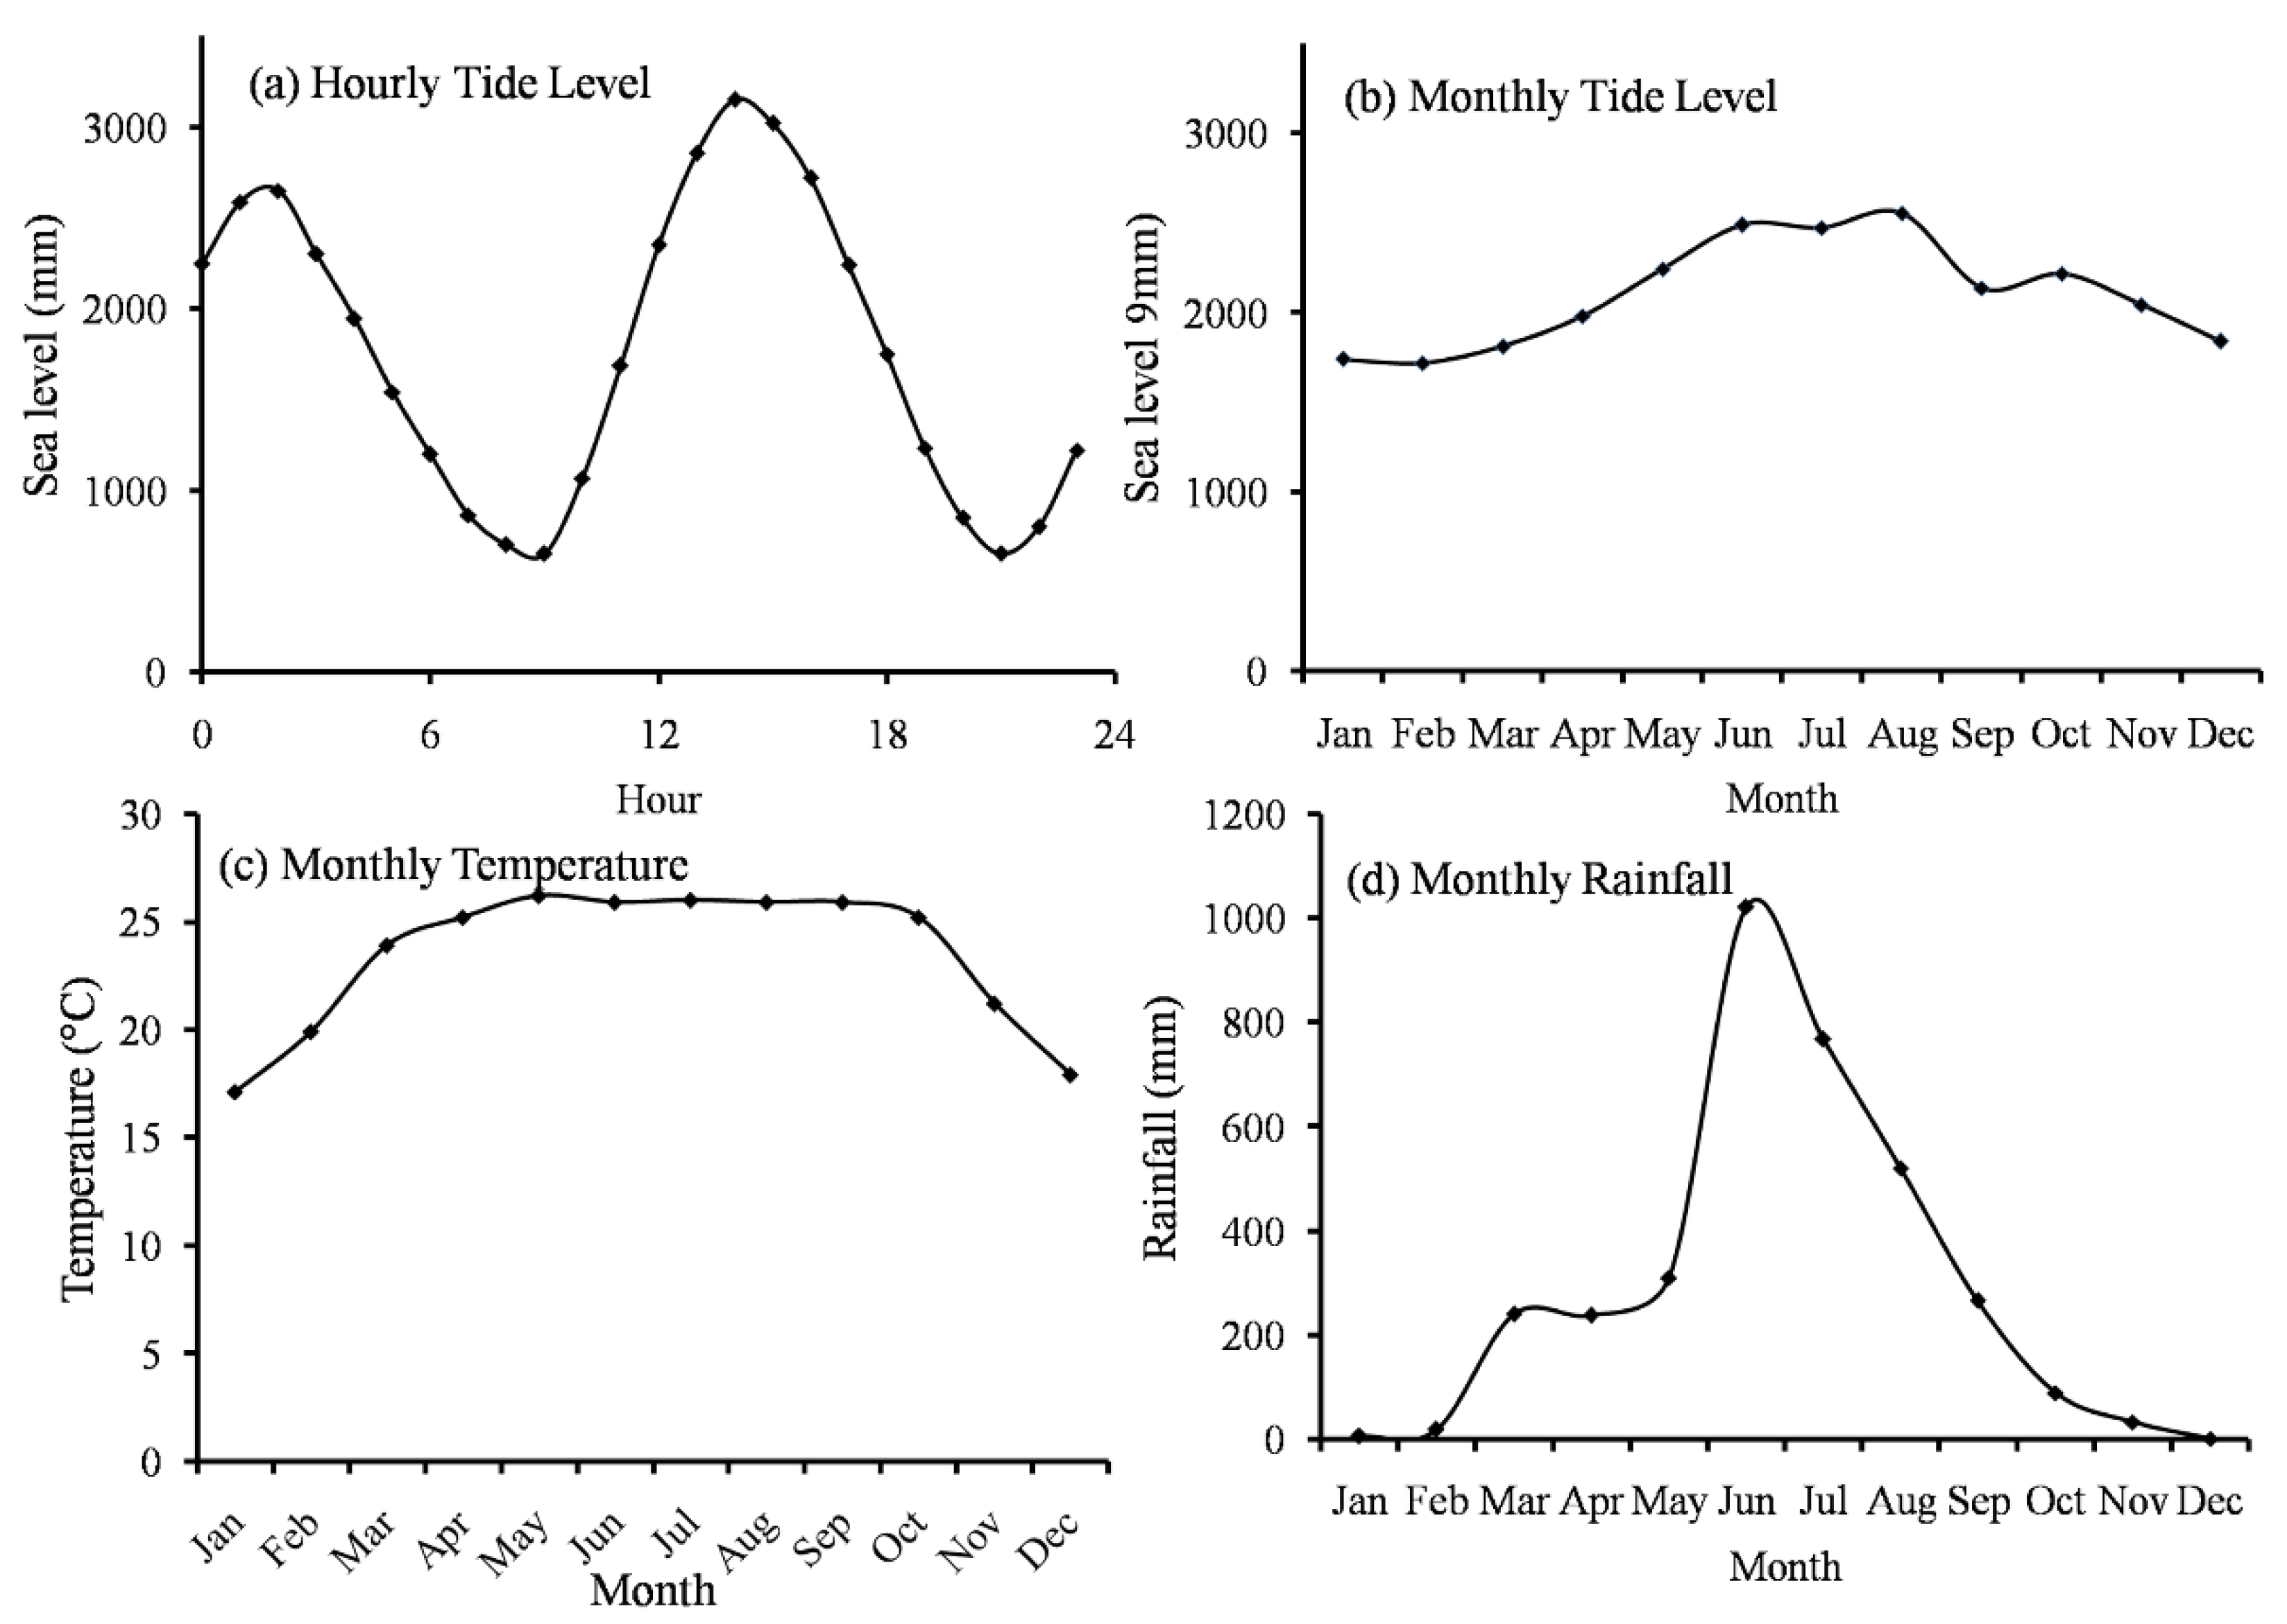
3.1. Sea Level, Rainfall, and Temperature Data-Processing and Analysis
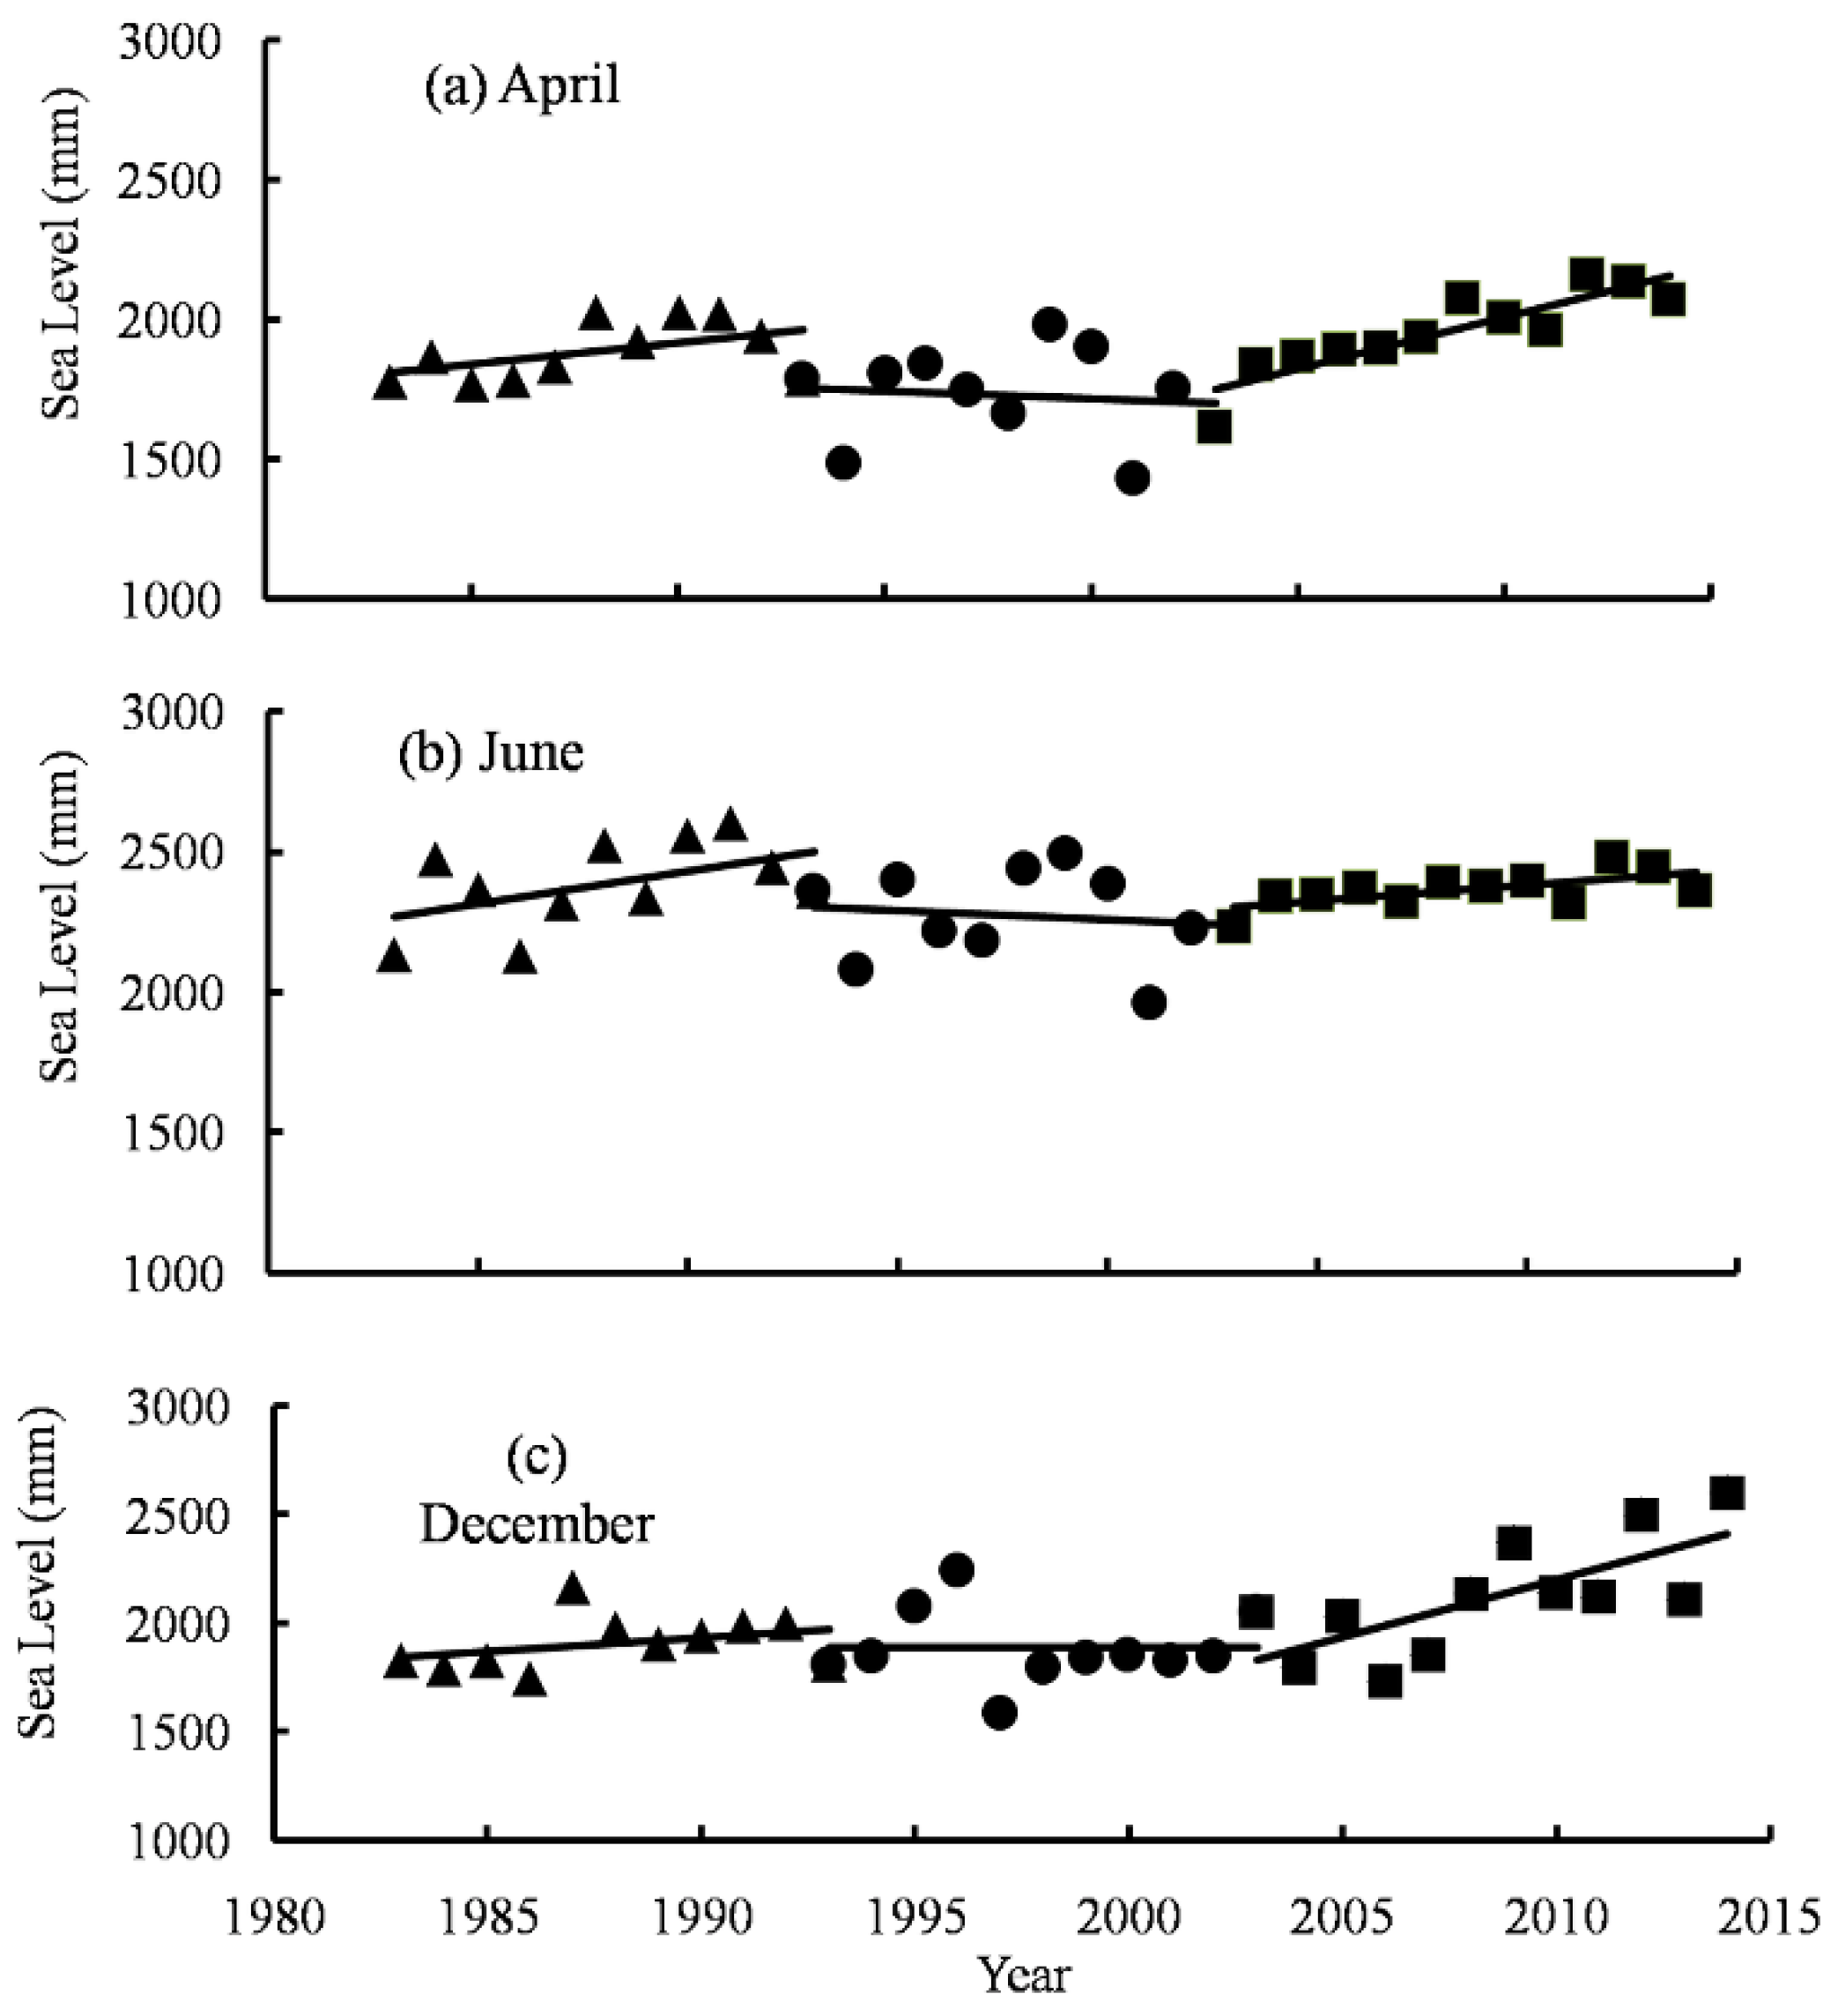
3.2. Trend Analysis
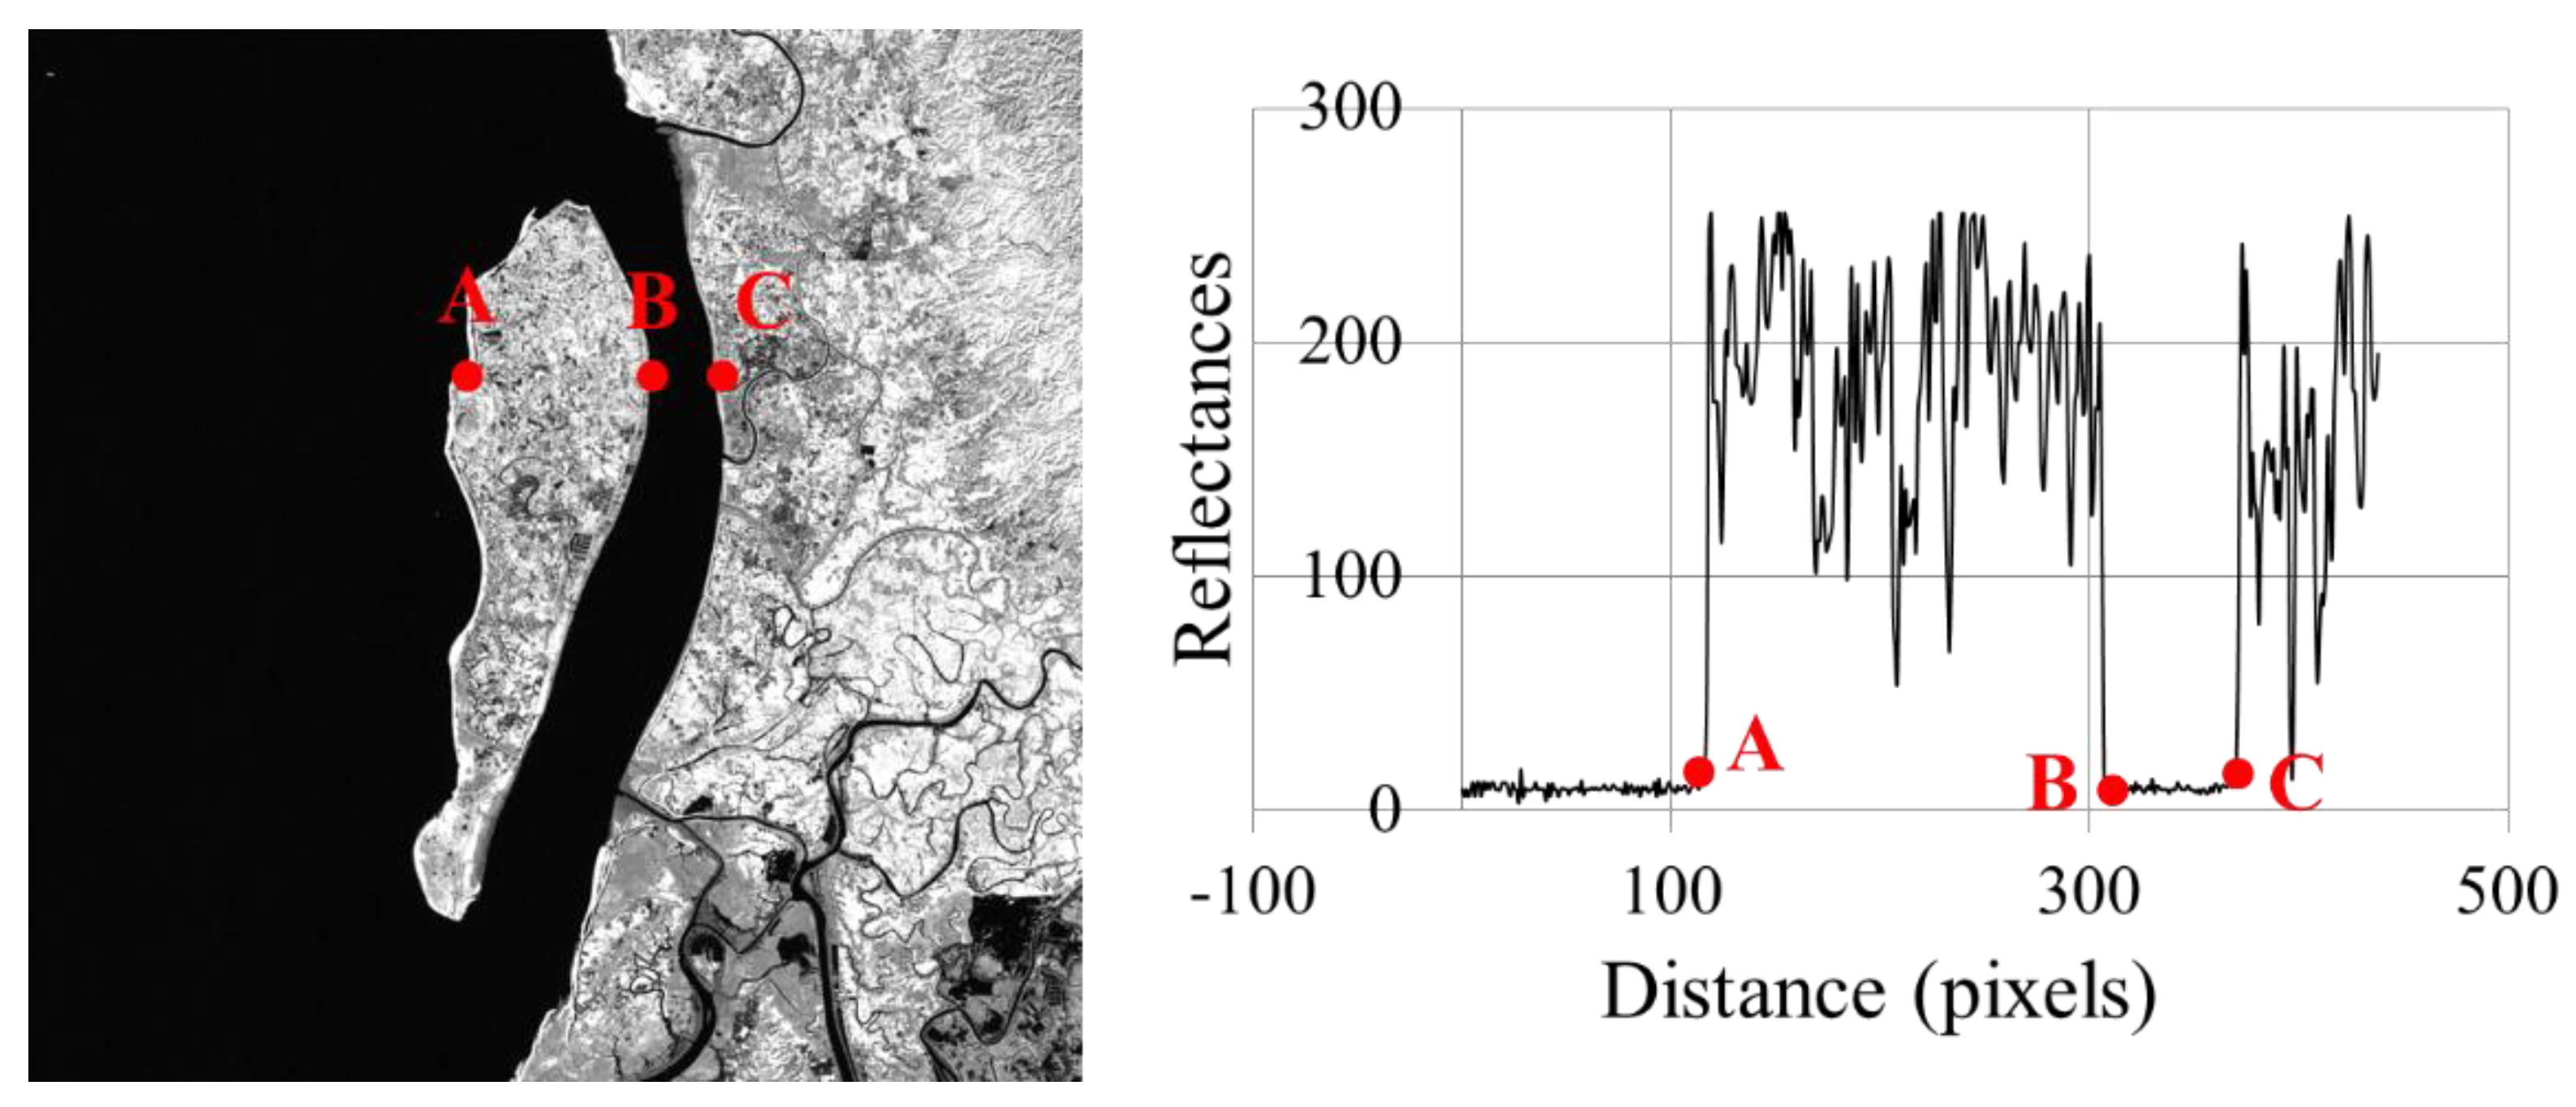
3.3. LANDSAT Images
LANDSAT Image Processing
4. Results
4.1. Sea Level Variations at Cox’s Bazar
4.2. Shoreline Changes
4.2.1. Rate of Shoreline Change along Cox’s Bazar
4.2.2. Rate of Shoreline Changes around Kutubdia Island
4.3. Variation of Rainfall at Cox’s Bazar and Kutubdia Island
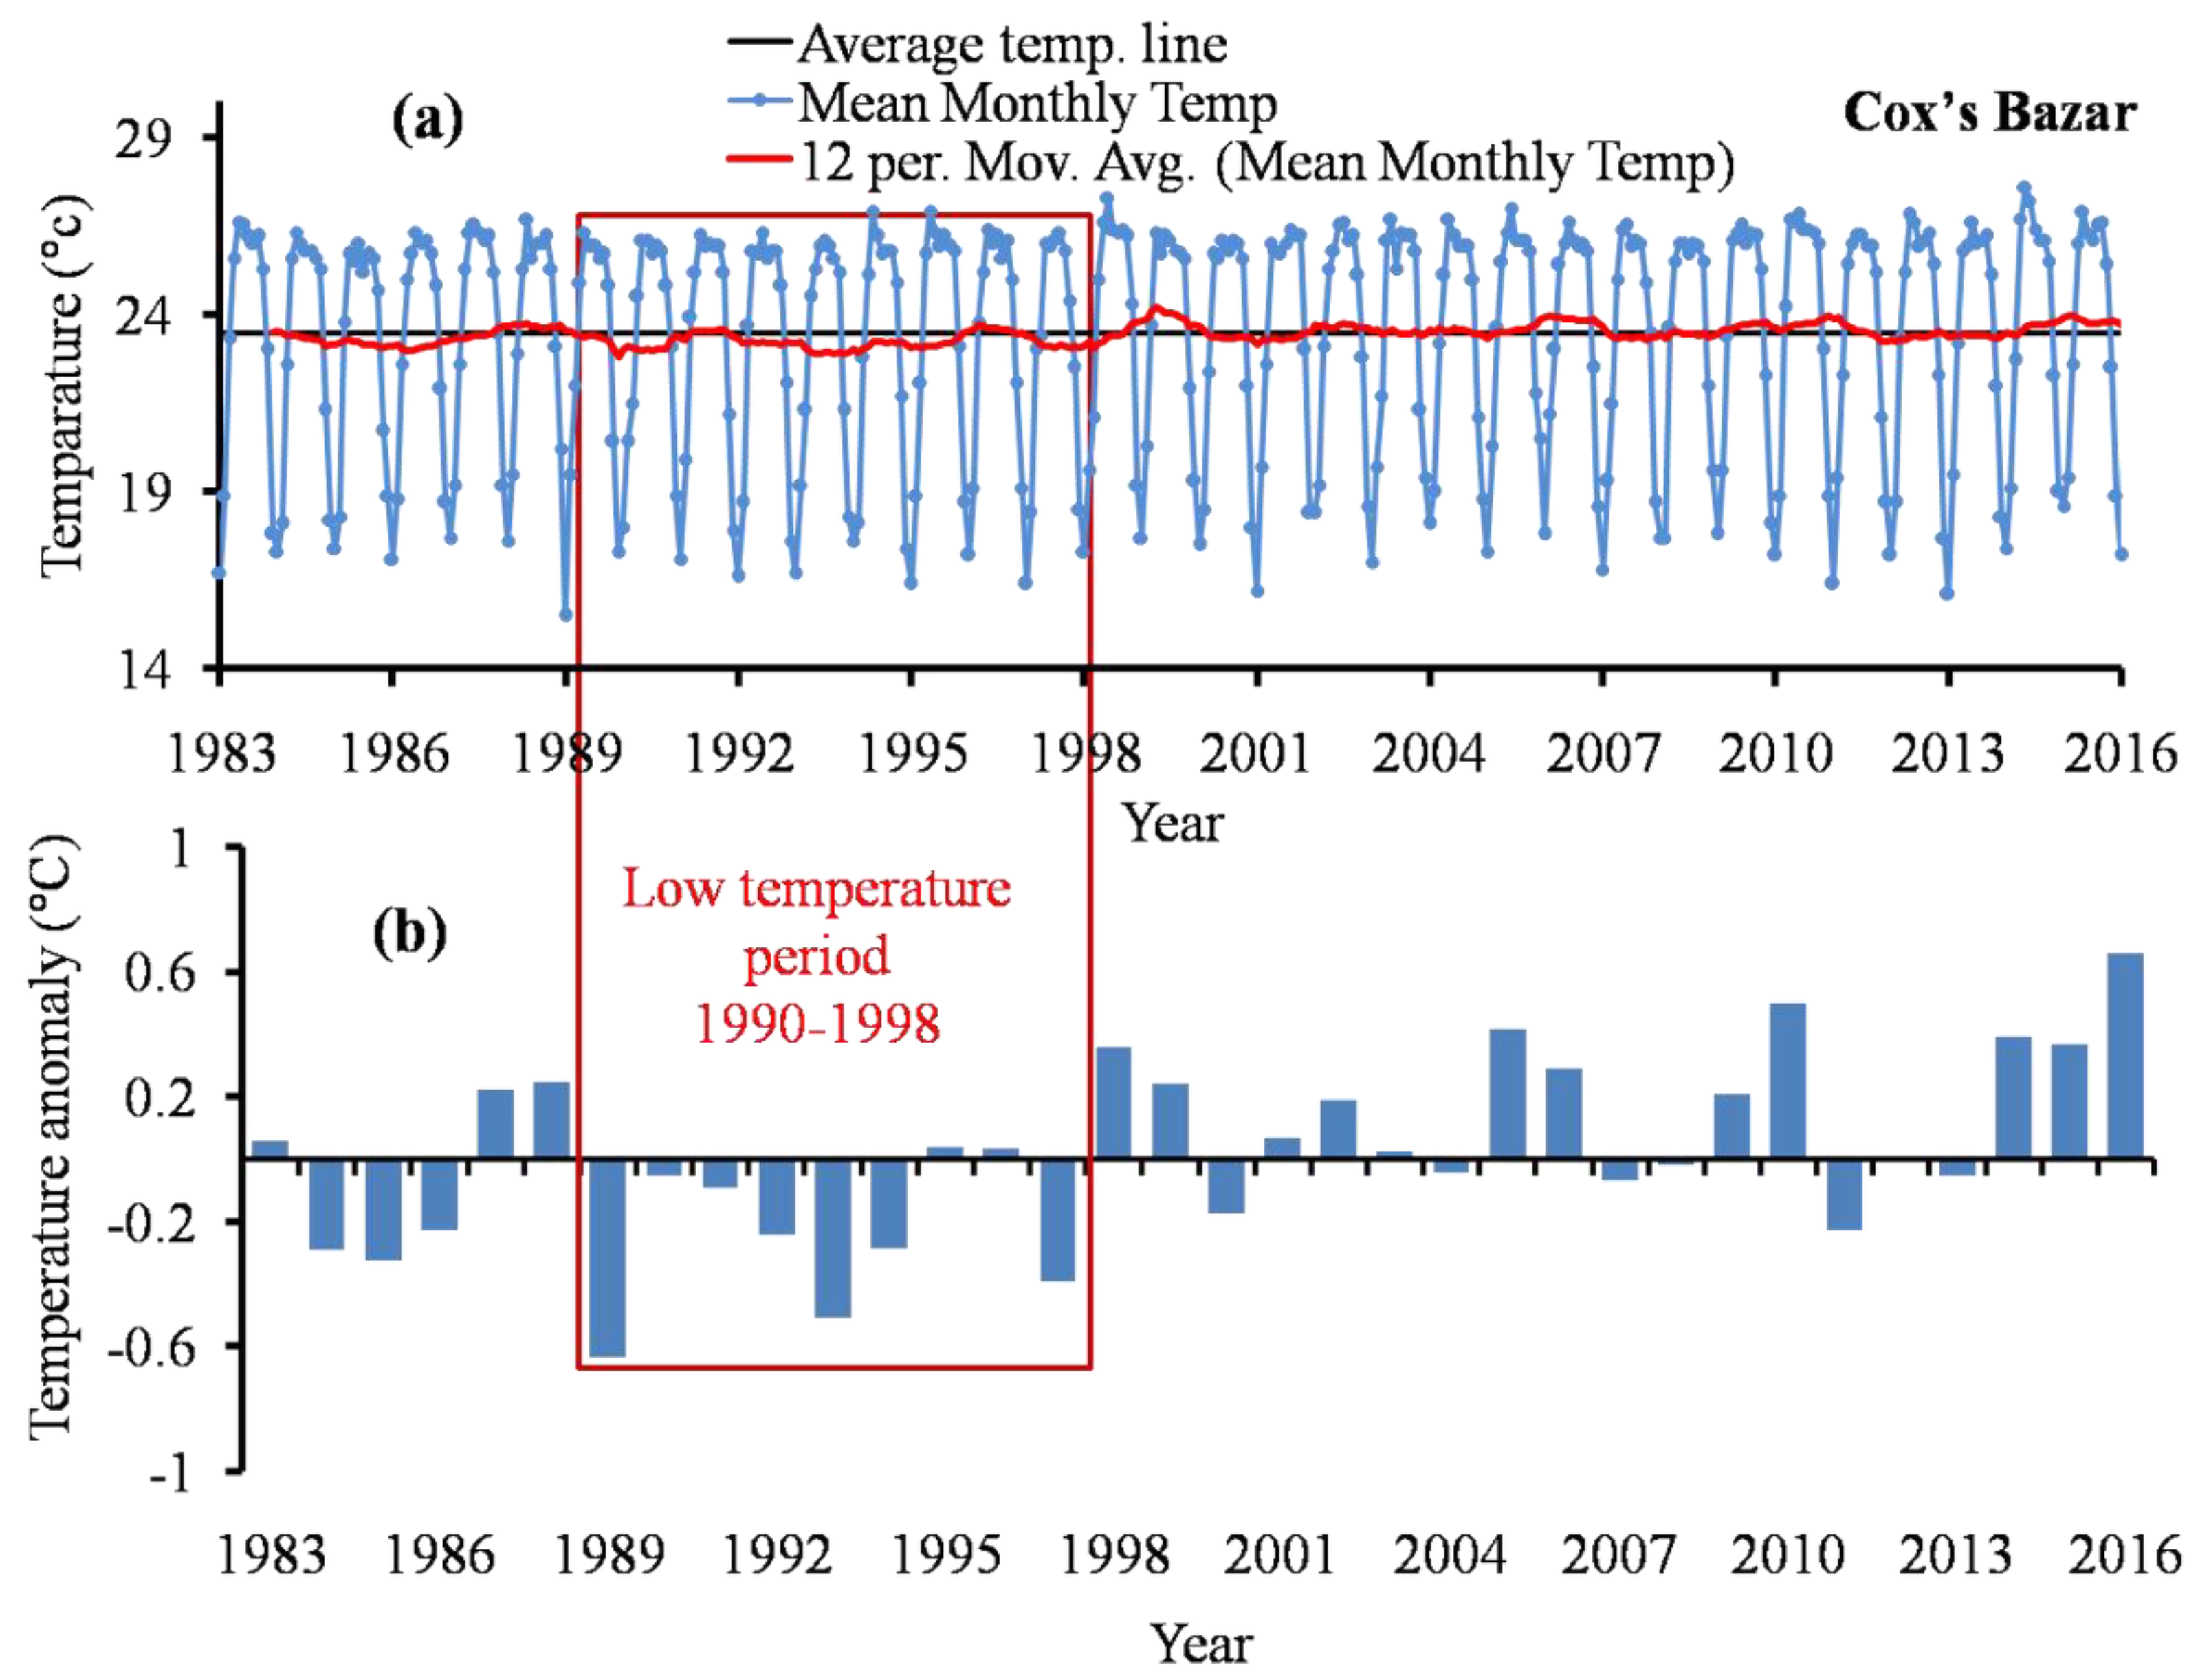
4.4. Variation of Temperature at Cox’s Bazar Station
5. Discussion
6. Conclusions
Author Contributions
Funding
Institutional Review Board Statement
Informed Consent Statement
Data Availability Statement
Conflicts of Interest
References
- Hauer, M.E.; Fussell, E.; Mueller, V.; Burkett, M.; Call, M.; Abel, K.; McLeman, R.; Wrathall, D. Sea-level rise and human migration. Nat. Rev. Earth Environ. 2020, 1, 28–39. [Google Scholar] [CrossRef]
- Lawrence, J.; Bell, R.; Blackett, P.; Stephens, S.; Allan, S. National guidance for adapting to coastal hazards and sea-level rise: Anticipating change, when and how to change pathway. Environ. Sci. Policy 2018, 82, 100–107. [Google Scholar] [CrossRef]
- Rouse, H.; Bell, R.; Lundquist, C.; Blackett, P.; Hicks, D.; King, D.-N. Coastal adaptation to climate change in Aotearoa-New Zealand. N. Z. J. Mar. Freshw. Res. 2017, 51, 183–222. [Google Scholar] [CrossRef]
- IPCC. Special Report on the Ocean and Cryosphere in a Changing Climate; IPCC: Geneva, Switzerland, 2019. [Google Scholar]
- McMichael, C.; Dasgupta, S.; Ayeb-Karlsson, S.; Kelman, I. A review of estimating population exposure to sea-level rise and the relevance for migration. Environ. Res. Lett. 2020, 15, 123005. [Google Scholar] [CrossRef]
- Yu, W.; Alam, M.; Hassan, A.; Khan, A.S.; Ruane, A.; Rosenzweig, C.; Major, D.; Thurlow, J. Climate Change Risks and Food Security in Bangladesh. In Climate Change Risks and Food Security in Bangladesh; Routledge: London, UK, 2010; ISBN 978-1-84971-130-2. [Google Scholar]
- Uddin, K.; Khanal, N.; Chaudhary, S.; Maharjan, S.; Thapa, R.B. Coastal morphological changes: Assessing long-term ecological transformations across the northern Bay of Bengal. Environ. Chall. 2020, 1, 100001. [Google Scholar] [CrossRef]
- Abdullah, H.M.; Muraduzzaman; Islam, I.; Miah, G.; Rahman, M.; Rahman, A.; Ahmed, N.; Ahmed, Z. Spatiotemporal dynamics of new land development in Bangladesh coast and its potential uses. Remote Sens. Appl. Soc. Environ. 2019, 14, 191–199. [Google Scholar] [CrossRef]
- Islam, M.S. Sea-Level Changes in Bangladesh: The Last Ten Thousand Years; Asiatic Society of Bangladesh: Dhaka, Bangladesh, 2001. [Google Scholar]
- Alam, M. Bangladesh Country Case Study; National Adaptation Programme of Action (NAPA) Workshop: Thimphu, Bhutan, 2003; pp. 9–11. [Google Scholar]
- CEGIS and DoE. Final Report on Programmes Containing Measure to Facilitate Adaption to Climate Change of the Second National Communication Project of Bangladesh; Department of Environment: Dhaka, Bangladesh, 2011. [Google Scholar]
- Sarwar, G.M. Sea-Level Rise Along the Coast of Bangladesh. In Climate Change Adaptation Actions in Bangladesh; Springer Science and Business Media LLC: Berlin/Heidelberg, Germany, 2013; pp. 217–231. [Google Scholar]
- Brammer, H. Bangladesh’s dynamic coastal regions and sea-level rise. Clim. Risk Manag. 2014, 1, 51–62. [Google Scholar] [CrossRef] [Green Version]
- Khandker, H. Mean sea level in Bangladesh. Mar. Geod. 1997, 20, 69–76. [Google Scholar] [CrossRef]
- Khan, T.M.A.; Singh, O.P.; Rahman, M.S. Recent sea level and sea surface temperature trends along the Bangladesh coast in relation to the frequency of intense cyclones. Mar. Geod. 2000, 23, 103–116. [Google Scholar]
- Hoque, M.A.-A.; Ahmed, N.; Pradhan, B.; Roy, S. Assessment of coastal vulnerability to multi-hazardous events using geospatial techniques along the eastern coast of Bangladesh. Ocean Coast. Manag. 2019, 181, 104898. [Google Scholar] [CrossRef]
- Ahmed, N.; Howlader, N.; Hoque, M.A.-A.; Pradhan, B. Coastal erosion vulnerability assessment along the eastern coast of Bangladesh using geospatial techniques. Ocean Coast. Manag. 2021, 199, 105408. [Google Scholar] [CrossRef]
- Ahmed, A.; Woulds, C.; Drake, F.; Nawaz, R. Beyond the tradition: Using Fuzzy Cognitive Maps to elicit expert views on coastal susceptibility to erosion in Bangladesh. Catena 2018, 170, 36–50. [Google Scholar] [CrossRef]
- Rahman, A.F.; Dragoni, D.; El Masri, B. Response of the Sundarbans coastline to sea level rise and decreased sediment flow: A remote sensing assessment. Remote Sens. Environ. 2011, 115, 3121–3128. [Google Scholar] [CrossRef]
- Sarwar, G.M.; Woodroffe, C.D. Rates of shoreline change along the coast of Bangladesh. J. Coast. Conserv. 2013, 17, 515–526. [Google Scholar] [CrossRef] [Green Version]
- Navera, U.K.; Ahmed, S. Application of Landsat Imagery and Vegetation Index Property to Assess the Shoreline Changes Along Cox’s Bazar—Teknaf Coast. J. Eng. Sci. 2021, 12, 21–28. [Google Scholar] [CrossRef]
- Islam, A.; Hossain, S.; Hasan, T.; Murshed, S. Shoreline changes along the Kutubdia Island, south east Bangladesh using digital shoreline analysis system. Bangladesh J. Sci. Res. 2016, 27, 99–108. [Google Scholar] [CrossRef] [Green Version]
- Ministry of Water Resources, Government of the People’s Republic of Bangladesh. Coastal Zone Policy (CZPo). 2005. Available online: http://nda.erd.gov.bd/files/1/Publications/Sectoral%20Policies%20and%20Plans/Costal-Zone-Policy-2005.pdf (accessed on 18 February 2022).
- Zhang, G.P. Time series forecasting using a hybrid ARIMA and neural network model. Neurocomputing 2003, 50, 159–175. [Google Scholar] [CrossRef]
- Huang, N.E.; Shen, Z.; Long, S.R.; Wu, M.C.; Shih, H.H.; Zheng, Q.; Yen, N.-C.; Tung, C.C.; Liu, H.H. The empirical mode decomposition and the Hilbert spectrum for nonlinear and non-stationary time series analysis. Proc. R. Soc. Lond. Ser. A Math. Phys. Eng. Sci. 1998, 454, 903–995. [Google Scholar] [CrossRef]
- Huang, N.E.; Shen, Z.; Long, S.R. A New View of Nonlinear Water Waves: The Hilbert Spectrum. Annu. Rev. Fluid Mech. 1999, 31, 417–457. [Google Scholar] [CrossRef] [Green Version]
- Torres, M.E.; Colominas, M.A.; Schlotthauer, G.; Flandrin, P. A complete ensemble empirical mode decomposition with adaptive noise. In Proceedings of the 2011 IEEE International Conference on Acoustics, Speech and Signal Processing (ICASSP), Prague, Czech Republic, 22–27 May 2011; pp. 4144–4147. [Google Scholar]
- Colominas, M.A.; Schlotthauer, G.; Torres, M.E.; Flandrin, P. Noise-assisted EMD methods in action. Adv. Adapt. Data Anal. 2012, 4, 1250025. [Google Scholar] [CrossRef] [Green Version]
- Bagos, P.G.; Adam, M. On the Covariance of Regression Coefficients. Open J. Stat. 2015, 5, 680–701. [Google Scholar] [CrossRef] [Green Version]
- Hossain, A.; Gan, T.Y.; Baki, A.B.M. Assessing morphological changes of the Ganges River using satellite images. Quat. Int. 2013, 304, 142–155. [Google Scholar] [CrossRef]
- Anwar, S.; Rahman, K. The spatiotemporal shore morphological changes at east Bhola Island in Meghna Estuary of Bangladesh’s central coast. Reg. Stud. Mar. Sci. 2021, 47, 101937. [Google Scholar] [CrossRef]
- Anwar, M.S.; Takewaka, S. Analyses on phenological and morphological variations of mangrove forests along the southwest coast of Bangladesh. J. Coast. Conserv. 2014, 18, 339–357. [Google Scholar] [CrossRef]
- Toure, S.; Diop, O.; Kpalma, K.; Maiga, A.S. Shoreline detection using optical remote sensing: A review. ISPRS Int. J. Geo-Inf. 2019, 8, 75. [Google Scholar] [CrossRef] [Green Version]
- Islam, A.; Sato, T. Influence of Terrestrial Precipitation on the Variability of Extreme Sea Levels along the Coast of Bangladesh. Water 2021, 13, 2915. [Google Scholar] [CrossRef]
- Becker, M.; Papa, F.; Karpytchev, M.; Delebecque, C.; Krien, Y.; Khan, J.U.; Ballu, V.; Durand, F.; Le Cozannet, G.; Islam, A.K.M.S.; et al. Water level changes, subsidence, and sea level rise in the Ganges—Brahmaputra—Meghna delta. Proc. Natl. Acad. Sci. USA 2020, 117, 1867–1876. [Google Scholar] [CrossRef]
- CCC. Assessment of Sea Level Rise on Bangladesh Coast through Trend Analysis; Climate Change Cell (CCC), Department of Environment, Ministry of Environment and Forests: Dhaka, Bangladesh, 2016. [Google Scholar]
- Berg, P.M.V.D.; Moseley, C.; Haerter, J.O. Strong increase in convective precipitation in response to higher temperatures. Nat. Geosci. 2013, 6, 181–185. [Google Scholar] [CrossRef]
- Thompson, P.R.; Piecuch, C.G.; Merrifield, M.A.; McCreary, J.P.; Firing, E. Forcing of recent decadal variability in the Equatorial and North Indian Ocean. J. Geophys. Res. Oceans 2016, 121, 6762–6778. [Google Scholar] [CrossRef]
- Srinivasu, U.; Ravichandran, M.; Han, W.; Sivareddy, S.; Rahman, H.; Li, Y.; Nayak, S. Causes for the reversal of North Indian Ocean decadal sea level trend in recent two decades. Clim. Dyn. 2017, 49, 3887–3904. [Google Scholar] [CrossRef]
- Lee, S.-K.; Park, W.; Baringer, M.O.; Gordon, A.L.; Huber, B.; Liu, Y. Pacific origin of the abrupt increase in Indian Ocean heat content during the warming hiatus. Nat. Geosci. 2015, 8, 445–449. [Google Scholar] [CrossRef]
- Nieves, V.; Willis, J.K.; Patzert, W.C. Recent hiatus caused by decadal shift in Indo-Pacific heating. Science 2015, 349, 532–535. [Google Scholar] [CrossRef] [Green Version]
- Dangendorf, S.; Marcos, M.; Wöppelmann, G.; Conrad, C.; Frederikse, T.; Riva, R. A reconciled estimate of 20th century global mean sea level rise. Sea Level Rise 2018, 16, 6. [Google Scholar]
- Ericson, J.P.; Vorosmarty, C.; Dingman, S.L.; Ward, L.G.; Meybeck, M. Effective sea-level rise and deltas: Causes of change and human dimension implications. Glob. Planet. Chang. 2006, 50, 63–82. [Google Scholar] [CrossRef]
- Ostanciaux, É.; Husson, L.; Choblet, G.; Robin, C.; Pedoja, K. Present-day trends of vertical ground motion along the coast lines. Earth-Sci. Rev. 2012, 110, 74–92. [Google Scholar] [CrossRef] [Green Version]
- Mahamud, U.; Takewaka, S. Shoreline Change around a River Delta on the Cox’s Bazar Coast of Bangladesh. J. Mar. Sci. Eng. 2018, 6, 80. [Google Scholar] [CrossRef] [Green Version]


| Image Acquisition Date | Sensor Type | Tide Level (mm) | Image Resolution(m) | ||
|---|---|---|---|---|---|
| 9.00 am | 10.00 am | 11.00 am | |||
| 01/21/1989 | LANDSAT-4 TM | 854 | 700 | 620 | 30 |
| 11/08/1993 | LANDSAT-7 ETM | 1880 | 2239 | 2531 | 30 |
| 02/02/1996 | LANDSAT-7 ETM | 698 | 525 | 630 | 30 |
| 12/19/1999 | LANDSAT-7 ETM | 650 | 1068 | 1687 | 30 |
| 02/07/2001 | LANDSAT-7 ETM | NA | NA | NA | 30 |
| 01/28/2003 | LANDSAT-7 ETM | NA | NA | NA | 30 |
| 01/15/2004 | LANDSAT-7 ETM | 2342 | 2450 | 2224 | 30 |
| 01/17/2005 | LANDSAT-7 ETM | 2417 | 2530 | 2287 | 30 |
| 12/22/2006 | LANDSAT-7 ETM | 1036 | 670 | 400 | 30 |
| 12/25/2007 | LANDSAT-7 ETM | NA | 2560 | 2960 | 30 |
| 02/27/2008 | LANDSAT-7 ETM | 310 | 710 | NA | 30 |
| 12/17/2010 | LANDSAT-7 ETM | 258 | 250 | 213 | 30 |
| 12/22/2012 | LANDSAT-8 OLI | 340 | 320 | 305 | 30 |
| 12/20/2014 | LANDSAT-8 OLI | 444 | 440 | 412 | 30 |
| 12/25/2016 | LANDSAT-8 OLI | 380 | 360 | 320 | 30 |
| Month | 1983–1993 | 1993–2003 | 2003–2014 | 1983–2014 |
|---|---|---|---|---|
| January | 39.5 ** | −2.1 | 50.1 ** | 14.1 * |
| February | 31.2 ** | −7.2 | 43.6 ** | 9.7 * |
| March | 15.9 * | −14.73 | 47.57 ** | 5.71 |
| April | 15.35 * | −5.35 | 36.8 ** | 5.86 * |
| May | 21.42 * | −8.6 | 24.0 ** | 5.07 |
| June | 23.4 * | −6.5 | 11.32 ** | 0.78 |
| July | 30.1 * | 14.11 | −1.27 | 0.81 |
| August | 23.35 * | 1.37 | −2.89 | −0.64 |
| September | 32.8 ** | 5.39 | −1.4 | 5.02 * |
| October | 26.35 ** | 11.98 | 12.0 * | 3.97 |
| November | 9.9 | 1.76 | 13.18 | −0.09 |
| December | 14.95 | −0.421 | 28.7 * | 7.44 * |
| Yearly | 23.5 ** | −0.85 | 26.1 ** | 5.34 * |
| Years | Rate of Shoreline Change (mm/Year) | |||
|---|---|---|---|---|
| I (12.2 Km) | J (10.2 Km) | K (7.7 Km) | L (14.8 Km) | |
| 1989–1996 | +5.6 | −0.12 | −5.7 | −0.26 |
| 1996–2005 | +9.76 | +17.9 | +15.4 | +12.8 |
| 2005–2016 | −6.1 | +6.61 | −4.6 | −2.88 |
| 1989–2016 | +2.22 | +8.62 | +1.78 | +3.02 |
| +3.91 (average of all segments) | ||||
| Years | Segment-Wise Shoreline Rate of Change in mm/Year | ||||
|---|---|---|---|---|---|
| West Side | East Side | ||||
| A (7.2 Km) | B (5.3 Km) | C (7.2 Km) | E (12.2 Km) | F (7.5 Km) | |
| 1989–1996 | −7.70 | −4.40 | −12.00 | 1.80 | −0.80 |
| 1996–2005 | +5.00 | +2.40 | −3.00 | +0.80 | +2.60 |
| 2005–2016 | −14.30 | −5.50 | −7.00 | −3.10 | −14.30 |
| 1989–2016 | −6.16 | −2.58 | −6.96 | -0.53 | −5.17 |
| Average | −5.23 (west) | −2.85 (east) | |||
| −4.28 (average of all segments) | |||||
Publisher’s Note: MDPI stays neutral with regard to jurisdictional claims in published maps and institutional affiliations. |
© 2022 by the authors. Licensee MDPI, Basel, Switzerland. This article is an open access article distributed under the terms and conditions of the Creative Commons Attribution (CC BY) license (https://creativecommons.org/licenses/by/4.0/).
Share and Cite
Anwar, M.S.; Rahman, K.; Bhuiyan, M.A.E.; Saha, R. Assessment of Sea Level and Morphological Changes along the Eastern Coast of Bangladesh. J. Mar. Sci. Eng. 2022, 10, 527. https://0-doi-org.brum.beds.ac.uk/10.3390/jmse10040527
Anwar MS, Rahman K, Bhuiyan MAE, Saha R. Assessment of Sea Level and Morphological Changes along the Eastern Coast of Bangladesh. Journal of Marine Science and Engineering. 2022; 10(4):527. https://0-doi-org.brum.beds.ac.uk/10.3390/jmse10040527
Chicago/Turabian StyleAnwar, Md. Shibly, Kalimur Rahman, Md Abul Ehsan Bhuiyan, and Rupayan Saha. 2022. "Assessment of Sea Level and Morphological Changes along the Eastern Coast of Bangladesh" Journal of Marine Science and Engineering 10, no. 4: 527. https://0-doi-org.brum.beds.ac.uk/10.3390/jmse10040527