
An Improved Framework of Marine Major Function-Oriented Zoning in Advancing Ecosystem-Based Management

 ,
,
Abstract
:1. Introduction
2. Materials and Methods
2.1. Study Area
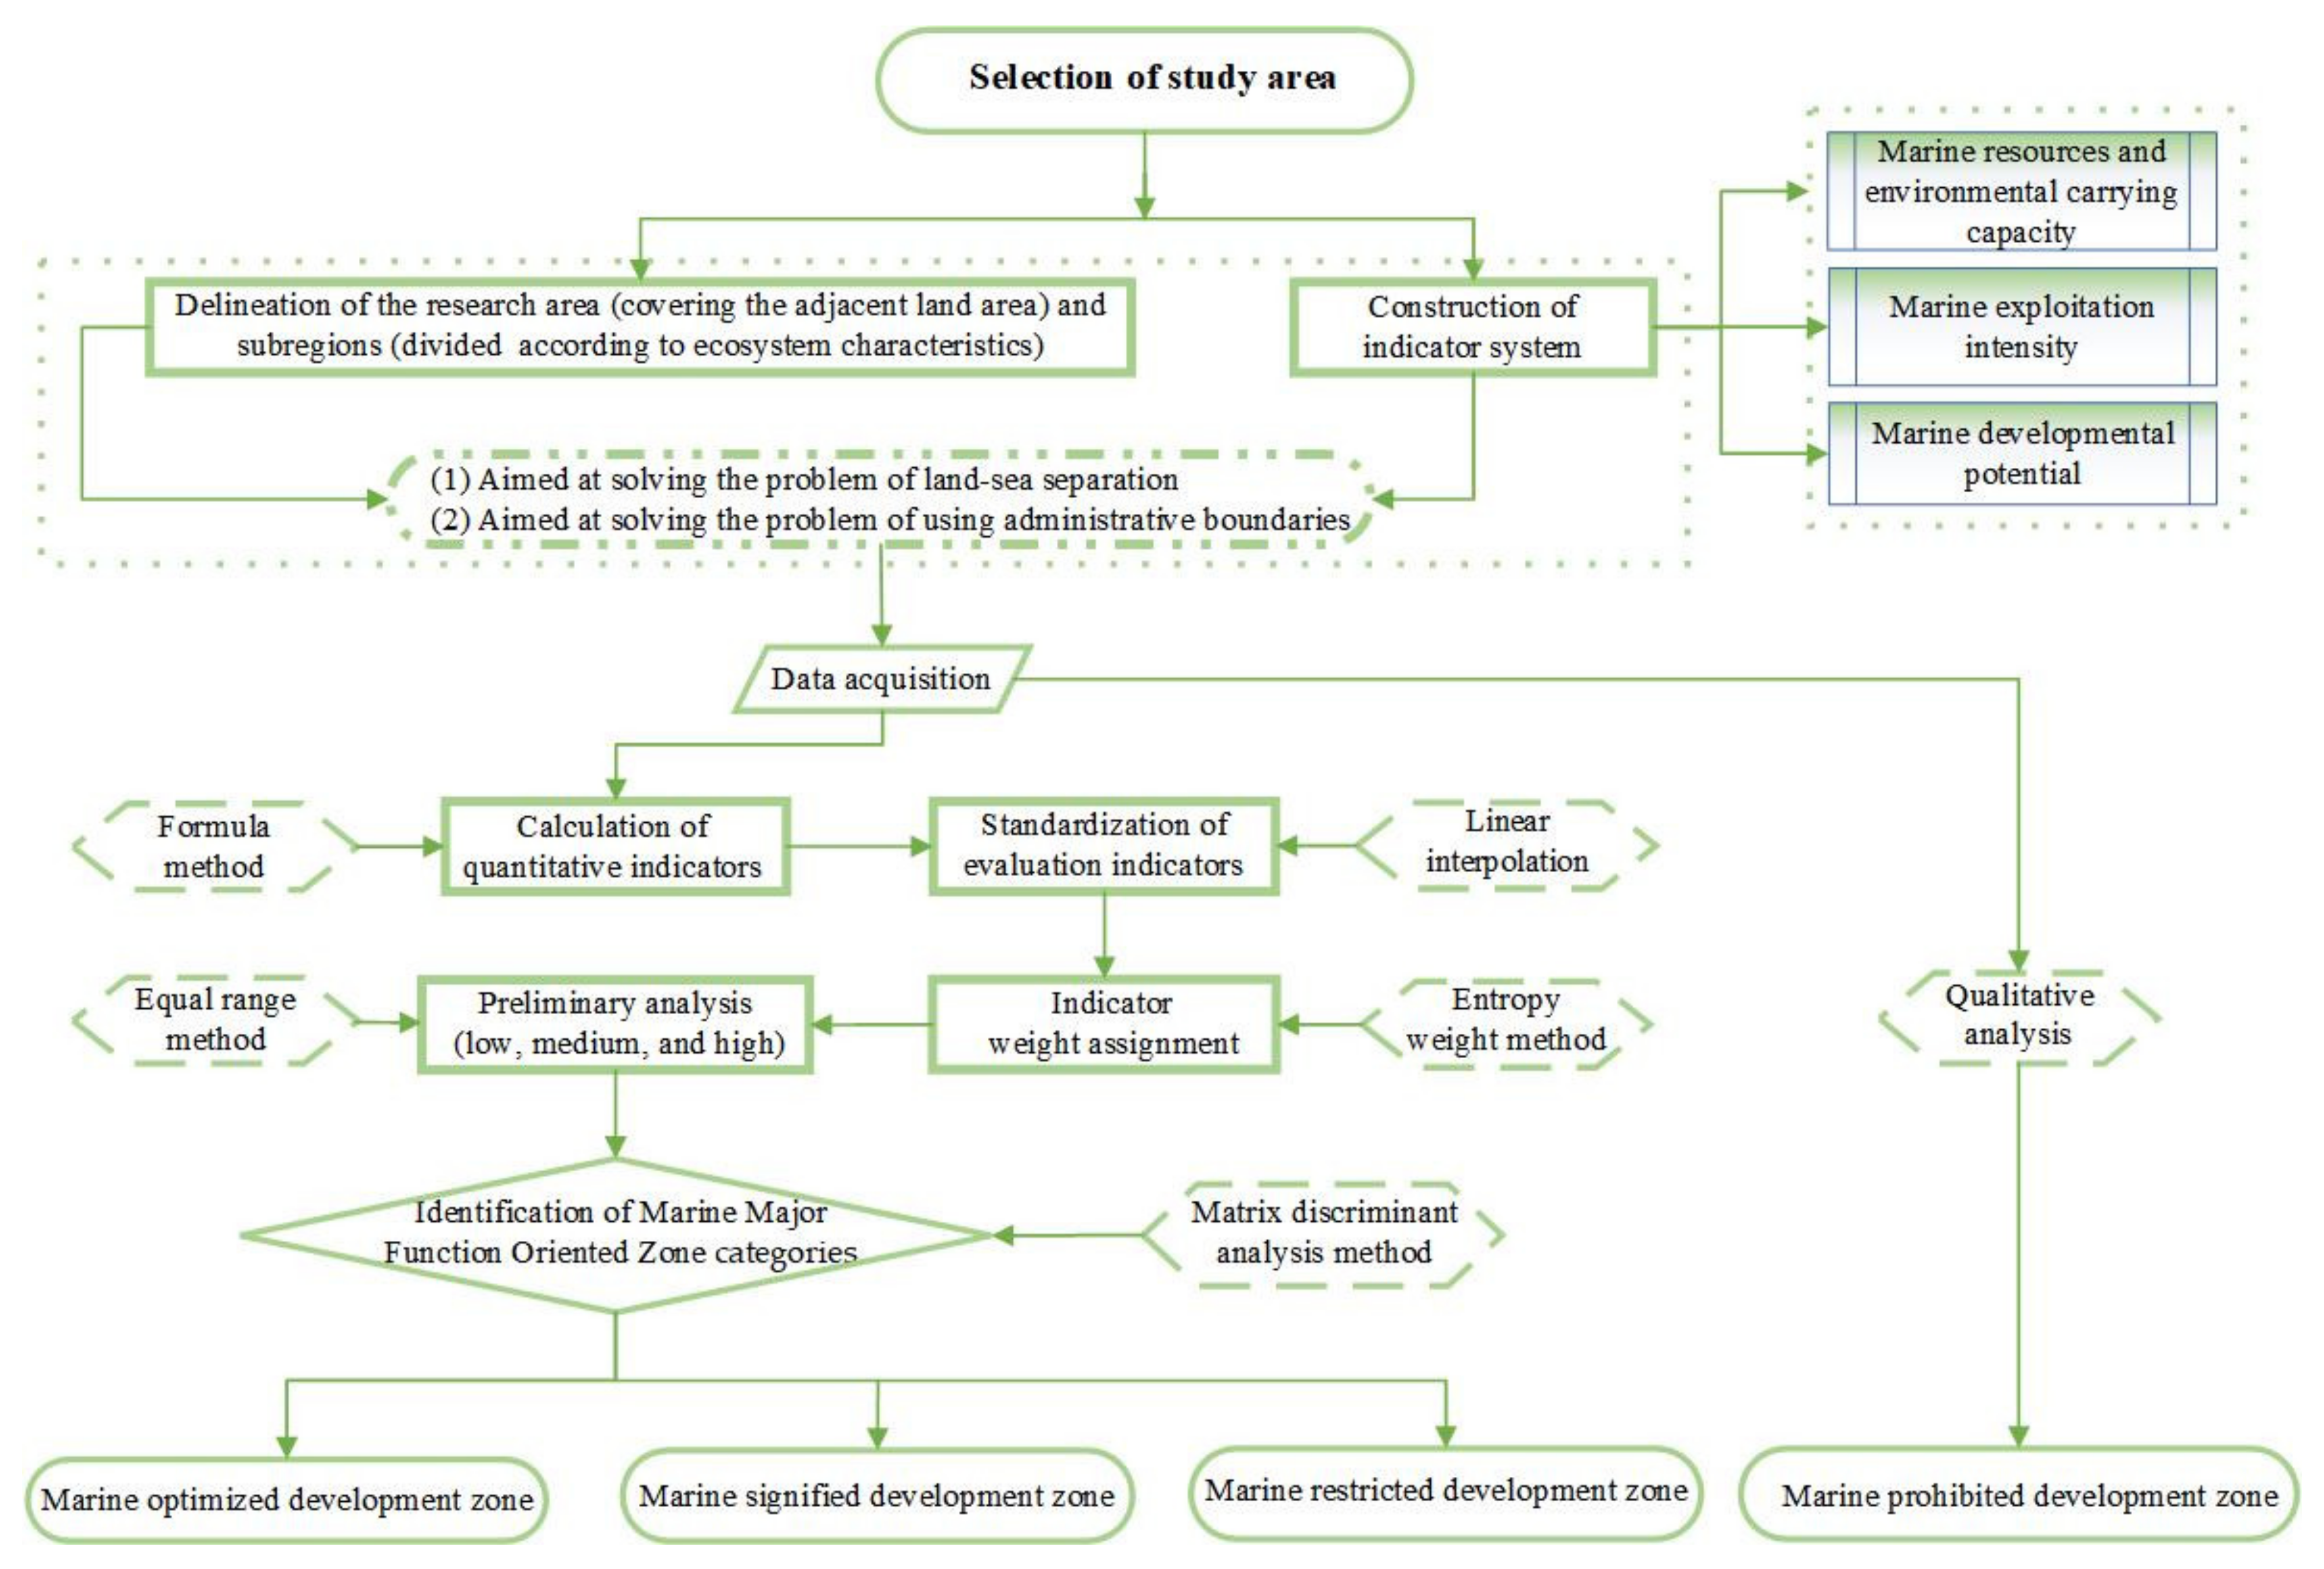
2.2. Research Methods and Framework
- (1)
- Marine optimized development zone: Areas with a high degree of sea area utilization, and a resource consumption that exceeds, or is about to exceed, the carrying capacity, where the marine economic structure must be adjusted, marine development and utilization activities must be optimized, and where marine resources and environmental problems are prominent.
- (2)
- Marine significant development zone: Sea areas with a good carrying capacity, a higher developmental potential, and prominent marine geographical advantages. Suitable for high-intensity, centralized development and utilization.
- (3)
- Marine restricted development zone: Sea areas with a weak carrying capacity. Marine development activities involve a large range of ecological risks, or the marine environment is polluted. Resources are seriously damaged and require restoration. These areas are not suitable for high-intensity, centralized development or utilization.
- (4)
- Marine forbidden development zone: National or provincial marine nature reserves, scenic spots, and military-restricted zones lawfully established within the sea area.
2.2.1. Delimitation of Research Area and Subregions
2.2.2. Selection and Calculation of Evaluation Indicators for Subregions

| Indicator | Code | Indicator Quantification | Evaluation Methods | Formulae | Data Sources | |
|---|---|---|---|---|---|---|
| Proportion of available shoreline | C11 | Reflects the potential carrying capacity of shorelines for future economic development and population agglomeration | Proportion of shoreline that can be used | Ld: Length of the shoreline in use Lt: Total length of the subregion shoreline | Extracted from remote sensing imagery | |
| Proportion of available beach resources | C12 | Reflects the potential carrying capacity of beaches for future economic development and population agglomeration | Proportion of beach that can be used | Sd: Area of the beach in use St: Total sea area of the subregion. | ||
| Aquatic product Production (i.e., Quantity of fish caught) | C21 | Reflects the sustainable supply capacity of marine life | Amount of fish caught by subregion at the evaluation period | Values obtained from the survey data of each station, and spatial interpolation in ArcGIS | --- | Survey data from the Investigation on Marine Environment and Resources across 13 bays of Fujian Province (Spring 2017) |
| Seawater environmental quality | C31 | Reflects the suitability of the coastal environment for human survival, quality of life, and development | Sum of the product of the marine area for each type of water quality and the standard value of each type of water quality, divided by the subregion area | Bs: Standard value of seawater quality for a given category Sp: Areas of seawater quality for a given category | ||
| Water quality compliance rate | C41 | Reflects the maximum amount of pollutants that can be absorbed by the seawater environment in a certain area while meeting the target value of the marine environment (i.e., the threshold for maintaining the ecological balance without exceeding the requirements of human health) | Proportion of the area meeting the water quality target, to the total area of the seawater control zones | Ni: The area of a given seawater quality category meeting the seawater quality standards in control zones Nt: Total area of the seawater control zones | ||
| Benthic organism diversity index | C51 | Reflects the ability of an ecosystem to maintain its natural attributes, biodiversity, and key ecological processes, while continuing to provide its service functions | After obtaining the diversity index of each station (C51i), C51 was obtained using spatial interpolation in ArcGIS | S: Number of species in the sample Pi: The ratio of the amount of species i to the total number of each species | ||
| Proportion of protected marine areas to total marine areas | C61 | Reflects the importance of typical ecosystems and habitats in a specific sea area | Proportion of protected marine areas to total marine areas of the subregion | Pa: Protected marine areas in the subregion Ta: Total sea areas in the subregion | Marine Functional Zoning of Fujian Province (2011–2020) | |
| Proportion of forested area to total land area | C71 | Reflects abundance of forest area or richness of forest resources in the subregion | Proportion of the vertical projection area of plants to the total subregion area | Fa: Vertical projection area of the forest La: Total subregion area | Extracted from remote sensing imagery | |
| Marine disaster risk index | C81 | Reflects the risk of loss resulting from various marine disasters, such as storm surges, waves, red tides, sea fogs, sea level rise, and coastal zone geological disasters | Product of disaster grade index and the economic intensity coefficient | Id: Disaster grade index kd: Economic intensity coefficient | Marine disaster Bulletin of Fujian Province in 2017 | |
| Direct economic loss attributed to disasters | C82 | Refers to the risk loss caused by marine disasters and marine accidents, reflecting the negative impact degree of marine disasters and marine accidents on people’s lives, and marine economic development in the subregion | Proportion of the subregion GDP to that of the superior administrative region, multiplied by the direct economic loss caused by disasters and accidents of the superior administrative region | GDPd: GDP of subregion GDPc: GDP of superior administrative region ELc: Direct economic loss caused by disasters and accidents in the superior administrative region | ||
| Utilization rate of sea areas | I11 | Reflects the development and utilization degree of sea areas | Proportion of areas with approved sea area user rights to the total sea area | Sq: Sea areas with approved used rights in the subregion Sx: Total subregion sea area | Granting data from the Marine Dynamic Management Center | |
| Reclamation intensity | I12 | Reflects the pressure intensity exerted by reclamation on coastal ecological environments | Proportion of reclamation areas to the total sea area | Sw: Reclamation areas of the subregion Sx: Total sea area of the subregion. | Extracted from remote sensing imagery | |
| Population density of the adjacent land area | I21 | Reflects the status of the human–land relationship (unit: persons·km−2) | Proportion of the total subregion population to the total subregion area | Pt: Total subregion population St: Total land area of the subregion | The Ocean Statistical Yearbooks of Quanzhou City and Putian City (2013–2017) | |
| Urbanization level | I22 | Reflects the development and utilization levels of the adjacent land area | Proportion of urban built-up areas to the available land area | Ct: Urban built-up area of the subregion St: Available land area of the subregion. | ||
| Marine economic development index | I31 | Reflects the current level and growth vitality of the marine economic development | Product of GOP per unit shoreline, and intensity coefficient for the average annual growth rate of GOP over the past five years | Lt: The total shoreline length of the subregion kGOP: Intensity coefficient corresponding to the average annual growth rate of the GOP over the past five years | ||
| Adjacent land economic development index | I41 | Reflects the levels of social and economic development, as well as growth vitality of adjacent land areas | Product of GDP per capita and intensity coefficient of the GDP average annual growth rate over the past five years | : Per capita GDP of the subregion KGDP: Intensity coefficient corresponding to the average annual growth rate of the GDP over the past five years | ||
| Port throughput | P11 | Reflects the traffic superiority of the sea area in the subregion | Proportion of subregion shoreline length to that of the superior administrative region, multiplied by the port throughput of the superior administrative region | Lt: Total shoreline length of the subregion Lc: Total shoreline length of the superior administrative region PTc: Port throughput of the superior administrative region | Master Plan of Meizhou Bay Port | |
| Berth density | P12 | Reflects the traffic superiority of the sea area in the subregion | Number of berths per shoreline | Nb: Number of berths Lt: Total length of the subregion shoreline | ||
| Passenger volume— road and rail transport | P21 | Reflects the traffic superiority of the adjacent land area in the subregion | Proportion of the highway/railway length in the subregion to that in the superior administrative region, multiplied by the highway/railway passenger volume in the superior administrative region | lP: The highway/railway length in the subregion lc: Highway/railway length in the superior administrative region PVc: Highway/railway passenger volume in the superior administrative region | Statistical Bulletin on National Economic and Social Development of Quanzhou City and Putian City in 2017 | |
| Freight volume— road and rail transport | P22 | Reflects the traffic superiority of the adjacent land area in the subregion | Proportion of the highway/railway length in the subregion to that in the superior administrative region, multiplied by the highway/railway freight volume in the superior administrative region | lP: Highway/railway length in the subregion lc: Highway/railway length in the superior administrative region FVc: Highway/railway freight volume in the superior administrative region | ||
| Research and development (R&D) expenditure as a proportion of GDP | P31 | Reflects the support of science and technology for marine development | Proportion of the subregion population to the population of the superior administrative region, multiplied by R&D expenditure as a proportion of superior administrative region GDP | Pt: Total subregion population Pc: Total population of the superior administrative region RDc: R&D expenditure as a proportion of GDP for the superior administrative region | The Ocean Statistical Yearbooks of Quanzhou City and Putian City in 2017 | |
| Number of patents certified | P32 | Reflects the development potential of marine science and technology | Proportion of subregion population to that of the superior administrative region, multiplied by the number of patents certified in the superior administrative region | Pt: Total subregion population Pc: Total population of the superior administrative region PDc: Number of patents certified in the superior administrative region. | ||
| Capacity to treat the wastewater | P41 | Reflects the amount of wastewater treated by wastewater treatment facilities in the subregion | Proportion of subregion GDP of that of the superior administrative region, multiplied by the wastewater treatment capacity in the superior administrative region | GDPd: GDP of the subregion GDPc: GDP of the superior administrative region WCc: Capacity to treat the wastewater of the superior administrative region. | The Ocean Statistical Yearbook of Quanzhou City and Putian City in 2017 | |
| Discharge of industrial wastewater directly into environment | P42 | Reflects the amount of industrial wastewater discharged from the enterprise through all outlets, excluding that discharged into the urban sewage treatment plant | Proportion of subregion GDP to that of the superior administrative region, multiplied by the amount of wastewater directly output into the environment of the superior administrative region | GDPd: GDP of the subregion GDPc: GDP of the superior administrative region DWc: Amount of wastewater directly output into the environment of the superior administrative region | Statistical Bulletin on National Economic and Social Development of Quanzhou City and Putian City in 2017. | |
Data Sources and Processing
Standardization of Evaluation Indicators
2.2.3. Determination of MMFOZ Categories
3. Results
3.1. Delimitation Results of the Research Area and Subregions
- (1)
- Research area: The sea area was divided according to the boundaries of the Meizhou Bay ecosystem (i.e., linking the bay mouth and the island cape), while the land area was divided according to the catchment area that discharges into the bay, including both the watershed catchment unit as extracted by DEM from remote sensing images and the ridge line were considered as the research boundaries of the land area (Figure 3a).
- (2)
- Subregions: Division of land subregions was determined using the boundaries of watershed catchment units in the coastal zones (Figure 3a), as well as ridge lines and main roads (Figure 3b); whereas the division of the marine subregions was determined by physical factors of Meizhou Bay, including the trend of tidal currents (Figure 3c), channel trends (Figure 3d), water depth (Figure 3e), and the boundaries of MPAs (Figure 3f). Overall, the study area was divided into nine subregions (Figure 4).
3.2. Calculation of Indicator Values and Weights
- (1)
- Among the 10 indicators in the criterion layer of carrying capacity (Table 5), C61 was the highest weighted (proportion of protected marine area to total marine area, 0.403), followed by C71 (proportion of forested area to total land area, 0.187) and C21 (aquatic product production, 0.148). Weight values of all other indicators were <0.1.
- (2)
- Among the 6 indicators in the criterion layer of exploitation intensity (Table 5), I31 was assigned the highest weight (marine economic development index, 0.353); whereas I41 was assigned the lowest weight (adjacent land economic development index, 0.071). Weight values of all other indicators were between 0.1–0.2, with no significant differences observed.
- (3)
- Among the eight indicators in the criterion layer of developmental potential (Table 5), P12 was assigned the highest weight (berth density, 0.283). Conversely, P12 (discharge of industrial wastewater directly into the environment, 0.017) and P11 (port throughput, 0.068) were assigned the lowest weights. Weight values of all other indicators were between 0.1–0.2, with no significant differences among them.
- (1)
- For S1, I31(marine economic development index), I12 (reclamation intensity), and I11 (utilization rate of sea areas) were assigned the highest scores under the dimension of exploitation intensity. These were followed by C71 (proportion of forested area to total land area) and C21 (aquatic product production) under the dimension of carrying capacity. All other indicators were assigned relatively low scores. This is attributed to S1 being rich in natural resources, and land-based economic development promoting the thriving coastal areas. In general, S1 scored higher in the two dimensions of exploitation intensity and carrying capacity.
- (2)
- The scores for most indicators of S3, S4, S5, and S8 were similar. In general, the indicator scores under the dimension of exploitation intensity were higher, while those of the other two dimensions were lower. This is attributed to the poor natural resources of these subregions that contribute less to socio-economic prosperity. The scores of all indicators for S2 were generally low, and no outstanding advantages were observed across the three dimensions.
- (3)
- For S6, I31 (marine economic development index) scored the highest under exploitation intensity, followed by C21 (aquatic product production), and C71 (proportion of forested area to total land area). This is because S6 has a large land area, and is capable of supporting greater populations and industries. Furthermore, S6 scored higher in indicator P41 (capacity to treat the wastewater), P32 (number of patents certified), P31 (R&D expenditure as a proportion of GDP), and P2 (adjacent land transportation superiority), indicating that S6 maintained superior developmental potential.
- (4)
- Considering the greater number of berths and shorter shorelines of the Douwei Port Area in S7, the P12 score (berth density) in this subregion was much higher than elsewhere. Further, the high I22 (urbanization level) score in S7 benefitted from the development of the Douwei Port Area.
- (5)
- For all 9 subregions, only S9 contained protected areas; thus, only S9 had a score for C61 (proportion of protected marine area to total marine area), while the scores for all other subregions were 0.
- (6)
- The three negative indicators—C81 (marine disaster risk index), C82 (direct economic loss attributed to disasters), and P42 (discharge of industrial wastewater directly into the environment)—all maintained low scores, with no significant differences among them. Accordingly, these three indicators contributed less to the comprehensive value of their criterion layer.
3.3. Comprehensive Results for Identifying the Functions of Subregions
3.3.1. Matrix Discrimination
3.3.2. Comprehensive Evaluation Results
4. Discussion
4.1. Ecological Elements-Based Zoning Method for Small-Scale Sea Areas
4.2. Indicator Framework Based on Evaluation of Land and Sea Pressures
4.3. Tools for the Formulation of Differentiated Management Objectives
- (1)
- In marine optimized development zones, the local governments should: improve the spatial layout of coastal areas; actively develop a modern port service industry; promote the transformation of marine industrial structure to a high-end, high-efficiency, and high-added value stage; and develop green industries, as well as circular economic systems.
- (2)
- In marine significant development zones, the local petrochemical and port logistics industries should adopt net zero emissions policies throughout the entire production process (raw materials to finished products). They should also promote links between up- and downstream industrial chains, support the construction of port logistics infrastructure, enhance the port storage and transportation capacity, as well as construct intelligent (digital) ports.
- (3)
- In marine restricted development zones, local governments should promote the integration of marine industrial structural, limit the scale of industrial and urban construction, and restore marine ecology while enhancing leisure spaces for coastal tourism.
- (4)
- No prohibited marine development zones were identified in the present study area; however, several recommendations can still be provided here as reference for other marine areas: Strict limitations on pollutant discharge are necessary, in addition to providing guidance on the discharge of land-based pollutants into far-shore areas outside of the bay. Activities that have a significant impact on the reproduction and growth of marine organisms should be prohibited, so as to protect coastal wetlands, mangroves, and other vital biological habitats. Changes to the topography and geomorphology of the coast, seabed, and other natural environments must similarly be prohibited without authorization.
4.4. Limitations and Future Directions
5. Conclusions
Author Contributions
Funding
Informed Consent Statement
Acknowledgments
Conflicts of Interest
References
- Xu, K.; Wang, J.; Wang, J.; Wang, X.; Chi, Y.; Zhang, X. Environmental function zoning for spatially differentiated environmental policies in China. J. Environ. Manag. 2020, 255, 109485. [Google Scholar] [CrossRef] [PubMed]
- Agardy, T. Information needs for marine protected areas: Scientific and societal. Bull. Mar. Sci. 2000, 66, 875–888. [Google Scholar]
- Agardy, T. Marine Protected Areas and Ocean. Conservation; R. E. Landes Co.: Austin, TX, USA, 1997. [Google Scholar]
- Day, V.; Paxinos, R.; Emmett, J.; Wright, A.; Goecker, M. The Marine planning framework for South Australia: A new ecosystem-based zoning policy for marine management. Mar. Pol. 2008, 32, 535–543. [Google Scholar] [CrossRef]
- Allison, G.W.; Lubchenco, J.; Carr, M. Marine reserves are necessary but not sufficient for marine conservation. Ecol. Appl. 1998, 8, S79–S92. [Google Scholar] [CrossRef]
- Borja, A.; Elliott, M.; Snelgrove, P.V.R.; Austen, M.C.; Berg, T.; Cochrane, S.; Carstensen, J.; Danovaro, R.; Greenstreet, S.; Heiskanen, A.-S.; et al. Bridging the gap between policy and science in assessing the health status of marine ecosystems. Front. Mar. Sci. 2016, 3, 175. [Google Scholar] [CrossRef] [Green Version]
- Douvere, F. Marine Spatial Planning: Concepts, Current Practice and Linkages to Other Management Approaches. Ph.D. Thesis, Political Science, Ghent University, Ghent, Belgium, May 2010. [Google Scholar]
- Ehler, C. Two decades of progress in Marine Spatial Planning. Mar. Policy. 2020, 132, 104134. [Google Scholar] [CrossRef]
- Arbo, P.; Thủy, P.T.T. Use conflicts in marine ecosystem-based management—The case of oil versus fisheries. Ocean. Coast. Manag. 2016, 122, 77–86. [Google Scholar] [CrossRef] [Green Version]
- Ehler, C.; Douvere, F. Marine Spatial Planning: A Step-By-Step Approach toward Ecosystem-Based Management, Intergovernmental Oceanographic Commission and Man and the Biosphere Programme. IOC Manual and Guides, No 53, ICAM Dossier, No 6. Paris: UNESCO. 2009. Available online: https://unesdoc.unesco.org/ark:/48223/pf0000186559 (accessed on 1 May 2009).
- Rempis, N.; Tsilimigkas, G. Marine spatial planning on Crete Island, Greece: Methodological and implementation issues. J. Spat. Sci. 2021, 2, 1–20. [Google Scholar] [CrossRef]
- Rempis, N.; Alexandrakis, G.; Tsilimigkas, G.; Kampanis, N. Coastal use synergies and conflicts evaluation in the framework of spatial, development and sectoral policies. J. Manag. 2018, 166, 40–51. [Google Scholar] [CrossRef]
- Kyriazi, Z. From identification of compatibilities and conflicts to reaching marine spatial allocation agreements. Review of actions required and relevant tools and processes. Ocean. Coast. Manag 2018, 166, 103–112. [Google Scholar] [CrossRef]
- Ehler, C.; Douvere, F. Visions for a Sea Change. Report of the First International Workshop on Marine Spatial Planning. Intergovernmental Oceanographic Commission and Man and the Biosphere Programme; IOC Manual and Guides: Paris, France, 2006. [Google Scholar] [CrossRef]
- Foley, M.M.; Halpern, B.S.; Micheli, F.; Armsby, M.H.; Caldwell, M.R.; Crain, C.M.; Prahler, E.; Rohr, N.; Sivas, D.; Beck, M.W.; et al. Guiding ecological principles for marine spatial planning. Mar. Policy 2010, 34, 955–966. [Google Scholar] [CrossRef]
- Depellegrin, D.; Galparsoro, I.; Pınarbaşı, K. Operationalizing ecosystem services in support of ecosystem-based marine spatial planning. Ocean. Coast. Manag. 2020, 198, 105346. [Google Scholar] [CrossRef]
- Brown, M.G.; Quinn, J.E. Zoning does not improve the availability of ecosystem services in urban watersheds. A case study from Upstate South Carolina, USA. Ecosyst. Serv. 2018, 34, 254–265. [Google Scholar] [CrossRef]
- Fanny, D.; Charles, N.E. International workshop on marine spatial planning, UNESCO, Paris, 8–10 November 2006. Mar. Policy 2007, 31, 582–583. [Google Scholar] [CrossRef]
- Manea, E.; Bianchelli, S.; Fanelli, E.; Danovaro, R.; Gissi, E. Towards an ecosystem-based marine spatial planning in the deep Mediterranean Sea. Sci. Total Environ. 2020, 715, 136884. [Google Scholar] [CrossRef]
- Domínguez-Tejo, E.; Metternicht, G.; Johnston, E.; Hedge, L. Marine spatial planning advancing the ecosystem-based approach to coastal zone management: A review. Mar. Pol. 2016, 72, 115–130. [Google Scholar] [CrossRef]
- Domínguez-Tejo, E.; Metternicht, G. An ecosystem-based approach and Bayesian modelling to inform coastal planning: A case study of Manly, Australia. Environ. Sci. Pol. 2019, 101, 72–86. [Google Scholar] [CrossRef]
- Douvere, F. The importance of marine spatial planning in advancing ecosystem-based sea use management. Mar. Pol. 2008, 32, 762–771. [Google Scholar] [CrossRef]
- Gilliland, P.M.; Laffoley, D. Key elements and steps in the process of developing ecosystem-based marine spatial planning. Mar. Pol. 2008, 32, 787–796. [Google Scholar] [CrossRef]
- Meng, W.; Hu, B.; Liu, B.; Zhou, J. Marine ecosystem-based management: Definition, principles, framework and practice. Adv. Earth Sci. 2016, 31, 461–470. (In Chinese) [Google Scholar]
- Wei, D.; Feng, A.; Huang, J. Analysis of ecological protection effect based on functional zoning and spatial management and control. Int. J. Geoheritage Parks 2020, 8, 166–172. [Google Scholar] [CrossRef]
- Sas, E.; Fischhendler, I.; Portman, M.E. The demarcation of arbitrary boundaries for coastal zone management: The Israeli case. J. Environ. Manag. 2010, 91, 2358–2369. [Google Scholar] [CrossRef]
- Foley, M.M.; Armsby, M.H.; Prahler, E.E.; Caldwell, M.R.; Erickson, A.L.; Kittinger, J.N.; Crowder, L.B.; Levin, P.S. Improving ocean management through the use of ecological principles and integrated ecosystem assessments. BioScience 2013, 63, 619–631. [Google Scholar] [CrossRef] [Green Version]
- Crowder, L.; Norse, E. Essential ecological insights for marine ecosystem-based management and marine spatial planning. Mar. Pol. 2008, 32, 772–778. [Google Scholar] [CrossRef]
- Liu, Y.; Li, T.; Zhao, W.; Wang, S.; Fu, B. Landscape functional zoning at a county level based on ecosystem services bundle: Methods comparison and management indication. J. Environ. Manag. 2019, 249, 109315. [Google Scholar] [CrossRef]
- O’Hagan, A.M.; Paterson, S.; Le Tissier, M. Addressing the tangled web of governance mechanisms for land-sea interactions: Assessing implementation challenges across scales. Mar. Pol. 2020, 112, 103715. [Google Scholar] [CrossRef]
- Giebels, D.; Buuren, A.V.; Edelenbos, J. Ecosystem-based management in the Wadden Sea: Principles for the governance of knowledge. J. Sea Res. 2013, 82, 176–187. [Google Scholar] [CrossRef]
- Kelly, C.; Gray, L.; Shucksmith, R.; Tweddle, J.F. Review and evaluation of marine spatial planning in the Shetland Islands. Mar. Policy 2014, 46, 152–160. [Google Scholar] [CrossRef] [Green Version]
- Xu, W.; Li, X.; Pimm, S.L.; Hull, V.; Zhang, J.; Zhang, L.; Xiao, Y.; Zheng, H.; Ouyang, Z. The effectiveness of the zoning of China’s protected areas. Biol. Conserv. 2016, 204, 231–236. [Google Scholar] [CrossRef]
- Luan, W.; Wang, H.; Yang, Y. Implementation system of Marine function zoning version 4.0. China Ocean. News 2017, 002. (In Chinese) [Google Scholar]
- Chung, L.L.W. The economics of land-use zoning: A literature review and analysis of the work of Coase. Town Plan. Rev. 1994, 65, 77–98. [Google Scholar] [CrossRef]
- Munroe, D.K.; Croissant, C.; York, A.M. Land use policy and landscape fragmentation in an urbanizing region: Assessing the impact of zoning. Appl. Geogr. 2005, 25, 121–141. [Google Scholar] [CrossRef]
- Fan, J. Draft of major function-oriented zoning of China. Acta Geogr. Sin. 2015, 70, 186–201. (In Chinese) [Google Scholar]
- Fang, C.; Liu, K.; Wan, C. The connotation of marine spatial planning system building in Chinese ecological civilization. Mar. Develop. Manag. 2017, 34, 89–93. (In Chinese) [Google Scholar]
- Zhu, C.; Ma, X.; Meng, Z.; Qiu, F. Regional Major Function Oriented Zoning-Theory, Method; Empirical; Science Press: Beijing, China, 2007; p. 18. (In Chinese) [Google Scholar]
- Xu, H.; Ding, D.; Ye, S.; Shi, H. Some key issues on marine major function- oriented zone planning. Ocean. Dev. Manag. 2008, 25, 52–54. (In Chinese) [Google Scholar]
- He, G.; Wang, X.; Zhao, R.; Xu, C.; Song, W. Research on the method of China’s marine major function-oriented zoning. Mar. Sci. Bull. 2010, 29, 334–341. (In Chinese) [Google Scholar]
- Li, D.; Zhao, R.; Song, W. Research on the technical method of offshore marine major function- oriented zoning. Mar. Environ. Sci. 2010, 29, 939–944. (In Chinese) [Google Scholar]
- Shi, H.; Zheng, W.; Ding, D. Indicator system and model of marine major function-oriented zoning of coastal zone. Ocean. Dev. Manag. 2009, 26, 88–96. (In Chinese) [Google Scholar]
- Zhao, Z.; Liu, R.; Ma, Y.; Sun, W. Remote sensing monitoring and analysis of coastline changes in Meizhou Bay since the last 30 years. Coast. Eng. 2013, 32, 19–27. (In Chinese) [Google Scholar]
- Mu, R. Principal Coastal Functional Zoning Based on Multidimensional Decision Making (MDDM). Ph.D. Thesis, Xiamen University, Xiamen, China, 2013. (In Chinese). [Google Scholar]
- Technical Regulation for Division of Marine Major Function-Oriented Zone; State Oceanic Administration [SOA]: Beijing, China, 2011. (In Chinese)
- PEMSEA. Partnerships in Environmental Management for the Seas of East Asia (1994–2010): A Regional Mechanism Facili-tating Sustainable Environmental Benefits in River Basins, Coasts, Islands and Seas. PEMSEA IEC Material; Global Environment Facility/United Nations Development Program/International Maritime Organization Regional Program on Building Partnerships for the Seas of East Asia (PEMSEA): Quezon City, Philippines, 2007. [Google Scholar]
- Environmental Protection Department, The Government of the Hong Kong Special Administrative Region, Annual Marine Water Quality Reports in Hongkong. 2020. Available online: https://www.epd.gov.hk/epd/english/environmentinhk/water/hkwqrc/waterquality/marine-2.html (accessed on 28 December 2021).
- Asian Development Bank (ADB). Key Indicators for Asia and the Pacific. 2021. Available online: https://www.adb.org/publications/key-indicators-asia-and-pacific-2021 (accessed on 28 December 2021).
- United Nations. The 2030 Agenda for Sustainable Development. 2018. Available online: https://sdgs.un.org/goals (accessed on 25 September 2015).
- Research Group of Institute of Land and Regions; Institute of Macroeconomic Research; National Development and Reform Commission. Preliminary study on the division and classification policy of major function-oriented zone in China. Macroecon. Res. 2007, 4, 3–10. (In Chinese) [Google Scholar]
- Li, S.; Jay, S. Transboundary marine spatial planning across Europe: Trends and priorities in nearly two decades of project work. Mar. Pol. 2020, 118, 104012. [Google Scholar] [CrossRef]
- Chinese Communist Party Central Committee. The Deepening Reform Program for Party and State Institutions. 3rd Plenary Meeting of the 19 th Central Committee. 2018. Available online: http://www.gov.cn/zhengce/2018-03/04/content_5270704.htm (accessed on 8 January 2020). (In Chinese)
- Gu, Y.; Wu, Y.; Liu, J.; Xu, M.; Zuo, T. Ecological civilization and government administrative system reform in China. Resour. Conserv. Recycl. 2020, 155, 104654. [Google Scholar] [CrossRef]
- Day, J. The need and practice of monitoring, evaluating and adapting marine planning and management—lessons from the Great Barrier Reef. Mar. Pol. 2008, 32, 823–831. [Google Scholar] [CrossRef]
- Li, Z. Constructing the pattern of marine development of “one-belt, nine-zones and multi-shot”—Interpretation of “National Planning for Marine Major Function-Oriented Zone”. China Econ. Trade Herald J. 2015, 28, 39. (In Chinese) [Google Scholar]
- Tallis, H.; Ferdana, Z.; Gray, E. Linking terrestrial and marine conservation planning and threats analysis. Conserv. Biol. 2007, 22, 120–130. [Google Scholar] [CrossRef]
- Yang, Y. Research on the Mechanism of Integrated Control for Land-Sea Transboundary Pollution in China. Ph.D. Thesis, Dalian Maritime University, Dalian, China, 2020. (In Chinese). [Google Scholar]
- Alam, W.; Xiangmin, X.; Ahamed, R. Protecting the marine and coastal water from land-based sources of pollution in the northern Bay of Bengal: A legal analysis for implementing a national comprehensive act. Environ. Chall. 2021, 4, 100154. [Google Scholar] [CrossRef]
- Görgün, E.; Aydın, A.F.; Çitil, E.T.; Kınacı, C. National sectoral plans aiming to control land based sources of pollution for the Mediterranean Sea coast in Turkey. Desalination 2007, 226, 56–65. [Google Scholar] [CrossRef]
- Vo, S.T.; Pernetta, J.C.; Paterson, C.J. Lessons learned in coastal habitat and land-based pollution management in the South China Sea. Ocean. Coast. Manag. 2013, 85B, 230–243. [Google Scholar] [CrossRef]
- Kroll, F.; Mueller, F.; Haase, D.; Fohrer, N. Rural-urban gradient analysis of ecosystem services supply and demand dynamics. Land Use Pol. 2012, 29, 521–535. [Google Scholar] [CrossRef]
- Pan, Z.; He, J.; Liu, D.; Wang, J.; Guo, X. Ecosystem health assessment based on ecological integrity and ecosystem services demand in the middle reaches of the Yangtze River. Sci. Total Environ. 2021, 774, 144837. [Google Scholar] [CrossRef]
- Hassler, B.; Gee, K.; Gilek, M.; Luttmann, A.; Morf, A.; Saunders, F.; Stalmokaite, I.; Strand, H.; Zaucha, J. Collective action and agency in Baltic Sea marine spatial planning: Transnational policy coordination in the promotion of regional coherence. Mar. Pol. 2018, 92, 138–147. [Google Scholar] [CrossRef]


| Criterion Layer | Impact Factors | Measurement Standards | Data Source |
|---|---|---|---|
| Marine physical characteristics | Coastline | Serves as the sea–land boundary | Marine Functional Zoning of Fujian Province (2011–2020) |
| Channel trend | Serves as an impact factor of the delimitation of subregions’ boundaries | Master Plan of Meizhou Bay Port | |
| Trend of tidal current (velocity, course) | Sharp changes of the flow direction and velocity of the tidal current serve as an impact factor | The survey report of 13 bays in Fujian Province | |
| Water depth | Serves as an impact factor | The survey report of 13 bays in Fujian Province | |
| Typical ecosystem or protected areas | Typical ecosystem or protected area boundaries serve as an impact factor | Fujian Coastal Marine Environmental Function Zoning (2011–2020) | |
| Land physical characteristics | Catchment line | Serves as an impact factor | Extracted from remote sensing imagery by digital elevation model (DEM) |
| Ridge line | Serves as an impact factor | Extracted from remote sensing imagery | |
| Main road | Serves as an impact factor | Extracted from remote sensing imagery |
| Criterion Layer | Indicator Layer | Indicator | Indicator Code | Reference | Measurement Standards |
|---|---|---|---|---|---|
| Marine resources and environmental carrying capacity | C1—Available marine spatial resources | Proportion of available shoreline | C11 | PEMSEA [47] | Positive indicator—Higher scores indicate richer resources. |
| Proportion of available beach resources | C12 | ||||
| C2—Biological resources | Aquatic product production (i.e., quantity of fish caught) | C21 | |||
| C3—Marine environmental quality * | Seawater environmental quality | C31 | Positive indicator—Higher scores indicate better environmental quality | ||
| C4—Marine environmental capacity * | Water quality compliance rate | C41 | Annual Marine Water Quality Reports in Hong Kong [48] | Positive indicator—Higher scores indicate more abundant environmental capacity | |
| C5—Status of marine ecosystem health | Benthic organisms diversity index | C51 | PEMSEA [47] | Positive indicator—Higher scores indicate healthier marine ecosystems | |
| C6—Marine ecosystem importance | Proportion of protected marine area to total marine area | C61 | Key Indicators for Asia and the Pacific [49] | Positive indicator—Higher scores indicate more important the marine ecosystems | |
| C7—Land ecosystem importance | Proportion of forested area to total land area | C71 | |||
| C8—Marine disaster risk level | Marine disaster risk index (Product of disaster grade index and economic intensity coefficient) | C81 | Technical regulation for division of MMFOZ [46] | Negative indicator—Higher scores indicate greater risk | |
| Direct economic loss attributed to disasters | C82 | PEMSEA [47], Key Indicators for Asia and the Pacific [49], Indicator of SDG11 [46] | |||
| Marine exploitation intensity | I1—Sea area utilization degree | Utilization rate of sea areas | I11 | Technical regulation for division of MMFOZ [46] | Positive indicator—Higher scores indicate greater developmental intensity |
| Reclamation intensity | I12 | ||||
| I2—Adjacent land developmental intensity * | Population density of the adjacent land area | I21 | PEMSEA [47], Technical regulation for division of MMFOZ [46] | ||
| urbanization level | I22 | ||||
| I3—Marine economy level | Marine economic development index (product of gross ocean product (GOP) per unit shoreline and intensity coefficient of average annual growth rate of GOP) | I31 | Technical regulation for division of MMFOZs [46] | Positive indicator—Higher scores indicate a stronger economy | |
| I4—Adjacent land regional economy level * | Adjacent land economic development index (product of GDP per capita and intensity coefficient of average annual GDP growth rate) | I41 | PEMSEA [47], Technical regulation for division of MMFOZ [46] | ||
| Marine developmental potential | P1—Maritime transportation superiority | Port throughput | P11 | Technical regulation for division of MMFOZ [46] | Positive indicator—Higher scores indicate superior transportation status |
| Berth density | P12 | ||||
| P2—Adjacent land transportation superiority * | Passenger volume—road and rail transport | P21 | Indicator of SDG 9 [50] | ||
| Freight volume—road and rail transport | P22 | ||||
| P3—Innovation ability of marine science and technology * | Research and development (R&D) expenditure as a proportion of GDP | P31 | Positive indicator—Higher scores indicate stronger innovation ability. | ||
| Number of patents certified | P32 | Technical regulation for division of MMFOZ [46] | |||
| P4—Ability to control land-based pollutants entering the sea * | Capacity to treat wastewater | P41 | Positive indicator—Higher scores indicate stronger control ability | ||
| Discharge of industrial wastewater directly into environment | P42 | Negative indicator—Higher scores indicate weaker control ability |
| Carrying Capacity | Exploitation Intensity | Developmental Potential | Recommended Functions of Subregions | Optional Functions of Subregions |
|---|---|---|---|---|
| Low | Low | Low | Restricted Development Zone | |
| Low | Low | Medium | Restricted Development Zone | |
| Low | Medium | Low | Restricted Development Zone | |
| Low | Medium | Medium | Restricted Development Zone | |
| Low | Medium | High | Restricted Development Zone | Optimized Development Zone |
| Low | High | Low | Restricted Development Zone | |
| Low | High | Medium | Optimized Development Zone | Restricted Development Zone |
| Low | High | High | Optimized Development Zone | |
| Medium | Low | Low | Restricted Development Zone | |
| Medium | Low | Medium | Significant Development Zone | Restricted Development Zone |
| Medium | Low | High | Significant Development Zone | |
| Medium | Medium | Low | Restricted Development Zone | |
| Medium | Medium | Medium | Significant Development Zone | Restricted Development Zone |
| Medium | Medium | High | Significant Development Zone | |
| Medium | High | Low | Optimized Development Zone | |
| Medium | High | Medium | Optimized Development Zone | |
| Medium | High | High | Optimized Development Zone | Significant Development Zone |
| High | Low | Low | Restricted Development Zone | |
| High | Low | Medium | Restricted Development Zone | Significant Development Zone |
| High | Low | High | Significant Development Zone | |
| High | Medium | Low | Restricted Development Zone | Significant Development Zone |
| High | Medium | Medium | Significant Development Zone | |
| High | Medium | High | Significant Development Zone | |
| High | High | Low | Optimized Development Zone | Significant Development Zone |
| High | High | Medium | Significant Development Zone | Optimized Development Zone |
| High | High | High | Significant Development Zone |
| Indicator Code | Indicator Weighting | S1 | S2 | S3 | S4 | S5 | S6 | S7 | S8 | S9 |
|---|---|---|---|---|---|---|---|---|---|---|
| C11 | 0.064 | 64.3 | 9.4 | 14.9 | 33.1 | 20.3 | 28.7 | 75.1 | 0.0 | 90.9 |
| C12 | 0.034 | 92.6 | 55.5 | 68.9 | 96.0 | 92.3 | 87.6 | 99.6 | 70.8 | 100.0 |
| C21 | 0.148 | 71,000 | 26,790 | 9011 | 3298 | 5151 | 46,732 | 2435 | 8228 | 3017 |
| C31 | 0.031 | 0.47 | 0.26 | 0.50 | 0.80 | 0.75 | 0.70 | 0.80 | 0.83 | 0.80 |
| C41 | 0.022 | 100 | 75 | 100 | 100 | 100 | 100 | 100 | 100 | 100 |
| C51 | 0.062 | 1.45 | 1.66 | 2.21 | 2.11 | 2.49 | 1.76 | 3.04 | 2.89 | 3.13 |
| C61 | 0.403 | 0 | 0 | 0 | 0 | 0 | 0 | 0 | 0 | 27.32 |
| C71 | 0.187 | 24.37 | 0.00 | 0.00 | 0.09 | 0.26 | 16.63 | 2.44 | 0.90 | 3.92 |
| C81 | 0.027 | 4.80 | 5.00 | 4.90 | 5.50 | 5.20 | 5.60 | 6.20 | 6.00 | 7.50 |
| C82 | 0.022 | 23.10 | 19.30 | 14.80 | 12.70 | 10.60 | 88.70 | 8.00 | 15.30 | 17.20 |
| I11 | 0.119 | 13.17 | 1.42 | 8.46 | 7.26 | 4.19 | 3.37 | 5.89 | 3.90 | 1.01 |
| I12 | 0.146 | 13.40 | 3.32 | 7.59 | 1.21 | 8.70 | 0.96 | 2.11 | 12.33 | 0.20 |
| I21 | 0.132 | 0.03 | 0.08 | 0.18 | 0.29 | 0.61 | 0.02 | 0.27 | 0.19 | 0.35 |
| I22 | 0.179 | 2.20 | 0.76 | 1.37 | 12.85 | 6.40 | 2.63 | 16.25 | 2.75 | 17.41 |
| I31 | 0.353 | 200,667 | 875 | 83,113 | 2490 | 4241 | 286,321 | 830 | 1708 | 12,266 |
| I41 | 0.071 | 77,079 | 77,577 | 87,322 | 34,372 | 118,431 | 120,114 | 12,658 | 11,843 | 49,910 |
| P11 | 0.068 | 1207 | 1018 | 291 | 744 | 950 | 318 | 2780 | 0 | 0 |
| P12 | 0.283 | 0.11 | 0.06 | 0.20 | 1.13 | 0.09 | 0.84 | 114.41 | 0.00 | 0.00 |
| P21 | 0.113 | 130.00 | 95.70 | 62.10 | 0.00 | 21.10 | 336.70 | 17.40 | 0.00 | 0.00 |
| P22 | 0.113 | 79.90 | 61.40 | 37.10 | 0.00 | 11.20 | 194.80 | 9.20 | 0.00 | 0.00 |
| P31 | 0.118 | 713.00 | 542.20 | 415.30 | 400.10 | 297.10 | 2787.00 | 251.90 | 430.10 | 483.80 |
| P32 | 0.144 | 715.00 | 141.00 | 71.00 | 314.00 | 32.00 | 2276.00 | 208.00 | 49.00 | 36.00 |
| P41 | 0.144 | 0.09 | 0.04 | 0.03 | 0.06 | 0.02 | 0.40 | 0.04 | 0.03 | 0.04 |
| P42 | 0.017 | 5.84 | 6.70 | 5.13 | 2.95 | 3.67 | 20.58 | 1.86 | 5.32 | 5.98 |
| Subregions | S1 | S2 | S3 | S4 | S5 | S6 | S7 | S8 | S9 |
|---|---|---|---|---|---|---|---|---|---|
| Carrying capacity | 0.49 | 0.11 | 0.14 | 0.17 | 0.18 | 0.35 | 0.24 | 0.17 | 0.66 |
| Exploitation intensity | 1.00 | 0.17 | 0.60 | 0.48 | 0.68 | 0.82 | 0.50 | 0.51 | 0.50 |
| Developmental potential | 0.23 | 0.13 | 0.08 | 0.08 | 0.05 | 0.64 | 0.40 | 0.03 | 0.03 |
| Subregion | Carrying Capacity | Exploitation Intensity | Developmental Potential | Recommended Functions of Subregions | Optional Functions of Subregions | Final Function Categories | Subregion Area (km2) |
|---|---|---|---|---|---|---|---|
| S1 | High | High | Low | Optimized Development Zone | Significant Development Zone | Optimized Development Zone | 358.11 |
| S2 | Low | Low | Low | Restricted Development Zone | Restricted Development Zone | 146.32 | |
| S3 | Low | Medium | Low | Restricted Development Zone | Restricted Development Zone | 93.78 | |
| S4 | Low | Medium | Low | Restricted Development Zone | Restricted Development Zone | 45.31 | |
| S5 | Low | Medium | Low | Restricted Development Zone | Restricted Development Zone | 42.19 | |
| S6 | Medium | High | High | Optimized Development Zone | Significant Development Zone | Significant Development Zone | 532.95 |
| S7 | Low | Medium | Medium | Restricted Development Zone | Restricted Development Zone | 73.69 | |
| S8 | Low | Medium | Low | Restricted Development Zone | Restricted Development Zone | 88.25 | |
| S9 | High | Medium | Low | Restricted Development Zone | Significant Development Zone | Significant Development Zone | 73.00 |
Publisher’s Note: MDPI stays neutral with regard to jurisdictional claims in published maps and institutional affiliations. |
© 2022 by the authors. Licensee MDPI, Basel, Switzerland. This article is an open access article distributed under the terms and conditions of the Creative Commons Attribution (CC BY) license (https://creativecommons.org/licenses/by/4.0/).
Share and Cite
Lin, Y.; Huang, F.; Zhang, Y.; Wang, Q.; Huang, J.; Chen, Q.; Xue, X. An Improved Framework of Marine Major Function-Oriented Zoning in Advancing Ecosystem-Based Management. J. Mar. Sci. Eng. 2022, 10, 684. https://0-doi-org.brum.beds.ac.uk/10.3390/jmse10050684
Lin Y, Huang F, Zhang Y, Wang Q, Huang J, Chen Q, Xue X. An Improved Framework of Marine Major Function-Oriented Zoning in Advancing Ecosystem-Based Management. Journal of Marine Science and Engineering. 2022; 10(5):684. https://0-doi-org.brum.beds.ac.uk/10.3390/jmse10050684
Chicago/Turabian StyleLin, Yanhong, Faming Huang, Yang Zhang, Qi Wang, Jinliang Huang, Qiuming Chen, and Xiongzhi Xue. 2022. "An Improved Framework of Marine Major Function-Oriented Zoning in Advancing Ecosystem-Based Management" Journal of Marine Science and Engineering 10, no. 5: 684. https://0-doi-org.brum.beds.ac.uk/10.3390/jmse10050684