Article

In-Situ Estimates of Net Ecosystem Metabolisms in the Rocky Habitats of Dokdo Islets in the East Sea of Korea

1
Marine Environment Research Center, Korea Institute of Ocean Science and Technology, 385, Haeyang-ro, Yeongdo-gu, Busan 49111, Korea
2
Department of Convergence Study on the Ocean Science and Technology, Ocean Science and Technology School, 385, Haeyang-ro, Yeungdo-gu, Busan 49111, Korea
3
Ulleungdo-Dokdo Ocean Science Station, Korea Institute of Ocean Science and Technology, 121, Hyunpo2gil, Bukmyun, Ulleung-gun, Kyungsangbukdo 40205, Korea
4
Marine Bio-Resources Research Unit, Korea Institute of Ocean Science and Technology, 385, Haeyang-ro, Yeongdo-gu, Busan 49111, Korea
5
Marine Ecosystem Research Center, Korea Institute of Ocean Science and Technology, 385, Haeyang-ro, Yeongdo-gu, Busan 49111, Korea
6
Marine Environment Research Division, National Institute of Fisheries Science, 216, Gijanghaean-ro, Gijang-eup, Busan 46083, Korea
7
Dokdo Research Center, East Sea Research Institute, Korea Institute of Ocean Science and Technology, 48, Marine Science Road, Uljin, Kyungsangbukdo 36315, Korea
*
Author to whom correspondence should be addressed.
J. Mar. Sci. Eng. 2022, 10(7), 887; https://0-doi-org.brum.beds.ac.uk/10.3390/jmse10070887
Submission received: 21 May 2022 / Revised: 20 June 2022 / Accepted: 21 June 2022 / Published: 27 June 2022

Abstract

:
We measured oxygen (O2) fluxes in two major shallow subtidal benthic habitats (kelp bed (KB) and bare rock (BR) covered with crustose coralline algae) of Dokdo islet in the East Sea by applying noninvasive in-situ aquatic eddy covariance (AEC). The AEC device allows time series measurements (~24 h) of three-dimensional velocity (u, v, and w components) and high-resolution dissolved O2. This allows estimation of O2 exchange flux via benthic habitats. Local flow rates and irradiance levels were found to be major factors controlling O2 exchange flux in the rocky habitats. Gross primary production rates tended to be significantly higher in KB (163 mmol O2 m−2 d−1) than in BR (51 mmol O2 m−2 d−1). The net ecosystem metabolisms were assessed as opposite types, with 8 mmol O2 m−2 d−1 in KB (autotrophy) and –12 mmol O2 m−2 d−1 in BR (heterotrophy). Our results indicate that kelp beds are important for organic carbon cycling in rocky coastal waters and that AEC application to macroalgae habitats is a useful assessment approach.

1. Introduction

Macroalgal-dominated habitats, mainly kelp beds (forest), cover about 25% of the world’s coastlines, from temperate to subpolar regions in both hemispheres [1,2,3]. Kelp beds are one of most productive ecosystems in coastal waters, where they also provide complex biogenic habitats for juveniles and enhance secondary production [1,2]. Organic matter produced by benthic communities in high-productivity kelp beds can become a food source for adjacent coastal to deep-sea ecosystems [1]. Furthermore, because of their high capacity for carbon fixation and storage, through their physiological cycle, these ecosystems are recognized as a blue carbon sink (i.e., carbon stored in coastal and marine ecosystems) in the context of global carbon dioxide cycles. As a result, kelp bed communities may offer an important bioengineering opportunity in coastal waters [1]. However, increasing anthropogenic pressures (e.g., eutrophication, overfishing, climate change) have caused a decline of 38% in the kelp populations found in kelp beds [1,2].
Rocky bottoms, in the shallow euphotic zone of Korea, are important habitats for macroalgae: predominantly, long-lived canopy-forming Ecklonia cava and Eisenia bicyclis [4,5]. The distribution and abundance of these species are rapidly declining in the coastal waters of Korea, similar to Japan [6]. Although the reasons for the destruction of the kelp forest on the northeast Pacific coasts are not well known, warming of surface water temperatures by Kuroshio Current may be an important key to controlling the distribution of kelp [6]. In addition, a massive outbreak of crustose coralline algae (CCA) whitening has been rapidly expanding on the rocky bottom [7,8]. These issues can represent a severe threat to the macroalgal communities, but impacts on ecological functions in coastal waters are still limited.
Production and respiration in the benthic community are key parameters for understanding ecological health and organic carbon flow in the food web [9]. Net ecosystem metabolism (NEM), the difference between gross primary production (GPP) and respiration (R) (NEM = GPP − R), is a valuable proxy for several things: (1) consumption through food webs, (2) remineralization/decomposition by microbial respiration, (3) burial to sediment, and (4) exports from vegetated habitats [9]. Therefore, quantification of NEM is an important component, essential for understanding the ecological functioning of kelp beds.
Several methods for NEM estimation have been used to date. A simple laboratory approach, based on the conventional light/dark incubation method, is widely used to quantify NEM in benthic communities [10]. The recently developed in-situ photorespirometer overcomes the limitations of laboratory methods [11,12]. However, the installation of a rigid enclosed chamber in the field can isolate seaweed samples from natural water movements, which can alter the diffusive boundary layer at the thallus surface [13,14]. Thus, an alternative and robust method that can include surrounding physical effects is preferred to measure NEM in benthic habitats.
Aquatic eddy covariance (AEC) has been developed in recent decades [15]. AEC is a noninvasive in-situ measurement technique that has been used to measure O2 flux in various natural water habitats (e.g., coral reefs, seagrass meadows, hard bottom benthic flora beds, oyster reefs) [16,17,18,19,20,21,22,23,24]. The measurement covers a relatively large surface area (10–50 m2) and interferes minimally with the prevailing hydrodynamic conditions [25]. In particular, AEC can be validly applied in complex hard-bottom areas, such as rocky bottoms, coral reefs, and oyster reefs, where conventional chamber deployment is problematic [17,18,21,23].
In this study, we estimated, in situ, the metabolism balance of benthic communities in vegetated (kelp bed [KB]) and ‘bare’ rock [BR] habitats dominated by encrusting coralline algae (CCA). Our objective was to assess the ecological functioning of these habitats in the shallow waters of a pristine islet. Our results may then be used to assess any alterations in organic carbon cycles in the coastal benthic communities of these two habitats, in relation to climate change.

2. Materials and Methods

2.1. Study Sites

The Dokdo Islets, parts of a volcanic island complex in the East Sea between Japan and Korea, are located near the northeastern boundary of Ulleung Basin (Figure 1). They are about 87.4 km from Ulleung Island and consist of two main islets with submerged volcanic edifices. They rise about 2100 m from the base of Ulleung Basin and have a total area of ~0.186 km2 [26]. Unique oceanographic features have been observed around the island. A polar front varies between south and north movement according to the strength of warm and cold waters [27,28]. Occasionally, eddies formed near the southern Korea peninsular encroach from the east and/or south [29]. These oceanographic dynamics, in the southern part of the basin, may contribute to the high primary production in the region [30]. The macroalgal diversity of Dokdo Islets is greater than that of Ulleung Island and comparable to that of well-developed tidal flats in western Korean waters, reinforcing its status as a biodiversity hotspot [31]. Various seaweed species have been observed on the rocky bottoms of the Dokdo Islets, but these have declined recently, associated with CCA whitening [5,32,33].

2.2. Site Selection

Samplings and AEC experiments were conducted on 10–11 October 2019. The measurements were programmed to start at 07:30 AM (local time) (Table S1). The steep water depth gradient around the Dokdo Islets creates a narrow zonation of seaweeds and, thus, the sites for AEC measurement that need careful selection to represent the benthic habitats properly. With diver assistance, the two measurement sites were chosen using the following criteria: (1) flat area for firm AEC deployment, (2) dense seaweeds for KB or small rounded rocks covered with CCA for BR, and (3) representative of the benthic habitats.

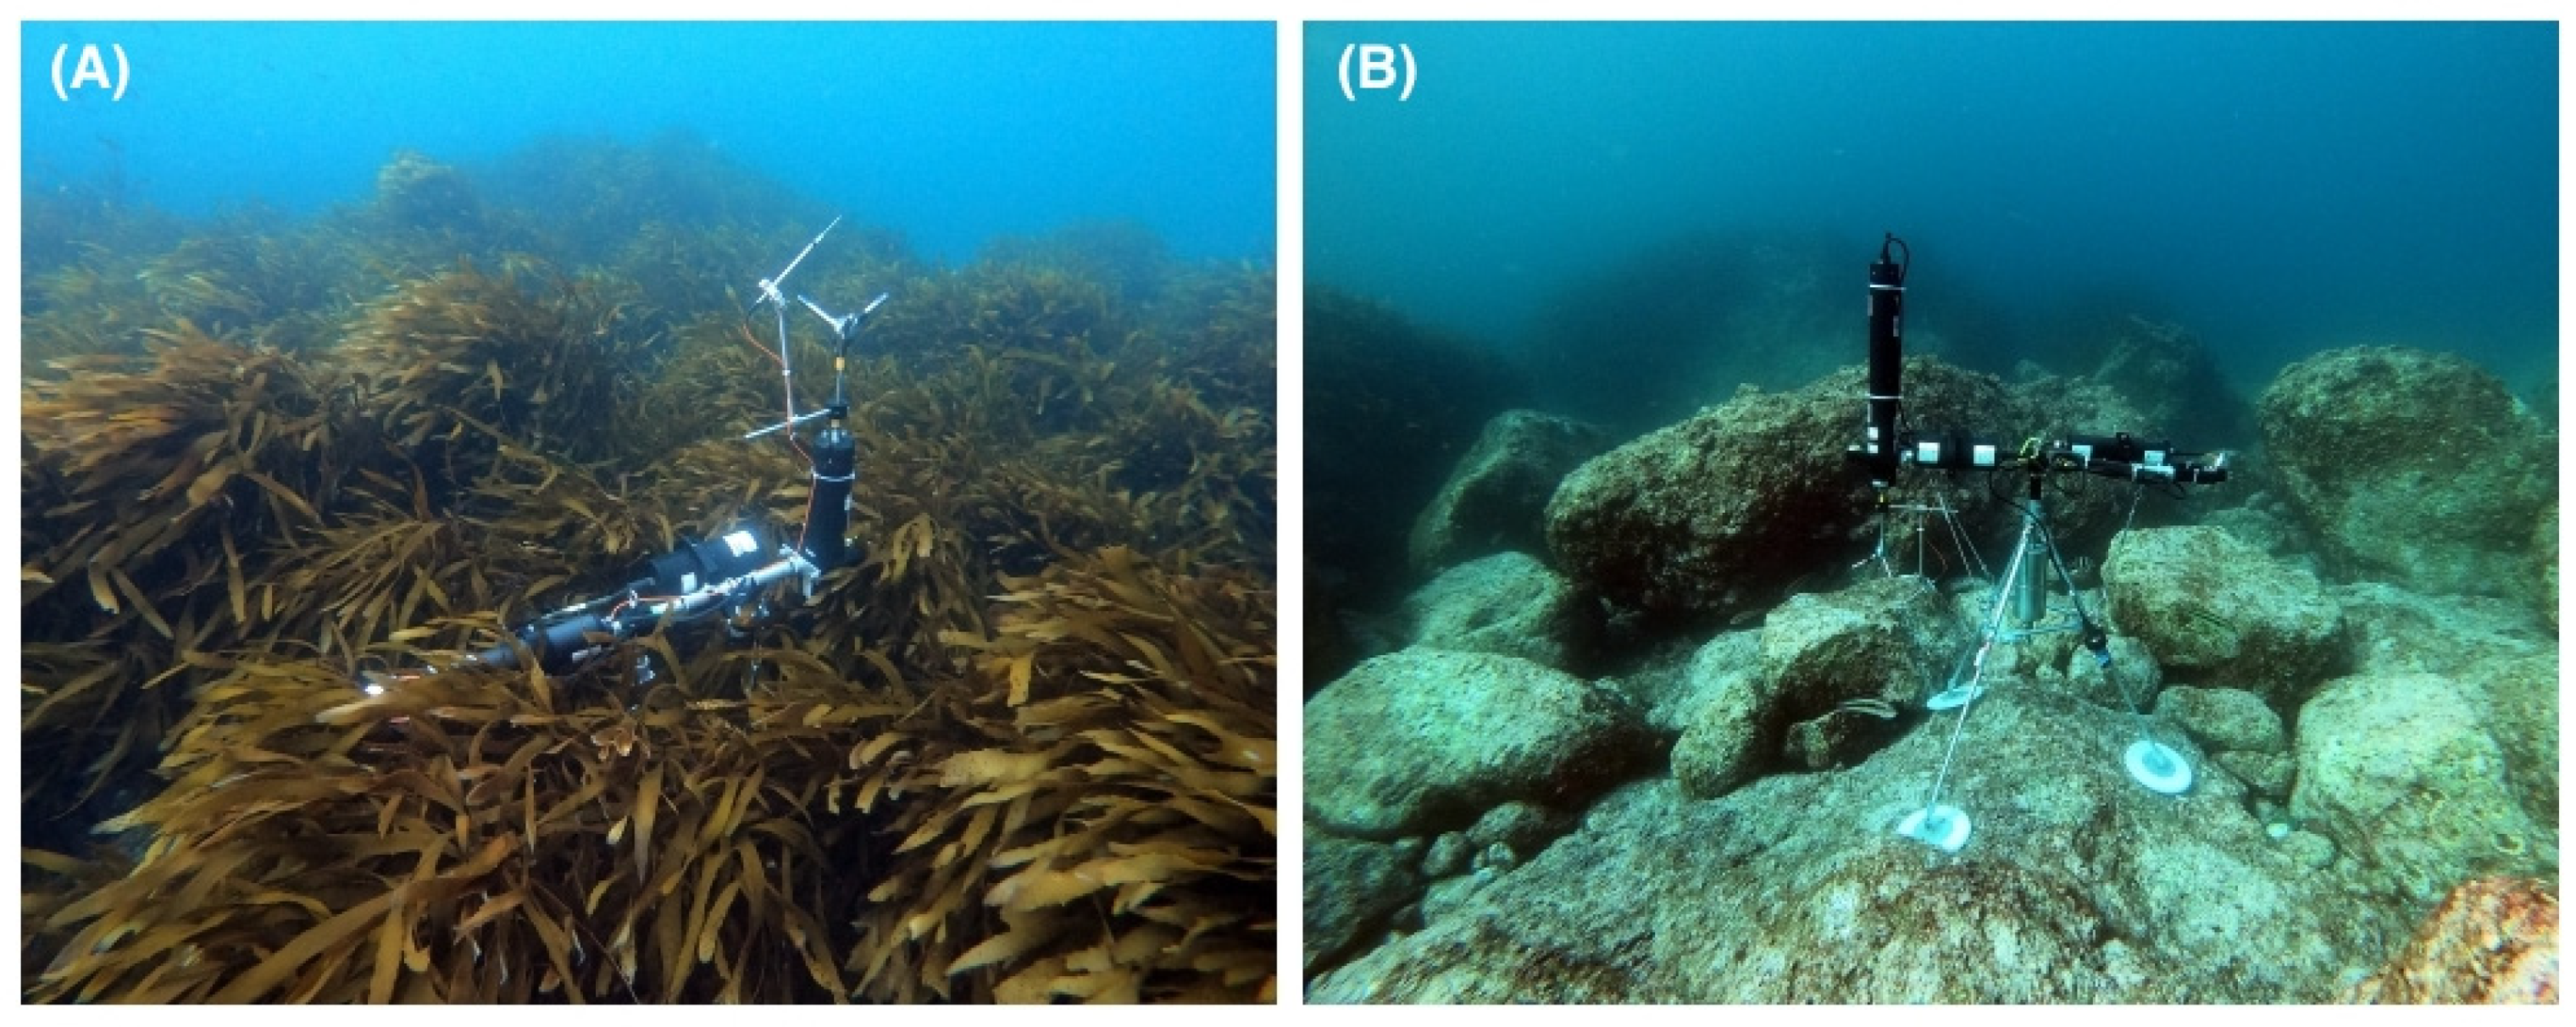
2.3. Aquatic Eddy Covariance System (AEC)

The coastal version of the AEC system was developed by the Korea Institute of Ocean Science and Technology, KIOST ECI, to estimate O2 exchange rates in benthic boundary layers [34]. Briefly, the design was based on the work of Berg et al. [15] for ready application to coastal-water studies. It consists of four compartments: (1) a frame, (2) a three-dimensional (3D) acoustic Doppler velocimeter (ADV) (Nortek, Vector), (3) a fast-response optode sensor (OXR50-UHS, Pyro Science) with an amplifier (Firesting O2-Mini oxygen meter, Pyro Science), and (4) an auxiliary O2 optode sensor for in-situ calibration (Anderra, 4330 and 3835) (Figure 2). Key modifications of ECI, compared with previous AEC systems [15], include a foldable frame and a fast-response O2-sensing system [35]. The unique triangular folding frame enhances portability in the field, thereby allowing easy operation from a small boat in shallow water. Furthermore, an additional AEC system can be installed independently, in parallel, at the opposite side of the AEC in a single frame [35]. To determine the O2 exchange flux in rocky habitats, high-frequency O2 data (<1 Hz) synchronized with 3D velocity measurements are required [15]. The modified glass-needle oxygen sensor and amplifier have been widely used for AEC systems [15,35]. However, the durability of the glass sensor limits long-term measurement because the sensor commonly breaks and cannot record data for an entire day [35]. To overcome this limitation, the glass oxygen microsensor was replaced with a fast-response (<0.3 s) optode sensor system [35,36]. However, the lifetime of the optode and its slow amplifier response time, relative to the glass microsensor system, still limit the AEC system [36].

2.4. AEC Measurements

Each AEC component was assembled as follows: (1) the ADV sensor was aligned vertically, and was either upward-looking in the vegetated habitat (KB) or downward-looking in the rock bottom (BR) areas; (2) the oxygen sensor tilted at about 45° and its tip located at the edge of the sampling volume of the ADV [36]; (3) the measurement heights (h) were fixed ~30 cm above the kelp canopy in KB and above the rock surface in BR; (4) the auxiliary O2 optode was independently mounted on the frame at the same measuring height; and (5) the AEC was carefully hand deployed by rope from a small boat with the help of a scuba diver. Using an underwater compass and level, the AEC frame was oriented to the north, without disturbance of the local flow direction, and parallel to the bottom surface. Before AEC device deployment, the ADV was preprogramed, on the boat deck, with a sampling rate of 32 Hz in continuous measuring mode. The photosynthetically available radiation (PAR) at the surface of the habitat was measured independently, at 1 s intervals, using a PAR sensor (JFE Advantech Co., DEFI-L., Nishinomiya, Japan).

2.5. Data Analysis and Calculation

Benthic O2 flux was calculated using custom-developed software written using MATLAB (MathWorks, v. 2018, Natick, MA, USA) and Python (v. 3.8, Python Software Foundation, Beaverton, OR, USA) following established protocols [36,37,38]. Before the derivation of O2 flux, the data were verified and corrected in three sequential steps. In brief, the high-temporal-resolution ADV data were carefully assessed using beam correlations and signal-to-noise ratios (SNRs). Data with poor beam correlation (<70%) and a low SNR (<5) were excluded. The remaining data were then averaged from 32 Hz to 4 Hz to reduce noise and facilitate data handling [36]. Outliers in the downsized 3D velocity and O2 time series data were removed using an acceleration threshold method [39], and these were replaced by linear interpolation between neighboring values. Finally, the filtered data were rotated using a double-rotation method and sliced into 15 min intervals [38].
The mean turbulent O2 flux (hereafter O2 flux) was calculated over the 15 min (0.25 h) periods as:
O 2   flux = w c ¯ ,
where the overbars indicate time averaging and w and c represent the instantaneous fluctuations away from the mean of the vertical velocity (cm s−1) and O2 concentration (mmol m−3). The fluctuation components, w and c , were extracted using Reynolds decomposition, where c = c c ¯ and w = w w ¯ with w and c being, respectively, the measured vertical velocity and oxygen in situ, and w ¯ and c ¯ being the time averaged values [15]. The decomposition was performed by linear detrending using MATLAB’s detrend function. The window size of 15 min has been defined in previous studies as the optimal time period for maintaining a constant flux signal [17]. Then, hourly mean O2 flux was calculated by averaging four 15 min O2 fluxes [16].
Categories of light and dark were grouped using averaged 15 min PAR values while assuming that the critical value of PAR across a day was >0.2 μmol photon m−2 d−1. The benthic respiration, GPP, and NEM were calculated for each 15 min window as follows:
R = 1 n ( flux dark + flux dark h dark   h light ) ,
GPP = 1 n ( flux light + | flux dark | h dark   h light ) ,
NEM = 1 n ( flux light + flux light ) ,
where n is the number of 15 min fluxes, flux dark is the flux during the nighttime (mmol O2 m−2 d−1), flux light is the flux during the daytime (mmol O2 m−2 d−1), h light is the number of hours of light, and h dark is the number of hours of darkness [16].
Assuming that the O2 flux in the benthic habitats was the product of photosynthesis (P) and respiration (R) by benthic organisms, the light dependencies of the O2 fluxes (P–I curves) were estimated at both sites using the relationship between the hourly mean daytime O2 flux and PAR [40]. Specifically:
P   =   P max   tan h ( I I k R d ) ,  
where Pmax is the maximum photosynthesis rate (mmol O2 m−2 d−1), I is the measured PAR at the canopy height in KB or at the bottom surface in BR (μmol photon m−2 s−1), Ik is the light saturation constant (μmol photon m−2 s−1), and Rd is the dark respiration (mmol O2 m−2 d−1). The hourly mean O2 fluxes were fitted to the 1 h mean PAR. The best fitting parameters, Pmax, Ik, and Rd, were estimated using the “curve_fit” function of the scipy module in Python. Additional parameters, α (photosynthetic efficiency) and Ic (compensation irradiance), were calculated as Pmax/Ik and Rd/α, respectively.

2.6. Sampling and Species Richness

To determine the species richness and biomass of macrophytes in KB, a 50 × 50 cm square frame was installed randomly at two spots for duplication. Samples, including epiphytes, on the rock surface in the square frame were carefully collected and fixed using natural formalin. The samples were transported to the laboratory and the macrophytes were identified to species using a microscope. Their wet biomass was measured with a balance, and the number of individuals was counted using image analysis.

3. Results

3.1. Site Characteristics

In KB, the dominant kelp species was Eisenia bicyclis, which had wet biomass of 2710 g m−2. This was lower than previously measured at Dokdo (2000: 7600–29,000 g m−2, 2014: 895–5377 g m−2) [5]. Eisenia bicyclis individuals ranged from 357 to 1656 g, with an average of 678 g wet weight. The total length of the thallus ranged from 43.0 to 85.0 cm, with an average of 60.2 cm. The typical CCA species observed at the bottom in KB were Synarthrophyton chejuensis and Lithophyllum okamurae [6,33]. There were no macroalgae in BR, but CCA were abundant on the rock surface. The mollusks (snails and mussels) and starfish were sparsely distributed.
Mean KB water depth was 5.1 m, which was shallower than BR (8.4 m) (Table S1). The bottom water temperature varied from 18.83 to 19.63 °C (mean ± standard deviation [SD], 19.20 ± 0.20 °C) and salinity from 33.82 to 34.26 (mean ± SD, 34.02 ± 0.07) (Table S1). The daytime PAR was up to 493 μmol photon m−2 s−1 (mean: 74 μmol photon m−2 s−1) for KB and up to 399 μmol photon m−2 s−1 (average: 67 μmol photon m−2 s−1) for BR, which might depend on water depth.

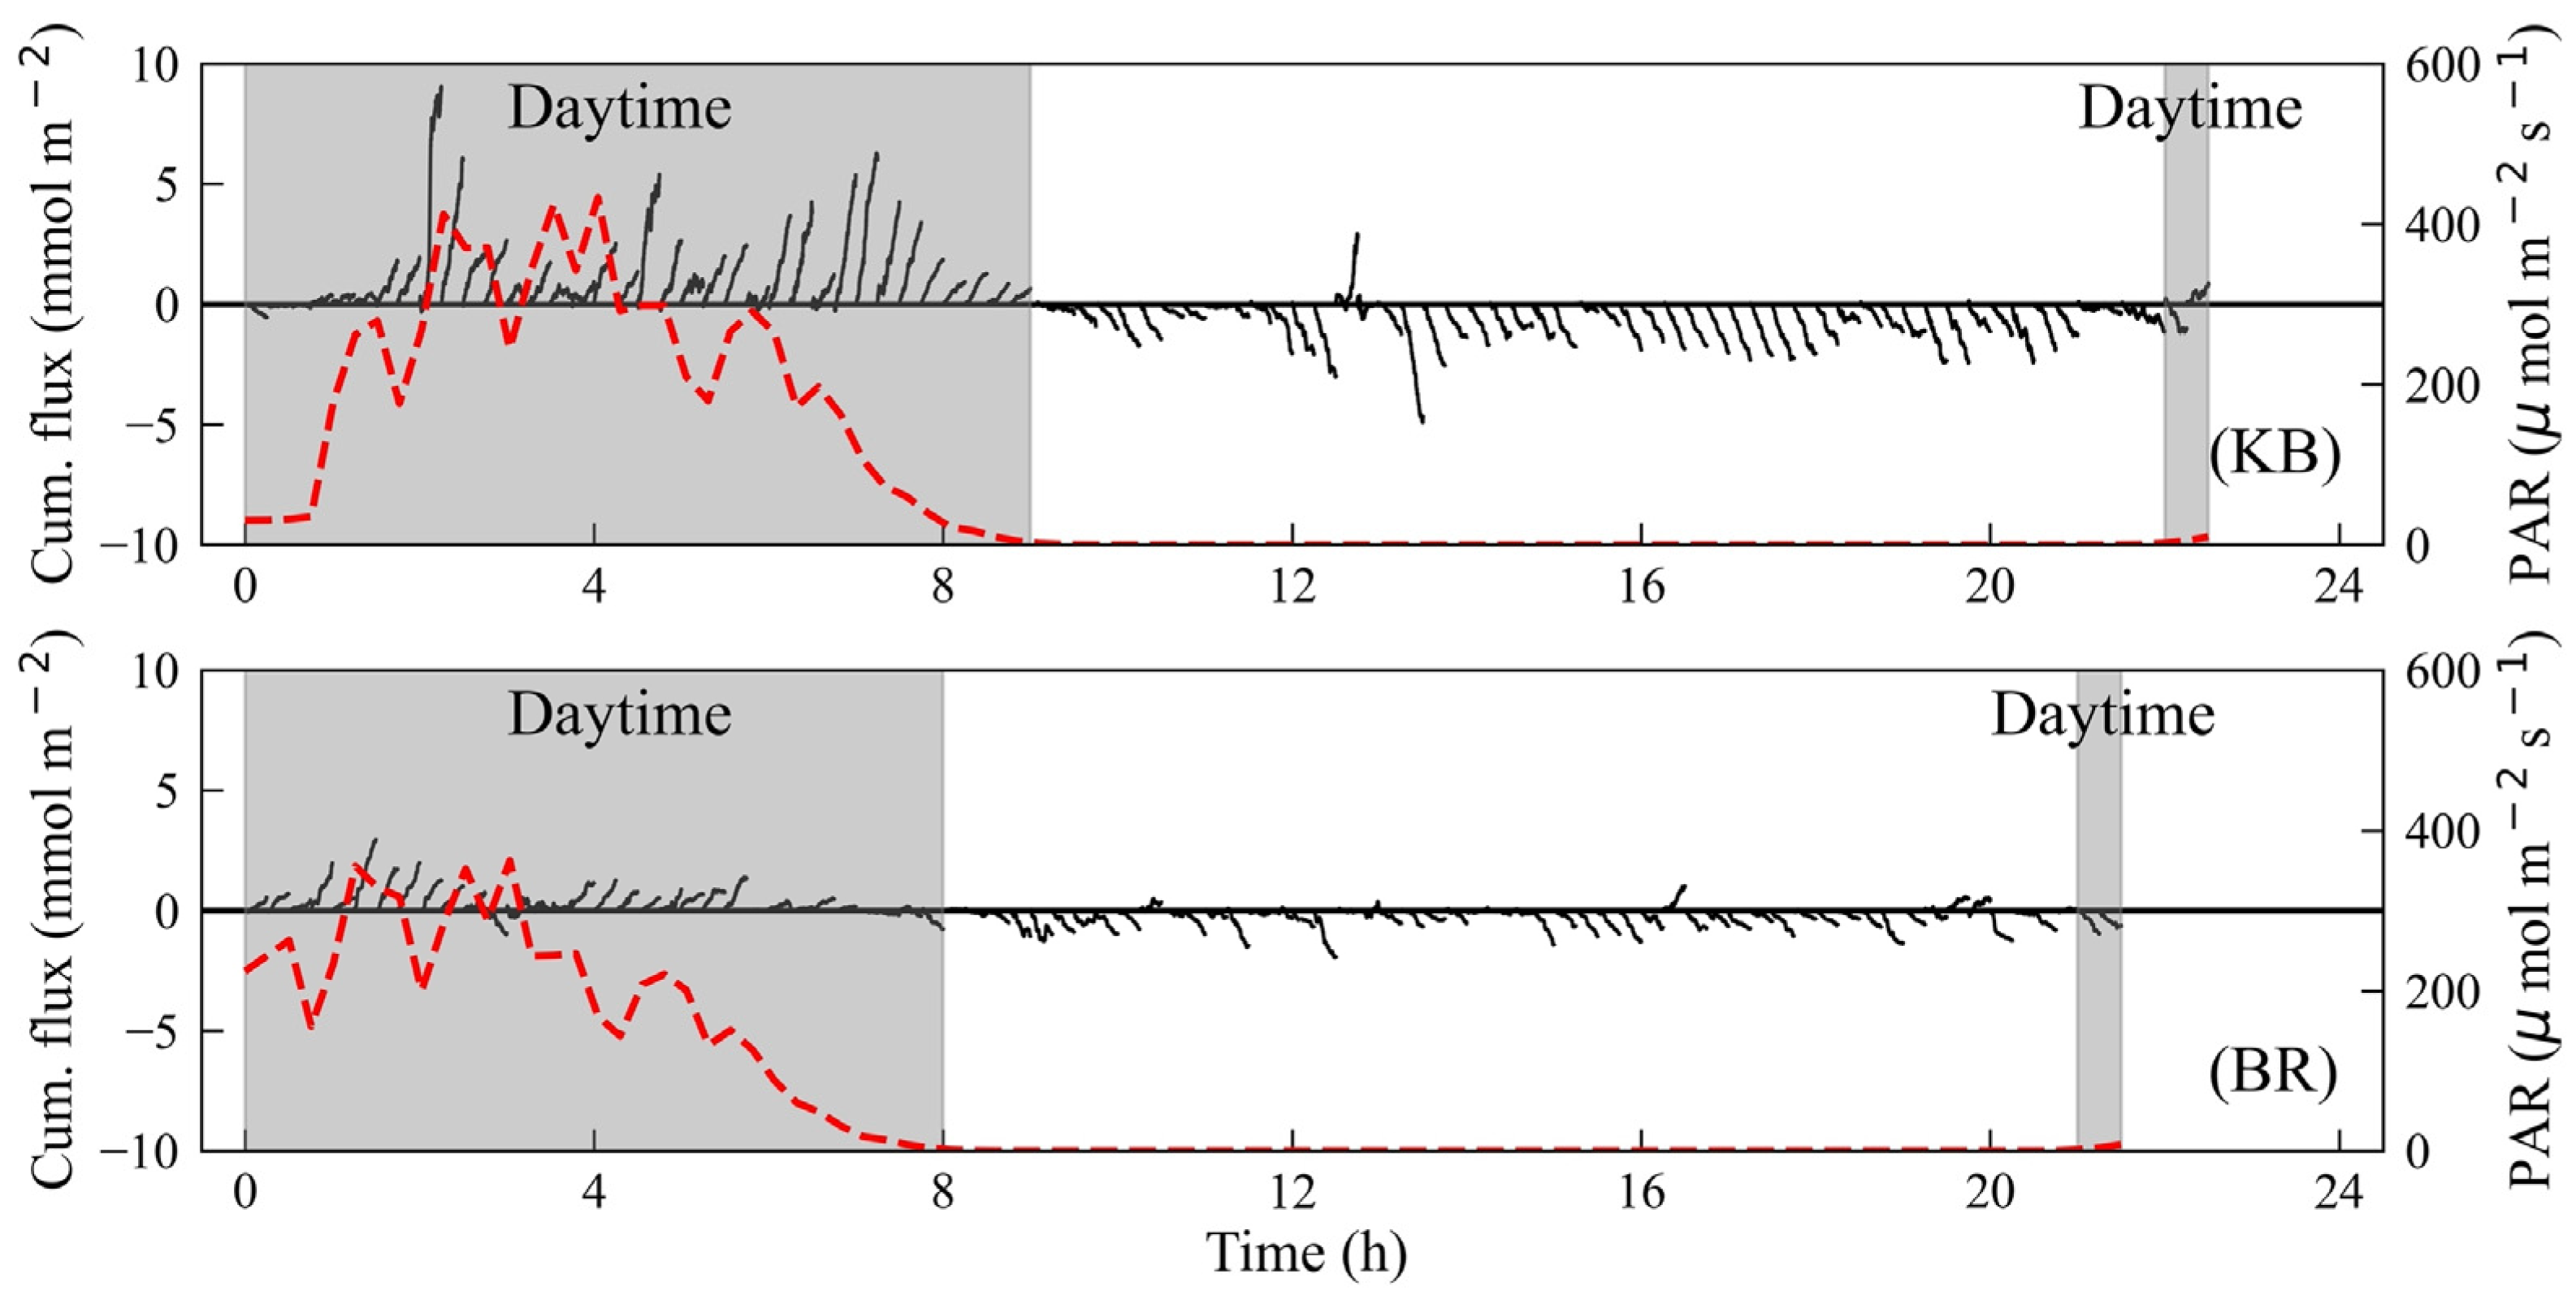
3.2. Time Series Data

Using the continuous measuring mode of the ADV, 3D velocity and O2 were measured for ~25 h (Table S1). To avoid the inclusion of abnormal data during deployment and recovery of the AEC, both ends of the data were excluded from the analysis; thus, the measurements used for further calculation were less than 24 h.
As expected, the 3D velocity was significantly higher in KB than in BR as a consequence of wave orbital motion (Figure 3) [35,41,42]. The mean flow velocity ( U ¯ = x 2 + y 2 + z 2 ) in KB was estimated as 8.8 cm s−1, which was about twice that in BR (3.6 cm s−1) (Table 1).
Oxygen time series did not show any temporal variation at either site, but the mean O2 concentration was significantly higher (t-test, p < 0.05) in KB (277 μmol L−1) than in BR (227 μmol L−1) (Figure 4, Table S1), which may be an effect of O2 production by benthic flora (mainly E. cava and E. bicyclis) photosynthesis. Abnormal spikes in the O2 time series data were observed around 12–13 h in KB, which may be interpreted as interference by debris particles. Similar random spikes in BR were excluded from further analysis (Figure 4).
The diurnal cumulative O2 flux showed overall opposite trends during daytime and nighttime (Figure 5). The cumulative O2 flux increased during the daytime because of consistent O2 production by benthic flora photosynthesis, but decreased at nighttime because of respiration of benthic organisms. Cumulative fluxes varied with PAR intensities and the magnitude of variation was significantly higher in KB than in BR.

3.3. Hourly Averaged O2 Flux with PAR

Hourly mean O2 fluxes were clearly related to diurnal PAR changes (Figure 6). The hourly mean O2 fluxes ranged from –245 to 475 mmol O2 m−2 d−1 (mean ± standard error (SE): 2 ± 42 mmol O2 m−2 d−1) in KB and from –95 to 172 mmol O2 m−2 d−1 (mean ± SE: –14 ± 20 mmol O2 m−2 d−1) in BR. Differences in fluxes between sites (KB vs. BR) and times (daytime vs. nighttime) were statistically significant (t-test, p < 0.01), suggesting that the photosynthesis of benthic flora may be an important factor in overall benthic metabolisms at Dokdo. At about 09:30 to 10:30 local time, O2 fluxes dramatically increased following a rise in PAR (~ 300 μmol photons m−2 d−1).
The relationship between O2 flux and PAR is shown in Figure 7. The parameters of the in-situ P–I curve are listed in Table 1. The modeled maximum net O2 production (Pmax) and dark respiration (Rd) were 50% higher in KB than in BR, which implies that both photosynthesis and respiration are higher in the kelp bed than in the CCA mat. Furthermore, the light saturation (Ik) was significantly lower in KB than in BR, which suggests that kelp responds to irradiance more efficiently.

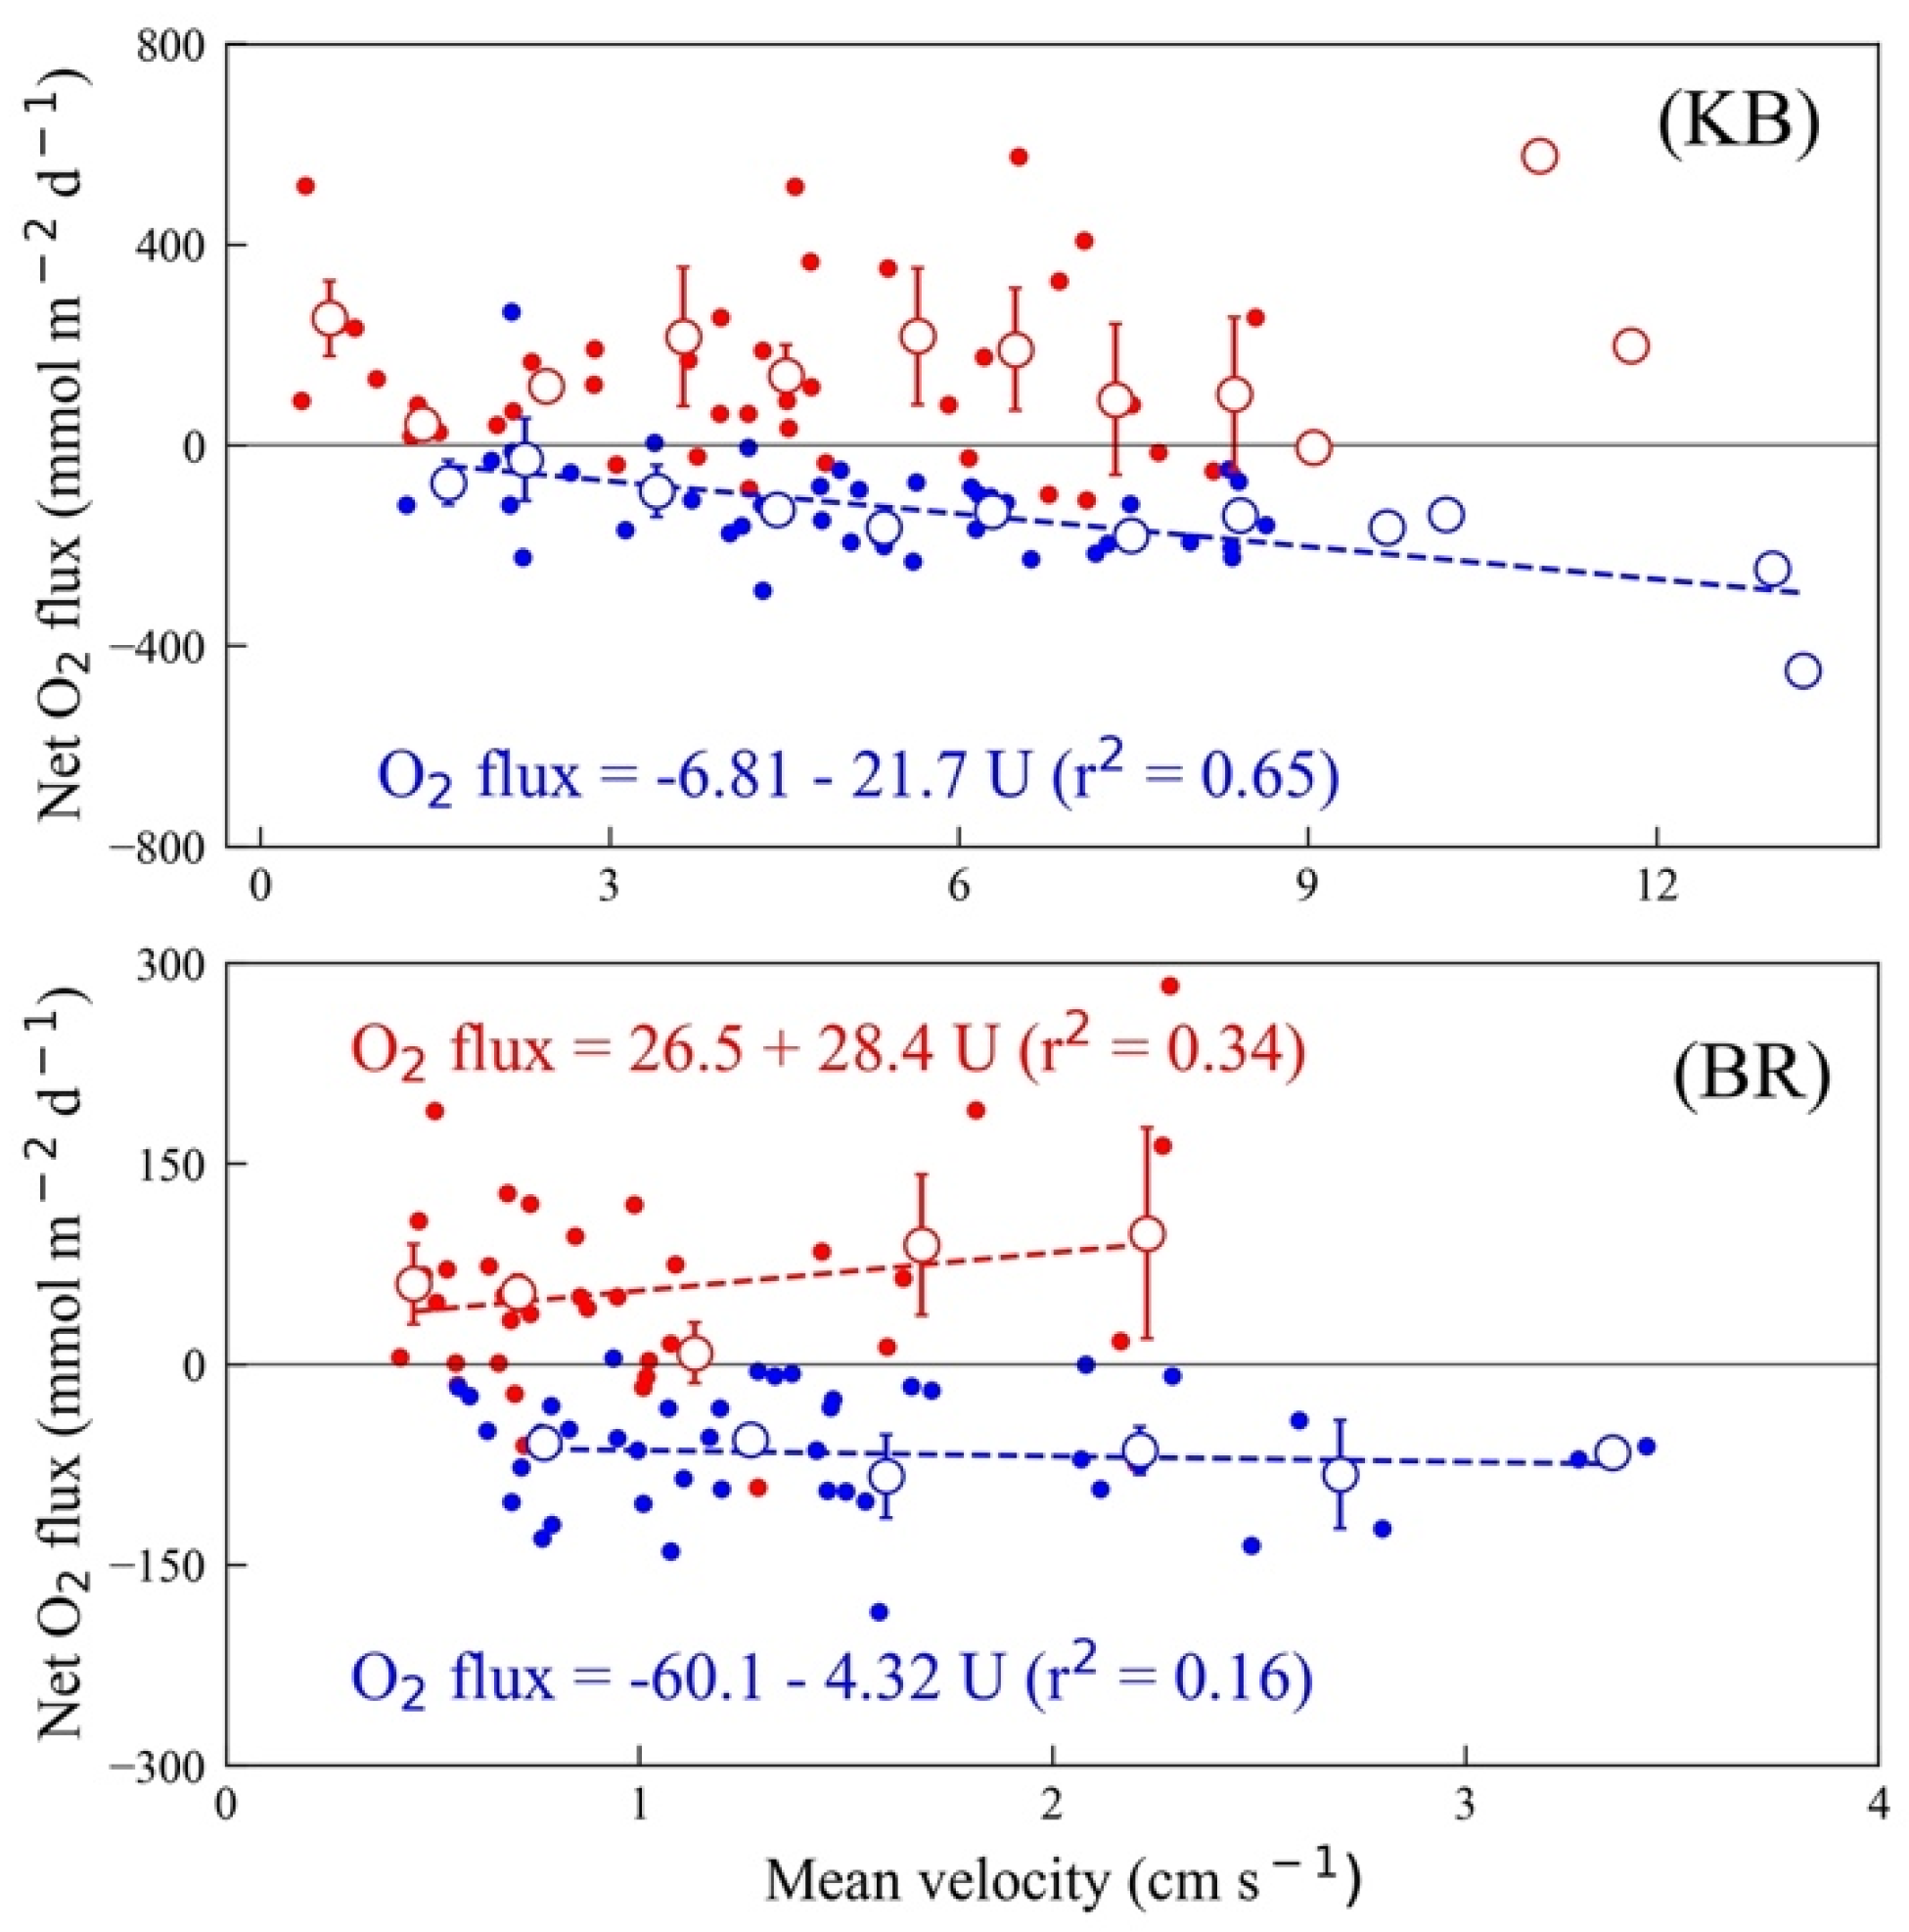
3.4. O2 Flux and Mean Current

The relationships between O2 fluxes, which were binned in 1 cm s−1 intervals for clarity, and mean velocities ( U ¯ ) per bin in KB and BR, are shown in Figure 8. The variabilities in the O2 fluxes and U ¯ values were larger in KB than in BR. Overall, the O2 fluxes were positive during daytime and negative at nighttime, which may be the result of the benthic biological activity (photosynthesis and respiration). Apart from in the daytime in KB, the relationships between O2 flux and U ¯ were linear, increasing with U ¯ in daytime, but decreasing with U ¯ at night.

3.5. Net Ecosystem Metabolism (NEM)

Considerable differences in GPP and R were observed between the KB and BR habitats (Figure 9, Table 1). The GPP in KB was 163 mmol O2 m−2 d−1, which was about three-times higher than that in BR (51 mmol O2 m−2 d−1). Similarly, R was higher in KB (154 mmol O2 m−2 d−1) than in BR (63 mmol O2 m−2 d−1). The NEMs for KB and BR were, respectively, 8 mmol O2 m−2 d−1 and –12 mmol O2 m−2 d−1, suggesting that KB is net autotrophic, whereas BR is net heterotrophic.

4. Discussion

4.1. O2 Flux Variability

Our data clearly indicated that O2 fluxes varied with flow velocity at both sites (Figure 8). The thickness of the diffusive boundary layer at the solid–water interface depends on the friction force: an increasing flow rate can narrow the diffusion boundary layer, which can stimulate both production and respiration in benthic communities [10,16,19,20,21]. Indeed, studies on the metabolism of seagrass (eelgrass) meadows show that local flow velocity can influence O2 flux as much as six-fold [16]. Such results are consistent across benthic habitats [17,22,23]. At night, the influence of flow on O2 flux was about five-times higher in KB than in BR, which suggests that wave forcing, caused by wave orbitals, facilitates kelp respiration [20,43,44].

4.2. P–I Relationship

At Dokdo, the two studied habitats had quite different hyperbolic P–I relationships (Figure 7). Pmax and Rd were significantly higher in KB than in BR (Table 1), whereas the Ik and Ic in KB were each about one-third of their values in BR. This implies that photosynthesis is more responsive to light in kelp than in CCA.
Murakami et al. [45] evaluated the seasonal photosynthetic levels of E. cava and E. bicyclis through laboratory incubation experiments. They found little seasonal change in photosynthetic parameters (Pmax, Rd, Ik, and Ic). Pmax ranged from 257 to 321 mmol O2 m−2 d−1 and Rd from 62 to 73 mmol O2 m−2 d−1, values that are similar to our findings (Pmax: 257 mmol O2 m−2 d−1, Rd: 65 mmol O2 m−2 d−1) (Table 1). Their net photosynthesis (O2 flux) was saturated at light levels above 100 μmol photon m−2 s−1, which closely matched our own in-situ measurements. However, their light saturation level parameters (Ik and Ic) were 30%–40% below our results (Table 2). In a previous study, the Ik and Ic of the leaf or thallus tissues of selected plants were significantly lower than overall community values, which was attributed to internal self-shading in the community [46].
To date, incubation experiments for the estimation of the photosynthesis of aquatic macrophytes have used an enclosed light (-dark) chamber under an irradiance gradient, either in the laboratory or in situ [11,12,45,46]. As the community-level characteristics of photosynthesis are tightly coupled with kelp density, light absorption, and light distribution within the bed, incubation results using phytoelements may need to be more carefully considered to understand benthic photosynthesis at the community scale [46]. On the other hand, AEC results can noninvasively assess integrated O2 dynamics in whole benthic communities on a large footprint (10 to 50 m2) [25]. AEC application may, therefore, provide valuable information about the factors influencing photosynthesis in benthic habitats over multiple time scales (up to yearly) [19].

4.3. NEM of Dokdo Islets

The NEMs of macroalgal communities in the Northern Hemisphere are listed in Table 2 [47,48,49,50]. The GPP, R, and NEM values, respectively, range from 41.7 to 911 mmol O2 m−2 d−1, –351 to –53.2 mmol O2 m−2 d−1, and –108 to 1794 mmol O2 m−2 d−1. Our results are comparable with other macroalgal communities, even though taken in a low-growth period.
The NEM of a specific target community is an important indicator of local ecological function [51]. The community-wide difference between GPP and R (NEM = GPP − R) can be a proxy for carbon flow in the food web [51]. For example, a positive NEM indicates a net autotrophic condition, and reflects the degree of organic matter accumulation within the community and, hence, the excess organic carbon available to nearby ecosystems as food. By contrast, a negative NEM signals net heterotrophy and indicates the degree to which a community requires organic carbon, from an exterior ecosystem, as food—which also implies that it acts as a carbon sink. Our results clearly indicate that organic carbon is produced in kelp beds, and some of this is exported to areas with little or no vegetation. This suggests a “production–consumption” relationship between benthic communities in a localized area. Our methods and results do not, however, permit calculation of carbon flow between KB and BR.

4.4. Implications and Further Suggestions

Kelp beds in shallow coastal waters are among the most productive ecosystems in the world [52], and serve as nurseries for juveniles, an energy source for the food web, and a carbon source for adjacent habitats [53,54,55,56,57,58]. However, kelp beds are being progressively destroyed by disease, herbivores (mainly sea urchins), and physiological stresses from various environmental factors (e.g., suboptimal light, temperature, nutrients, substrate), including climate change [1,52]. In Japan, the periodic intrusion of the warm Tsushima Current along the coast produces mass mortality of Ecklonia and Eisenia species in rocky habitats, which are replaced by tropical species (Sargassum ilicifolium) on the small spatial scale for a short time [6]. Similar to the situation in Japan, kelp beds are rapidly disappearing from the coastlines of the Korean peninsula and are replaced by the whitening of CCA [7,59,60]. Considering that the increase in the annual mean surface water temperature around Korea is about three-times higher than that of the global trend over the last five decades, the physiological interaction in the benthic community by thermal effect may be closely related to the contraction of kelp and expansion of CCA [61].
These changes bring risks to entire benthic habitats and ecosystem structures. Although Dokdo is less impacted by anthropogenic activity because of its geological setting, changes in oceanographic characteristics under climate change can threaten its benthic ecosystems [1,7,8]. Thus, the assessment of community metabolisms in kelp beds and whitening areas is important to gain a better understanding of their ecological functioning and, hence, to aid in the conservation of pristine conditions at Dokdo and, more broadly, the understanding of carbon cycles around open ocean islets.
The Dokdo Islets remain relatively pristine because of long-term limited human access and are, therefore, an excellent location to monitor environmental changes. Recently, the coastal ecosystems in the north Pacific have been altered by climate change [1,56], but quantitative assessment of the changes remains limited in benthic communities. Our results suggest that the trophic status of rocky habitats can be determined from their vegetation, which in the case of kelp beds, can act as both a carbon source and sink over small horizontal scales. The present study was implemented when the growth of macroalgae was low, and, thus, further long-term research is needed to assess fully the ecological functioning of rocky habitats and the biogeochemical cycles of organic carbon in coastal waters during different seasons and across the year. In addition, work such as that described in this paper needs to be undertaken at replicate sites and with replication within habitats, for statistically robust inferences to be drawn.

5. Conclusions

In the present study, for the first time, in-situ AEC measurements were used to estimate the NEM, GPP, and R in the typical benthic habitats (kelp bed and bare rocky bottom) of the Dokdo Islets. In-situ P–I relationships were also assessed to gain a better understanding of the major factors controlling organic carbon cycles in the euphotic waters of the islets. Our results indicate that O2 flux variations, over multiple time scales (from 15 min to 1 day), are driven by local flow rates and irradiance. The O2 fluxes have a strong positive linear relationship with local flow. The P–I curves indicate that the rates of photosynthetic activities are significantly higher in the kelp beds (KB) than in the relatively unvegetated bottom habitats (BR) dominated by CCA. The photosynthesis light response of kelp was more efficient than that of CCA. The NEM of the benthic communities at Dokdo may be determined primarily by the nature of the vegetation, as CCA-dominated habitats have consistently reduced metabolism parameters relative to kelp beds. The trophic states were assessed as net autotrophic on the kelp bed, but net heterotrophic on the bare rocky bottom. Application of these in-situ AEC methods can be expected to provide robust benthic metabolism rates for kelp beds, as well as for CCA mats in hard-bottom habitats.

Supplementary Materials

The following supporting information can be downloaded at: https://0-www-mdpi-com.brum.beds.ac.uk/article/10.3390/jmse10070887/s1, Table S1: AEC measurement times and site characteristics of kelp bed (KB) and bare rocky bottom (BR) habitats (locations, water depth, bottom water salinity and temperature, photosynthetically active radiation [PAR], mean flow velocity [ U ¯ ], and dissolved oxygen [O2]). The parenthesized values of O2 are the daily mean and standard error.

Author Contributions

Supervision, J.S.L.; Conceptualization, J.S.L.; Investigation, J.S.L., S.-H.K. and W.-G.M.; Writing—Original Draft Preparation, J.S.L. and S.-H.K.; Writing—Review and Editing, J.S.L., S.-H.K. and S.-U.A.; Formal analysis, S.-H.K., D.M.C., K.-T.K., J.-W.B. and W.-G.M.; Funding Acquisition, C.H.P. and W.-C.L., Data Curation, E.K.L. All authors have read and agreed to the published version of the manuscript.

Funding

This work was supported by the Korea Institute of Ocean Science and Technology (PEA0012), the Ministry of Oceans and Fisheries (“a sustainable research and development of Dokdo”, PG52911), and the National Institute of Fisheries Science (R2022062).

Institutional Review Board Statement

Not applicable.

Informed Consent Statement

Not applicable.

Data Availability Statement

The data used to support the findings of this study are available from the corresponding author upon request.

Acknowledgments

We wish to thank Min for assistance during AEC deployment and seaweed sampling. The support from Park and Lee was helpful and greatly appreciated. In addition, we also thank the three anonymous reviewers for their helpful comments that improved the early version of the MS.

Conflicts of Interest

The authors declare no conflict of interest.

References

  1. Smale, D.A. Impacts of ocean warming on kelp forest ecosystems. New Phytol. 2020, 225, 1447–1454. [Google Scholar] [CrossRef] [Green Version]
  2. Teagle, H.; Hawkins, S.J.; Moore, P.J.; Smale, D.A. The role of kelp species as biogenic habitat formers in coastal marine ecosystems. J. Exp. Mar. Biol. Ecol. 2017, 492, 81–98. [Google Scholar] [CrossRef]
  3. Wernberg, T.; Krumhansl, K.; Filbee-Dexter, K.; Pedersen, M.F. Status and trends for the world’s kelp forests. In World Seas: An Environmental Evaluation, 2nd ed.; Sheppard, C., Ed.; Academic Press: Cambridge, MA, USA, 2019; pp. 57–78. [Google Scholar]
  4. Kim, M.K.; Kim, K.T. Studies on the seaweeds in the island of Ullungdo and Dokdo: I. Decrease of algal species compositions and changes of marine algal flora. Algae 2000, 15, 119–124. [Google Scholar]
  5. Kang, R.S.; Won, K.S.; Hong, K.P.; Kim, J.M. Population studies on the kelp Ecklonia cava and Eisenia bicyclis in Dokdo, Korea. Algae 2001, 16, 209–215. [Google Scholar]
  6. Tanaka, K.; Taino, S.; Haraguchi, H.; Prendergast, G.; Hiraoka, M. Warming off southwestern Japan linked to distributional shifts of subtidal canopy-forming seaweeds. Ecol. Evol. 2012, 2, 2854–2865. [Google Scholar] [CrossRef]
  7. Kim, M.K.; Shin, J.K.; Cha, J.H. Variation of species composition of benthic algae and whitening in the coast of Dokdo island during summer. Algae 2004, 19, 69–78. [Google Scholar] [CrossRef]
  8. Yoo, J.W.; Kim, H.J.; Lee, H.J.; Lee, C.G.; Kim, C.S.; Hong, J.S.; Hong, J.P.; Kim, D.S. Interaction between invertebrate grazers and seaweeds in the East Coast of Korea. Sea 2007, 12, 125–132. [Google Scholar]
  9. Duarte, C.M.; Cebriàn, J. The fate of marine autotrophic production. Limnol. Oceanogr. 1996, 41, 1758–1776. [Google Scholar] [CrossRef]
  10. Burdett, H.L.; Wright, H.; Smale, D.A. Photophysiological responses of canopy-forming kelp species to short-term acute warming. Front. Mar. Sci. 2019, 6, 516. [Google Scholar] [CrossRef] [Green Version]
  11. Rodgers, K.L.; Rees, T.A.V.; Shears, N.T. A novel system for measuring in situ rates of photosynthesis and respiration of kelp. Mar. Ecol. Prog. Ser. 2015, 528, 101–115. [Google Scholar] [CrossRef] [Green Version]
  12. White, L.; Loisel, S.; Sevin, L.; Davoult, D. In situ estimates of kelp forest productivity in macro-tidal environments. Limnol. Oceanogr. 2021, 66, 4227–4239. [Google Scholar] [CrossRef]
  13. Hurd, C.L. Water motion, marine macroalgal physiology, and production. J. Phycol. 2000, 36, 453–472. [Google Scholar] [CrossRef]
  14. Noisette, F.; Hurd, C. Abiotic and biotic interactions in the diffusive boundary layer of kelp blades create a potential refuge from ocean acidification. Funct. Ecol. 2018, 32, 1329–1342. [Google Scholar] [CrossRef] [Green Version]
  15. Berg, P.; Røy, H.; Janssen, F.; Meyer, V.; Jørgensen, B.B.; Huettel, M.; DeBeer, D. Oxygen uptake by aquatic sediments measured with a novel non-invasive eddy-correlation technique. Mar. Ecol. Prog. Ser. 2003, 261, 75–83. [Google Scholar] [CrossRef]
  16. Hume, A.C.; Berg, P.; McGlathery, K.J. Dissolved oxygen fluxes and ecosystem metabolism in an eelgrass (Zostera marina) meadow measured with the eddy correlation technique. Limnol. Oceanogr. 2011, 56, 86–96. [Google Scholar] [CrossRef] [Green Version]
  17. Long, M.H.; Berg, P.; de Beer, D.; Zieman, J.C. In situ coral reef oxygen metabolism: An eddy correlation study. PLoS ONE 2013, 8, e58581. [Google Scholar] [CrossRef] [Green Version]
  18. Attard, K.; Glud, R.N.; McGinnis, D.F.; Rysgaard, S. Seasonal rates of benthic primary production in a Greenland fjord measured by aquatic eddy correlation. Limnol. Oceanogr. 2014, 59, 1555–1569. [Google Scholar] [CrossRef]
  19. Rheuban, J.E.; Berg, P.; McGlathery, K.J. Multiple timescale processes drive ecosystem metabolism in eelgrass (Zostera marina) meadows. Mar. Ecol. Prog. Ser. 2014, 507, 1–13. [Google Scholar] [CrossRef] [Green Version]
  20. Long, M.H.; Berg, P.; McGlathery, K.J.; Zieman, J.C. Sub-tropic seagrass ecosystem metabolism measured by eddy covariance. Mar. Ecol. Prog. Ser. 2015, 529, 75–90. [Google Scholar] [CrossRef]
  21. Rovelli, L.; Attard, K.M.; Bryant, L.D.; Flögel, S.; Stahl, H.; Roberts, J.M.; Linke, P.; Glud, R.N. Benthic O2 uptake of two cold-water coral communities estimated with the non-invasive eddy correlation technique. Mar. Ecol. Prog. Ser. 2015, 525, 97–104. [Google Scholar] [CrossRef] [Green Version]
  22. Chipman, L.; Berg, P.; Huettel, M. Benthic oxygen fluxes measured by eddy covariance in permeable Gulf of Mexico shallow-water sands. Aquat. Geochem. 2016, 22, 529–554. [Google Scholar] [CrossRef]
  23. Volaric, M.P.; Berg, P.; Reidenbach, M.A. Oxygen metabolism of intertidal oyster reefs measured by aquatic eddy covariance. Mar. Ecol. Prog. Ser. 2018, 599, 75–91. [Google Scholar] [CrossRef] [Green Version]
  24. Camillini, N.; Attard, K.M.; Eyre, B.D.; Glud, R.N. Resolving community metabolism of eelgrass Zostera marina meadows by benthic flume-chambers and eddy covariance in dynamic coastal environments. Mar. Ecol. Prog. Ser. 2021, 661, 97–114. [Google Scholar] [CrossRef]
  25. Berg, P.; Røy, H.; Wiberg, P.L. Eddy correlation flux measurements: The sediment surface area contributes to the flux. Limnol. Oceanogr. 2007, 52, 1672–1682. [Google Scholar] [CrossRef] [Green Version]
  26. Kim, C.H.; Park, J.W.; Lee, M.H.; Park, C.H. Detailed bathymetry and submarine terraces in the coastal area of the Dokdo Volcano in the Ulleung Basin, the East Sea (Sea of Japan). J. Coast. Res. 2013, 65, 523–528. [Google Scholar] [CrossRef]
  27. Park, K.-A.; Ullman, D.S.; Kim, K.; Chung, Y.J.; Kim, K.-R. Spatial and temporal variability of satellite-observed subpolar front in the East/Japan Sea. Deep Sea Res. Part I Oceanogr. Res. Pap. 2007, 54, 453–470. [Google Scholar] [CrossRef]
  28. Park, K.-A.; Woo, H.-J.; Ryu, J.-H. Spatial scales of mesoscale eddies from GOCI chlorophyll-a concentration images in the East/Japan Sea. Ocean Sci. J. 2012, 47, 347–358. [Google Scholar] [CrossRef]
  29. Kim, D.; Yang, E.J.; Kim, K.H.; Shin, C.-W.; Park, J.; Yoo, S.; Hyun, J.-H. Impact of an anticyclonic eddy on the summer nutrient and chlorophyll a distribution in the Ulleung Basin, East Sea (Japan Sea). ICES J. Mar. Sci. 2012, 69, 23–29. [Google Scholar] [CrossRef] [Green Version]
  30. Yoo, S.; Park, J. Why is the southwest the most productive region of the East Sea/Sea of Japan? J. Mar. Syst. 2009, 78, 301–315. [Google Scholar] [CrossRef]
  31. Song, S.J.; Park, J.; Ryu, J.; Rho, H.S.; Kim, W.; Khim, J.S. Biodiversity hotspot for marine invertebrates around the Dokdo, East Sea, Korea: Ecological checklist revisited. Mar. Pollut. Bull. 2017, 119, 162–170. [Google Scholar] [CrossRef]
  32. Park, S.K.; Lee, J.R.; Heo, J.S.; An, D.S.; Lee, H.P.; Choi, H.G. Marine algae flora and ecological role of Eisenia bicyclis in Dokdo, East Sea, Korea. Korean J. Environ. Ecol. 2014, 28, 613–626. (In Korean) [Google Scholar] [CrossRef]
  33. Hwang, S.I.; Kim, D.K.; Sung, B.J.; Jun, S.K.; Bae, J.I.; Jeon, B.H. Effects of climate change on whitening event proliferation the Coast of Jeju. Korean J. Environ. Ecol. 2017, 31, 529–536. [Google Scholar] [CrossRef]
  34. Lee, J.S.; Kang, D.-J.; Hineva, E.; Slabakova, V.; Todorova, V.; Park, J.; Cho, J.-H. Estimation of net ecosystem metabolism of seagrass meadows in the coastal waters of the East Sea and Black Sea using the Noninvasive Eddy Covariance technique. Ocean Sci. J. 2017, 52, 243–256. [Google Scholar] [CrossRef]
  35. Berg, P.; Koopmans, D.J.; Huettel, M.; Hua, L.; Mori, K.; Wüest, A. A new robust oxygen-temperature sensor for aquatic eddy covariance measurement. Limnol. Oceanogr. Methods 2015, 14, 151–167. [Google Scholar] [CrossRef] [Green Version]
  36. Huettel, M.; Berg, P.; Merikhi, A. Technical note: Measurements and data analysis of sediment–water oxygen flux using a new dual-optode eddy covariance instrument. Biogeosciences 2020, 17, 4459–4476. [Google Scholar] [CrossRef]
  37. Rovelli, L.; Attard, K.M.; Binley, A.; Heppell, C.M.; Stahl, H.; Trimmer, M.; Glud, R.N. Reach-scale river metabolism across contrasting sub-catchment geologies: Effect of light and hydrology. Limnol. Oceanogr. 2017, 62, S381–S399. [Google Scholar] [CrossRef] [Green Version]
  38. Long, M.H. Aquatic biogeochemical eddy covariance fluxes in the presence wave. J. Geophys. Res. Oceans 2021, 126, e2020JC016637. [Google Scholar] [CrossRef]
  39. Goring, D.G.; Nikora, V.I. Despiking acoustic doppler velocimeter data. J. Hydraul. Eng. 2002, 128, 117–126. [Google Scholar] [CrossRef] [Green Version]
  40. Jassby, A.D.; Platt, T. Mathematical formulation of relationship between photosynthesis and light for phytoplankton. Limnol. Oceanogr. 1976, 21, 540–547. [Google Scholar] [CrossRef] [Green Version]
  41. Donis, D.; Holtappels, M.; Noss, C.; Cathalot, C.; Hancke, K.; Polsenaere, P.; McGinnis, D.F. An assessment of the precision and confidence of aquatic eddy correlation measurements. J. Atmos. Ocean. Technol. 2015, 32, 642–655. [Google Scholar] [CrossRef] [Green Version]
  42. Reimers, C.E.; Fogaren, K.E. Bottom boundary layer oxygen fluxes during winter on the Oregon Shelf. J. Geophys. Res. Oceans 2021, 126, e2020JC016828. [Google Scholar] [CrossRef]
  43. Reidenbach, M.A.; Koseff, J.R.; Monismith, S.G. Laboratory experiments of fine-scale mixing and mass transport within a coral canopy. Phys. Fluids 2007, 19, 075107. [Google Scholar] [CrossRef]
  44. Hansen, J.C.R.; Fourquerean, J.W. Wave and tidally driven flows in eelgrass beds and their effect on sediment suspension. Mar. Ecol. Prog. Ser. 2012, 448, 271–287. [Google Scholar] [CrossRef] [Green Version]
  45. Murakami, H.; Yukihiko, S.; Akira, K.; Yasutsugu, Y. Phytosynthetic performances of temperate Sargassum and Kelp species growing in the same habitat. Algae 2004, 19, 207–216. [Google Scholar] [CrossRef]
  46. Binzer, T.K.; Sand-Jensen, N.T.; Middelboe, A.L. Community photosynthesis of aquatic macrophytes. Limnol. Oceanogr. 2006, 51, 2722–2733. [Google Scholar] [CrossRef]
  47. Miller, R.J.; Reed, D.C.; Brzezinski, M.A. Partitioning of primary production among giant kelp (Macrocystis pyrifera), understory macroalgae, and phytoplankton on a temperate reef. Limnol. Oceanogr. 2011, 56, 119–132. [Google Scholar] [CrossRef]
  48. Barrón, C.; Apostolaki, E.T.; Duarte, C.M. Dissolved organic carbon fluxes by seagrass meadows and macroalgal beds. Front. Mar. Sci. 2014, 1, 42. [Google Scholar] [CrossRef] [Green Version]
  49. Edwards, M.; Konar, B.; Kim, J.-H.; Gabara, S.; Sullaway, G.; McHugh, T.; Spector, M.; Small, S. Marine deforestation leads to widespread loss of ecosystem function. PLoS ONE 2020, 15, e0226173. [Google Scholar] [CrossRef] [Green Version]
  50. Watanabe, K.; Yoshida, G.; Hori, M.; Umezawa, Y.; Moki, H.; Kuwae, T. Macroalgal metabolism and lateral carbon flows can create significant carbon sinks. Biogeosciences 2020, 17, 2425–2440. [Google Scholar] [CrossRef]
  51. Staehr, P.A.; Testa, J.M.; Michael Kemp, W.; Cole, J.J.; Sand-Jensen, K.; Smith, S.V. The metabolism of aquatic ecosystems: History, applications, and future challenges. Aquat. Sci. 2012, 74, 15–29. [Google Scholar] [CrossRef]
  52. Graham, M.H.; Bourque, B.J.; Erlandson, J. Kelp forest ecosystems: Biodiversity, stability, resilience and future. Environ. Conserv. 2002, 29, 436–459. [Google Scholar] [CrossRef]
  53. Newell, R.C.; Lucas, M.I.; Velimirov, B.; Seiderer, L.J. Quantitative significance of dissolved organic losses following fragmentation of kelp (Ecklonia maxima and Laminaria pallida). Mar. Ecol. Prog. Ser. 1980, 2, 45–59. [Google Scholar] [CrossRef]
  54. Stuart, V.; Lucas, M.I.; Newell, R.C. Heterotrophic utilisation of particulate matter from the kelp Laminaria pallida. Mar. Ecol. Prog. Ser. 1981, 4, 337–348. [Google Scholar] [CrossRef]
  55. Bustamante, R.H.; Branch, G.M.; Eekhout, S. Maintenance of an exceptional grazer biomass in South Africa: Subsidy by subtidal kelps. Ecology 1995, 76, 2314–2329. [Google Scholar] [CrossRef]
  56. Griffiths, C.L.; Stenton-Dozey, J.M.E.; Koop, K. Kelp wrack and the flow of energy through a sandy beach ecosystem. In Sandy Beaches as Ecosystems. Developments in Hydrobiology, 1st ed.; McLachlan, A., Erasmus, T., Eds.; Springer: Dordrecht, South Africa, 1983; Volume 19, pp. 547–556. [Google Scholar] [CrossRef]
  57. Smale, D.A.; Pessarrodona, A.; King, N.; Moore, P. Examining the production, export, and immediate fate of kelp detritus on open-coast subtidal reeds in the Northeast Atlantic. Limnol. Oceanog. 2021, 9999, 1–14. [Google Scholar] [CrossRef]
  58. Krause-Jensen, D.; Duarte, C.M. Substantial role of macroalgae in marine carbon sequestration. Nat. Geosci. 2016, 9, 737–742. [Google Scholar] [CrossRef]
  59. NIFS. A Study on Restoration of Barren Ground in Jeju Island; NIFS: Busan, Korea, 2008. [Google Scholar]
  60. Kim, Y.-D.; Park, M.-S.; Yoo, H.-I.; Min, B.-H.; Moon, T.-S.; Choi, H.-G. Seasonal variation in subtidal seaweed community structure at Hajung, on the southeast coast of Korea. Korean J. Fish. Aquat. Sci. 2011, 44, 740–746. [Google Scholar] [CrossRef] [Green Version]
  61. Baek, J.-U.; Lee, J.S.; Kim, S.-H.; Lee, T.; Jung, S.W.; Lee, W.-C.; Kim, K.-T.; An, S.-U. Effects of Irradiance and Temperature on the Photosynthesis of the Crustose Coralline Algae Pneophyllum fragile (Corallinales, Rhodophyta) in the Coastal Waters of Korea. JMSE 2022, 10, 851. [Google Scholar] [CrossRef]
Figure 1. Map showing the sampling stations. The solid circle is the kelp bed (Ecklonia cava and Eisenia bicyclis) and the open circle is the bare rocky bottom (BR).
Jmse 10 00887 g001
Figure 2. Pictures of AEC deployment in Kelp Bed (A) and Bare Rock (B).
Jmse 10 00887 g002
Figure 3. Raw 3D velocity for the approximately 24 h time series of AEC data in KB and BR. The black, blue, and red lines represent the u, v, and w components measured at 32 Hz, respectively.
Jmse 10 00887 g003
Figure 4. Time series of O2 in KB and BR. Significant abnormal spikes were observed around 12–13 h in KB and excluded from further analysis.
Jmse 10 00887 g004
Figure 5. Time series (15 min burst) of cumulative O2 flux (black solid line) and PAR (red dashed line) in KB and BR. The cumulative flux shows a clear diurnal pattern with PAR.
Jmse 10 00887 g005
Figure 6. Hourly average O2 flux (open bar) for 24 h and PAR (red line) in KB and BR. The bars represent standard errors.
Jmse 10 00887 g006
Figure 7. Relationships between PAR and net O2 flux in KB and BR. The open circles represent net O2 fluxes during daytime and the red solid circles represent hourly mean fluxes.
Jmse 10 00887 g007
Figure 8. The relationships between net O2 flux and mean velocity during daytime and nighttime. The solid red and blue circles represent the daytime and nighttime fluxes, respectively. The individual fluxes were assigned to 1 m s−1 bins (open red and blue circles) to clarify the relationships. The solid red and blue lines are linear regression for daytime and nighttime, respectively. Bars represent standard errors.
Jmse 10 00887 g008
Figure 9. Comparison of net ecosystem metabolisms (R, GPP, and NEM) in KB and BR.
Jmse 10 00887 g009
Table 1. Photosynthesis parameters and net ecosystem metabolism in KB and BR. Pmax, Rd, GPP, R, and NEM are in mmol m−2 d−1, Ik and Ic are in μmol photon m−2 s−1, and α is in mmol m−2 d−1/μmol photon m−2 s−1.
PmaxαIkIcRdGPPRNEM
KB2574.16216651631548
BR1680.820559485163−12
Table 2. Comparison of net ecosystem metabolism in various regions of the macroalgal communities. All units of respiration (R), gross primary production (GPP), and net ecosystem metabolism (NEM) are in mmol O2 m−2 d−1.
LocationSpeciesRGPPNEMMethodFrequencyReferences
Santa Barbara,
USA
Macrocystis pyrifera−216–−54.265.1–911−108–130chamberseasonal[47]
Bolinao,
(Philippines) &
Trondheim,
(Norway)
Caulerpa racemose
Laminaria
−11.7–−18541.7–2439.11–107chambermonthly[48]
Aleutian archipelago, USAMacrocystis pyrifera,
Sargassum horneri
−166150−19.9benthic
isolation tents
summer[49]
Heigun Island,
Japan
Sargassum algae−337–−351-393–1794field bagseasonal[50]
Dokdo islet,
Korea
Eisenia bicyclis−1541638AECautumnThis study
Publisher’s Note: MDPI stays neutral with regard to jurisdictional claims in published maps and institutional affiliations.

