
Effects of Tsunami Shelters in Pandeglang, Banten, Indonesia, Based on Agent-Based Modelling: A Case Study of the 2018 Anak Krakatoa Volcanic Tsunami


Abstract
:1. Introduction
2. Materials
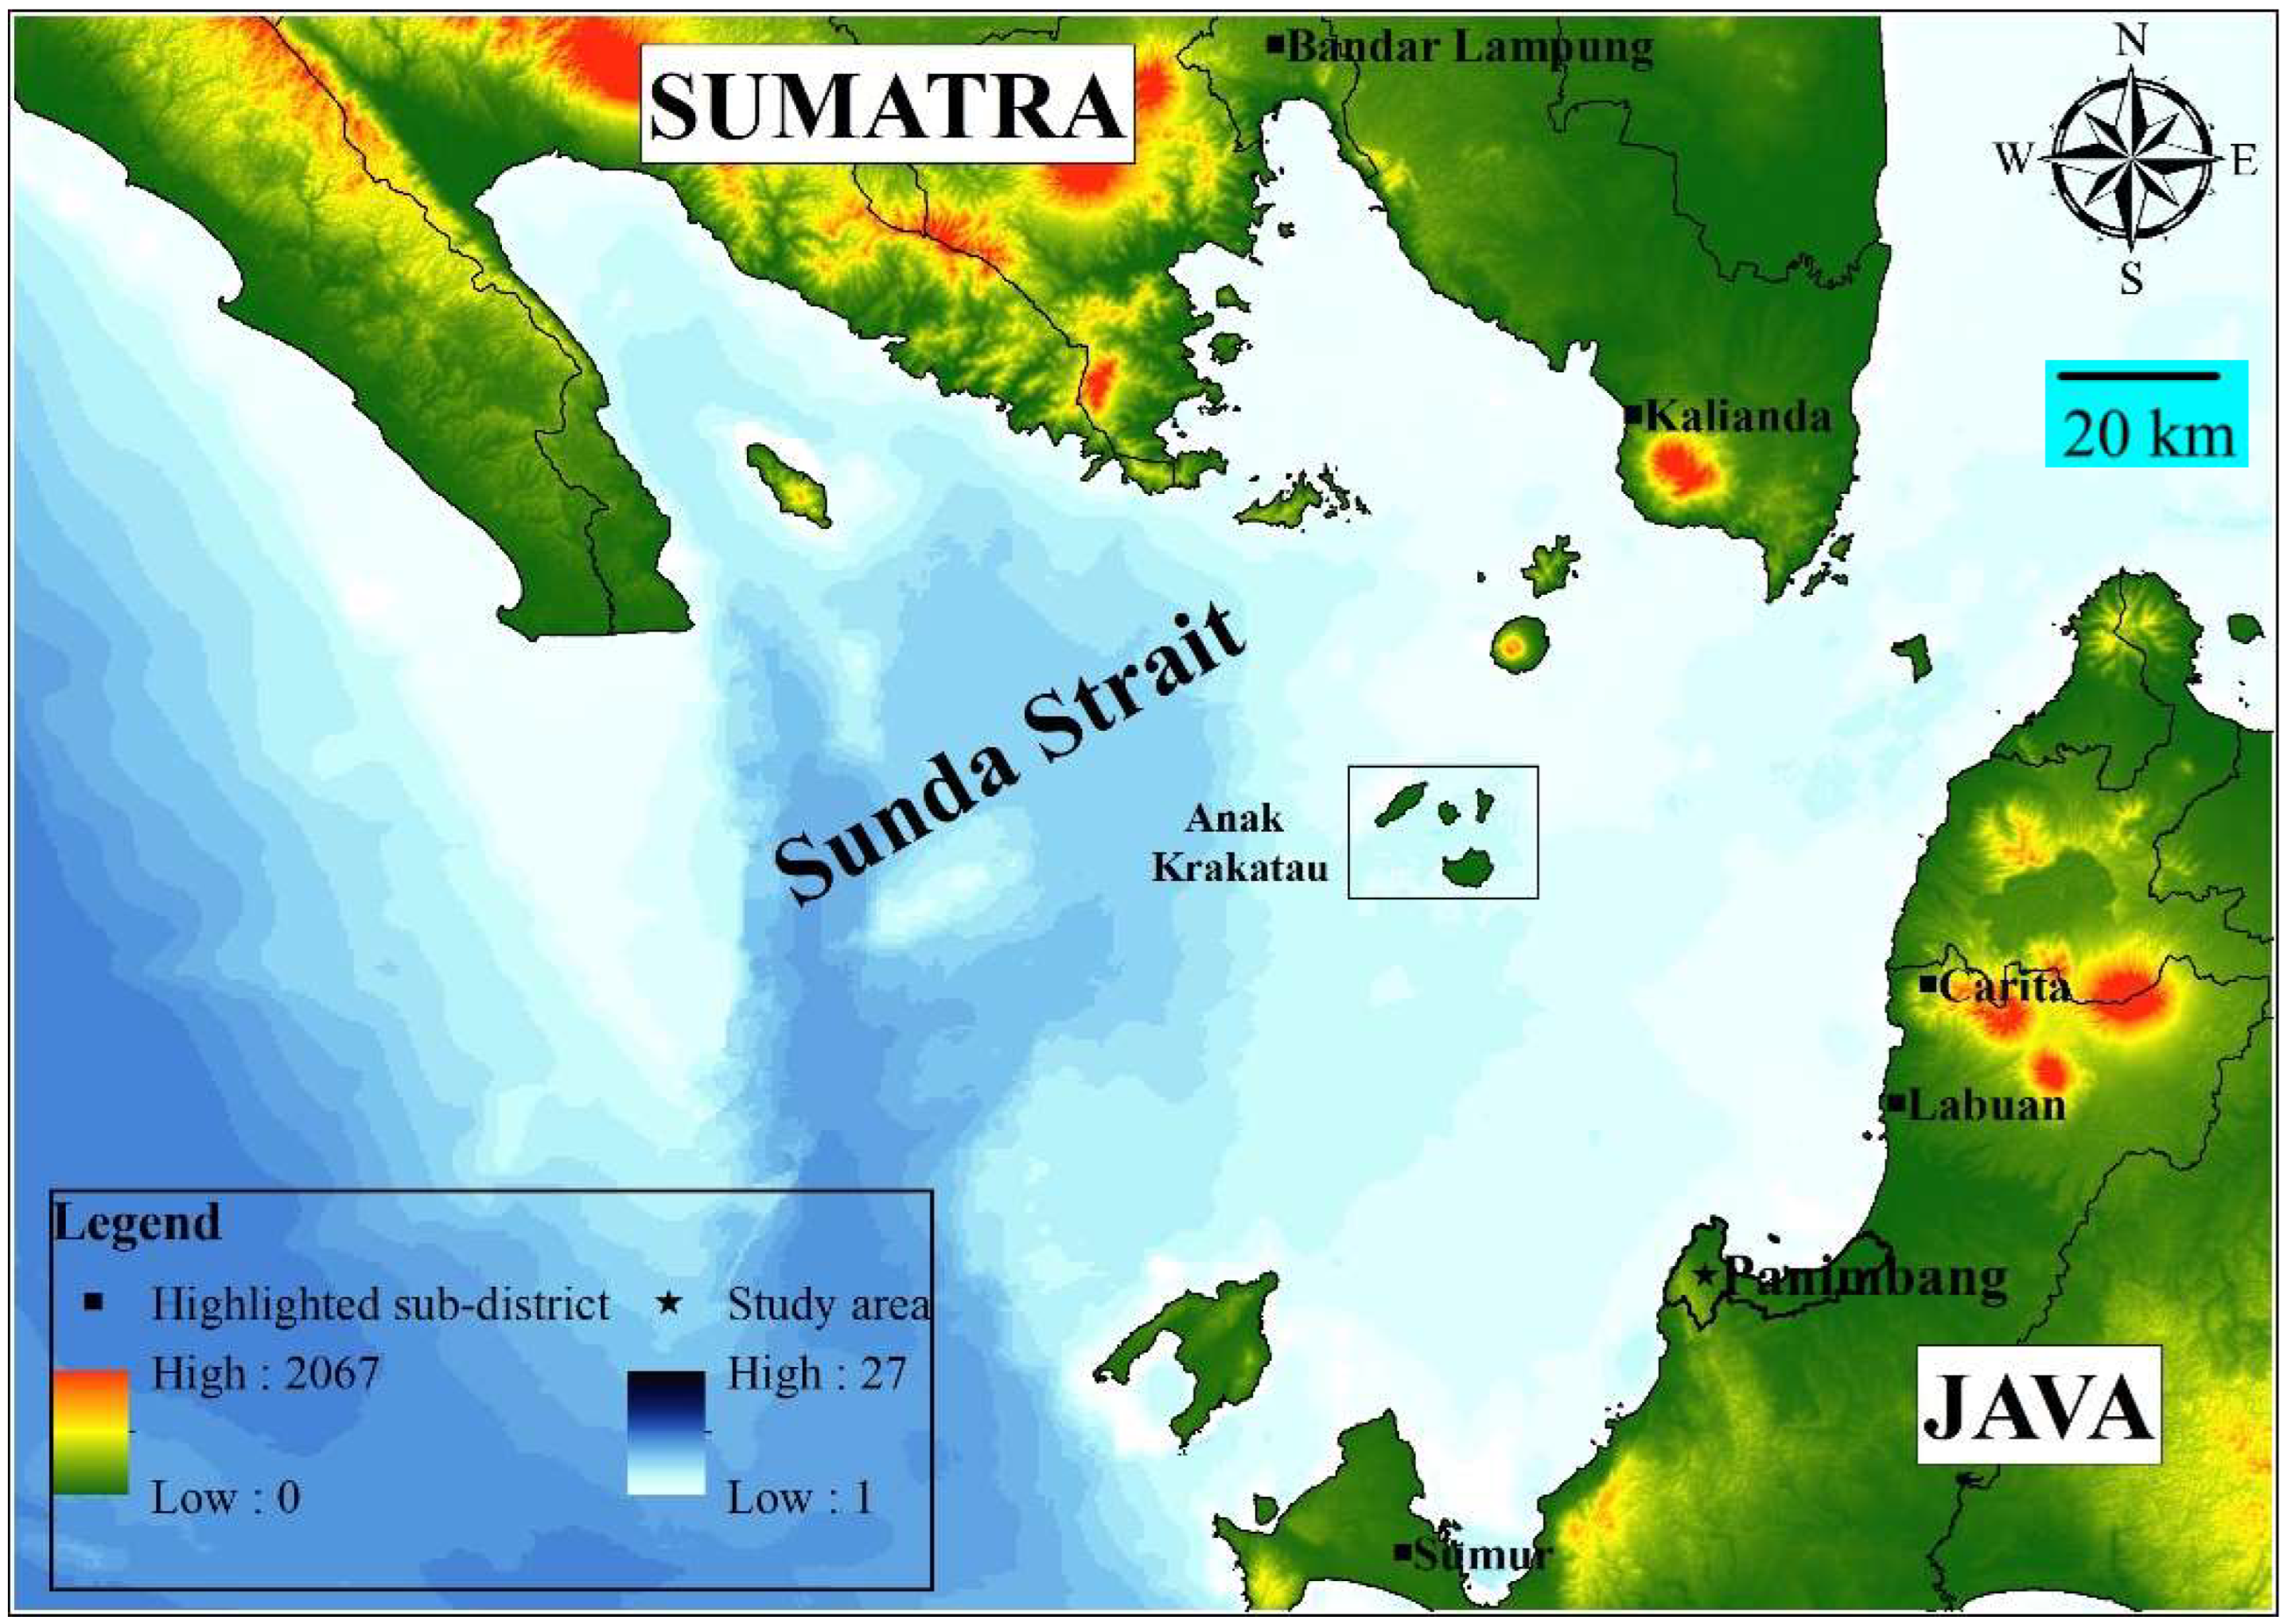
2.1. Study Area
2.2. Datasets
2.2.1. Population Distribution
2.2.2. Road Network
2.2.3. Tsunami Inundation
2.2.4. Shelter Location
2.2.5. Casualty Model
3. Methodology
3.1. NetLogo and Model Setups
3.2. Optimization Algorithm
3.3. Model Behaviour
3.4. Agent Decisions
3.4.1. Transportation Mode Choice
3.4.2. Shelter Choice
3.4.3. Milling Time
3.5. Vehicular Movement
- = The location of the leading vehicle at time t
- = The speed of the leading vehicle
- = The location of the following vehicle at time t
- = The speed of the following vehicle at time t
- = The distance exponent (−1 to +4)
- = The speed exponent (−2 to +2)
- = The sensitivity coefficient
- = The perception-reaction time
3.6. Pedestrian Movement
4. Results
4.1. Transportation Mode Choice
4.2. Shelter Choice
4.3. Scale Parameter
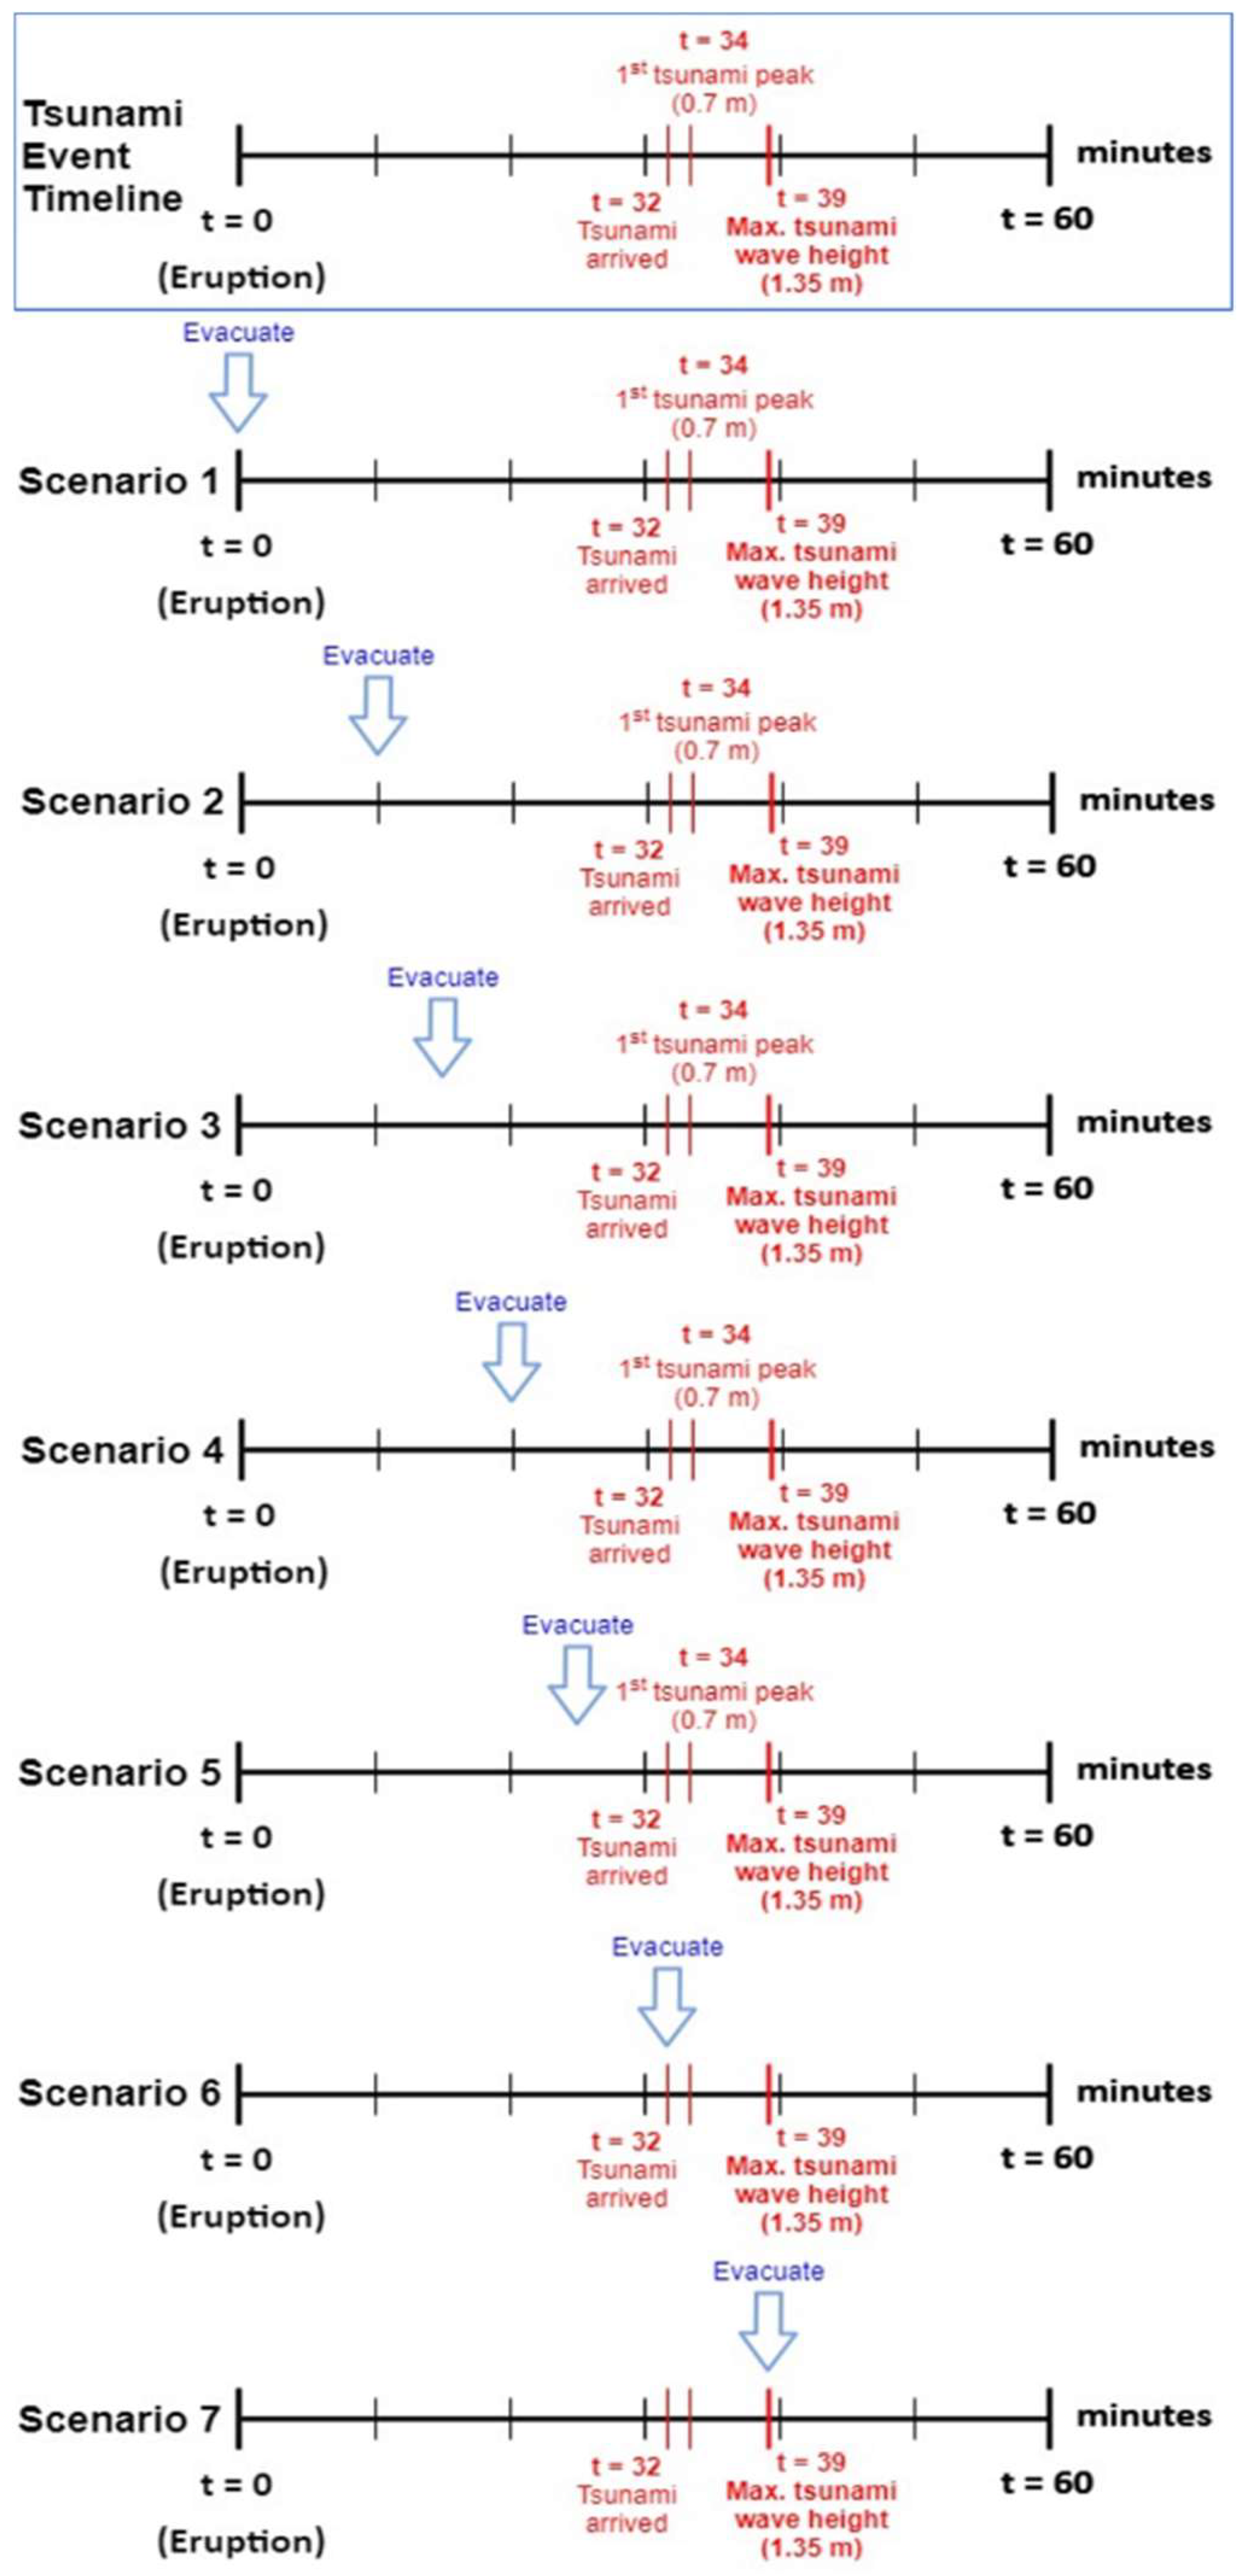
4.4. Scenario Analysis
4.5. Tsunami Risk Hot Spots
5. Discussion
Effects of VESs
6. Conclusions
Supplementary Materials
Author Contributions
Funding
Institutional Review Board Statement
Informed Consent Statement
Data Availability Statement
Acknowledgments
Conflicts of Interest
References
- Ashar, F.; Amaratunga, D.; Haigh, R. The Analysis of Tsunami Vertical Shelter in Padang City. Procedia Econ. Financ. 2014, 18, 916–923. [Google Scholar] [CrossRef] [Green Version]
- Nurhayaty, A.; Wimbarti, S.; Triatmadja, R.; Hastjarjo, T.D. Model of Tsunami Preparedness for Indonesian Tsunami Prone Areas Communities. J. Disaster Res. 2015, 10, 957–965. [Google Scholar] [CrossRef]
- Rogers, K. Indonesia Disaster Reveals Community Preparedness Shortfalls; Devex: Washington, DC, USA, 2018. [Google Scholar]
- The Joint Committee of Indonesia and Japan on Disaster Reduction. Building the Resilience of Indonesia and its Communities to Disasters for the Next Generation; The Joint Committee of Indonesia and Japan on Disaster Reduction: Tokyo, Japan, 2006; p. 35.
- Kodijat, A.M.; Rossel, B.A.; Julius, A.M.; Octonovrilna, L.; Cahyaningrum, A.P. Preserving past tsunami information for future preparedness in Indonesia and the Philippines. MATEC Web Conf. 2018, 229, 01016. [Google Scholar] [CrossRef] [Green Version]
- Adiyoso, W.; Kanegae, H. The effect of different disaster education programs on tsunami preparedness among schoolchildren in Aceh, Indonesia. Disaster Mitig. Cult. Herit. Hist. Cities 2012, 6, 165–172. [Google Scholar]
- Davis, J.R.; Paramygin, V.A.; Figueiredo, R.J.; Sheng, Y.P.; Vogiatzis, C.; Pardalos, P.M. The Coastal Science Educational Virtual Appliance (CSEVA); ASCE: Reston, VA, USA, 2011; pp. 359–377.
- LIPI (The Indonesian Institute of Sciences); BMKG (Meteorological, Climatological, and G.A., & BNPB (Indonesia National Geospatial Information Agency). Information Guidebook Tsunami Early Warning for Broadcasting Institutions in Indonesia; LIPI: Indonesia; BMKG: Indonesia, 2012.
- Syamsidik; Benazir; Luthfi, M.; Suppasri, A.; Comfort, L.K. The 22 December 2018 Mount Anak Krakatau volcanogenic tsunami on Sunda Strait coasts, Indonesia: Tsunami and damage characteristics. Nat. Hazards Earth Syst. Sci. 2020, 20, 549–565. [Google Scholar] [CrossRef] [Green Version]
- Usman, F.; Murakami, K.; Dwi Wicaksono, A.; Setiawan, E. Application of Agent-Based Model Simulation for Tsunami Evacuation in Pacitan, Indonesia. MATEC Web Conf. 2017, 97, 01064. [Google Scholar] [CrossRef] [Green Version]
- Mas, E.; Koshimura, S.; Imamura, F.; Suppasri, A.; Muhari, A.; Adriano, B. Recent Advances in Agent-Based Tsunami Evacuation Simulations: Case Studies in Indonesia, Thailand, Japan and Peru. Pure Appl. Geophys. 2015, 172, 3409–3424. [Google Scholar] [CrossRef] [Green Version]
- Yosritzal; Kemal, B.M.; Purnawan; Putra, H. An observation of the walking speed of evacuees during a simulated tsunami evacuation in Padang, Indonesia. IOP Conf. Ser. Earth Environ. Sci. 2018, 140, 012090. [Google Scholar] [CrossRef]
- Lämmel, G.; Rieser, M.; Nagel, K.; Taubenböck, H.; Strunz, G.; Goseberg, N.; Schlurmann, T.; Klüpfel, H.; Setiadi, N.; Birkmann, J. Emergency Preparedness in the Case of a Tsunami—Evacuation Analysis and Traffic Optimization for the Indonesian City of Padang. In Pedestrian and Evacuation Dynamics 2008; Klingsch, W.W.F., Rogsch, C., Schadschneider, A., Schreckenberg, M., Eds.; Springer: Berlin/Heidelberg, Germany, 2010; pp. 171–182. [Google Scholar]
- Wafda, F.; Saputra, R.W.; Nurdin, Y.; Nasaruddin; Munadi, K. Agent-based tsunami evacuation simulation for disaster education. In Proceedings of the International Conference on ICT for Smart Society, Jakarta, Indonesia, 13–14 June 2013; pp. 1–4. [Google Scholar]
- Goto, Y.; Muzailin, A.; Agussabti; Yudha, N.; Diyah, K.Y.; Ardiansyah. Tsunami Evacuation Simulation for Disaster Education and City Planning. J. Disaster Res. 2012, 7, 92–101. [Google Scholar] [CrossRef]
- Paris, A.; Heinrich, P.; Paris, R.; Abadie, S. The December 22, 2018 Anak Krakatau, Indonesia, Landslide and Tsunami: Preliminary Modeling Results. Pure Appl. Geophys. 2020, 177, 571–590. [Google Scholar] [CrossRef] [Green Version]
- Takabatake, T.; Shibayama, T.; Esteban, M.; Achiari, H.; Nurisman, N.; Gelfi, M.; Tarigan, T.A.; Kencana, E.R.; Fauzi MA, R.; Panalaran, S. Field survey and evacuation behaviour during the 2018 Sunda Strait tsunami. Coast. Eng. J. 2019, 61, 423–443. [Google Scholar] [CrossRef]
- Ren, Z.; Wang, Y.; Wang, P.; Hou, J.; Gao, Y.; Zhao, L. Numerical study of the triggering mechanism of the 2018 Anak Krakatau tsunami: Eruption or collapsed landslide? Nat. Hazards 2020, 102, 1–13. [Google Scholar] [CrossRef]
- Suwarsono Nf Prasasti, I.; Nugroho, J.T.; Sitorus, J.; Triyono, D. Detecting the lava flow deposits from 2018 Anak Krakatau eruption using data fusion Landsat-8 optic and Sentinel-1 SAR. Int. J. Remote Sens. Earth Sci. 2019, 15, 157–166. [Google Scholar]
- Maeno, F.; Imamura, F. Tsunami generation by a rapid entrance of pyroclastic flow into the sea during the 1883 Krakatau eruption, Indonesia. J. Geophys. Res. Solid Earth 2011, 116, B09205. [Google Scholar] [CrossRef] [Green Version]
- Kimata, F.; Pamitro, Y.E.; Abidin, H.Z. Understanding the 2007–2008 eruption of Anak Krakatau Volcano by combining remote sensing technique and seismic data. Int. J. Appl. Earth Obs. Geoinf. 2012, 14, 73–82. [Google Scholar]
- BNPB (Indonesia National Geospatial Information Agency). Indonesia Tsunami Historical Data; BNPB: Cibinong, Indonesia, 2019. Available online: https://bnpb.go.id/ (accessed on 15 November 2020).
- BNPB (Indonesia National Geospatial Information Agency). The Sunda Strait Tsunami, Update on 13 January 2019; BNPB: Cibinong, Indonesia, 2019. Available online: https://bnpb.go.id/ (accessed on 30 November 2020).
- BPS (Statistics Indonesia—Pandeglang District). Pandeglang Dalam Angka; BPS: Central Jakarta, Indonesia, 2018. [Google Scholar]
- BPS (Statistics Indonesia). Number of Motor Vehicles by Types, Indonesia 1949–2018. In Statistics Indonesia; Statistics Indonesia: Central Jakarta, Indonesia, 2019. Available online: https://www.bps.go.id/linkTableDinamis/view/id/1133 (accessed on 30 November 2020).
- Heidarzadeh, M.; Ishibe, T.; Sandanbata, O.; Muhari, A.; Wijanarto, A.B. Numerical modeling of the subaerial landslide source of the 22 December 2018 Anak Krakatoa volcanic tsunami, Indonesia. Ocean. Eng. 2020, 195, 106733. [Google Scholar] [CrossRef]
- Sithole, G.; Vosselman, G. Experimental comparison of filter algorithms for bare-Earth extraction from airborne laser scanning point clouds. ISPRS J. Photogramm. Remote Sens. 2004, 59, 85–101. [Google Scholar] [CrossRef]
- FEMA. Guidelines for Design of Structures for Vertical Evacuation from Tsunamis; US Department of Homeland Security, Federal Emergency Management Agency: Washington, DC, USA, 2009.
- Rojahn, C.; Heintz, J.A.; Hortacsu, A.; Clark, J.L.; Ewing, L.; Goltz, J.D.; Holmes, W.T.; Petty, E.; Priest, G.; Turner, A. Vertical Evacuation from Tsunamis: A Guide for Community Officials; Federal Emergency Management Agency: Washington, DC, USA, 2009. [Google Scholar]
- Wang, H.; Mostafizi, A.; Cramer, L.A.; Cox, D.; Park, H. An agent-based model of a multimodal near-field tsunami evacuation: Decision-making and life safety. Transp. Res. Part C Emerg. Technol. 2016, 64, 86–100. [Google Scholar] [CrossRef]
- Yeh, H. Gender and age factors in tsunami casualties. Nat. Hazards Rev. 2010, 11, 29–34. [Google Scholar] [CrossRef]
- Wilensky, U. NetLogo; Center for Connected Learning and Computer-Based Modeling, Northwestern University: Evanston, IL, USA, 1999. [Google Scholar]
- Mostafizi, A.; Wang, H.; Cox, D.; Dong, S. An agent-based vertical evacuation model for a near-field tsunami: Choice behavior, logical shelter locations, and life safety. Int. J. Disaster Risk Reduct. 2019, 34, 467–479. [Google Scholar] [CrossRef]
- Dijkstra, E.W. A note on two problems in connexion with graphs. Numer. Math. 1959, 1, 269–271. [Google Scholar] [CrossRef] [Green Version]
- Jungnickel, D. The Greedy Algorithm. In Graphs, Networks and Algorithms; Jungnickel, D., Ed.; Springer: Berlin/Heidelberg, Germany, 1999; pp. 129–153. [Google Scholar]
- Sudhakara, P.; Ganapathy, V. Trajectory planning of a mobile robot using enhanced A-star algorithm. Indian J. Sci. Technol. 2016, 9, 1–10. [Google Scholar] [CrossRef]
- Mostafizi, A.; Wang, H.; Cox, D.; Cramer, L.A.; Dong, S. Agent-based tsunami evacuation modeling of unplanned network disruptions for evidence-driven resource allocation and retrofitting strategies. Nat. Hazards 2017, 88, 1347–1372. [Google Scholar] [CrossRef]
- Mostafizi, A. Agent-Based Tsunami Evacuation Model: Life Safety and Network Resilience. Master’s. Thesis, Oregon State University, Corvallis, OR, USA, 2016. [Google Scholar]
- National Research Council. Facing Hazards and Disasters: Understanding Human Dimensions; National Academies Press: Washington, DC, USA, 2016.
- Lindell, M.; Prater, C. Critical Behavioral Assumptions in Evacuation Time Estimate Analysis for Private Vehicles: Examples from Hurricane Research and Planning. J. Urban Plan. Dev. 2007, 133, 18–29. [Google Scholar] [CrossRef]
- Mas, E.; Supassri, A.; Imamura, F.; Koshimura, S. Agent-based Simulation of the 2011 Great East Japan Earthquake/Tsunami Evacuation: An Integrated Model of Tsunami Inundation and Evacuation. J. Nat. Disaster Sci. 2012, 34, 41–57. [Google Scholar] [CrossRef] [Green Version]
- Brackstone, M.; McDonald, M. Car-following: A historical review. Transp. Res. Part F Traffic Psychol. Behav. 1999, 2, 181–196. [Google Scholar] [CrossRef]
- Herman, R.; Montroll, E.W.; Potts, R.B.; Rothery, R.W. Traffic dynamics: Analysis of stability in car following. Oper. Res. 1959, 7, 86–106. [Google Scholar] [CrossRef]
- Ahmed, H.U.; Huang, Y.; Lu, P. A Review of Car-Following Models and Modeling Tools for Human and Autonomous-Ready Driving Behaviors in Micro-Simulation. Smart Cities 2021, 4, 314–335. [Google Scholar] [CrossRef]
- Gunawan, H.; Ruslinda, Y.; Putri, D. Pengaruh Karakteristik Lalu Lintas terhadap Konsentrasi Gas NO2 di Udara Ambien Roadside Jaringan Jalan Sekunder Kota Padang. In Proceedings of the Andalas Civil Engineering (ACE) Conference, Padang, Indonesia, 13–14 August 2015. [Google Scholar]
- Lee, S.H.; Goo, S.H.; Chun, Y.W.; Park, Y.J. The Spatial Location Analysis of Disaster Evacuation Shelter for Considering Resistance of Road Slope and Difference of Walking Speed by Age—Case Study of Seoul, Korea. J. Korean Soc. Geospat. Inf. Syst. 2015, 23, 69–77. [Google Scholar] [CrossRef]
- Faiqoh, I.; Gaol, J.L.; Ling, M.M. Vulnerability Level Map of Tsunami Disaster in Pangandaran Beach, West Java. Int. J. Remote Sens. Earth Sci. 2013, 10, 90–103. [Google Scholar] [CrossRef] [Green Version]
- Hadi, F.; Damayanti, A. Aplikasi Sig Untuk Pemetaan Zona Keterpaparan Permukiman Terhadap Tsunami. Semin. Nas. Geomatika 2018, 2, 317–324. [Google Scholar] [CrossRef] [Green Version]
- Muzaki, A.A. Spatial Analysis of Reef Ecosystem Based of the Marine Conservation Using Cell Based Modelling Method in Seribu Island, DKI Jakarta. Ph.D. Thesis, Bogor Agricultural University, Bogor, Indonesia, 2008. [Google Scholar]
- Cabrera, J.; Lee, H.S. Flood risk assessment for Davao Oriental in the Philippines using geographic information system-based multi-criteria analysis and the maximum entropy model. J. Flood Risk Manag. 2020, 13, e12607. [Google Scholar] [CrossRef] [Green Version]
- Cabrera, J.; Lee, H.S. Flood risk assessment using GIS-based multi-criteria analysis: A case study in Davao Oriental, Philippines. Water 2019, 11, 2203. [Google Scholar] [CrossRef] [Green Version]
- Davis, J.R.; Paramygin, V.A.; Vogiatzis, C.; Sheng, Y.P.; Pardalos, P.M.; Figueiredo, R.J. Strengthening the Resiliency of a Coastal Transportation System through Integrated Simulation of Storm Surge, Inundation, and Nonrecurrent Congestion in Northeast Florida. J. Mar. Sci. Eng. 2014, 2, 287–305. [Google Scholar] [CrossRef] [Green Version]


| Agent Type | Mode 1 | Mode 2 | Mode 3 | Mode 4 | Mode 5 | Mode 6 | Mode 7 | Mode 8 | Mode 9 | Mode 10 | Mode 11 |
|---|---|---|---|---|---|---|---|---|---|---|---|
| Adults | 51.42 | 48.85 | 46.28 | 43.71 | 41.14 | 38.57 | 35.99 | 33.42 | 30.85 | 28.28 | 25.71 |
| Elderly people | 17.26 | 16.40 | 15.53 | 14.67 | 13.81 | 12.95 | 12.08 | 11.22 | 10.36 | 9.49 | 8.63 |
| Children | 31.32 | 29.75 | 28.19 | 26.62 | 25.06 | 23.49 | 21.92 | 20.36 | 18.79 | 17.23 | 15.66 |
| Cars | 0.00 | 0.91 | 1.82 | 2.73 | 3.64 | 4.55 | 5.46 | 6.37 | 7.28 | 8.19 | 9.10 |
| Motorcycles | 0.00 | 4.09 | 8.18 | 12.27 | 16.36 | 20.45 | 24.54 | 28.63 | 32.72 | 36.81 | 40.90 |
| σ | Percentage of Agents Starting Their Evacuation | ||
|---|---|---|---|
| 50% | 95% | 99% | |
| 1.0 | 1.2 | 2.4 | 3.0 |
| 2.0 | 2.4 | 4.9 | 6.1 |
| 4.0 | 4.7 | 9.8 | 12.1 |
| 8.0 | 9.4 | 19.6 | 24.3 |
| Age | Reference [46] | This Study | ||
|---|---|---|---|---|
| Walking Speed | Walking Speed | |||
| (km/h) | (m/s) | (km/h) | (m/s) | |
| 0–4 | ~ | ~ | 2.91 | 0.808 |
| 5–9 | 2.17 | 0.603 | ||
| 10–14 | 3.39 | 0.942 | ||
| 15–49 | 4.00 | 1.111 | 4.00 | 1.111 |
| 50–64 | 3.40 | 0.944 | 2.78 | 0.772 |
| 65–74 | 2.82 | 0.783 | ||
| 75+ | 2.51 | 0.697 | ||
| Criteria | Class | Score | Weight |
|---|---|---|---|
| Distance from the shoreline (m) | 0–500 m | 5 | 30 |
| 501–1000 m | 4 | ||
| 1001–1500 m | 3 | ||
| 1501–3000 m | 2 | ||
| >3000 m | 1 | ||
| Elevation (m) | <10 m | 5 | 30 |
| 11–25 m | 4 | ||
| 26–50 m | 3 | ||
| 51–100 m | 2 | ||
| >100 m | 1 | ||
| Slope (%) | 0–2% | 5 | 25 |
| 3–5% | 4 | ||
| 6–15% | 3 | ||
| 16–40% | 2 | ||
| >40% | 1 | ||
| Distance from rivers (m) | 0–100 m | 5 | 15 |
| 101–200 m | 4 | ||
| 201–300 m | 3 | ||
| 301–500 m | 2 | ||
| >500 m | 1 |
Publisher’s Note: MDPI stays neutral with regard to jurisdictional claims in published maps and institutional affiliations. |
© 2022 by the authors. Licensee MDPI, Basel, Switzerland. This article is an open access article distributed under the terms and conditions of the Creative Commons Attribution (CC BY) license (https://creativecommons.org/licenses/by/4.0/).
Share and Cite
Lee, H.S.; Sambuaga, R.D.; Flores, C. Effects of Tsunami Shelters in Pandeglang, Banten, Indonesia, Based on Agent-Based Modelling: A Case Study of the 2018 Anak Krakatoa Volcanic Tsunami. J. Mar. Sci. Eng. 2022, 10, 1055. https://0-doi-org.brum.beds.ac.uk/10.3390/jmse10081055
Lee HS, Sambuaga RD, Flores C. Effects of Tsunami Shelters in Pandeglang, Banten, Indonesia, Based on Agent-Based Modelling: A Case Study of the 2018 Anak Krakatoa Volcanic Tsunami. Journal of Marine Science and Engineering. 2022; 10(8):1055. https://0-doi-org.brum.beds.ac.uk/10.3390/jmse10081055
Chicago/Turabian StyleLee, Han Soo, Ricard Diago Sambuaga, and Constanza Flores. 2022. "Effects of Tsunami Shelters in Pandeglang, Banten, Indonesia, Based on Agent-Based Modelling: A Case Study of the 2018 Anak Krakatoa Volcanic Tsunami" Journal of Marine Science and Engineering 10, no. 8: 1055. https://0-doi-org.brum.beds.ac.uk/10.3390/jmse10081055