Study on Transient Overvoltage of Offshore Wind Farm Considering Different Electrical Characteristics of Vacuum Circuit Breaker

 , , , , ,
Abstract
:1. Introduction
2. System Component Simulation Model
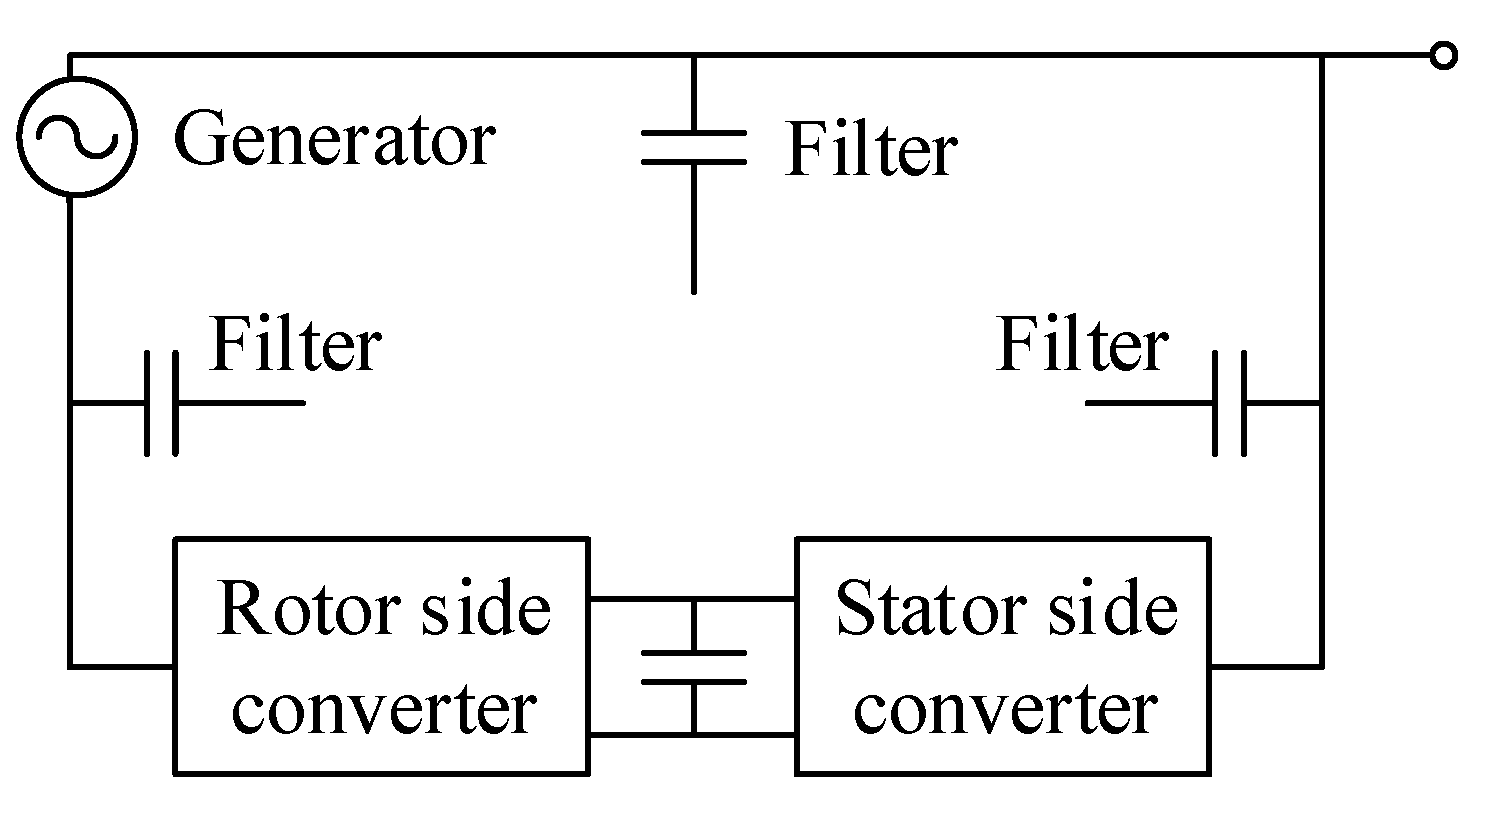
2.1. DFIG Model
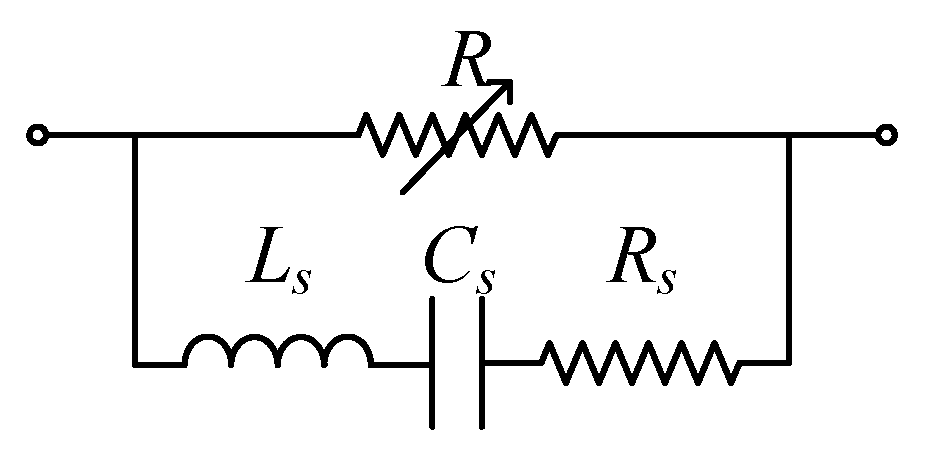
2.2. VCB Model
2.2.1. Chopping Current
2.2.2. Dielectric Strength
2.2.3. HF Arc Quenching Capability
2.2.4. Arcing Voltage
2.3. Other Models
2.3.1. Transformer Model
2.3.2. Submarine Cable Model
3. Description of Experimental Test System and Model Verification
3.1. Description of Experimental Test System
3.2. Model Verification
4. VCB Switching Modes of OWF Internal Electrical System
5. Simulation of Internal Electrical System in OWF
5.1. Simulation System Setting
5.2. Relation Between Transformer Position and Overvoltage in Normal Switching
5.3. Relation between Transformer Position and Overvoltage in Fault Switching
5.3.1. VCB Switching at Feeder
5.3.2. VCB Switching at Tower Bottom
6. Conclusions
- (1)
- The overvoltage amplitude of the high voltage side of the transformer at different positions was basically the same in switching off feeder VCB. When the tower bottom VCB had normal or fault switching, the overvoltage steepness decreased with the increase of the propagation distance of the incident wave. The voltage amplitudes at the high-voltage side of the transformers in other positions were slightly influenced.
- (2)
- With experimental parameters, the critical overvoltage occurred in switching off VCBs at the tower bottom, the overvoltage amplitude in normal switching was the largest, up to 1.83 p.u., while the steepness of the overvoltage generated in fault switching was the largest, up to 142 kV/μs, and the total numbers of reignition were 9–10 times.
- (3)
- Due to the difference of dielectric strength of the VCB, when using the experimental parameters measured in this study, the amplitude of overvoltage of the terminal transformer was reduced to 1/2, and the steepness was reduced to 1/1.5 compared with using the traditional parameters of VCB under the same operation condition, in case of switching off VCB at the tower bottom with wind turbines full loading. Therefore, it is recommended that the actual experimental parameters of VCBs should be adopted in the following researches.
Author Contributions
Funding
Acknowledgments
Conflicts of Interest
References
- Esteban, M.D.; Espada, J.M.; Ortega, J.M.; López-Gutiérrez, J.-S.; Negro, V. What about Marine Renewable Energies in Spain? J. Mar. Sci. Eng. 2019, 7, 249. [Google Scholar] [CrossRef]
- Onea, F.; Rusu, L. A Study on the Wind Energy Potential in the Romanian Coastal Environment. J. Mar. Sci. Eng. 2019, 7, 142. [Google Scholar] [CrossRef]
- Gintautas, T.; Sørensen, J.D. Improved Methodology of Weather Window Prediction for Offshore Operations Based on Probabilities of Operation Failure. J. Mar. Sci. Eng. 2017, 5, 20. [Google Scholar] [CrossRef]
- Lei, Y.; Jian, W.; Gang, L.; Hui, M.; Ming, Z. Thermal Rating of Offshore Wind Farm Cables Installed in Ventilated J-Tubes. Energies 2018, 11, 545. [Google Scholar]
- Wang, P.Y.; Ma, H.; Liu, G.; Han, Z.Z.; Kang, L.Y. Dynamic Thermal Analysis of High-voltage Power Cable Insulation for Cable Dynamic Thermal Rating. IEEE Access 2019, 7, 56095–56106. [Google Scholar] [CrossRef]
- Wang, P.; Liu, G.; Ma, H.; Liu, Y.; Xu, T. Investigation of the Ampacity of a Prefabricated Straight-Through Joint of High Voltage Cable. Energies 2017, 10, 2050. [Google Scholar] [CrossRef]
- Xie, Y.; Liu, G.; Zhao, Y.; Li, L.; Ohki, Y. Rejuvenation of retired power cables by heat treatment. IEEE Trans. Dielectr. Electr. Insul. 2019, 26, 668–670. [Google Scholar] [CrossRef]
- Xie, Y.; Zhao, Y.; Liu, G.; Huang, J.; Li, L. Annealing Effects on XLPE Insulation of Retired High-Voltage Cable. IEEE Access 2019, 7, 104344–104353. [Google Scholar] [CrossRef]
- Sweet, W. Danish wind turbines take unfortunate turn. IEEE Spectr. 2004, 41, 30. [Google Scholar] [CrossRef]
- Zhou, J.; Xin, Y.; Tang, W.; Liu, G.; Wu, Q. Impact Factor Identification for Switching Overvoltage in an Offshore Wind Farm by Analyzing Multiple Ignition Transients. IEEE Access 2019, 7, 64651–64662. [Google Scholar] [CrossRef]
- Shipp, D.D.; Dionise, T.J.; Lorch, V.; Macfarlane, B.G. Transformer failure due to circuit breaker induced switching transients. IEEE Trans. Ind. Appl. 2011, 47, 707–718. [Google Scholar] [CrossRef]
- Xin, Y.; Tang, W.; Zhou, J.; Yang, Y.; Liu, G. Sensitivity analysis of reignition overvoltage for vacuum circuit breaker in offshore wind farm using experiment-based modeling. Electr. Power Syst. Res. 2019, 172, 86. [Google Scholar] [CrossRef]
- Villar, F.S.; Reza, M.; Srivastava, K.; Silva, L. High frequency transients propagation and the multiple reflections effect in collection grids for offshore wind parks. In Proceedings of the Power & Energy Society General Meeting, Detroit, MI, USA, 24–28 July 2011; pp. 1–7. [Google Scholar]
- Liljestrand, L.; Sannino, A.; Breder, H.; Thorburn, S. Transients in collection grids of large offshore wind parks. Wind Energy 2008, 11, 45–61. [Google Scholar] [CrossRef]
- Wang, X.; Liu, X.; Li, Y.; Saboor, A.; Cao, J.; Shang, Y. Study on switching transients of cable collector system in wind power plant. In Proceedings of the 2011 1st International Conference on Electric Power Equipment-Switching Technology, Xi’an, China, 23–27 October 2011; pp. 308–311. [Google Scholar]
- Ghafourian, S.; Arana, I.; Holboll, J.; Sorensen, T.; Popov, M.; Terzija, V. General Analysis of Vacuum Circuit Breaker Switching Overvoltages in Offshore Wind Farms. IEEE Trans. Power Deliv. 2016, 31, 2351–2359. [Google Scholar] [CrossRef]
- Glasdam, J.; Bak, C.L.; Hjerrild, J. Transient studies in large offshore wind farms employing detailed circuit breaker representation. Energies 2012, 5, 2214–2231. [Google Scholar] [CrossRef]
- Holdsworth, L.; Wu, X.G.; Jenkins, N.; Ekanayake, J.B. Dynamic modeling of doubly fed induction generator wind turbines. IEEE Trans. Power Syst. 2003, 18, 803–809. [Google Scholar]
- Xu, B.; Zhang, Z.; Li, C.; Zhan, P.; Wen, J. LCL filters applied in doubly fed induction generator. Elecric Power Autom. Equip. 2015, 35, 44–50. [Google Scholar]
- Badrzadeh, B.; Hogdahl, M.; Isabegovic, E. Transients in Wind Power Plants—Part I: Modeling Methodology and Validation. IEEE Trans. Ind. Appl. 2012, 48, 794–807. [Google Scholar] [CrossRef]
- Ghafourian, S.M. Switching Transients in Large Offshore Wind Farms. Ph.D. Thesis, The University of Manchester, Manchester, UK, 2015. [Google Scholar]
- Abdulahovic, T.; Thiringer, T.; Reza, M.; Breder, H. Vacuum Circuit Breaker Parameter Calculation and Modelling for Power System Transient Studies. IEEE Trans. Power Deliv. 2017, 32, 1165–1172. [Google Scholar] [CrossRef]
- Glinkowski, M.T.; Gutierrez, M.R.; Braun, D. Voltage escalation and reignition behavior of vacuum generator circuit breakers during load shedding. IEEE Trans. Power Deliv. 1997, 12, 219–226. [Google Scholar] [CrossRef]
- Xin, Y.; Bo, L.; Tang, W.; Wu, Q. Modeling and Mitigation for High Frequency Switching Transients Due to Energization in Offshore Wind Farms. Energies 2016, 9, 1044. [Google Scholar] [CrossRef]
- Leusenkamp, M.B.J. Vacuum interrupter model based on breaking tests. IEEE Trans. Plasma Sci. 1999, 27, 969–976. [Google Scholar] [CrossRef]
- Popov, M. Switching three-phase distribution transformers with a vacuum circuit breaker: Analysis of overvoltages and the protection of the equipment. Ph.D. Thesis, Delft University of Technology, Delft, The Netherlands, 2002. [Google Scholar]
- Helmer, J.; Lindmayer, M. Mathematical modeling of the high frequency behavior of vacuum interrupters and comparison with measured transients in power systems. In Proceedings of the 17th International Symposium on Discharges and Electrical Insulation in Vacuum, Berkeley, CA, USA, 21–26 July 1996; pp. 323–331. [Google Scholar]
- Liu, G.; Guo, Y.; Xin, Y.; Lei, Y.; Tang, W. Analysis of switching transients during energization in large offshore wind farms. Energies 2018, 11, 470. [Google Scholar] [CrossRef] [Green Version]
- Abdulahovic, T. Analysis of High-Frequency Electrical Transients in Offshore Wind Parks. Ph.D. Thesis, Chalmers University of Technology, Gothenburg, Sweden, 2011. [Google Scholar]
- Reza, M.; Breder, H. Cable System Transient Study: Vindforsk V-110: Experiments with Switching Transients and Their Mitigation in a Windpower Collection Grid Scale Model. Available online: https://energiforskmedia.blob.core.windows.net/media/19748/cable-system-transient-study-elforskrapport-2009-05.pdf (accessed on 30 September 2019).


| Product Model | Rated Voltage (kV) | Rated Current (A) | Rated Short-Circuit Breaking Current (kA) | Average Opening Speed (m/s) | Clearance between Open Contacts (mm) |
|---|---|---|---|---|---|
| ZN95A-40.5 | 40.5 | 630 | 25 | 1.7 | 18 |
| Parameters Type | A(kV/s) | B(kV) |
|---|---|---|
| traditional parameters | 1.7 × 10⁴ | 3.4 |
| experimental parameters | 7.355 × 10⁴ | 0.69 |
| Switching Case | Traditional Parameters | Experimental Parameters |
|---|---|---|
| normal switching | 10-14 | 0 |
| Switching Case | Traditional Parameters | Experimental Parameters | |
|---|---|---|---|
| fault switching | at feeder | 0 | 0 |
| at tower bottom | 135–-171 | 8–-10 | |
© 2019 by the authors. Licensee MDPI, Basel, Switzerland. This article is an open access article distributed under the terms and conditions of the Creative Commons Attribution (CC BY) license (http://creativecommons.org/licenses/by/4.0/).
Share and Cite
Zhou, Z.; Guo, Y.; Jiang, X.; Liu, G.; Tang, W.; Deng, H.; Li, X.; Zheng, M. Study on Transient Overvoltage of Offshore Wind Farm Considering Different Electrical Characteristics of Vacuum Circuit Breaker. J. Mar. Sci. Eng. 2019, 7, 415. https://0-doi-org.brum.beds.ac.uk/10.3390/jmse7110415
Zhou Z, Guo Y, Jiang X, Liu G, Tang W, Deng H, Li X, Zheng M. Study on Transient Overvoltage of Offshore Wind Farm Considering Different Electrical Characteristics of Vacuum Circuit Breaker. Journal of Marine Science and Engineering. 2019; 7(11):415. https://0-doi-org.brum.beds.ac.uk/10.3390/jmse7110415
Chicago/Turabian StyleZhou, Zikai, Yaxun Guo, Xiaofeng Jiang, Gang Liu, Wenhu Tang, Honglei Deng, Xiaohua Li, and Ming Zheng. 2019. "Study on Transient Overvoltage of Offshore Wind Farm Considering Different Electrical Characteristics of Vacuum Circuit Breaker" Journal of Marine Science and Engineering 7, no. 11: 415. https://0-doi-org.brum.beds.ac.uk/10.3390/jmse7110415