Distribution and Sediment Selection by the Mud Shrimp Upogebia noronhensis (Crustacea: Thalassinidea) and the Potential Effects on the Associated Macroinfaunal Community

 , ,
, ,
Abstract
:1. Introduction
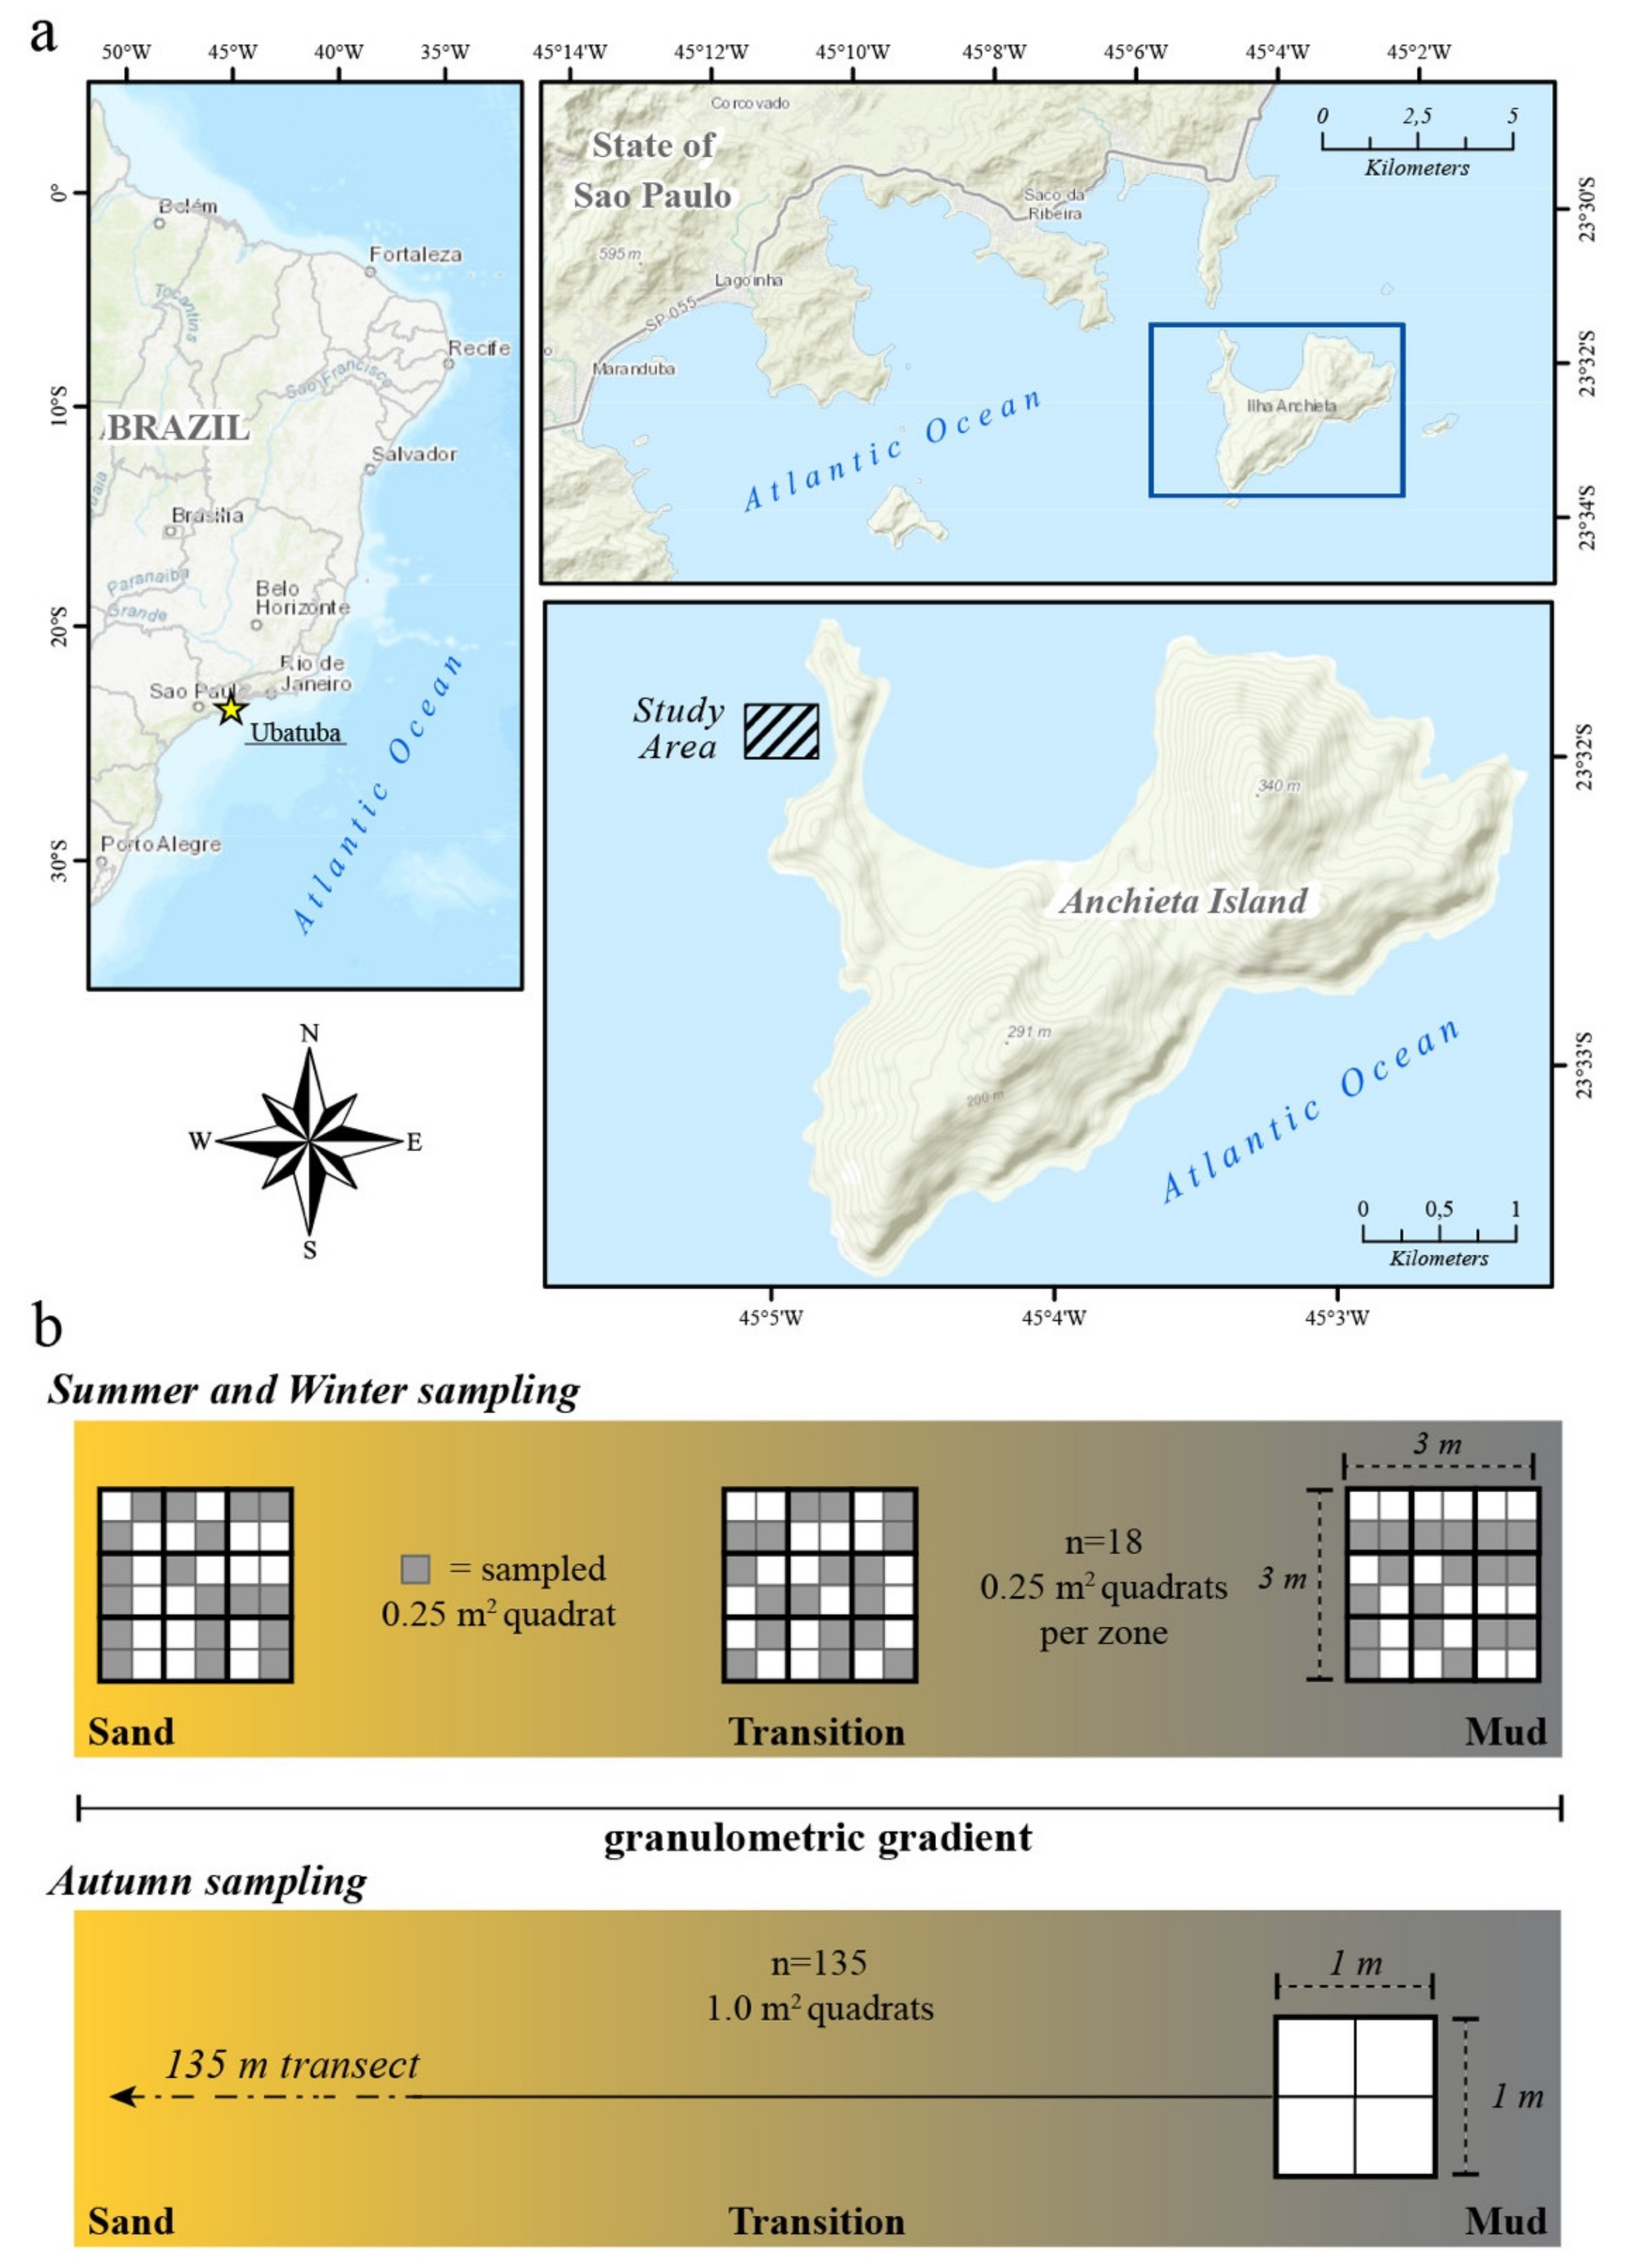
2. Materials and Methods
Data Analysis
3. Results
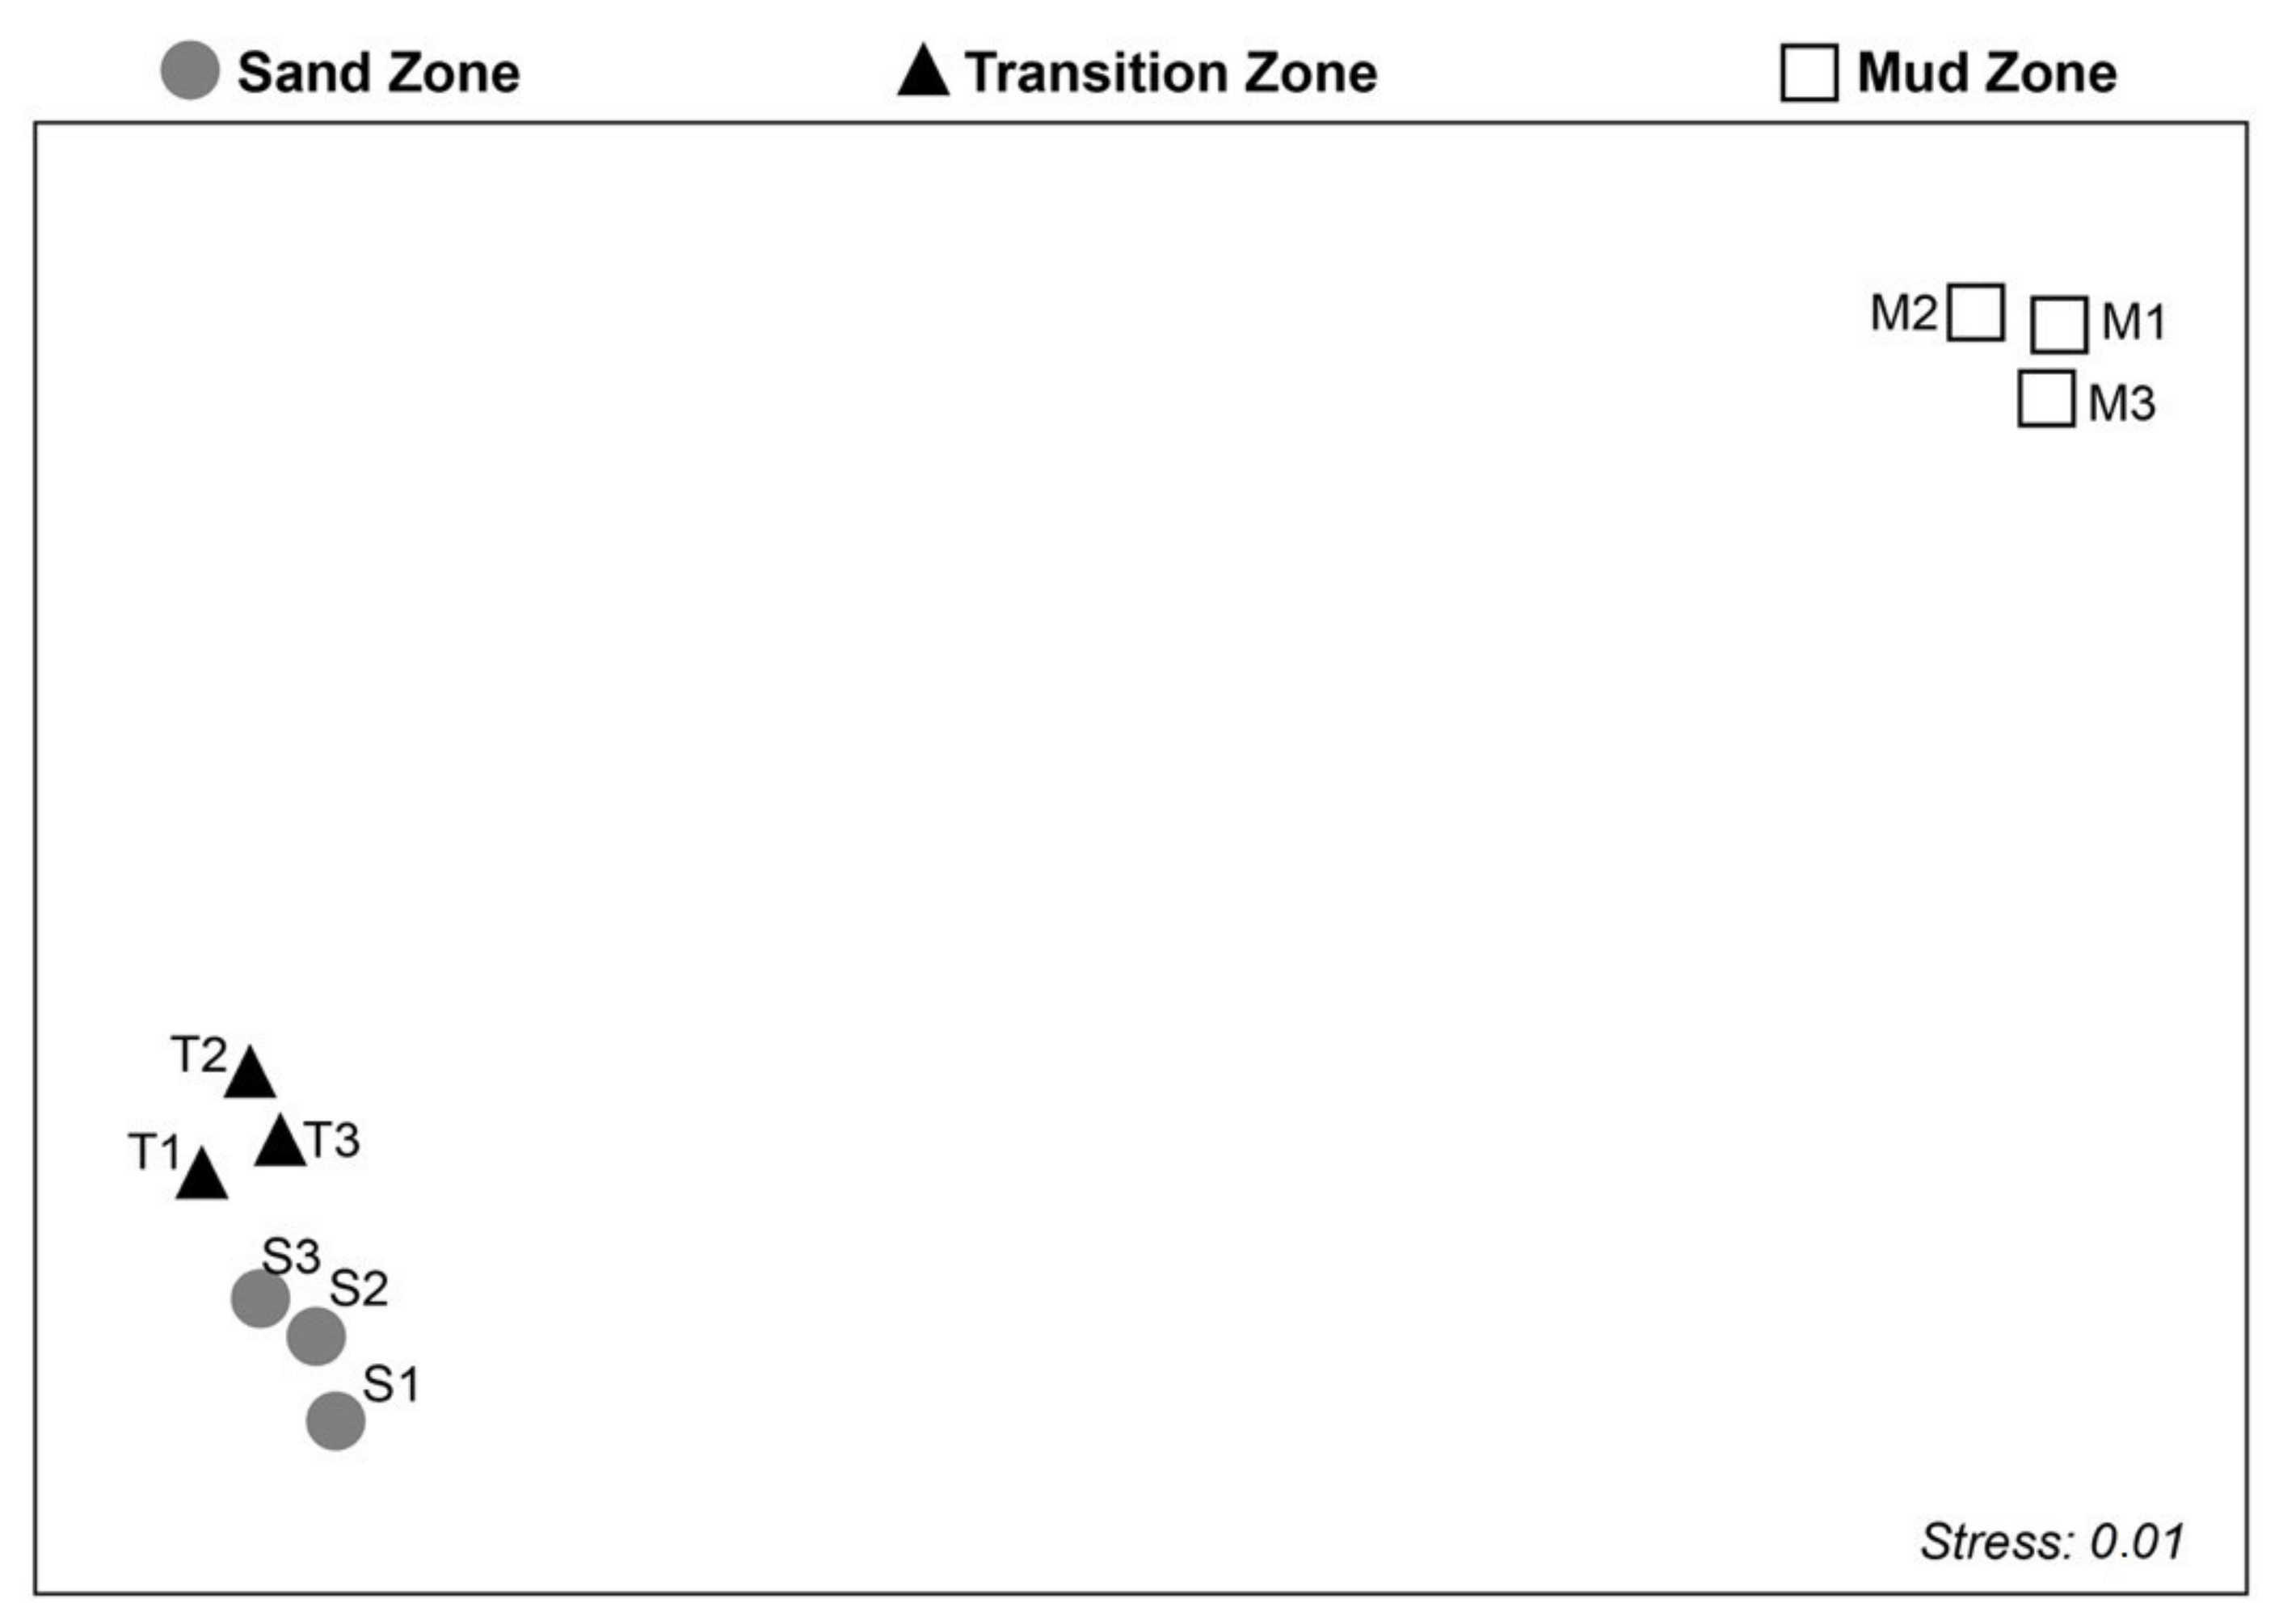
3.1. Macroinfaunal Community Analysis
3.2. Upogebia Noronhensis Distribution
4. Discussion
Author Contributions
Funding
Acknowledgments
Conflicts of Interest
Appendix A

| Summer | Winter | |||||
|---|---|---|---|---|---|---|
| Sand | Transition | Mud | Sand | Transition | Mud | |
| U. noronhensis (ind. m−2 ± SD) | 0.6 ± 0.42 | 144.6 ± 13.82 | 53.8 ± 3.10 | 0 | 135.9 ± 14.54 | 54.1 ± 10.38 |
| Ip | −0.61 * | 0.50 | 0.50 | n/a † | 0.50 | 0.51 |
| Distribution | uniform * | aggregated | aggregated | n/a † | aggregated | aggregated |
| Depth (m) | 7 | 10 | 14 | 7 | 10 | 14 |
| VC sand (%) | 13.7 | 5.4 | 0.5 | 5.9 | 11.3 | 2.2 |
| C sand (%) | 42.2 | 9.0 | 2.8 | 46.1 | 14.2 | 6.4 |
| M sand (%) | 37.5 | 11.5 | 5.7 | 40.4 | 21.3 | 10.0 |
| F sand (%) | 6.1 | 20.2 | 6.5 | 6.6 | 38.5 | 15.3 |
| VF sand (%) | 0.6 | 20.1 | 8.0 | 0.5 | 11.3 | 30.0 |
| Silt (%) | 0 | 21.3 | 57.4 | 0.1 | 0 | 31.0 |
| Clay (%) | 0 | 12.1 | 19.1 | 0 | 0 | 5.2 |
| CaCO3 (%) | 54.2 | 79.9 | 60.9 | 61.6 | 80.4 | 78.6 |
| Taxon | Zones | ||||||||
|---|---|---|---|---|---|---|---|---|---|
| Sand | Transition | Mud | |||||||
| R1 | R2 | R3 | R1 | R2 | R3 | R1 | R2 | R3 | |
| GASTROPODA | |||||||||
| Caecum pulchellum | 0 | 280 | 129 | 2 | 2 | 2 | 0 | 0 | 0 |
| Caecum sp. | 0 | 6 | 6 | 0 | 0 | 0 | 0 | 0 | 0 |
| Aesopus stearnsi | 1 | 0 | 0 | 0 | 0 | 0 | 0 | 0 | 0 |
| Turbonilla dispar | 0 | 1 | 0 | 0 | 0 | 0 | 0 | 0 | 0 |
| Turbonilla sp. | 0 | 1 | 0 | 0 | 1 | 0 | 0 | 0 | 0 |
| Alvania auberiana | 0 | 1 | 0 | 0 | 0 | 0 | 0 | 0 | 0 |
| Assiminea succinea | 0 | 1 | 0 | 0 | 0 | 0 | 0 | 0 | 0 |
| Macromphalina argentina | 0 | 1 | 1 | 0 | 0 | 0 | 0 | 0 | 0 |
| Natica sp. | 0 | 4 | 0 | 0 | 0 | 0 | 0 | 0 | 0 |
| Vitrinella sp. | 0 | 1 | 2 | 0 | 6 | 1 | 0 | 0 | 0 |
| Bulla striata | 0 | 0 | 5 | 3 | 1 | 0 | 0 | 0 | 0 |
| Calyptraea centralis | 0 | 0 | 1 | 0 | 0 | 0 | 1 | 0 | 0 |
| Fissurellidae sp. | 0 | 1 | 1 | 0 | 0 | 0 | 0 | 0 | 0 |
| Not identified | 0 | 0 | 1 | 0 | 0 | 0 | 0 | 0 | 0 |
| BIVALVIA | |||||||||
| Puberella crenata | 1 | 0 | 0 | 0 | 0 | 0 | 0 | 0 | 0 |
| Lirophora paphia | 0 | 4 | 0 | 1 | 1 | 1 | 0 | 0 | 0 |
| Crassinella marplatensis | 1 | 1 | 1 | 0 | 0 | 0 | 0 | 0 | 0 |
| Corbula caribaea | 1 | 39 | 6 | 0 | 5 | 7 | 0 | 0 | 1 |
| Corbula cubaniana | 0 | 0 | 0 | 0 | 0 | 0 | 1 | 0 | 5 |
| Corbula patagonica | 0 | 0 | 0 | 0 | 0 | 0 | 0 | 1 | 2 |
| Corbula sp. | 0 | 0 | 2 | 0 | 0 | 0 | 0 | 1 | 0 |
| Abra aequalis | 1 | 0 | 0 | 0 | 0 | 0 | 0 | 0 | 0 |
| Abra lioica | 1 | 0 | 0 | 0 | 0 | 0 | 0 | 0 | 0 |
| Abra sp. | 0 | 3 | 8 | 5 | 0 | 0 | 0 | 0 | 0 |
| Macoma sp. | 1 | 0 | 0 | 0 | 0 | 0 | 0 | 0 | 0 |
| Tellina sp. | 1 | 3 | 4 | 1 | 1 | 0 | 0 | 0 | 4 |
| Ervilia sp. | 3 | 0 | 0 | 0 | 0 | 0 | 0 | 0 | 0 |
| Pitar fulminatus | 0 | 4 | 30 | 1 | 1 | 0 | 0 | 0 | 0 |
| Pitar rostratus | 0 | 1 | 1 | 1 | 0 | 1 | 0 | 0 | 0 |
| Chama sp. | 0 | 4 | 2 | 0 | 0 | 0 | 0 | 0 | 0 |
| Nucula semiornata | 0 | 1 | 0 | 11 | 4 | 8 | 0 | 0 | 0 |
| Thracia similis | 0 | 3 | 4 | 1 | 0 | 5 | 0 | 0 | 0 |
| Phacoides pectinata | 0 | 1 | 0 | 0 | 0 | 0 | 0 | 0 | 0 |
| Mactra sp. | 0 | 23 | 18 | 1 | 1 | 0 | 0 | 0 | 0 |
| Lioberus castaneus | 0 | 0 | 1 | 0 | 0 | 0 | 0 | 0 | 0 |
| Diplodonta punctata | 0 | 0 | 0 | 0 | 7 | 6 | 0 | 0 | 0 |
| Glycymeris sp. | 0 | 0 | 1 | 0 | 0 | 0 | 0 | 0 | 0 |
| Pandora bushiana | 0 | 0 | 0 | 2 | 0 | 0 | 0 | 0 | 0 |
| Entodesma patagonicum | 0 | 0 | 0 | 1 | 0 | 1 | 0 | 0 | 0 |
| Clathrolucina costata | 0 | 0 | 0 | 1 | 0 | 1 | 0 | 0 | 0 |
| Trachycardium muricatum | 0 | 0 | 0 | 2 | 0 | 0 | 0 | 0 | 0 |
| Anadara sp. | 0 | 0 | 0 | 0 | 0 | 0 | 0 | 0 | 1 |
| Veneridae sp. | 1 | 27 | 0 | 0 | 0 | 0 | 0 | 0 | 0 |
| Mytilidae sp. | 0 | 1 | 0 | 0 | 0 | 0 | 0 | 0 | 0 |
| Lucinidae sp. | 0 | 1 | 0 | 0 | 0 | 0 | 0 | 0 | 0 |
| Ungulinidae sp. | 0 | 5 | 2 | 1 | 0 | 0 | 0 | 0 | 0 |
| Cardiidae sp. | 0 | 0 | 1 | 0 | 0 | 1 | 0 | 0 | 0 |
| Carditidae sp. | 0 | 0 | 1 | 0 | 0 | 0 | 0 | 0 | 0 |
| Tellinidae sp. | 0 | 0 | 0 | 1 | 0 | 0 | 0 | 0 | 0 |
| Semelidae sp. | 0 | 0 | 0 | 0 | 11 | 10 | 0 | 0 | 1 |
| SCAPHOPODA | |||||||||
| Polyschides tetraschitus | 0 | 0 | 0 | 0 | 1 | 0 | 0 | 0 | 0 |
| POLYPLACOPHORA | |||||||||
| Ischnochiton sp. | 1 | 0 | 1 | 0 | 0 | 0 | 0 | 0 | 0 |
| THALASSINIDEA | |||||||||
| Upogebia noronhensis | 0 | 0 | 2 | 0 | 2 | 0 | 0 | 0 | 0 |
| CARIDEA | |||||||||
| Automate sp. | 0 | 2 | 0 | 0 | 0 | 0 | 0 | 0 | 0 |
| Processa hemphilli | 0 | 0 | 0 | 0 | 1 | 0 | 0 | 2 | 0 |
| Alpheus floridanus | 0 | 0 | 0 | 0 | 0 | 0 | 1 | 0 | 1 |
| BRACHYURA | |||||||||
| Tetraxanthus rathbunae | 0 | 1 | 0 | 0 | 0 | 0 | 0 | 0 | 0 |
| Persephona mediterranea | 0 | 0 | 0 | 0 | 1 | 0 | 0 | 0 | 0 |
| Acantholobulus bermudensis | 0 | 0 | 0 | 0 | 0 | 2 | 0 | 0 | 0 |
| Rathbunixa sayana | 0 | 0 | 0 | 0 | 0 | 0 | 2 | 2 | 0 |
| Xanthidae sp. | 0 | 0 | 1 | 0 | 0 | 0 | 0 | 0 | 0 |
| AMPHIPODA | |||||||||
| Tiburonella viscana | 1 | 0 | 0 | 0 | 1 | 0 | 0 | 0 | 0 |
| Idunella titinga | 1 | 1 | 0 | 4 | 5 | 0 | 0 | 0 | 0 |
| Ampelisca cristata | 0 | 7 | 3 | 10 | 6 | 1 | 0 | 1 | 0 |
| Ampelisca pugetica | 0 | 0 | 0 | 0 | 0 | 1 | 0 | 0 | 0 |
| Phoxocephalopsis zimmeri | 0 | 4 | 0 | 0 | 0 | 0 | 0 | 0 | 0 |
| Globosolembos smithi | 0 | 0 | 1 | 0 | 0 | 0 | 0 | 0 | 0 |
| Photis longicaudata | 0 | 0 | 2 | 6 | 1 | 0 | 0 | 0 | 0 |
| Ericthonius brasiliensis | 0 | 0 | 1 | 0 | 0 | 1 | 0 | 0 | 0 |
| Monoculodes nyei | 0 | 0 | 0 | 1 | 0 | 0 | 0 | 0 | 0 |
| Cheiriphotis megacheles | 0 | 0 | 0 | 0 | 0 | 2 | 0 | 0 | 0 |
| Pseudoharpinia dentata | 0 | 0 | 0 | 0 | 0 | 0 | 1 | 0 | 1 |
| Caprellidae sp. | 0 | 7 | 3 | 1 | 0 | 0 | 0 | 0 | 0 |
| Lysianassidae sp. | 0 | 2 | 1 | 2 | 0 | 0 | 0 | 0 | 0 |
| Isaeidae sp. | 0 | 0 | 2 | 0 | 0 | 0 | 0 | 1 | 0 |
| Aoridae sp. | 0 | 0 | 3 | 0 | 0 | 1 | 0 | 0 | 0 |
| Ampeliscidae sp. | 0 | 0 | 0 | 0 | 0 | 1 | 0 | 1 | 0 |
| Not identified | 1 | 0 | 2 | 0 | 1 | 0 | 0 | 0 | 0 |
| POLYCHAETA | |||||||||
| Kinbergonuphis sp. | 2 | 9 | 4 | 0 | 0 | 0 | 0 | 0 | 0 |
| Exogone arenosa | 281 | 65 | 80 | 0 | 3 | 5 | 0 | 0 | 0 |
| Hermundura fauveli | 1 | 0 | 0 | 0 | 0 | 0 | 0 | 0 | 0 |
| Lysidice schmardae | 1 | 8 | 3 | 4 | 1 | 14 | 0 | 0 | 0 |
| Pseudorythoe ambigua | 2 | 2 | 8 | 0 | 4 | 0 | 0 | 0 | 0 |
| Glicine multidens | 0 | 1 | 10 | 0 | 0 | 3 | 0 | 0 | 0 |
| Syllis sp. | 0 | 0 | 7 | 1 | 0 | 0 | 0 | 0 | 0 |
| Ninetta sp. | 0 | 0 | 1 | 0 | 0 | 0 | 0 | 0 | 0 |
| Neanthes sp. | 0 | 0 | 0 | 0 | 3 | 0 | 0 | 0 | 0 |
| Owenia fusiformis | 0 | 0 | 0 | 0 | 1 | 0 | 0 | 0 | 2 |
| Magelona variolamellata | 0 | 0 | 0 | 0 | 14 | 2 | 0 | 0 | 0 |
| Loandaria americana | 0 | 0 | 0 | 0 | 2 | 0 | 0 | 0 | 0 |
| Lisidice ninetta | 0 | 0 | 2 | 0 | 1 | 1 | 0 | 0 | 0 |
| Glicera americana | 0 | 0 | 0 | 0 | 0 | 1 | 0 | 0 | 0 |
| Lumbrineris sp. | 0 | 0 | 0 | 0 | 1 | 0 | 0 | 0 | 0 |
| Cabira incerta | 0 | 0 | 0 | 0 | 0 | 0 | 1 | 0 | 1 |
| Harmothoe sp. | 0 | 0 | 0 | 0 | 0 | 0 | 2 | 3 | 3 |
| Scoloplos (Leodamas) sp. | 0 | 0 | 0 | 0 | 0 | 0 | 3 | 0 | 0 |
| Isolda pulchela | 0 | 0 | 0 | 0 | 0 | 0 | 0 | 1 | 0 |
| Maldanidae sp. | 0 | 0 | 0 | 0 | 0 | 0 | 1 | 0 | 5 |
| Nereididae sp. | 0 | 0 | 0 | 1 | 0 | 0 | 3 | 1 | 0 |
| Spionidae sp. | 0 | 0 | 0 | 0 | 0 | 0 | 2 | 0 | 0 |
| Pholoe sp. | 16 | 17 | 38 | 59 | 35 | 60 | 0 | 0 | 0 |
| Sabellidae sp. | 0 | 0 | 0 | 0 | 0 | 1 | 0 | 0 | 0 |
| Eunice sp. | 0 | 0 | 0 | 0 | 0 | 0 | 0 | 0 | 1 |
| Euclimelia sp. | 0 | 0 | 0 | 0 | 0 | 0 | 0 | 6 | 0 |
| Ancistrosyllis jonesi | 0 | 0 | 0 | 0 | 0 | 1 | 0 | 0 | 0 |
| Notomastus lobatus | 0 | 0 | 0 | 0 | 0 | 0 | 0 | 0 | 2 |
| Terebellidae sp. | 0 | 0 | 0 | 0 | 0 | 1 | 0 | 0 | 0 |
| ISOPODA | |||||||||
| Munna cananeia | 0 | 0 | 0 | 1 | 0 | 1 | 0 | 0 | 0 |
| Anthuridae sp. | 0 | 1 | 0 | 0 | 1 | 1 | 0 | 0 | 0 |
| Politolana sp. | 0 | 0 | 0 | 0 | 0 | 0 | 1 | 0 | 0 |
| TANAIDACEA | |||||||||
| Monokalliapseudes schubarti | 0 | 0 | 0 | 0 | 0 | 0 | 7 | 6 | 1 |
| Tanais sp. | 0 | 1 | 1 | 4 | 0 | 1 | 0 | 0 | 0 |
| CUMACEA sp. 1 | 0 | 0 | 2 | 5 | 1 | 2 | 0 | 0 | 0 |
| HIRUDINEA sp. 1 | 0 | 0 | 1 | 0 | 0 | 0 | 0 | 0 | 0 |
| OPHIUROIDEA sp. 1 | 1 | 12 | 4 | 0 | 1 | 0 | 9 | 8 | 9 |
| ECHINOIDEA sp. 1 | 3 | 0 | 0 | 0 | 0 | 0 | 0 | 0 | 0 |
| NEMERTINEA sp. 1 | 6 | 0 | 2 | 0 | 0 | 0 | 0 | 1 | 2 |
| PRIAPULIDA sp. 1 | 0 | 0 | 3 | 0 | 0 | 0 | 0 | 0 | 0 |
| ECHIURA sp. 1 | 0 | 0 | 0 | 0 | 0 | 0 | 0 | 0 | 3 |
| ACTINIARIA sp. 1 | 0 | 0 | 4 | 0 | 0 | 0 | 0 | 2 | 1 |
| PYCNOGONIDA sp. 1 | 0 | 2 | 1 | 0 | 1 | 0 | 0 | 0 | 0 |
| Branchiostoma sp. | 0 | 2 | 1 | 0 | 1 | 0 | 0 | 0 | 0 |
| TOTAL | 329 | 562 | 422 | 134 | 130 | 147 | 35 | 37 | 46 |
| Zone | Sample | S | n | J’ | H’(loge) |
|---|---|---|---|---|---|
| Sand | S1 | 22 | 328 | 0.25 | 0.77 |
| S2 | 44 | 562 | 0.56 | 2.14 | |
| S3 | 51 | 419 | 0.67 | 2.63 | |
| Mean (±SE) | 39 ± 8.73 | 436.33 ± 68.10 | 0.49 ± 0.12 | 1.84 ± 0.55 | |
| Transition | T1 | 29 | 134 | 0.69 | 2.34 |
| T2 | 35 | 129 | 0.80 | 2.84 | |
| T3 | 33 | 147 | 0.70 | 2.45 | |
| Mean (±SE) | 32.33 ± 1.76 | 136.66 ± 5.36 | 0.73 ± 0.03 | 2.54 ± 0.15 | |
| Mud | M1 | 14 | 35 | 0.87 | 2.29 |
| M2 | 15 | 37 | 0.88 | 2.38 | |
| M3 | 19 | 46 | 0.90 | 2.66 | |
| Mean (±SE) | 16.0 ± 1.52 | 39.33 ± 3.38 | 0.83 ± 0.00 | 2.44 ± 0.11 | |
| 1-way ANOVA | F | 7.64 | 130.39 | 5.42 | 1.23 |
| df | 2 | 2 | 2 | 2 | |
| p | 0.02 * | <0.001 * | 0.04 * | 0.35 | |
| Tukey | S T M | S T M | M T S | T M S |
| Source | df | SS | MS | Pseudo-F | p(MC) | p(PermDisp) |
|---|---|---|---|---|---|---|
| Zones | 2 | 15,414 | 7707.2 | 4.35 | 0.004 * | 0.959 |
| Residual | 6 | 10,611 | 1768.4 | |||
| Total | 8 | 26,025 | ||||
| t-test: | Groups | t | p(MC) | p(PermDisp) | ||
| Sand | Transition | 1.4906 | 0.117 | 1.00 | ||
| Sand | Mud | 2.1955 | 0.018 * | 1.00 | ||
| Transition | Mud | 2.4613 | 0.009 * | 0.202 | ||
| Transect Distance/ Depth (m) | Density (ind.m−2) | VC Sand | C Sand | M Sand | F Sand | VF Sand | Silt | Clay | Gravel | OM | CaCO3 |
|---|---|---|---|---|---|---|---|---|---|---|---|
| 13/6.8 | 0 | 2.2 | 70.8 | 23.2 | 3.5 | 0.3 | 0.1 | 0 | 0 | < 0.1 | 61.8 |
| 25/7.4 | 0 | 7.8 | 41.2 | 44.9 | 6.6 | 0.7 | 0 | 0 | 0.9 | < 0.1 | 70.9 |
| 50/8.1 | 0 | 19.4 | 26.5 | 31.1 | 12.2 | 5.1 | 0 | 0 | 5.7 | 0.2 | 77.9 |
| 55/8.1 | 11.1 | 12.4 | 21.2 | 40.1 | 19.9 | 3.2 | 0.1 | 0 | 2.7 | 0.1 | 78.4 |
| 56/8.3 | 56.7 | 23.3 | 22.7 | 32.8 | 13.8 | 3.1 | 0 | 0 | 4.3 | 0.1 | 80.3 |
| 57/8.4 | 78.9 | 18.7 | 25.9 | 34.9 | 12.4 | 1.9 | 0 | 0 | 6.1 | 0.2 | 81.6 |
| 58/8.5 | 67.8 | 11.3 | 22.5 | 45.8 | 17.0 | 1.4 | 0 | 0 | 2.1 | 0.1 | 83.1 |
| 59/8.5 | 125.0 | 7.3 | 14.5 | 44.6 | 23.5 | 7.2 | 0 | 0 | 2.9 | <0.1 | 84.1 |
| 61/8.7 | 186.7 | 13.8 | 20.1 | 35.1 | 20.4 | 6.0 | 0 | 0 | 4.7 | 0.2 | 81.2 |
| 63/8.8 | 250.0 | 13.5 | 27.7 | 40.7 | 15.9 | 1.6 | 0 | 0 | 0.7 | <0.1 | 82.6 |
| 64/8.8 | 92.2 | 9.9 | 18.9 | 41.1 | 21.0 | 5.2 | 0 | 0 | 3.9 | < 0.1 | 81.0 |
| 66/8.8 | 100.0 | 8.0 | 16.7 | 36.4 | 31.0 | 7.4 | 0.4 | 0 | 0.3 | 0.2 | 80.9 |
| 69/8.9 | 300.0 | 11.6 | 17.7 | 33.8 | 28.1 | 5.4 | 0.1 | 0 | 3.3 | 0.3 | 80.9 |
| 71/9.1 | 104.4 | 13.3 | 19.2 | 32.1 | 27.8 | 5.9 | 0.2 | 0 | 1.4 | 0.1 | 80.6 |
| 74/9.1 | 155.6 | 11.3 | 15.4 | 32.5 | 26.8 | 9.2 | 0.4 | 0 | 4.5 | 0.2 | 82.2 |
| 75/9.1 | 375.0 | 5.4 | 11.5 | 26.5 | 32.6 | 8.8 | 15.3 | 0 | 0.0 | 0.1 | 81.1 |
| 77/9.2 | 350.0 | 8.5 | 13.7 | 30.7 | 31.8 | 11.5 | 0.1 | 0 | 0.4 | 0.3 | 81.1 |
| 77/9.2 | 124.4 | 14.8 | 19.4 | 29.5 | 27.0 | 7.6 | 0 | 0 | 1.8 | 0.1 | 83.2 |
| 78/9.3 | 38.9 | 8.2 | 11.9 | 22.0 | 29.2 | 8.5 | 19.8 | 0 | 0.4 | 0.2 | 79.3 |
| 80/9.4 | 48.9 | 7.7 | 13.7 | 34.0 | 35. 5 | 9.1 | 0 | 0 | 0.1 | 0.1 | 82.3 |
| 85/9.5 | 54.4 | 13.6 | 21.7 | 27.9 | 25.3 | 5.4 | 0 | 0 | 6.1 | 0.1 | 84.3 |
| 86/9.6 | 31.1 | 10.1 | 18.5 | 21.8 | 16.1 | 12.1 | 17.8 | 0 | 3.5 | 0.2 | 83.0 |
| 87/9.5 | 210.0 | 8.1 | 11.2 | 22.4 | 29.0 | 8.8 | 19.8 | 0 | 0. 7 | 0.2 | 82.0 |
| 90/9.5 | 60.0 | 19.0 | 22.1 | 21.8 | 19.9 | 9.2 | 0.1 | 0 | 7.9 | 0.2 | 83.6 |
| 91/9.5 | 132.2 | 15.5 | 22.8 | 25.7 | 20.5 | 10.2 | 0.7 | 0 | 4.6 | 0.1 | 82.6 |
| 92/9.5 | 200 | 11.9 | 20.0 | 23.6 | 20.0 | 6.5 | 8.5 | 9.3 | 0 | 0.5 | 79.4 |
| 95/9.7 | 165.6 | 11.3 | 20.9 | 20.6 | 13.8 | 11.5 | 12.0 | 5.9 | 3.8 | 0.2 | 83.2 |
| 96/9.7 | 325 | 12.2 | 14.3 | 15.9 | 21.0 | 9.9 | 12.7 | 11.0 | 3.1 | 0.3 | 81.8 |
| 96/9.7 | 145.6 | 5.0 | 14.3 | 17.3 | 24.5 | 10.2 | 17.9 | 5.5 | 1.3 | 0.2 | 81.9 |
| 100/9.9 | 77.8 | 5.4 | 13.8 | 18.5 | 24.3 | 14.2 | 22.6 | 0 | 1.2 | 0.2 | 81.3 |
| 105/10.1 | 121.1 | 11.0 | 17.5 | 17.4 | 22.1 | 12.7 | 18.2 | 0 | 1.0 | 0.2 | 82.7 |
| 109/10.1 | 225 | 4.7 | 11.8 | 14.2 | 24.1 | 16.0 | 23.5 | 5.3 | 0.3 | 0.2 | 78.5 |
| 110/10.1 | 111.1 | 6.5 | 14.7 | 18.3 | 26.5 | 14.7 | 19.3 | 0 | 0 | 0.1 | 84.2 |
| 112/10.3 | 125.6 | 4.3 | 9.9 | 12.7 | 19.2 | 25.3 | 17.1 | 11.4 | 0 | 0.2 | 81.6 |
| 114/10.4 | 33.3 | 2.5 | 10.4 | 15.4 | 21.3 | 21.3 | 23.4 | 5.8 | 0 | 0.4 | 82.4 |
| 115/10.4 | 121.1 | 3.5 | 8.9 | 12.4 | 24.3 | 22.4 | 28.1 | 0.1 | 0.2 | 0.3 | 81.2 |
| 118/10.5 | 50.0 | 5.5 | 11.9 | 14.1 | 20.4 | 22.5 | 17.1 | 8.5 | 0 | 0.4 | 74.4 |
| 119/10.0 | 53.3 | 5.3 | 11.9 | 12.9 | 16.4 | 17.6 | 21.2 | 14.1 | 0.6 | 0.7 | 70 |
| 120/10.1 | 91.1 | 3.3 | 8.1 | 9.5 | 13.9 | 20.9 | 34.5 | 9.9 | 0 | 0.6 | 79.6 |
| 122/10.4 | 30.0 | 2.1 | 10.6 | 14.5 | 18.0 | 25.2 | 23.6 | 5.9 | 0 | 0.5 | 81.9 |
| 127/11.1 | 0.0 | 1.4 | 7.2 | 10.4 | 11.4 | 24.7 | 34.9 | 10.0 | 3.7 | 0.1 | 81.1 |
| 129/11.2 | 37.8 | 1.1 | 6.1 | 9.1 | 9.1 | 23.8 | 37.3 | 14.0 | 0 | 0.8 | 77.5 |
| 130/11.4 | 5.6 | 2.1 | 7.0 | 11.5 | 11.5 | 16.5 | 42.1 | 9.3 | 0 | 0.8 | 78.4 |
| 133/11.8 | 45.6 | 0.5 | 5.7 | 9.8 | 8.7 | 18.8 | 39.1 | 17.4 | 0 | 1.9 | 76.9 |
References
- Jones, C.G.; Lawton, J.H.; Shachak, M. Organisms as ecosystem engineers. Oikos 1994, 69, 373–386. [Google Scholar] [CrossRef]
- Kristensen, E.; Penha-Lopes, G.; Delefosse, M.; Valdemarsen, T.; Quintana, C.O.; Banta, G.T. What is bioturbation? The need for a precise definition for fauna in aquatic sciences. Mar. Ecol. Prog. Ser. 2012, 446, 285–302. [Google Scholar] [CrossRef] [Green Version]
- Kristensen, E.; Kostka, J.E. Macrofaunal Burrows and Irrigation in Marine Sediment: Microbiological and Biogeochemical Interactions. In Interactions between Macro- and Microorganisms in Marine Sediments; American Geophysical Union: Washington, DC, USA, 2005; pp. 125–157. ISBN 978-1-118-66544-2. [Google Scholar]
- Gutiérrez, J.L.; Jones, C.G.; Groffman, P.M.; Findlay, S.E.G.; Iribarne, O.O.; Ribeiro, P.D.; Bruschetti, C.M. The contribution of crab burrow excavation to carbon availability in surficial salt-marsh sediments. Ecosystems 2006, 9, 647–658. [Google Scholar] [CrossRef]
- Ziebis, W.; Forster, S.; Huettel, M.; Jorgensen, B.B. Complex burrows of the mud shrimp Callianassa truncata and their geochemical impact in the sea bed. Nature 1996, 382, 4. [Google Scholar] [CrossRef]
- D’Andrea, A.F.; DeWitt, T.H. Geochemical ecosystem engineering by the mud shrimp Upogebia pugettensis (Crustacea: Thalassinidae) in Yaquina Bay, Oregon: Density-dependent effects on organic matter remineralization and nutrient cycling. Limnol. Oceanogr. 2009, 54, 1911–1932. [Google Scholar] [CrossRef]
- De Vaugelas, J.; Buscail, R. Organic matter distribution in burrows of the thalassinid crustacean Callichirus laurae, Gulf of Aqaba (Red Sea). Hydrobiologia 1990, 207, 269–277. [Google Scholar] [CrossRef]
- Maire, O.; Lecroart, P.; Meysman, F.; Rosenberg, R.; Duchêne, J.; Grémare, A. Quantification of sediment reworking rates in bioturbation research: A review. Aquat. Biol. 2008, 2, 219–238. [Google Scholar] [CrossRef] [Green Version]
- Thrush, S.F.; Pridmore, R.D.; Hewitt, J.E.; Cummings, V.J. Adult infauna as facilitators of colonization on intertidal sandflats. J. Exp. Mar. Biol. Ecol. 1992, 159, 253–265. [Google Scholar] [CrossRef]
- Bouma, T.J.; Olenin, S.; Reise, K.; Ysebaert, T. Ecosystem engineering and biodiversity in coastal sediments: Posing hypotheses. Helgol. Mar. Res. 2009, 63, 95–106. [Google Scholar] [CrossRef] [Green Version]
- Widdicombe, S.; Austen, M. Mesocosm investigation into the effects of bioturbation on the diversity and structure of a subtidal macrobenthic community. Mar. Ecol. Prog. Ser. 1999, 189, 181–193. [Google Scholar] [CrossRef]
- Pillay, D.; Branch, G.M.; Forbes, A.T. The influence of bioturbation by the sandprawn Callianassa kraussi on feeding and survival of the bivalve Eumarcia paupercula and the gastropod Nassarius kraussianus. J. Exp. Mar. Biol. Ecol. 2007, 344, 1–9. [Google Scholar] [CrossRef]
- Pillay, D.; Williams, C.; Whitfield, A.K. Indirect effects of bioturbation by the burrowing sandprawn Callichirus kraussi on a benthic foraging fish, Liza richardsonii. Mar. Ecol. Prog. Ser. 2012, 453, 151–158. [Google Scholar] [CrossRef] [Green Version]
- Pillay, D.; Branch, G.M. Bioengineering effects of burrowing thalassinidean shrimps on marine soft-bottom ecosystems. Oceanogr. Mar. Biol. Annu. Rev. 2011, 49, 137–192. [Google Scholar] [CrossRef]
- Dworschak, P.C. Global Diversity in the Thalassinidea (Decapoda). J. Crustacean Biol. 2000, 20, 238–245. [Google Scholar] [CrossRef] [Green Version]
- Dworschak, P.C. Global diversity in the Thalassinidea (Decapoda): An update (1998–2004). Nauplius 2005, 13, 57–63. [Google Scholar]
- Nickell, L.; Atkinson, R. Functional morphology of burrows and trophic modes of three thalassinidean shrimp species, and a new approach to the classification of thalassinidean burrow morphology. Mar. Ecol. Prog. Ser. 1995, 128, 181–197. [Google Scholar] [CrossRef] [Green Version]
- Stamhuis, E.J.; Videler, J.J.; de Wilde, P.A.W.J. Optimal foraging in the thalassinidean shrimp Callianassa subterranea: Improving food quality by grain size selection. J. Exp. Mar. Biol. Ecol. 1998, 228, 197–208. [Google Scholar] [CrossRef]
- Dworschak, P.C. Feeding behaviour of Upogebia pusilla and Callianassa tyrrhena (Crustacea, Decapoda, Thalassinidea). Inv. Pesq. 1987, 51, 421–429. [Google Scholar]
- Pillay, D. Ecosystem engineering by thalassinidean crustaceans: Response variability, contextual dependencies and perspectives on future research. Diversity 2019, 11, 64. [Google Scholar] [CrossRef] [Green Version]
- Griffis, R.B.; Chavez, F.L. Effects of sediment type on burrows of Callianassa californiensis Dana and C. gigas Dana. J. Exp. Mar. Biol. Ecol. 1988, 117, 239–253. [Google Scholar] [CrossRef]
- Griffis, R.; Suchanek, T. A model of burrow architecture and trophic modes in thalassinidean shrimp (Decapoda: Thalassinidea). Mar. Ecol. Prog. Ser. 1991, 79, 171–183. [Google Scholar] [CrossRef]
- Melo, G.A.S. De Manual de Identificação dos Crustacea Decapoda do Litoral Brasileiro: Anomura, Thalassinidea, Palinuridea, Astacidea; Editora Plêiade: São Paulo, Brazil, 1999; ISBN 978-85-85795-08-5. [Google Scholar]
- Candisani, L.C.; Sumida, P.Y.G.; Pires-Vanin, A.M.S. Burrow morphology and mating behaviour of the thalassinidean shrimp Upogebia noronhensis. J. Mar. Biol. Assoc. 2001, 81, 799–803. [Google Scholar] [CrossRef]
- Mukai, H. On the changes of benthic communities by a removal experiment of the burrowing bioturbators in the tidal flat of Yamada Bay: Diversity and abundance after one year. Otsuchi Mar. Res. Cent. Rep. 1987, 13, 11–17. [Google Scholar]
- Posey, M.H.; Dumbauld, B.R.; Armstrong, D.A. Effects of a burrowing mud shrimp, Upogebia pugettensis (Dana), on abundances of macro-infauna. J. Exp. Mar. Biol. Ecol. 1991, 148, 283–294. [Google Scholar] [CrossRef]
- Tamaki, A. Effects of the bioturbating activity of the ghost shrimp Callianassa japonica Ortmann on migration of a mobile polychaete. J. Exp. Mar. Biol. Ecol. 1988, 120, 81–95. [Google Scholar] [CrossRef]
- Kato, M.; Itani, G. Commensalism of a bivalve, Peregrinamor ohshimai, with a thalassinidean burrowing shrimp, Upogebia Major. J. Mar. Biol. Assoc. UK 1995, 75, 941–947. [Google Scholar] [CrossRef]
- Garcia, K.E.; Embry, S.J.; Grossblat, D.; Holbrook, A.-M.; McLaren, W.M.; Reed, S.K.; Wildley, H.C.; Shuster, S.M. A comparison of two methods for sampling the Gulf of California mud shrimp, Neotrypaea uncinata (Crustacea: Thalassinidea). J. Nat. Hist. 2003, 37, 1847–1854. [Google Scholar] [CrossRef]
- Presley, B.J. A simple method for determining calcium carbonate in sediment samples. J. Sediment. Res. 1975, 45, 745–746. [Google Scholar] [CrossRef]
- Morisita, M. Iσ-Index, a measure of dispersion of individuals. Popul. Ecol. 1962, 4, 1–7. [Google Scholar] [CrossRef]
- Smith-Gill, S.J. Cytophysiological basis of disruptive pigmentary patterns in the leopard frog Rana pipiens. II. Wild type and mutant cell-specific patterns. J. Morphol. 1975, 146, 35–54. [Google Scholar] [CrossRef]
- Krebs, C.J. Ecological Methodology, 2nd ed.; Benjamin Cummings: Menlo Park, CA, USA, 1998; ISBN 978-0-321-02173-1. [Google Scholar]
- Clarke, K.R.; Gorley, R.N.; Somerfield, P.J.; Warwick, R.M. Change in Marine Communities: An Approach to Statistical Analysis and Interpretation, 3rd ed.; Primer-E Ltd.: Plymouth, UK, 2014. [Google Scholar]
- Burone, L.; Muniz, P.; Pires-Vanin, A.M.S.; Rodrigues, M. Spatial distribution of organic matter in the surface sediments of Ubatuba Bay (Southeastern—Brazil). An. Acad. Bras. Ciências 2003, 75, 77–80. [Google Scholar] [CrossRef] [Green Version]
- Negreiros-Fransozo, M.L.; Fransozo, A.; Pinheiro, M.a.A.; Mantelatto, F.L.M.; Santos, S. Caracterização física e química da Enseada de Fortaleza, Ubatuba, SP. Rev. Bras. Geociências 2017, 21, 114–120. [Google Scholar] [CrossRef]
- Pires-Vanin, A.M.S. A macrofauna bêntica da plataforma continental ao largo de Ubatuba, São Paulo, Brasil. Publicação Espec. Inst. Oceanográfico São Paulo 1993, 10, 137–158. [Google Scholar]
- Brasil, A.C.S.; Silva, S.H.G.S. Spatial distribution of polychaeta in a soft-bottom community at Saco Do Ceu, Ilha Grande, Rio de Janeiro, Brazil. Bull. Mar. Sci. 2000, 67, 103–112. [Google Scholar]
- Omena, E.P.; Lavrado, H.P.; Paranhos, R.; Silva, T.A. Spatial distribution of intertidal sandy beach polychaeta along an estuarine and morphodynamic gradient in an eutrophic tropical bay. Mar. Pollut. Bull. 2012, 64, 1861–1873. [Google Scholar] [CrossRef] [PubMed]
- Arasaki, E.; Muniz, P.; Pires-Vanin, A.M.S. A functional analysis of the benthic macrofauna of the São Sebastião Channel (southeastern Brazil). Mar. Ecol. 2004, 25, 249–263. [Google Scholar] [CrossRef]
- Pleijel, F. On feeding of Pholoe minuta (Fabricus, 1780) (Polychaeta:Sigalioinidae). Sarsia 1983, 68, 21–23. [Google Scholar] [CrossRef]
- Padovanni, N.; Amaral, A.C.Z. New species of the scale worm genus Pholoe (Polychaeta: Pholoidae) from southeast Brazil. Zootaxa 2013, 3710, 485. [Google Scholar] [CrossRef] [Green Version]
- Soares-Gomes, A.; Pires-Vanin, A.M.S. Bivalve mollusk assemblages on São Paulo’s northern continental shelf, southeast Brazil. Braz. J. Biol. 2005, 65, 717–727. [Google Scholar] [CrossRef] [Green Version]
- Neves, R.A.F.; Echeverria, C.A.; Pessoa, L.A.; Paiva, P.C.; Paranhos, R.; Valentin, J.L. Factors influencing spatial patterns of molluscs in a eutrophic tropical bay. J. Mar. Biol. Assoc. 2013, 93, 577–589. [Google Scholar] [CrossRef]
- Nucci, P.R.; Turra, A.; Morgado, E.H. Diversity and distribution of crustaceans from 13 sheltered sandy beaches along São Sebastião Channel, south-eastern Brazil. J. Mar. Biol. Assoc. 2001, 81, 475–484. [Google Scholar] [CrossRef] [Green Version]
- Leite, F.P.P.; Turra, A.; Souza, E.C.F. Population biology and distribution of the tanaid Kalliapseudes schubarti Mañé-Garzon, 1949, in an intertidal flat in Southeastern Brazil. Braz. J. Biol. 2003, 63, 469–479. [Google Scholar] [CrossRef] [PubMed]
- Omena, E.P.; Amaral, A.C.Z. Sandy beach morphodynamic and the polychaete fauna in southeast Brazil. J. Coast. Res. 2003, 35, 431–439. [Google Scholar]
- McDermott, J. The biology of Austinixa gorei (Manning & Felder, 1989) (Decapoda, Brachyura, Pinnotheridae) symbiotic in the burrows of intertidal ghost shrimp (Decapoda, Thalassinidea, Callianassidae) in Miami, Florida. Crustaceana 2006, 79, 345–361. [Google Scholar] [CrossRef] [Green Version]
- Peiró, D.F.; Mantelatto, F.L. Population dynamics of the pea crab Austinixa aidae (Brachyura, Pinnotheridae): A symbiotic of the ghost shrimp Callichirus major (Thalassinidea, Callianassidae) from the southwestern Atlantic. Iheringia Série Zool. 2011, 101, 5–14. [Google Scholar] [CrossRef] [Green Version]
- Alves, E.D.S.; Pezzuto, P.R. Population Dynamics of Pinnixa patagoniensis Rathbun, 1918 Brachyura: Pinnotheridae a Symbiotic Crab of Sergio mirim Thalassinidea: Callianassidae in Cassino Beach, Southern Brazil. Mar. Ecol. 1998, 19, 37–51. [Google Scholar] [CrossRef]
- Hernáez, P. An Update on Reproduction in Ghost Shrimps (Decapoda: Axiidea) and Mud Lobsters (Decapoda: Gebiidea). In Marine Ecology—Biotic and Abiotic Interactions; Türkoğlu, M., Önal, U., Ismen, A., Eds.; IntechOpen: London, UK, 2018. [Google Scholar] [CrossRef] [Green Version]
- Kinoshita, K.; Wada, M.; Kogure, K.; Furota, T. Mud shrimp burrows as dynamic traps and processors of tidal-flat materials. Mar. Ecol. Prog. Ser. 2003, 247, 159–164. [Google Scholar] [CrossRef] [Green Version]
- Papaspyrou, S.; Gregersen, T.; Cox, R.P.; Thessalou-Legaki, M.; Kristensen, E. Sediment properties and bacterial community in burrows of the ghost shrimp Pestarella tyrrhena (Decapoda: Thalassinidea). Aquat. Microb. Ecol. 2005, 38, 181–190. [Google Scholar] [CrossRef] [Green Version]
- Dobbs, F.; Guckert, J. Callianassa trilobata (Crustacea: Thalassinidea) influences abundance of meiofauna and biomass, composition, and physiologic state of microbial communities within its burrow. Mar. Ecol. Prog. Ser. 1988, 45, 69–79. [Google Scholar] [CrossRef]
- Griffen, B.D.; DeWitt, T.H.; Langdon, C. Particle removal rates by the mud shrimp Upogebia pugettensis, its burrow, and a commensal clam: Effects on estuarine phytoplankton abundance. Mar. Ecol. Prog. Ser. 2004, 269, 223–236. [Google Scholar] [CrossRef]
- Das, S.; Tseng, L.-C.; Wang, L.; Hwang, J.-S. Burrow characteristics of the mud shrimp Austinogebia edulis, an ecological engineer causing sediment modification of a tidal flat. PLoS ONE 2017, 12, e0187647. [Google Scholar] [CrossRef] [PubMed] [Green Version]
- Dworschak, P.C. The Biology of Upogebia pusilla (Petagna) (Decapoda, Thalassinidea) I. The Burrows. Mar. Ecol. 1983, 4, 19–43. [Google Scholar] [CrossRef]
- Bosley, K.M.; Copeman, L.A.; Dumbauld, B.R.; Bosley, K.L. Identification of burrowing shrimp food sources along an estuarine gradient using fatty acid analysis and stable isotope ratios. Estuaries Coasts 2017, 40, 1113–1130. [Google Scholar] [CrossRef]
- Kinoshita, K.; Wada, M.; Kogure, K.; Furota, T. Microbial activity and accumulation of organic matter in the burrow of the mud shrimp, Upogebia major (Crustacea: Thalassinidea). Mar. Biol. 2008, 153, 277–283. [Google Scholar] [CrossRef]
- Coelho, V.R.; Cooper, R.A.; de Almeida Rodrigues, S. Burrow morphology and behavior of the mud shrimp Upogebia omissa (Decapoda: Thalassinidea: Upogebiidae). Mar. Ecol. Prog. Ser. 2000, 200, 229–240. [Google Scholar] [CrossRef]
- MacGinitie, G.E. III.—The natural history of the mud shrimp Upogebia pugettensis (Dana). Ann. Mag. Nat. Hist. 1930, 6, 36–44. [Google Scholar] [CrossRef]
- Dworschak, P.C. The pumping rates of the burrowing shrimp Upogebia pusilla (Petagna) (Decapoda:Thalassinidea). J. Exp. Mar. Biol. Ecol. 1981, 52, 25–35. [Google Scholar] [CrossRef]
- Ott, J.A. Observations on the biology of Callianassa stebbingi Borrodaille and Upogebia litoralis Risso and their effect upon the sediment. Senckenbergiana Marit. 1976, 8, 61–79. [Google Scholar]
- Swinbanks, D.D.; Murray, J.W. Biosedimentological zonation of Boundary Bay tidal flats, Fraser River Delta, British Columbia. Sedimentology 1981, 28, 201–237. [Google Scholar] [CrossRef]
- Posey, M.H. Predation on a burrowing shrimp: Distribution and community consequences. J. Exp. Mar. Biol. Ecol. 1986, 103, 143–161. [Google Scholar] [CrossRef]
- Dworschak, P.C. The Biology of Upogebia pusilla (Petagna) (Decapoda, Thalassinidea) II. Environments and Zonation. Mar. Ecol. 1987, 8, 337–358. [Google Scholar] [CrossRef]
- Hodgson, A.N.; Frssaf, B.R.A.; Cretchley, R. An estimation of the standing stock and population structure of Upogebia africana (Crustacea: Thalassinidae) in the Knysna Estuary. Trans. R. Soc. S. Afr. 2000, 55, 187–196. [Google Scholar] [CrossRef]
- Hall-Spencer, J.M.; Atkinson, R.J.A. Upogebia deltaura (Crustacea: Thalassinidea) in Clyde Sea maerl beds, Scotland. J. Mar. Biol. Assoc.UK 1999, 79, 871–880. [Google Scholar] [CrossRef] [Green Version]
- Berkenbusch, K.; Rowden, A.A.; Probert, P.K. Temporal and spatial variation in macrofauna community composition imposed by ghost shrimp Callianassa filhoi bioturbation. Mar. Ecol. Prog. Ser. 2000, 192, 249–257. [Google Scholar] [CrossRef]
- Angel, A.; Branch, G.M.; Wanless, R.M.; Siebert, T. Causes of rarity and range restriction of an endangered, endemic limpet, Siphonaria compressa. J. Exp. Mar. Biol. Ecol. 2006, 330, 245–260. [Google Scholar] [CrossRef]


| Species | Average Abundance | Average Similarity | Sim./SD | Contribution (%) | Cumulative Contribution (%) |
|---|---|---|---|---|---|
| Sand—Average Similarity: 36.03 | |||||
| Exogone arenosa | 142.00 | 16.43 | 3.75 | 45.58 | 45.58 |
| Caecum pulchellum | 136.33 | 8.77 | 0.58 | 24.33 | 69.91 |
| Pholoe sp. | 23.67 | 3.78 | 8.60 | 10.49 | 80.41 |
| Mactra sp. | 13.67 | 1.22 | 0.58 | 3.39 | 83.80 |
| Kinbergonuphis sp. | 5.00 | 0.60 | 3.14 | 1.67 | 85.47 |
| Corbula caribaea | 15.33 | 0.57 | 1.01 | 1.59 | 87.06 |
| Pseudorythoe ambigua | 4.00 | 0.46 | 7.13 | 1.29 | 88.34 |
| Ophiuroidea | 5.67 | 0.44 | 1.32 | 1.21 | 89.55 |
| Caecum sp. | 4.00 | 0.41 | 0.58 | 1.13 | 90.69 |
| Transition—Average Similarity: 52.52 | |||||
| Pholoe sp. | 51.33 | 31.32 | 3.38 | 59.64 | 59.64 |
| Nucula semiornata | 7.67 | 3.88 | 2.46 | 7.38 | 67.02 |
| Semelidae sp. | 7.00 | 2.42 | 0.58 | 4.60 | 71.62 |
| Ampelisca cristata | 5.67 | 2.00 | 0.90 | 3.81 | 75.43 |
| Caecum pulchellum | 2.00 | 1.46 | 29.01 | 2.79 | 78.22 |
| Diplodonta punctata | 4.33 | 1.45 | 0.58 | 2.76 | 80.98 |
| Lysidice schmardae | 6.33 | 1.44 | 1.19 | 2.75 | 83.73 |
| Corbula caribaea | 4.00 | 1.21 | 0.58 | 2.30 | 86.03 |
| Idunella titinga | 3.00 | 1.01 | 0.58 | 1.93 | 87.96 |
| Cumacea | 2.67 | 0.97 | 2.46 | 1.85 | 89.80 |
| Chione paphia | 1.00 | 0.73 | 29.01 | 1.39 | 91.20 |
| Mud—Average Similarity: 43.63 | |||||
| Ophiuroidea | 8.67 | 21.24 | 12.49 | 48.68 | 48.68 |
| Monokalliapseudes schubarti | 4.67 | 7.18 | 0.87 | 16.46 | 65.14 |
| Harmothoe sp. | 2.67 | 5.91 | 4.98 | 13.54 | 78.68 |
| Rathbunixa sayana | 1.33 | 1.85 | 0.58 | 4.24 | 82.92 |
| Nereididae sp. | 1.33 | 0.93 | 0.58 | 2.12 | 85.05 |
| Cabira incerta | 0.67 | 0.82 | 0.58 | 1.89 | 86.93 |
| Maldanidae sp. | 2.00 | 0.82 | 0.58 | 1.89 | 88.82 |
| Pseudoharpinia dentata | 0.67 | 0.82 | 0.58 | 1.89 | 90.70 |
Publisher’s Note: MDPI stays neutral with regard to jurisdictional claims in published maps and institutional affiliations. |
© 2020 by the authors. Licensee MDPI, Basel, Switzerland. This article is an open access article distributed under the terms and conditions of the Creative Commons Attribution (CC BY) license (http://creativecommons.org/licenses/by/4.0/).
Share and Cite
Sumida, P.Y.G.; Güth, A.Z.; Quintana, C.O.; Pires-Vanin, A.M.S. Distribution and Sediment Selection by the Mud Shrimp Upogebia noronhensis (Crustacea: Thalassinidea) and the Potential Effects on the Associated Macroinfaunal Community. J. Mar. Sci. Eng. 2020, 8, 1032. https://0-doi-org.brum.beds.ac.uk/10.3390/jmse8121032
Sumida PYG, Güth AZ, Quintana CO, Pires-Vanin AMS. Distribution and Sediment Selection by the Mud Shrimp Upogebia noronhensis (Crustacea: Thalassinidea) and the Potential Effects on the Associated Macroinfaunal Community. Journal of Marine Science and Engineering. 2020; 8(12):1032. https://0-doi-org.brum.beds.ac.uk/10.3390/jmse8121032
Chicago/Turabian StyleSumida, Paulo Yukio G., Arthur Z. Güth, Cintia Organo Quintana, and Ana M. S. Pires-Vanin. 2020. "Distribution and Sediment Selection by the Mud Shrimp Upogebia noronhensis (Crustacea: Thalassinidea) and the Potential Effects on the Associated Macroinfaunal Community" Journal of Marine Science and Engineering 8, no. 12: 1032. https://0-doi-org.brum.beds.ac.uk/10.3390/jmse8121032