1. Introduction
Every port represents its own set of challenges to provide safe navigable waterways along with properly designed harbour approach channels [
1]; adequate basin area available for manoeuvring and wharf approaching [
2]; and guaranteeing completely safe berthing for particular ships for the duration of their stay [
3]. Adverse weather can render even a well-designed mooring facility unsafe, but as long as the ship can safely leave the port or is carefully monitored while moored, such a port may still be considered safe. Ordinary good navigation and seamanship will not render a port unsafe [
4]. This paper focuses on near shore vessel positioning required for safe berthing or docking, as well as monitoring vessels moored alongside. In berthing and unberthing situational awareness in the surrounding area is essential for the pilots and masters in order to take appropriate actions especially at the final manoeuvring stage where the speed of approach, distance, and angle of attack must be precisely determined. At the end, every vessel meets the berthing wharf, transferring a significant amount of energy, mostly depending on the ship’s speed and its displacement tonnage [
5]. It is obvious that the approaching speed must be controlled to avoid damaging the ship’s hull, fenders, and other elements of berthing infrastructure.
According to the British Standard [
6], risk reduction measures can consist of equipment installed on board the ship or at the berth. Such equipment could be either installed at shore with display units visible from the ship’s bridge, or Portable Pilot Units (PPU) used on board the ship [
7]. Various levels of awareness can be obtained from a PPU, which is currently used in many ports. It is a computer-based system that a pilot brings onboard a vessel to use as a decision-support tool for navigation, docking procedures or lock entry [
8]. The unit is interfaced with either vessel positioning and heading sensors, or it may have its own advanced sensors providing centimetre position accuracy (less than 2 cm RMS when L1/L2 RTK GNSS service is available) and heading precision up to 0.01 deg. An advanced system is commonly used at LNG terminals and when other sensitive operations like the handling of very large vessels, narrow passages, side-by-side mooring and locking are involved in the process. PPU systems are definitely useful and highly recommended for pilots when handling vessels in the “ballistic” manoeuvring phase and during the final “side-pushing” or “positioning” phase when the elements of global satellite-aided positioning system (GNSS) are not obstructed and when the pilot has enough time to properly set-up the advanced PPU system; i.e., fill in receiving antenna positions (in body fixed coordinate system) and identifying the ships gyro heading offset, if possible.
At some locations, such as the port of Koper, the approaching and berthing pilotage phase is extremely short, so there often is not enough time to set-up an advanced PPU system (pilots sometimes execute more than 10 manoeuvres in their 12 h shift). Even so the GNSS satellite signal may be obstructed or redirected in certain navigational areas, thus consequently ordinary PPU based on ship’s Automatic Identification System (AIS) does not always provide reliable data. Precise vessel position, transversal speed, and vessel-approaching angle are of great importance for safely berthing large container vessels particularly when inadequate fenders await and ship-to-shore (STS) cranes are near. The greatest pressure currently on ports is “Scale Enlargement,” a euphemism for the incessantly increasing size of vessels along with the extreme pressure put on ports to accommodate this phenomenon. The rapid increase in ship sizes forces ports into a state of virtually constant adjustment. Container vessels are the best example of ships that grow faster than ports [
9,
10]. As early as 2004 an article warned of berthing challenges that would arise with ever bigger container ships; two particular challenges would be that they become more difficult to handle, and, worse, it would be difficult, at times impossible, to see the side of the quay once up close [
11].
In recent years the cargo throughput in the port of Koper has averaged an annual growth of 8% with container growth as much as 16% yearly without an increase in the number of vessel calls. Management of this throughput was made possible by dredging activities and pier extension, allowing for the reception of larger vessels.
Figure 1a depicts the evolution of the size of container ships calling at Koper in the last decade. The size doubles whether expressing deadweight tonnage (DWT) or Gross Tonnage (GT). When one of the larger vessels is alongside even minor yawing or list can cause contact with STS cranes, with catastrophic results. The extremely small gap between ship and crane is evident from
Figure 1b.
The largest cranes, necessary for the largest vessels, must be fitted on the extant rails, which were designed, originally, to provide a safe distance between the vessels and cranes. This is not speculative, as one can see from the disastrous events of
Figure 2 and
Table 1, all occurring in 2019. Each of these collisions had a major impact on the port, aside from the already significant cost of replacing the damaged cranes. The port, at least near the incident, closes, the replacement can take up to a year, and of course operators may find an alternative port in the meantime.
During the last decade, the development of ship sizes of Ro-Ro/Ro-Pax vessels and the scale enlargement of product tankers have also been problematic. As the vessel sizes and amount of traffics increases, safe and efficient berthing becomes more challenging worldwide. Among the many incidents in recent years, in the port of Koper in 2017 a Ro-Ro vessel, having moored then broken away, crashed into the bulk terminal, knocking over a crane, seriously damaging the pier (100 meters had to be replaced).
The worst of this type of accident occurred just as this paper was being finalized (on 6 April 2020 in Busan port). Due to an uncontrollable high-speed, the container ship "Milano Bridge" collided with an entire strip of container cranes on the dock. Only one of the six gantry cranes remained functional after the accident. As possible causes, the investigators cited not only speed, but also a shorter reaction time after turning, insufficient power from tugs due to the high forward speed and lack of effect of the bow thrusters. The crew had not taken into account the fact that the ship was empty and was sailing with a partially submerged rudder, nor had they sufficiently considered the local weather conditions and, on top of all that, the pilot panicked as the ship approached the dock. Given the extraordinary cost of the cranes, the economic impact requires no elaboration.
3. Performance: Comparison Between the Pilot Navigation System and LiDAR
3.1. System Structures and Measurements
Pilot navigation systems are sometimes seen as alternatives to the pier-mounted laser and radar systems. Suppliers claim superior accuracy in terms of positioning, heading and rate of turn (ROT) measurements. The systems, however, mostly rely on non-RTK capable GNSS receivers that are vulnerable to disturbances of satellite signals. It was assumed that even under normal conditions, the reliability of such systems could be compromised in some cases, especially if the geometry of the structures in the area is such that it could cause multipath signal travel. Therefore, a comparison of different systems’ performances for berthing applications was carried out. In order to carry out such a comparison, AIS logs from the pilot navigation systems and from ships were decoded using special purpose Python scripts in conjunction with Libais library. The event timestamps are from the pilot navigation systems that have time synchronization through the GNSS. For laser measurements, NTP time synchronization on logging computers was used in order to obtain correct measurement time.
When the ship’s fixed GNSS position data was analysed, AIVDO/AIVDM designated messages were used; And when the pilot navigation system was used as a positioning source, the supplemental GPGGA message was used to obtain positions and custom HEHDT and HEROT vendor specific messages were used for heading and rate of turn.
All measurements were resampled and aligned for comparison using the Pandas Python processing library. In
Figure 4a an overview of measurement equipment positions is shown. Several LIDARs were evaluated, from high frequency low end model (HS) with ±50 mm accuracy to higher precision crane-mounted (JEL, JER) ±20 mm accuracy, and also high-precision (HP) with ±1 mm accuracy that was used as a reference to compare all other sensors. Two Jenoptik LDS301 units were mounted on a crane at a fixed distance and used to determine the orientation relative to the quay and fenders. During the testing, an additional LiDAR was used (Riegel), (parameters in
Table 5). Distance
d was measured, unknown variable in the test case. In order to compare the accuracy of pilot navigation systems with LIDARs, it was necessary to calculate the position of the ship’s edge from the AIS and GNSS data. AIS and GNSS positions are in the form of geographical latitude and longitude converted into a local coordinate system that converted positions into distance units (meters). The ship’s GNSS position is shown as the point
Pg(xg,yg). The vector
is a unit vector representing ship orientation and is calculated from the heading data.
Vector, perpendicular to the ship orientation is
They are used to obtain points
P1 and
P2 on the ship’s edge facing the pier
and
P2 a translation of s meters along
direction is calculated
Once the points P1(x1,y1) and P2(x2,y2) are obtained, equations for the line defining the ship’s edge are obtained. The distance d is obtained by calculating the distance between the obtained line and the LiDAR positions perpendicular to the pier.
In
Figure 5a, it can be seen that as the vessel is tugged closer to the pier that measured distances between different sensors are minimized. However, the pilot navigation system data is apparently showing unrealistic changes in positions due to suspected multipath problems, at least from positions recorded in the log. The errors when the vessel position was supposed to be constant (after 20:26) were about 5 meters. However, a comparison between the pilot navigation system and ship’s own GNSS receiver reveals that the ship’s receiver performs significantly worse, which is shown in
Figure 5a.
To determine errors shown in
Figure 5b, the differences between the range obtained from ship GNSS, pilot navigation system, the worst and best LiDAR as references are shown. Even the worst, low-cost LiDAR is orders of magnitude more precise than common pilot navigation systems, especially in the areas affected by the multipath disturbances. However, with the pilot navigation system, position error was mostly within 5 m while the ship GNSS yielded far worse results, even though it has antennas placed at much more favourable locations than portable pilot systems. In order to illustrate the quantification of the measurement results presented in
Figure 5, Root Mean Square Error (RMSE) and maximum absolute errors recorded are shown in
Table 6. The results indicate significant errors in the GNSS-based systems in the vicinity of the overhead cranes and the strong benefit of using even low-end LIDAR (relative errors calculated at 5 m). The results suggest that it would be beneficial to augment the GNSS data using local LiDAR measurements in order to obtain more accurate position during the docking procedures.
3.2. Fusion of AIS, PPU and LiDAR Measurements
Fusion of the AIS position data and local measurements taken with LiDARs or radars mounted in the dock would be beneficial for pilots during docking procedures. This way LiDAR precision and reliability would be combined with AIS data, which provides longitudinal positioning along the pier (
Figure 6). The calculation is done using the UTM coordinate system. Location of lasers onshore is given by points (
x01,
y01) and (
x02,
y02). Coordinates of the vessel’s port side parallel body are given by
where
di is offset of the LiDARs and the angle a represents the orientation of the pier
Coordinates of the GNSS antenna on the ship, which is where AIS position data is obtained from, are (
xa, ha) in the ship’s relative coordinate system, which is the right side coordinate system with its origin in ship’s centre, where
x axis is directed from stern to bow. The location of the AIS transmitter from the left side parallel body is
Approximate GNSS coordinates transmitted by the ship over the AIS are
and heading is
. The obtained approximate ship coordinates will be used in the following calculation. The equation defining the starboard side parallel body edge of the vessel is
where coefficient
k and intersection
n are calculated from points determined by the LiDAR measurements.
The precise GNSS antenna line is obtained from LiDAR-measured ship edge Equation (8) by translating a distance
h towards the centre, obtaining the line
Since precise GNSS antenna line is obtained from LiDAR measurements, longitudinal position of the vessel must be determined from the AIS data by projecting the GNSS coordinates (
xg,yg) on the line specified by the Equation (10), obtaining
This way we obtain the projected coordinates on the line specified by quay-mounted LIDARs, where
xg and
yg are relative coordinates from a reference point on the quay. They are calculated from approximate values of the corresponding coordinates obtained from the GNSS receiver
and
. The
k and
n are the projection line coefficient and intersection and
h is the offset of the ship GNSS antenna position from the side edge. The process is illustrated in the
Figure 6. The ship heading is obtained by
The centre of the ship is therefore at the following point
This way the ship’s position and orientation are obtained by merging the accurate LiDAR measurements of ship to pier distances and longitudinal position from GNSS obtained AIS data.
Figure 6b depicts the real interface of data fusion. The actual berthing of Maersk Herrera: The bold line is the outline of the vessel measured by lasers; The thin line is that obtained by the PPU. The PPU takes the position from the ship’s GNNS while the orientation of the ship is additionally filtered by the PPU (parameters in
Table 7). As the data suggests, the position of the ship is quite good, but the orientation is insufficiently prepared for berthing. Extensive analysis of berthing led us to discover that aside from multipath disturbances, the greatest problem is the tendency for gyro error to be greater than the maximum IMO standards of what should be accepted. The orientation is attributable to gyro error; and for a ship that size, such an orientation error could mean a deviation of up to ten meters from where the pilot and captain think the bow of the vessel is.
3.3. PPU: Limitation of the GNSS and Ship’s GYRO
Marine pilots in the Port of Koper have observed sudden jumps of the vessel or tug in certain areas, on their monitoring equipment. The effect may well be related to the presence at least of two types of reflective objects in the surroundings: port cranes and the surface of the sea [
26]. In order to apply the variance model, a strong correlation must exist between the satellite elevation angle and the GNSS signal quality. But variance models become inefficient when observations are affected by multipath, signal diffraction and receiver characteristics. For measurements collected under non-ideal observational conditions, direct signal quality measures such as signal-to-noise ratio (SNR) based variance models can be more appropriate for assessing the quality of GNSS observations. Furthermore, pseudorange multipath error mitigation methods exist (e.g., [
27]), but they are not yet widely applied in the commercial maritime fleet.
The behaviour of the navigation solution and consequently its accuracy is subjected to a combination of diffuse forward scattering and fluctuations of very low frequency [
28]. Secondary path signals with longer propagation time distort the amplitude and phase of the direct-path signals. As a consequence, the code ranges are more susceptible to multipath than carrier phases. Since the signals received from lower-elevated satellites are more prone to multipath (elevation-dependent weighting concept), observing the elevations of the satellites in view may contribute to a realistic model. But modelling of the propagation situation, e.g., [
29] (p. 156), in the case of the port of Koper is based on navigational solution reports from vessels’ AIS data. The crucial knowledge regarding which satellites were actually included in the determination of navigational solutions when anomalous behaviour occurs is missing. In the absence of signal quality monitoring, but assuming that no interfering in-band signals were affecting the navigation solution, a decision was made that spatial distribution of anomalous changes of navigational solutions would be mapped from the reports, and not from the GNSS satellite-receiver tracks.
A collection of AIS Class A messages, contains data: time, latitude, longitude, heading, Rate of Turn, Course over Ground, Speed over Ground. Data were preliminarily analysed without flags for the differential correction status (corrected, uncorrected), Position Accuracy (high <=, low > 10 m) and RAIM (in use, not in use).
The following figure,
Figure 7a,b present the reported positions of two vessels. Green dots represent positions with speed corresponding to SOG, while blue lines represent anomalous events of rate of position exceeding SOG by more than twice.
The gyrocompass is an indispensable navigational instrument which should determine the direction of the ship’s heading in relation to geographic (true) north. Various systems on board ship are under the control of the Master Gyro; the gyrocompass system transmits information to the Steering Console, RADAR, ECDIS, AIS, GNSS, VDR, GMDSS equipment, and other equipment or systems as required, such as PPU. The accuracy of predicted position can be significantly affected upon the occurrence of gyrocompass errors, especially during berthing manoeuvres. According to performance standards IMO A.424(XI), gyro error should not exceed 0.75 × secant latitude and the root mean square value of the differences between individual heading indications, and the mean should be less than 0.25° × secant latitude. Gyro settling error can be estimated from the orientation of a moored ship alongside a quay. A long-term study involving the collection of AIS data from the container terminal, where larger ships are assumed to be constantly moored parallel with the quay, provided 56 berthing events at berth 7 at port of Koper for our evaluation. The average observed absolute gyrocompass error equalled 1.4°, with a standard deviation of 1.1°, significantly higher than IMO standards. There is no reason to believe that this is not generally the case involving the gyrocompass.
4. Advanced Integrated LiDAR Based Docking System Specifically for Ro-Pax
4.1. Layout
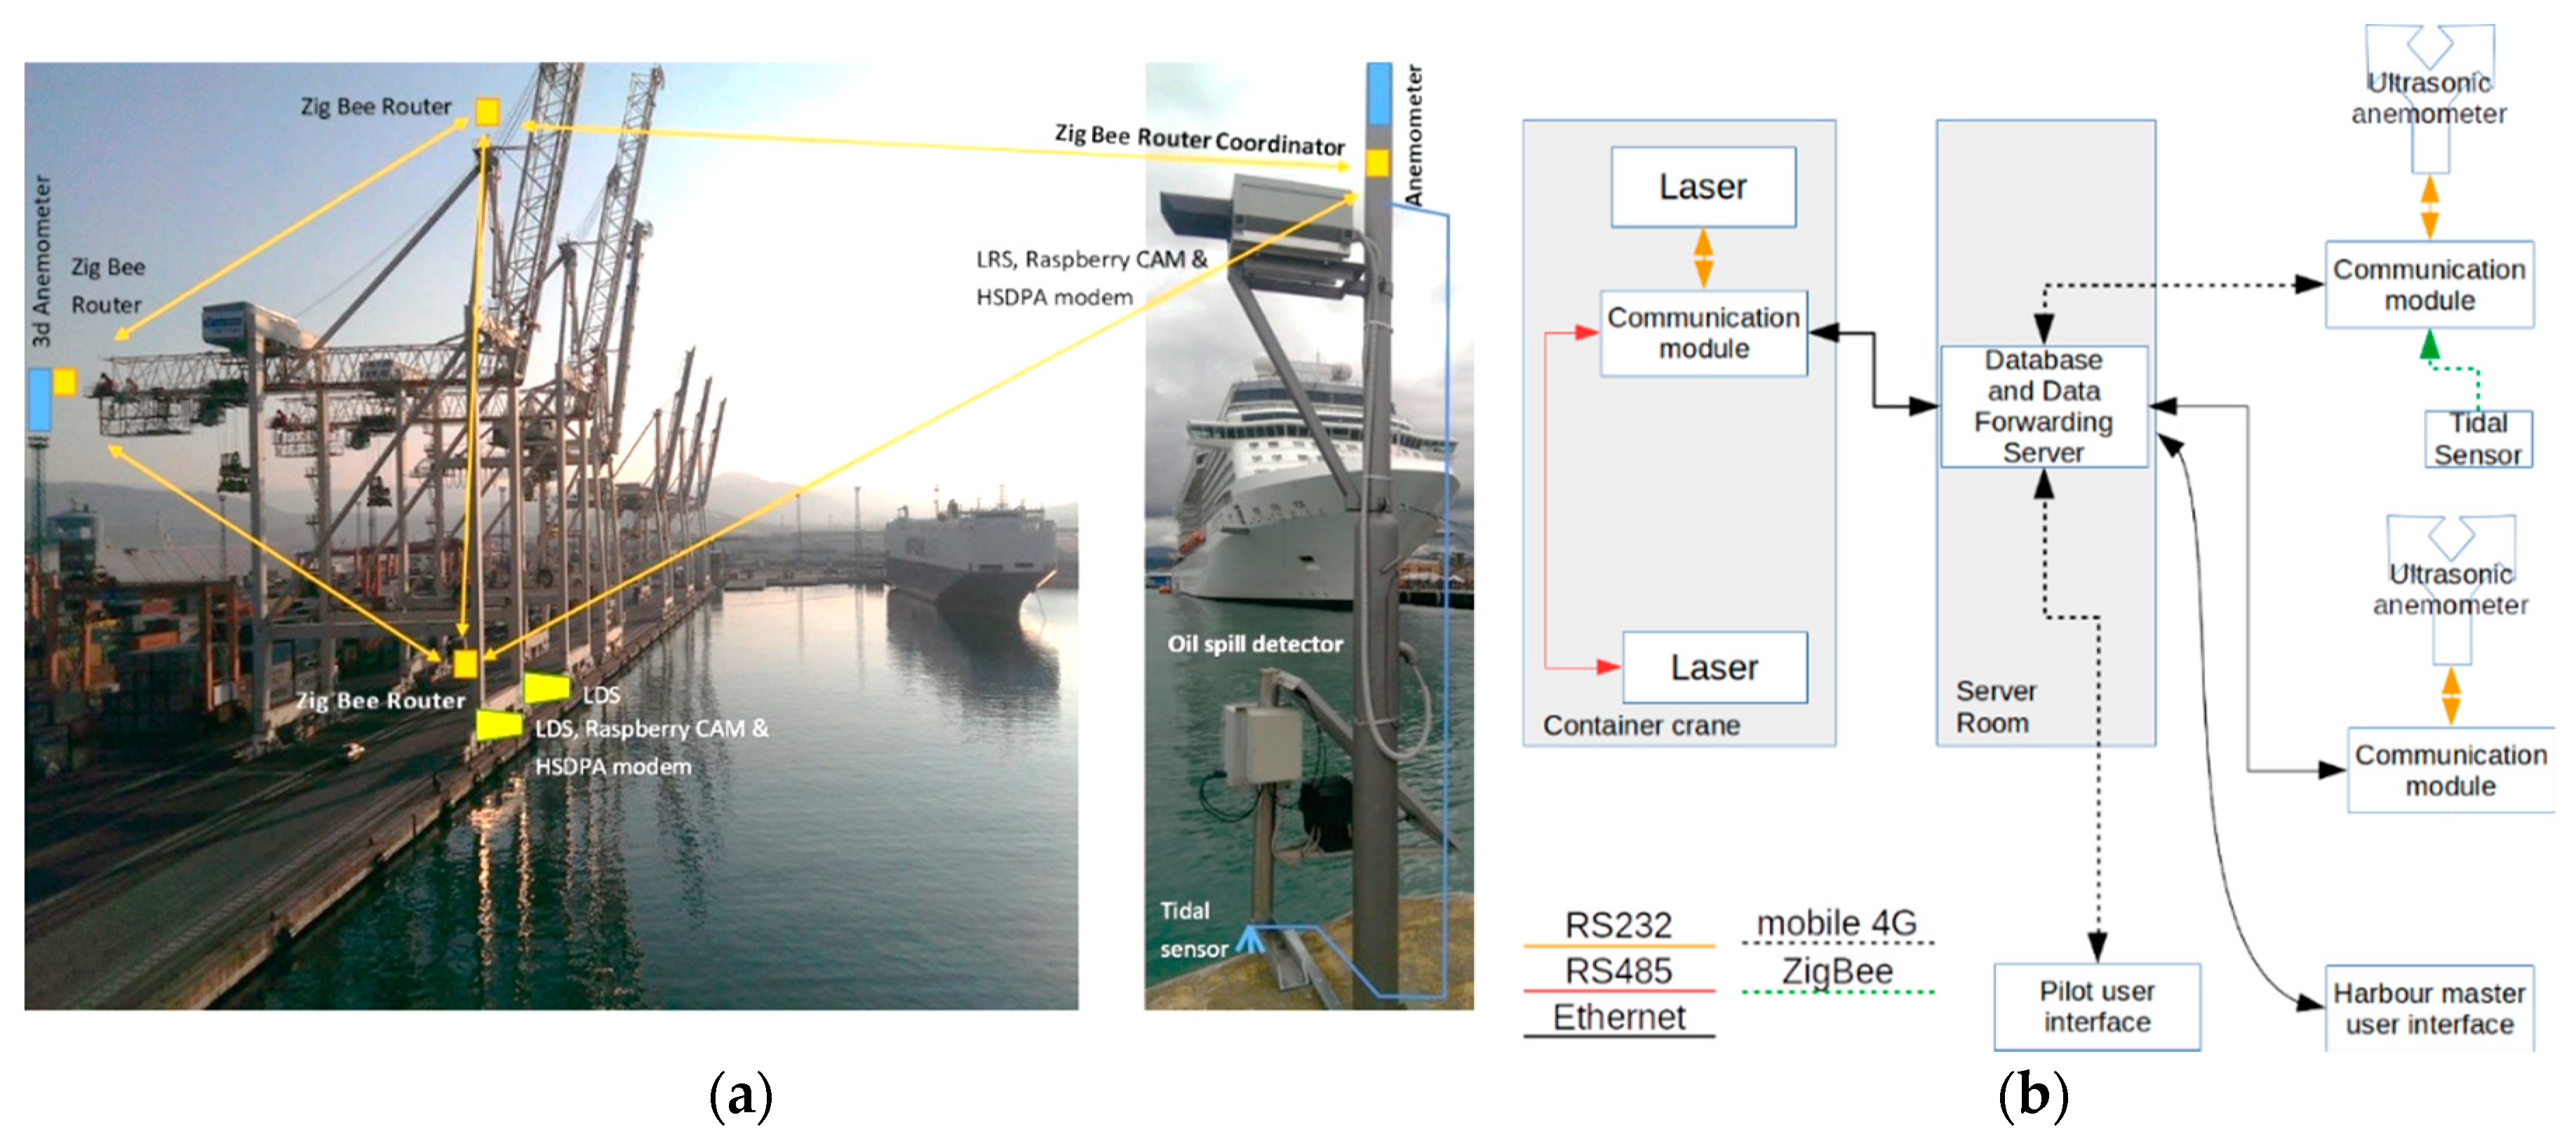
To extend the capabilities of a positioning system based on laser distance measurements, an extended system based on laser scanners has been proposed. A test version of such a system has been implemented at a terminal ferry in the port of Świnoujście, Poland. It consists of two 3D LiDAR sensors located in such a way that bow/stern and the sides of the ship can be scanned at any time during the berthing/unberthing manoeuvre. LiDARs specification is given in
Table 8 and the full architecture of the system is presented in
Figure 8 and consists of laser scanners, two CCTV cameras, server, AIS receiver, anemometer, power system and data network.
The data from the system are provided by on-board tablets which communicate with a server hosted application via LTE internet connection. Such an approach makes it simple to update and extend the application remotely, without the need to access the end users’ devices. The application provides information about the ship’s outline in relation to the berth, together with minimum distances: ship’s side, berth and ship’s bow/stern ramp. It also provides wind data, calculated velocities (longitudinal and transversals) and calculated heading.
4.2. Positioning, Velocity Determination and Ship Orientation Algorithm
Since it is impossible to establish the exact geometry of the hull and the actual draft of a ship using only two LiDARs, the system has been adapted for two specific ferries that use the berth on a daily basis. For each ship a family of outline shapes has been prepared, taking into consideration expected changes in draft. The positioning algorithm, after reading data points from both LiDARs, performs the following operations (
Figure 9a):
- 1)
Removes points identified as berth points (based on (x,y) coordinates)
- 2)
Removes isolated points, i.e., points that do not have any neighbouring points in a 5 m radius
- 3)
Approximates ship’s side-line using the RANSAC algorithm
- 4)
Removes outliers
- 5)
Estimates ship’s side using the Least Square Method (LMS)
- 6)
Removes false points, e.g., points from seagulls flying low, inside the scanner’s range
- 7)
Finds the best estimation for ship’s stern/bow
- 8)
Returns best fit of ship’s position.
The position of the ship’s stern/bow is estimated by minimizing the sum of squares of distances between points and the ship’s outline. This operation is repeated no less than 100 times (until the result does not improve by more than 0.00001). In
Figure 10, the ship’s sideline is illustrated, along with the points that were used to determine it. The points that are detected by the individual LiDAR are drawn in corresponding colours, in red and blue.
The RANSAC algorithm is used specifically to estimate the best line that fits points acquired by both LiDARs by minimizing a monotonically increasing function of the absolute values of the signed error for each point:
The exact implementation of the RANSAC algorithm, based on [
30], performs the following steps:
- 1)
Selects two points randomly.
- 2)
Solves in regard to the line parameters.
- 3)
Determines how many points from the set of all points fit with a tolerance of 0.15 m.
- 4)
If less than 70 percent of all points exceeds the assumed tolerance, repeats steps 1–3 but not more than 1000 times.
- 5)
Otherwise, terminate the algorithm.
After the RANSAC algorithm is terminated a set of points located not more than 0.2/0.5 m (depending on the given ship) is selected. This set is used to re-estimate the line using the Least Square Method. The ship’s state obtained from RANSAC is base position and course vector (
xi, yi, Ki); it is transformed in every time step into velocities (
vx, vy,
ω). In this case the filtering and tracking itself is performed by algorithm based on a very simple and robust exponential smoothing by Holt method with Pegels’ multiplicative trend and additional damping (
Figure 9b) [
31]. The applied algorithm allows the estimation of the location of the ship’s gravity centre and course in the next time step (
xi+1,
yi+1,
Ki+1), the ship’s velocities in 3 degrees of freedom (
vx, vy, ω), and the future (predicted) ship parameters given up to 3 min (ship tendency). The smoothing is done in separate steps for all three parameters (
vx, vy,
ω) according to the following formula:
where:
—smoothing coefficient,
—dampening coefficient,
—estimated parameter.
The values of smoothing coefficients ) have been estimated based on the real time simulation trials for Ro-Pax ferries where minimum values of mean square errors were found for all estimated values.
4.3. Verification of the System’s Performance
During the stage of system development, the verification of system performance and algorithm accuracy was based on the comparison between the position calculated by the system and the position reported by the AIS system. A system of cameras was utilized as well to visually evaluate the stages of the manoeuvre and ship’s dynamics. All comparisons were made using the developer version of the application. The first stage of the verification was based on a comparison between the position reported by the AIS system (GNSS position) and the position calculated by the PNDS algorithm. Due to the number of AIS messages, equal to around 6 messages per minute, only positions at the time of a new message were compared.
The point for which the AIS position is reported was evaluated statistically by measuring and analysing the position of the ferry when it was moored. For both ships it was evaluated as the point located on the longitudinal symmetry axis, 153 m from the aft perpendiculars for the Cracovia ferry and 140 m from the aft perpendicular for the Mazovia ferry. The observed position deviation for the estimated AIS points is equal to 0.82 ± 0.40 m. An example of values reported by the AIS and calculated by PNDS system are shown by
Figure 11 (Ais R-heading, in relation to the north, Scan R- heading in relation to the berth; check both green and blue frames). Taking into consideration the lack of detailed information about the location of CCRP on both ships, delays during transmission, and the reception of AIS messages and the general accuracy of the GNSS system, the observed position accuracy may be acknowledged as very high and in accordance with PNDS system assumptions.
4.4. Verification of the System Under Real Conditions
The PNDS system was installed on two ferries. In both cases a tablet docking station was installed in accordance with the recommendations and requirements of the captains. Each captain was fully informed about the functionality and restrictions of the system and was trained to use it. Two developers took part in a first voyage after the installation to check the performance of the system and answer any question the captains might have. Because of differences in cargo operations the ferries approach their berth in different ways.
The Mazovia ferry moves to the southern part of the berth, enters the turning circle located next to the Basen Bałtycki, rotates and approaches the berth moving north, parallel to the berth. The general average approach is shown in
Figure 12a. The Cracovia ferry reduces velocity to 0–1 knot and using thrusters approaches parallel to the berth. At the last stage, the ship corrects location along the berth (
Figure 12b).
Longitudinal speed, lateral speed, and angular speed are calculated directly form changes of position and rotation of the ship’s outline in time. The application of kinematic equations and an exponential filter gives the basis for an assumption that the accuracy of speed indication directly depends on how often and how accurate the system calculates course and position. Independently from the above assumption, a set of comparisons during manoeuvres was conducted.
All comparisons included recording speed values from on board equipment (like log and gyrocompass) and values from the PNDS system. Because the PNDS system can calculate the speed only when the ship is in range of both laser scanners, the time when the comparison could be made was only a few minutes during each manoeuvre. In 72% of randomly chosen moments linear velocities shown by on-board equipment did not differ by a more than 15%. In the case of angular speed, the average difference was ± 1.5 degree/min. It was noted during those test that the on board equipment that is used during manoeuvres displays longitudinal and lateral speeds with an accuracy of 0.1 knots (
Figure 13a), while the PNDS systems displays those values with an accuracy of 0.01 knots (
Figure 13b). Thus, the PNDS system provides more accurate data.
Values of distances calculated by the system were verified with the use of a standard, handheld laser distance meter when the ships were moored. Due to the opened bow door on the Mazovia ferry it was not possible to measure an exact distance between the ramp and the ship’s outline (
Figure 14a). For the Cracovia ferry the calculated distance from the ramp to the stern differed by a margin of 15 cm when compared to manual measurements. Such a difference is acceptable as per system assumptions.
Figure 14b,c shows ship’s side measurements.
Regarding the distance between the berth and sides of the ferries, the maximum observed difference was over 90 centimetres. Two main factors responsible for such a difference were identified:
(1) Documentation of both ferries does not represent the accurate shape of the external hull-just the general layout and the shape of a theoretical outline at deck levels. This data was used to create hypothetical ship outlines that are used for the system during calculations.
(2) On both ferries the external hull has an extruded bumper throughout its length. This bumper is the point of direct contact between the ship and the fender. Without the information about current ship’s draft and the shape of the external hull it is not possible to evaluate whether the laser scanner measures the distance to the side of ship or to the bumper.
This can lead to a situation where the ship is in contact with the fender, but the laser scanner measures the distance to the ship’s side, so the system reports the distance of around 0.5 m. Because of this, the system does not report exact distances between 0 and 0.5 m Instead it shows that the distance is less than 0.5 m.
5. Conclusions
Experts in maritime commerce rightly lament the dangerous speed of growth of vessels, particularly in the container business. However, in one instance a great deal of expense and an increasing threat has been solved at an extremely low cost. The laser-based berthing and docking system is the safest means of ensuring the integrity of the berthing and docking process (the system installed at the port of Koper has been operating without failure or degradation for five years at the moment of this writing). PPU is perhaps good enough when obstructions like cranes do not exist, but where they do, their accuracy is not sufficiently reliable. Where PPU appears good enough, a laser-based system is an inexpensive means of even safer berthing and if nothing else should be made available for purposes of redundancy. A novel way of fusing GNSS positioning data with LIDAR measurements has been proposed. The benefit of such a system is the combination of ship GNSS longitudinal position with its lesser accuracy with the high-precision lateral positioning, thus minimizing the risk of collision.
The loss of a crane, which we have been using as our worst case scenario, is catastrophic for a port even without death and injury—the expense is immense, and the time to repair the area of a fallen crane and the replacement of it is considerable. There have been numerous ship-to-crane collisions resulting in damage measured in millions of Euros, and a lidar-based system is significantly less than 1 percent of likely damage in the case of a single accident. The only limitation in regard to the system is the impossibility of spreading the lasers far enough apart at, for instance, container terminals to be absolutely certain of the orientation of the ship to the quay.
For the needs of Ro-Ros, which require the most precise docking, an advanced integrated docking system was developed based on 3D scanners combined with the PPU system, finally providing a working solution to the problem of the need for clear outlines of vessels both laterally and longitudinally as they approach the pier.

 ,
, 


