Article

Specification of the Okadaic Acid Equivalent for Okadaic Acid, Dinophysistoxin-1, and Dinophysistoxin-2 Based on Protein Phosphatase 2A Inhibition and Cytotoxicity Assays Using Neuro 2A Cell Line

1
Course of Resource Management and Food Science, Graduate School of Fisheries Science, National Fisheries University, 2-7-1 Nagata-honmachi, Shimonoseki 759-6595, Yamaguchi, Japan
2
National Institute of Health Sciences, 3-25-26 Tonomachi, Kawasaki 210-9501, Kanagawa, Japan
*
Author to whom correspondence should be addressed.
J. Mar. Sci. Eng. 2021, 9(10), 1140; https://0-doi-org.brum.beds.ac.uk/10.3390/jmse9101140
Submission received: 16 September 2021 / Revised: 12 October 2021 / Accepted: 13 October 2021 / Published: 17 October 2021
(This article belongs to the Special Issue Chemistry, Toxicology and Etiology of Marine Biotoxins)

Abstract

:
Diarrhetic shellfish poisoning (DSP) is a globally occurring disease threatening public health and trade. The causative toxins, okadaic acid (OA), dinophysistoxin-1 (DTX1), and dinophysistoxin-2 (DTX2) are collectively called OAs, and are quantified using the LC-MS/MS method. The hazardous effect of total OAs is expressed as the sum of OA equivalents defined for respective OAs based on mouse lethality, produced by either intraperitoneal (OAip) or oral administration (OAor). OAs are potent inhibitors of protein phosphatase 2A (PP2A) and are cytotoxic, necessitating expansion of the concept of OA equivalents to all relevant bioactivities. In this study, we determined OA equivalents for respective OA members in PP2A inhibition and cytotoxicity assays. To secure result credibility, we used certified OAs, reference materials, and PP2A produced using genetic engineering. The relative ratio of the OA equivalents determined by PP2A inhibition assays for OA, DTX1, and DTX2 were 1.0:1.6:0.3, while the ratio determined using the cytotoxicity assays indicated 1.0:1.5:0.5. OA equivalents showed a similar tendency in the PP2A inhibition and cytotoxicity assays, and matched better with oral toxicity data than intraperitoneal toxicity in mice. The PP2A inhibition assay, which measures the core activity of the OAs, suggested a higher OA equivalent for DTX1 than that currently used.

1. Introduction

Okadaic acid (OA), dinophysistoxin-1 (DTX1), and dinophysistoxin-2 (DTX2) (Figure 1), collectively called OA-group toxins (OAs) due to their structural similarities, are a group of lipophilic natural marine toxins produced by the dinoflagellates Dinophysis spp. and Prorocentrum spp. [1,2,3,4]. These dinoflagellates are distributed worldwide and cause diarrhetic shellfish poisoning (DSP) [5]. On top of this diarrheagenicity [6], the health risks due to OAs are aggravated by their potential tumor-promoting activity [7]. The wide geographic distribution, frequent occurrence, and significant health risks, including potential tumor promotion, have made DSP one of the top issues in seafood safety. Hence, discovering accurate methods to assess the quantity and potency of the respective OAs have become an urgent social task. Presently, three methods exist to assess the harmful effects of OAs. Mouse bioassays (MBA) are based on lethality by intraperitoneal (i.p.) injection or by oral administration. The cell bioassays measure the viability of cultured cells, typically the neuro-2a cells [8]. The protein phosphatase inhibition assay is based on the strong and specific action of OA in inhibiting PP2A [9,10]. The traditionally used MBA is no longer in use because of its lack of accuracy, sensitivity, and regard for animal welfare [11,12]. The LC-MS/MS method, developed as an alternative to MBA, quantifies the OAs with high accuracy [11] but must evaluate the hazardous effects using the OA equivalent that was defined for respective OAs based on mouse lethality measured by either i.p. or oral administration, abbreviated as OAip and OAor, respectively. Thus, the total OA equivalents are used to judge the suitability of shellfish under the current regulatory system (0.16 μg OA equivalent/g whole meat) [12,13]. In the LC-MS/MS method, the reference toxins are used for calibration. The OA equivalents currently recommended for OA, DTX1, and DTX2 are 1.0, 1.0, and 0.6, respectively [14], or 1.0, 1.0, and 0.5 for OA, DTX1, and DTX2, as recommended by FAO/WHO [15]. Recently, based on the acute toxicity of oral administration, the OA equivalents (OAor) were proposed to be 1.0, 1.5, and 0.3 for OA, DTX1, and DTX2, respectively [16]. The OA equivalent recommended for DTX1, however, is considered arguable, because DTX1 was reported to be more toxic than OA in some studies [1,17]. Along with mouse lethality, the strong and specific activity of OAs in inhibiting PP2A can be cited as an important issue because of its potential implication in tumor promotion [5,18]. Thus, we evaluated OA equivalents using the PP2A inhibition assays that colorimetrically measure hydrolysis of p-nitrophenyl phosphate (p-NPP) [19,20,21]. To ensure the high quality of the enzyme, we produced recombinant PP2A (rPP2A) using a baculovirus expression system in High Five insect cells [22,23] and constructed a rapid test kit. The enzyme rPP2A exhibited excellent stability and sensitivity for detecting and quantifying OAs in shellfish [24,25]. The OA equivalent was assessed using standard curves prepared using reference OA. To standardize the evaluation, we proposed the use of inhibition equivalent (OApp2a) defined for respective OAs based on the 50% inhibitory concentration (IC50) values. The third activity to be incorporated into the concept of the OA equivalent is the potent cytotoxicity that the OAs exerts. Shellfish can be tested for OAs using a cell-based bioassay, typically using the neuro-2a cells, and can be judged by the OA equivalents (OAn2a) deduced from the 50% effective concentration (EC50) values [26].

2. Materials and Methods

2.1. Certified Reference Materials

Five types of certified reference materials, CRM-OA-d, CRM-DTX1-b, CRM-DTX2-b, CRM-DSP-Mus-c, and CRM-Zero-Mus, were purchased from the National Research Council (Canada). The certified concentration for CRM-OA-d, CRM-DTX1-b, and CRM-DTX2-b were described as 10.4 ± 0.5, 10.4 ± 0.8, and 4.7 ± 0.3 μmol/L, respectively. Stock solutions of these CRMs were diluted according to the process in Tables S1–S6 for use in the PP2A inhibition and neuro-2a cell viability assays. The certified concentrations (as free acid) for okadaic acid and dinophysistoxins in CRM-DSP-Mus-c were as follows: OA = 1.07 ± 0.08 mg/kg, DTX1 = 1.07 ± 0.11 mg/kg, DTX2 = 0.86 ± 0.08 mg/kg. The total post-hydrolysis concentrations for fatty acid acyl esters of okadaic acid and dinophysistoxins in CRM-DSP-Mus-c were as follows: OA = 2.4 mg/kg, DTX1 = 1.1 mg/kg, DTX2 = 2.2 mg/kg. CRM-Zero-Mus was used as a matrix blank for the analysis of DSP toxins.

2.2. Sample Preparation for PP2A Inhibition Assay from CRM-DSP-Mus-c and CRM-Zero-Mus

Each 2-g portion of CRM-DSP-Mus-c and CRM-Zero-Mus was extracted by Polytron homogenizer with 18-mL 90% methanol at room temperature for 1 min. The homogenate was centrifuged at 2500× g for 10 min. The supernatant (extract) of CRM-DSP-Mus-c was diluted with the extract of CRM-Zero-Mus to the concentrations shown in Table S7. Then, the preparation of the test solutions for the assay was performed according to the method in our previous report [24] as follows: a 50-μL portion of the diluted extract was diluted with 950-μL sample dilution buffer (10% EtOH, 0.5% Tween60 in TE Buffer) to make a test solution for PP2A inhibition assay. A 50-μL portion of the test solution was used for assaying unhydrolyzed samples. Hydrolysis and neutralization of the extract were conducted as described previously [24]. The OA content in the hydrolyzed samples was calculated using a multiplying factor of 1.4 to calibrate the volume increase due to the additions of alkali and acid solutions.

2.3. PP2A Inhibition Assay

rPP2A was synthesized in insect cells (High Five; Invitrogen, Carlsbad, CA, USA) by infecting recombinant baculoviruses encoding Hisx8-tagged human PP2Acα using a baculovirus expression system and purified as described previously [22,23]. The PP2A inhibition assay using rPP2A was conducted in a 96-well microplate as described previously [24]. The details were as follows: Each well contained 50-μL test solution and 100-μL p-nitrophenyl phosphate (p-NPP; 3 mM final concentration). The three or six wells per each test sample were used in the PP2A assay. The reaction was started by the addition of 100 μL (0.08 units) of the rPP2A, and continued for 30 min at 36 °C. The hydrolysis of p-NPP to p-nitrophenol (p-NP) was recorded using a microplate reader (iMark; Bio-Rad Laboratories, Inc., California, CA, USA) at 405 nm against 490 nm as a reference. The PP2A activity (%) using sample dilution buffer as a control (100% PP2A activity) was calculated using the following equation:
PP2A activity (%) = (A1T/A1C) × 100
where A1T is the absorbance of test solution, and A1C is the absorbance of the control. The dose-dependent curves for the inhibition of rPP2A activity by OAs were constructed using a 4-parameter curve-fitting program (Microplate Manager 6 software, Bio-Rad Laboratories, Inc., California, CA, USA). The limit of detection (LOD = the mean of matrix blanks + 3 SD) and the limit of quantitation (LOQ = the mean of matrix blanks + 10 SD) were calculated from six measurements of the unhydrolyzed and hydrolyzed matrix blanks prepared from mussel CRM (CRM-Zero-Mus) as described previously [24].

2.4. Neuro-2a Cell Culture, Okadaic Acids Exposure, and Cell Viability Assay

Neuroblastoma neuro-2a cells (ECACC:89121404) were purchased from DS PHARMA BIOMRDOCAL (Japan), and cultured in RPMI-1640 medium (R8758; Sigma-Aldrich, MO, USA) supplemented with 10% (v/v) fetal bovine serum (FBS, 2916754; MP Biomedicals, Irvine, CA, USA), 1%(v/v), 100-mM sodium pyruvate solution (S8636; Sigma-Aldrich, St. Louis, MO, USA), and 1%(v/v) Penicillin-Streptomycin Solution (×100) (168-23191; FUJIFILM Wako Pure Chemical Corporation, Osaka, Japan). The cell line was routinely maintained at 37 °C in a humidified atmosphere containing 5% CO2, and sub-cultured after reaching approximately 70% confluence. For experiments, cells were seeded in a 96-well microplate in RPMI-1640 medium (5% FBS, 1-mM sodium pyruvate, 1% Penicillin-Streptomycin Solution) at 2.5 × 10⁴ cells per well. Cells were incubated 24 h before exposure to OAs in the same temperature and humidified atmosphere as described for cell maintenance. After growing the cells for 24 h, exposure to increasing concentrations of OA, DTX1, and DTX2 was conducted in sextuplicate in 100-μL medium for 24 h. The six wells per test sample were used in the neuro-2a assay. At the end of the exposure time, cell viability was measured as described below. The cytotoxicity assay was performed using the Cell Titer 96AQueous One solution Cell Proliferation Assay System (MTS assay; Promega, Madison, WI, USA), according to the manufacturer’s protocols. After exposing the cells to OAs for 24 h, the medium from the cells was removed. Then, 120-μL Cell Titer 96AQueous One solution reagent mixture with RPMI-1640 medium (5% FBS, 1-mM sodium pyruvate, 1% Penicillin-Streptomycin Solution) was added to each well. After incubation for 2 h at 37 °C in a humidified atmosphere containing 5% CO2, absorbance values were read on a microplate reader (iMark; Bio-Rad Laboratories, Inc., California, CA, USA) at 490 nm. RPMI-1640 medium was used as a control (100% cell viability). The cell viability (%) was calculated using the following equation:
cell viability (%) = (A2T/A2C) × 100
where A2T is the absorbance of test solution, and A2C is the absorbance of the control. The dose-dependent curves for cytotoxicity by OAs were constructed using a 4-parameter curve-fitting program (Microplate Manager 6 software, Bio-Rad Laboratories, Inc., California, CA, USA).

3. Results

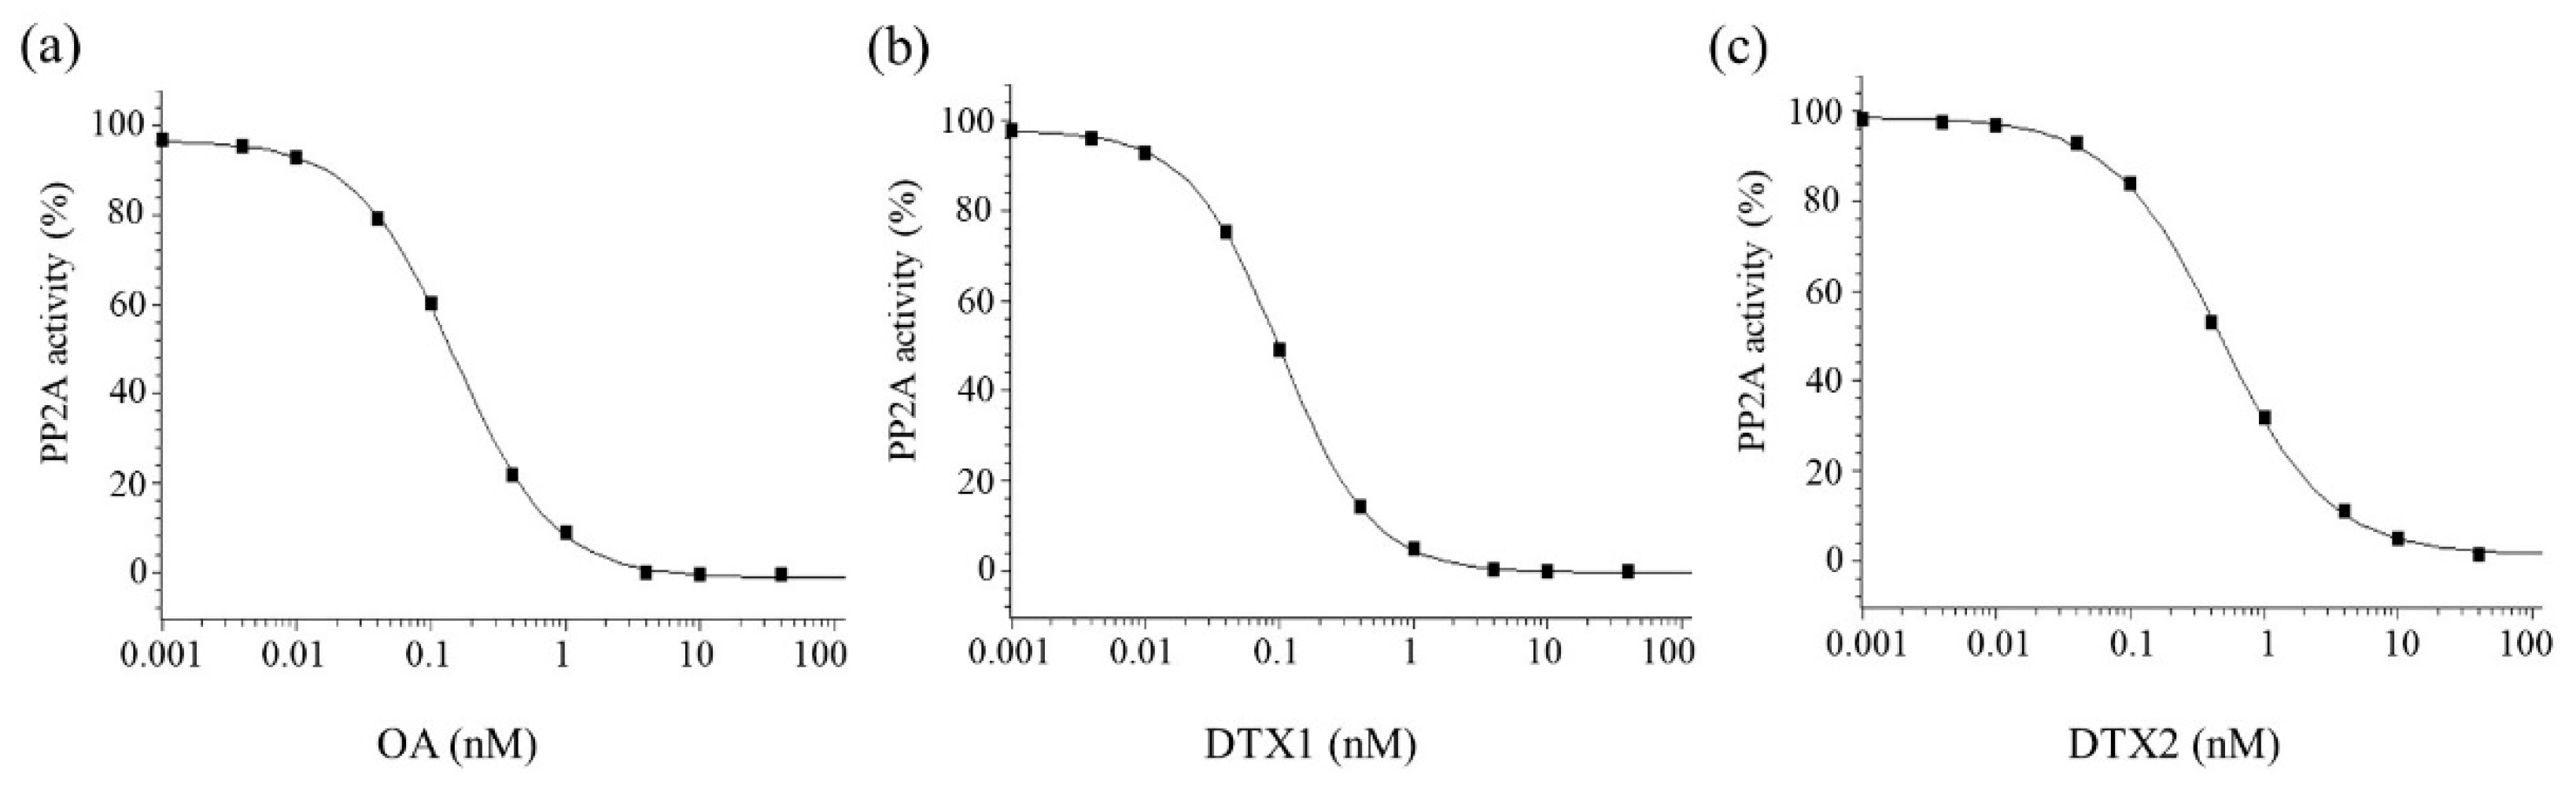
3.1. Inhibitory Potency on PP2A Activity and Neuro-2a Cytotoxicity of OA, DTX1, and DTX2

OA equivalents for OA, DTX1, and DTX2 were determined by performing the PP2A inhibition assay [24]. As shown in Figure 2, the OAs inhibited the rPP2A activity in a dose-dependent manner at concentrations ranging from 0.001 nM to 40 nM. The IC50 values deduced from these curves were 0.14, 0.09, and 0.45 nM (0.11, 0.07, and 0.36 ng/mL) for OA, DTX1, and DTX2, respectively. Therefore, the relative ratios for these three OAs were calculated to be 1.0:1.56:0.311 (Table 1). The figures can be rounded to 1.0:1.6:0.3.
The cytotoxicity of these toxins was determined by the viability assays using certified OAs and mouse neuroblastoma neuro-2a cells. As shown in Figure 3, OA, DTX1, and DTX2 were cytotoxic to neuro-2a cells in a dose-dependent manner at concentrations ranging from 1 to 300 nM for OA and DTX1, and 1 to 200 nM for DTX2. The EC50 values (nM) obtained from these curves were found to be 21.6, 14.1, and 41.0 nM (17.5, 11.5, and 33.2 ng/mL) for OA, DTX1, and DTX2, respectively. Therefore, the relative ratio for the three OAs was calculated to be 1.0:1.53:0.53, or 1.0:1.5:0.5 in round numbers (Table 1).
Comparative activity data for the OAs examined by PP2A inhibition (OApp2a) and cytotoxicity assays (OAn2a), are shown in Table 1, with the mouse lethality data in the literature obtained by intraperitoneal (OAip) and oral administration (OAor). The relative bioactivity observed by PP2A inhibition and cytotoxicity assays matched better with the oral mouse toxicity than the intraperitoneal toxicity.

3.2. Validation of OA Equivalents Obtained through PP2A Inhibition Assay Using Reference Shellfish Tissue

To explore the compatibility between OA equivalents produced by the PP2A inhibition assay and the mouse toxicity data, we conducted the PP2A inhibition assay using certified mussel tissues (CRMs, CRM-Zero-Mus, and CRM-DSP-Mus-c). The 7-O-acyl OA and 7-O-acyl DTX1, collectively called DTX3, were subjected to hydrolysis as officially recommended [14]. The quantifiable range in the PP2A inhibition assay was assessed from the calibration curve prepared with CRM of certified concentrations of OA (CRM-OA-d). From the calibration curve shown in Figure 4, the quantifiable range was deduced to lie between 0 and–10 ng/mL. The LOD values were 0.0387 μg/g (unhydrolyzed) and 0.0646 μg/g (hydrolyzed), and the LOQ values were 0.0765 μg/g for unhydrolyzed and 0.0989 μg/g for hydrolyzed samples (Table 2). For calculating the total OA equivalent of hydrolyzed samples, a factor (1.4) was used to calibrate the value increase due to the added alkali and acid solutions. Therefore, the two limits (LOQ and LOD) were slightly higher with hydrolyzed samples. Consequentially, the values in the hydrolyzed blanks were slightly higher than those before hydrolysis, but were still low enough to ensure the detection and quantification of OA at the regulation level (0.16μg/g whole meat) [12,13]. Thus, the assay can detect and quantify OA at a much lower level than requested by the regulation.
To evaluate the accuracy of the assay method, we conducted the PP2A inhibition assay on the certified mussel tissue (CRM-DSP-Mus-c). The resultant OA equivalents based on the PP2A inhibition assays were compared with OA equivalents (Table S8) expected according to the OApp2a shown in Table 1 and the OA concentrations shown in Table S7 (Table 3). The assessment using the OA equivalent values led to slight but consistent overestimation of the contents, and RSD obtained from five separate experiments was 1.7–7.8%. The OA equivalents calculated using the PP2A inhibition assay were 90.3–116.1%. These data, produced using certified material, rather than spiked recovery tests, confirmed the reliability of the PP2A inhibition assay using rPP2A as the method for detecting and quantifying OAs in shellfish.

4. Discussion

In this study, we determined the potency of the OAs to inhibit PP2A activity (OApp2a) and suppress cell viability (OAn2a) using certified reference material. The PP2A inhibitory potency expressed in IC50 decreased by order of DTX1 > OA > DTX2. This order agreed with that defined by acute oral toxicity in mice. The neuro-2a cell viability assays also gave the same order as the OAs. The relative ratio for the three OAs cytotoxicity shown in Table 1 was similar to the results of previous report [8]. Previously, the lethal potencies of OA and DTX1 by intraperitoneal injection were reported, respectively, to be 200 μg/kg [1] and 160 μg/kg [17]. The higher toxicity of DTX1 compared to OA agrees with the results of this study, and suggests the necessity of reevaluating the relative potency of OAs, currently assumed as OA:DTX1 being 1:1.
In the LC-MS analysis, dinophysistoxin-3 (DTX3), the 7-O-acyl esters of OA, and DTX1 are quantified after hydrolysis to OA or DTX1. In the MBA and cytoxicity assays, however, the fatty acids, either present originally or produced by hydrolysis, significantly interfere with the assays, sometimes giving false-positive results [14]. In addition to fatty acids, other concurrent toxins called pectenotoxins (PTX) or yessotoxins (YTX) also produce false-positive results. Therefore, sample preparations for MBA require careful attention to the contaminant fatty acids and other toxins (PTX and YTX). Alternatively, the PP2A inhibition assay is insensitive to the contaminant fatty acids PTXs, and YTXs, providing a distinct advantage over other assays [20]. The data in this study were obtained using certified toxins or materials and rPP2A of high quality. The PP2A assays, along with LC/MS analysis, can determine microcystins besides OAs [27,28]. The assay is simple, inexpensive, ready for use on site, and can handle a large number of samples [29]. This assay method is suitable for broad use as a replacement for MBA, as supported by the consistency with the oral toxicity of MBA.

Supplementary Materials

The following are available online at https://0-www-mdpi-com.brum.beds.ac.uk/article/10.3390/jmse9101140/s1. Table S1: Dilution of CRM-OA-d (10.4 μM) for PP2A inhibition assay; Table S2: Dilution of CRM-DTX1-b (10.4 μM) for PP2A inhibition assay; Table S3: Dilution of CRM-DTX2-b (4.7 μM) for PP2A inhibition assay; Table S4: Dilution of CRM-OA-b (10.4 μM) for neuro-2a cell viability assay; Table S5: Dilution of CRM-DTX1-b (10.4 μM) for neuro-2a cell viability assay; Table S6: Dilution of CRM-DTX2-b (4.7 μM) for neuro-2a cell viability assay; Table S7: OAs concentration in diluted CRM-DSP-MUS-c for PP2A inhibition assay; Table S8: Total OA equivalents (μg/g whole meat) expected according to the OApp2a shown in Table 1 and the OA concentrations shown in Table S7.

Author Contributions

T.I. and N.O. conceived and designed the experiments; T.I. and K.C. performed the experiments and analyzed the data; T.I. and K.C. contributed reagents/materials/analysis tools; and T.I., K.C. and N.O. wrote the manuscript. All authors have read and agreed to the published version of the manuscript.

Funding

This research received no external funding.

Institutional Review Board Statement

Not applicable.

Informed Consent Statement

Not applicable.

Data Availability Statement

Not applicable.

Acknowledgments

We thank Takeshi Yasumoto (Japan Food Research Laboratories) for the valuable conversation and for critically reading this manuscript.

Conflicts of Interest

The authors declare no conflict of interest.

References

  1. Murakami, Y.; Oshima, Y.; Yasumoto, T. Identification of okadaic acid as a toxic component of a marine dinoflagellate Prorocentrum lima. Bull. Jpn. Soc. Sci. Fish. 1982, 48, 69–72. [Google Scholar] [CrossRef]
  2. Hu, T.; Doyle, J.; Jackson, D.; Marr, J.; Nixon, E.; Pleasance, S.; Quilliam, M.A.; Walter, J.A.; Wright, J.L.C. Isolation of a new diarrhetic shellfish poison from irish mussels. J. Chem. Soc. Chem. Commun. 1992, 1, 39–41. [Google Scholar] [CrossRef]
  3. Lee, J.-S.; Igarashi, T.; Fraga, S.; Dahl, E.; Hovgaard, P.; Yasumoto, T. Determination of diarrhetic shellfish toxins in various dinoflagellate species. J. Appl. Phycol. 1989, 1, 147–152. [Google Scholar] [CrossRef]
  4. Yasumoto, T.; Oshima, Y.; Sugawara, W.; Fukuyo, Y.; Oguri, H.; Igarashi, T.; Fujita, N. Identification of Dinophysis fortii as the causative organism of diarrhetic shellfish poisoning. Bull. Jpn. Soc. Sci. Fish. 1980, 46, 1405–1411. [Google Scholar] [CrossRef] [Green Version]
  5. Yasumoto, T.; Murata, M. Marine toxins. Chem. Rev. 1993, 93, 1897–1909. [Google Scholar] [CrossRef]
  6. Hamano, Y.; Kinoshita, Y.; Yasumoto, T. Toxic dinoflagellates. In Proceedings of the Third International Conference on Toxic Dinoflagellates, St. Andrews, NB, Canada, 8–12 June 1985; Anderson, D.M., White, A.W., Baden, D.G., Eds.; Elsevier: New York, NY, USA, 1985; pp. 383–388. [Google Scholar]
  7. Fujiki, H.; Suganuma, M.; Suguri, H.; Yoshizawa, S.; Ojika, M.; Wakamatsu, K.; Yamada, K.; Sugimura, T. Induction of ornithine decarboxylase activity in mouse skin by a possible tumor promoter, okadaic acid. Proc. Jpn. Acad. Ser. B 1987, 63, 51–53. [Google Scholar] [CrossRef] [Green Version]
  8. Soliño, L.; Sureda, F.X.; Diogène, J. Evaluation of okadaic acid, dinophysistoxin-1 and dinophysistoxin-2 toxicity on neuro-2a, ng108-15 and mcf-7 cell lines. Toxicol. Vitr. 2015, 29, 59–62. [Google Scholar] [CrossRef]
  9. Smienk, H.; Domínguez, E.; Rodríguez-Velasco, M.L.; Clarke, D.; Kapp, K.; Katikou, P.; Cabado, A.G.; Otero, A.; Vieites, J.M.; Razquin, P.; et al. Quantitative determination of the okadaic acid toxins group by a colorimetric phosphatase inhibition assay: Interlaboratory study. J. AOAC Int. 2019, 96, 77–85. [Google Scholar] [CrossRef] [PubMed]
  10. Garibo, D.; Dàmaso, E.; Eixarch, H.; de la Iglesia, P.; Fernández-Tejedor, M.; Diogène, J.; Pazos, Y.; Campàs, M. Protein phosphatase inhibition assays for okadaic acid detection in shellfish: Matrix effects, applicability and comparison with lc–ms/ms analysis. Harmful Algae 2012, 19, 68–75. [Google Scholar] [CrossRef] [Green Version]
  11. European Commission. Commission regulation no. 15/2011 of january 10, 2011. Off. J. Eur. Communities 2011, 3–6. [Google Scholar]
  12. Codex Alimentarius International Food Standards. In Standard for Live and Raw Bivalve Molluscs Codex Standard 292-2008; Adopted in 2008. Amendment: 2013. Revision: 2014 and 2015; Food and Agriculture Organization of the United Nations: Rome, Italy; World Helth Organization: Geneva, Switzerland, 2008.
  13. European Commission. Regulation (ec) no 853/2004. Off. J. Eur. Union L139 2004, 47, 55–105. [Google Scholar]
  14. European Food Safety Authority. Marine biotoxins in shellfish - okadaic acid and analogues-scientific opinion of the panel on contaminants in the food chain. EFSA J. 2008, 6, 589. [Google Scholar] [CrossRef]
  15. FAO; WHO. Technical Paper on Toxicity Equivalency Factors for Marine Biotoxins Associated with Bivalve Molluscs; FAO: Rome, Italy, 2016; p. 47. [Google Scholar]
  16. Abal, P.; Louzao, M.C.; Suzuki, T.; Watanabe, R.; Vilariño, N.; Carrera, C.; Botana, A.M.; Vieytes, M.R.; Botana, L.M. Toxic action reevaluation of okadaic acid, dinophysistoxin-1 and dinophysistoxin-2: Toxicity equivalency factors based on the oral toxicity study. Cell. Physiol. Biochem. 2018, 49, 743–757. [Google Scholar] [CrossRef] [PubMed] [Green Version]
  17. Murata, M.; Shimatani, M.; Sugitani, H.; Oshima, Y.; Yasumoto, T. Isolation and structural elucidation of the causative toxin of the diarrhetic shellfish poisoning. Bull. Jpn. Soc. Sci. Fish. 1982, 48, 549–552. [Google Scholar] [CrossRef] [Green Version]
  18. Bialojan, C.; Takai, A. Inhibitory effect of a marine-sponge toxin, okadaic acid, on protein phosphatases. Specificity and kinetics. Biochem. J. 1988, 256, 283–290. [Google Scholar] [CrossRef]
  19. Takai, A.; Mieskes, G. Inhibitory effect of okadaic acid on the p-nitrophenyl phosphate phosphatase activity of protein phosphatases. Biochem. J. 1991, 275, 233–239. [Google Scholar] [CrossRef] [Green Version]
  20. Tubaro, A.; Florio, C.; Luxich, E.; Sosa, S.; Loggia, R.D.; Yasumoto, T. A protein phosphatase 2a inhibition assay for a fast and sensitive assessment of okadaic acid contamination in mussels. Toxicon Off. J. Int. Soc. Toxinol. 1996, 34, 743–752. [Google Scholar] [CrossRef]
  21. Simon, J.F.; Vernoux, J.P. Highly sensitive assay of okadaic acid using protein phosphatase and paranitrophenyl phosphate. Nat. Toxins 1994, 2, 293–301. [Google Scholar] [CrossRef]
  22. Ikehara, T.; Nakashima, S.; Nakashima, J.; Kinoshita, T.; Yasumoto, T. Efficient production of recombinant pp2a at a low temperature using a baculovirus expression system. Biotechnol. Rep. 2016, 11, 86–89. [Google Scholar] [CrossRef] [PubMed] [Green Version]
  23. Ikehara, T.; Shinjo, F.; Ikehara, S.; Imamura, S.; Yasumoto, T. Baculovirus expression, purification, and characterization of human protein phosphatase 2a catalytic subunits α and β. Protein Expr. Purif. 2006, 45, 150–156. [Google Scholar] [CrossRef]
  24. Ikehara, T.; Imamura, S.; Yoshino, A.; Yasumoto, T. Pp2a inhibition assay using recombinant enzyme for rapid detection of okadaic acid and its analogs in shellfish. Toxins 2010, 2, 195–204. [Google Scholar] [CrossRef] [Green Version]
  25. Ikehara, T.; Kinoshita, T.; Kurokawa, A.; Nakashima, S.; Maekawa, K.; Ohshiro, N.; Yasumoto, T. Evaluation of protein phosphatase 2A (PP2A) inhibition assay for rapid detection of dsp toxins in scallop. NIPPON SUISAN GAKKAISHI 2017, 83, 367–372. [Google Scholar] [CrossRef] [Green Version]
  26. Bodero, M.; Bovee, T.F.H.; Wang, S.; Hoogenboom, R.L.A.P.; Klijnstra, M.D.; Portier, L.; Hendriksen, P.J.M.; Gerssen, A. Screening for the presence of lipophilic marine biotoxins in shellfish samples using the neuro-2a bioassay. Food Addit. Contam. Part A 2018, 35, 351–365. [Google Scholar] [CrossRef]
  27. Ikehara, T.; Kuniyoshi, K.; Yamaguchi, H.; Tanabe, Y.; Sano, T.; Yoshimoto, M.; Oshiro, N.; Nakashima, S.; Yasumoto-Hirose, M. First report of microcystis strains producing mc-fr and -wr toxins in japan. Toxins 2019, 11, 521. [Google Scholar] [CrossRef] [PubMed] [Green Version]
  28. Deeds, J.R.; Stutts, W.L.; Celiz, M.D.; MacLeod, J.; Hamilton, A.E.; Lewis, B.J.; Miller, D.W.; Kanwit, K.; Smith, J.L.; Kulis, D.M.; et al. Dihydrodinophysistoxin-1 produced by dinophysis norvegica in the gulf of maine, USA and its accumulation in shellfish. Toxins 2020, 12, 533. [Google Scholar] [CrossRef] [PubMed]
  29. Massey, I.Y.; Wu, P.; Wei, J.; Luo, J.; Ding, P.; Wei, H.; Yang, F. A mini-review on detection methods of microcystins. Toxins 2020, 12, 641. [Google Scholar] [CrossRef] [PubMed]
Figure 1. Chemical structure of OA, DTX1, and DTX2.
Jmse 09 01140 g001
Figure 2. Dose-dependent curves for the inhibition of rPP2A activity by OA (a), DTX1 (b), and DTX2 (c). Each point represents the mean (n = 6) with an intra-plate SD of less than 2%.
Jmse 09 01140 g002
Figure 3. Effect of OA (a), DTX1 (b), and DTX2 (c) on the viability of neuro-2a cells. Each point represents the mean (n = 6) with an intra-plate SD of less than 11%.
Jmse 09 01140 g003
Figure 4. The calibration curve was obtained using the PP2A inhibition assay. The PP2A inhibition assay was conducted with OA standard solutions (0, 0.5, 1.0, 1.5, 2.0, 2.5, 5.0, and 10.0 ng/mL) prepared from OA CRM (CRM-OA-d). Each point represents the mean (n = 3) with an RSD of less than 2.5%.
Jmse 09 01140 g004
Table 1. IC50 values of OAs in the PP2A inhibition assay, EC50 values of OAs in the neuro-2a assay, and comparison of OA equivalents for OAs based on the PP2A inhibition, cytotoxicity, and mouse lethality.
ToxinsPP2A InhibitionCytotoxicityMouse Lethality
IC50 (nM)OApp2a aEC50 (nM)OAn2a bOAip cOAor d
OA0.14121.6111
DTX10.091.614.11.511.5
DTX20.450.341.00.50.50.3
a OA equivalent (OApp2a) based on PP2A inhibition activity in this study. b OA equivalent (OAn2a) based on cytotoxicity to neuro-2a cells in this study. c OA equivalent (OAip) based on acute intraperitoneal toxicity in mice [15]. d OA equivalent (OAor) based on acute oral toxicity in mice [16].
Table 2. Limits of detection (LOD) and quantitation (LOQ) for Mussel.
MatrixMussels
UnhydrolyzedHydrolyzed
Mean a (μg/g)0.02250.0499
SD±0.0054±0.0049
LOD b (μg/g)0.03870.0646
LOQ c (μg/g)0.07650.0989
a Mean value of 6 independent matrix blanks prepared from mussel CRM (CRM-Zero-Mus). b Mean value + 3 × SD. c Mean value + 10 × SD.
Table 3. OA equivalents (μg of OA eq /g whole meat) determined by PP2A inhibition assay and expected according to the OApp2a.
Sample
no.
OA Equivalents (μg/g)Accuracy (%)(a)/(b)×100
PP2A Inhibition Assay Result
in the Present Study (a)
Expected Equivalent *
according to the OApp2a (b)
MeanRSD (%)
10.54875.60.608090.3
20.32823.60.3040108.0
30.17337.80.1507115.0
40.52932.40.4820109.8
50.27986.40.2410116.1
60.13321.70.1213109.8
Sample no. 1, 2, 3 = unhydrolyzed, 4, 5, 6 = hydrolyzed samples. * Total OA equivalents are shown in Table S8.
Publisher’s Note: MDPI stays neutral with regard to jurisdictional claims in published maps and institutional affiliations.

