
Mackerel (Scomber australasicus) Reproduction in Northeastern Taiwan


1
Department of Environmental Biology and Fisheries Science, National Taiwan Ocean University, No. 2, Beining Rd, Keelung 20224, Taiwan
2
Center of Excellence for the Oceans, National Taiwan Ocean University, No.2, Beining Rd, Keelung 20224, Taiwan
*
Author to whom correspondence should be addressed.
J. Mar. Sci. Eng. 2021, 9(12), 1341; https://0-doi-org.brum.beds.ac.uk/10.3390/jmse9121341
Submission received: 25 October 2021
/
Revised: 22 November 2021
/
Accepted: 25 November 2021
/
Published: 29 November 2021
(This article belongs to the Special Issue Interannual Variation of Planktonic Species and Fish Populations)
Abstract
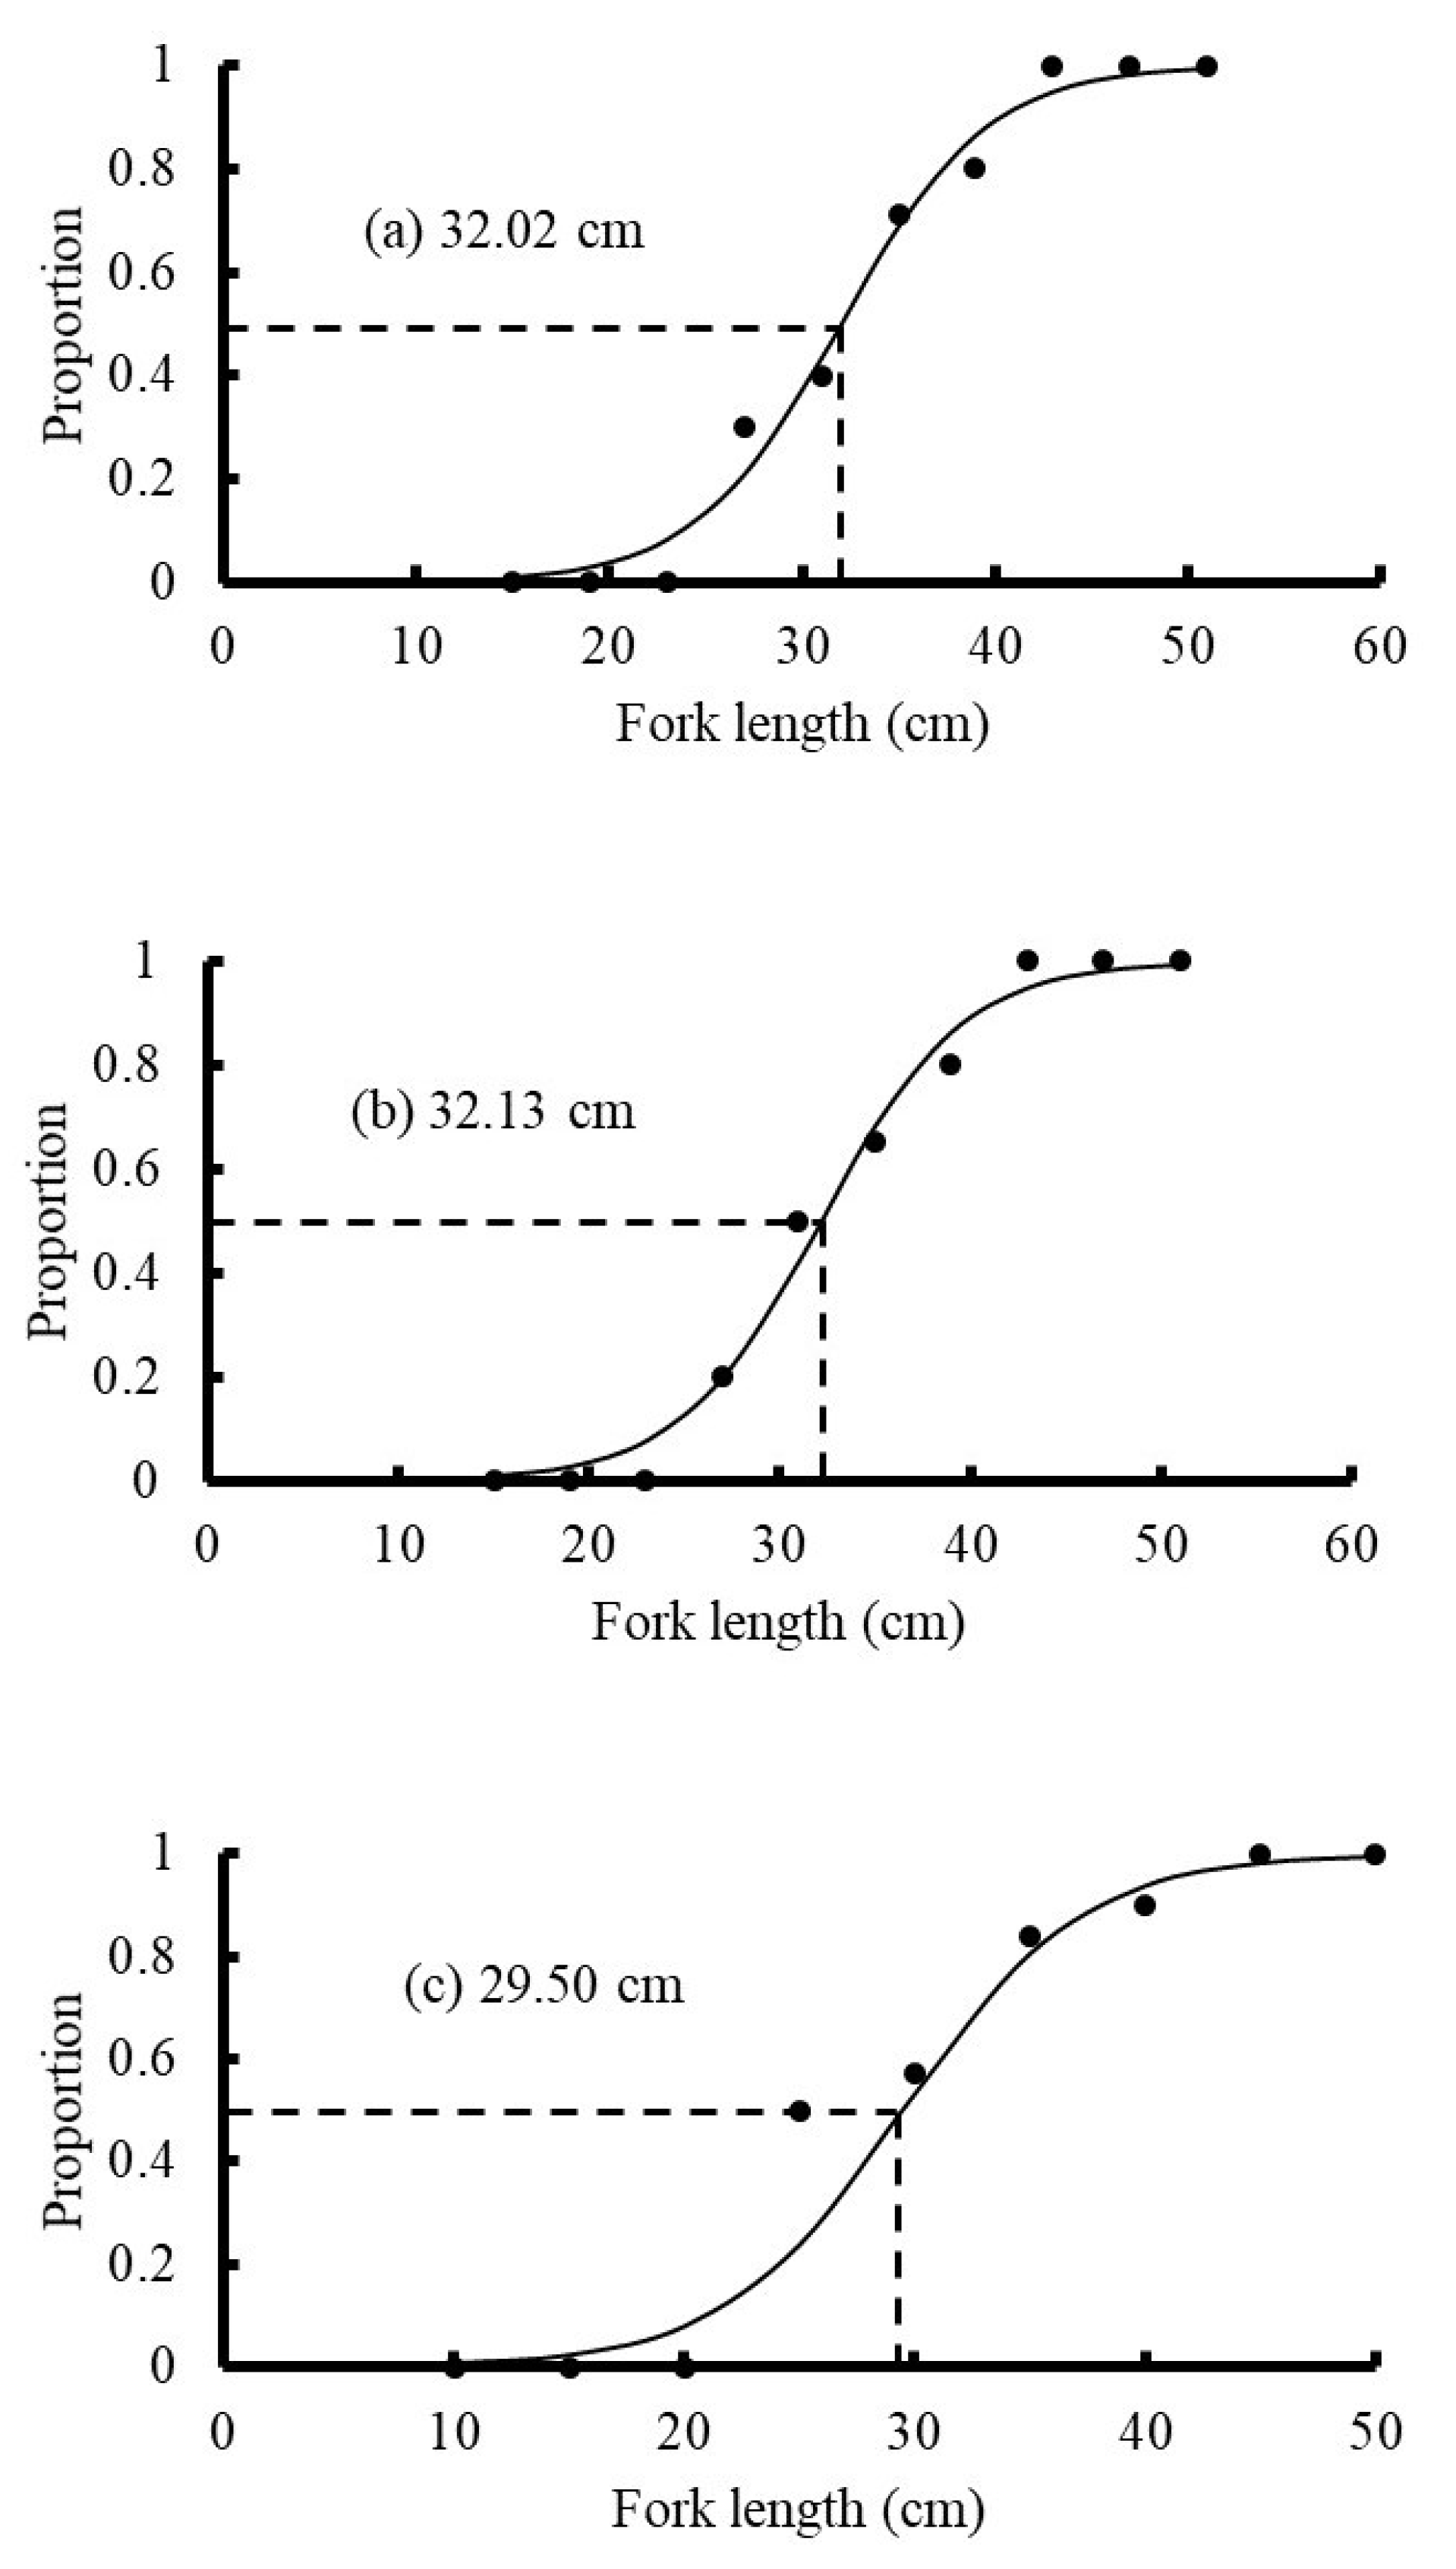
:Blue mackerel (Scomber australasicus) is a crucial target species for coastal fisheries in Taiwan, and additionally it has maintained its status as the highest-produced species. The timely measurement of spawning status is crucial for determining the correct management strategy for this species. The objective of this study was to determine size at maturity, fecundity, batch fecundity, and spawning frequency on the basis of samples collected from Nan-Fang-Ao fishing port in Yilan, during the spawning season from 2017 to 2019. Histological sections indicated that the blue mackerel were multiple spawners; a higher percentage of female fish spawned at the peak of the gonadosomatic index. The 50% sizes at maturity were 32.02, 32.13, and 29.64 cm. Mean total fecundity (batch fecundity) was 165 (103), 229 (96), and 210 (68) oocytes per ovary-free weight (g) for 2017, 2018, and 2019, respectively; fecundity was determined through observation of postovulatory follicles (POFs). The spawning frequencies (spawning fraction) in 2017, 2018, and 2019 were 3–10 days (0.13), 4–14 days (0.08), and 4–12 days (0.09), respectively. The spawning frequencies determined through the three estimated methods, namely the sums of (a) hydrated and Day 0 POFs; (b) Day 1+ POFs, and (c) all data combined, were 1 spawning event per 8, 10, and 9 days, respectively. The reproduction of the blue mackerel was greater in 2017 than it was in 2018 or 2019, as indicated by the higher batch fecundity and shorter spawning seasons. Environmental factors should also be considered as a major factor influencing successful reproduction and spawning season
1. Introduction
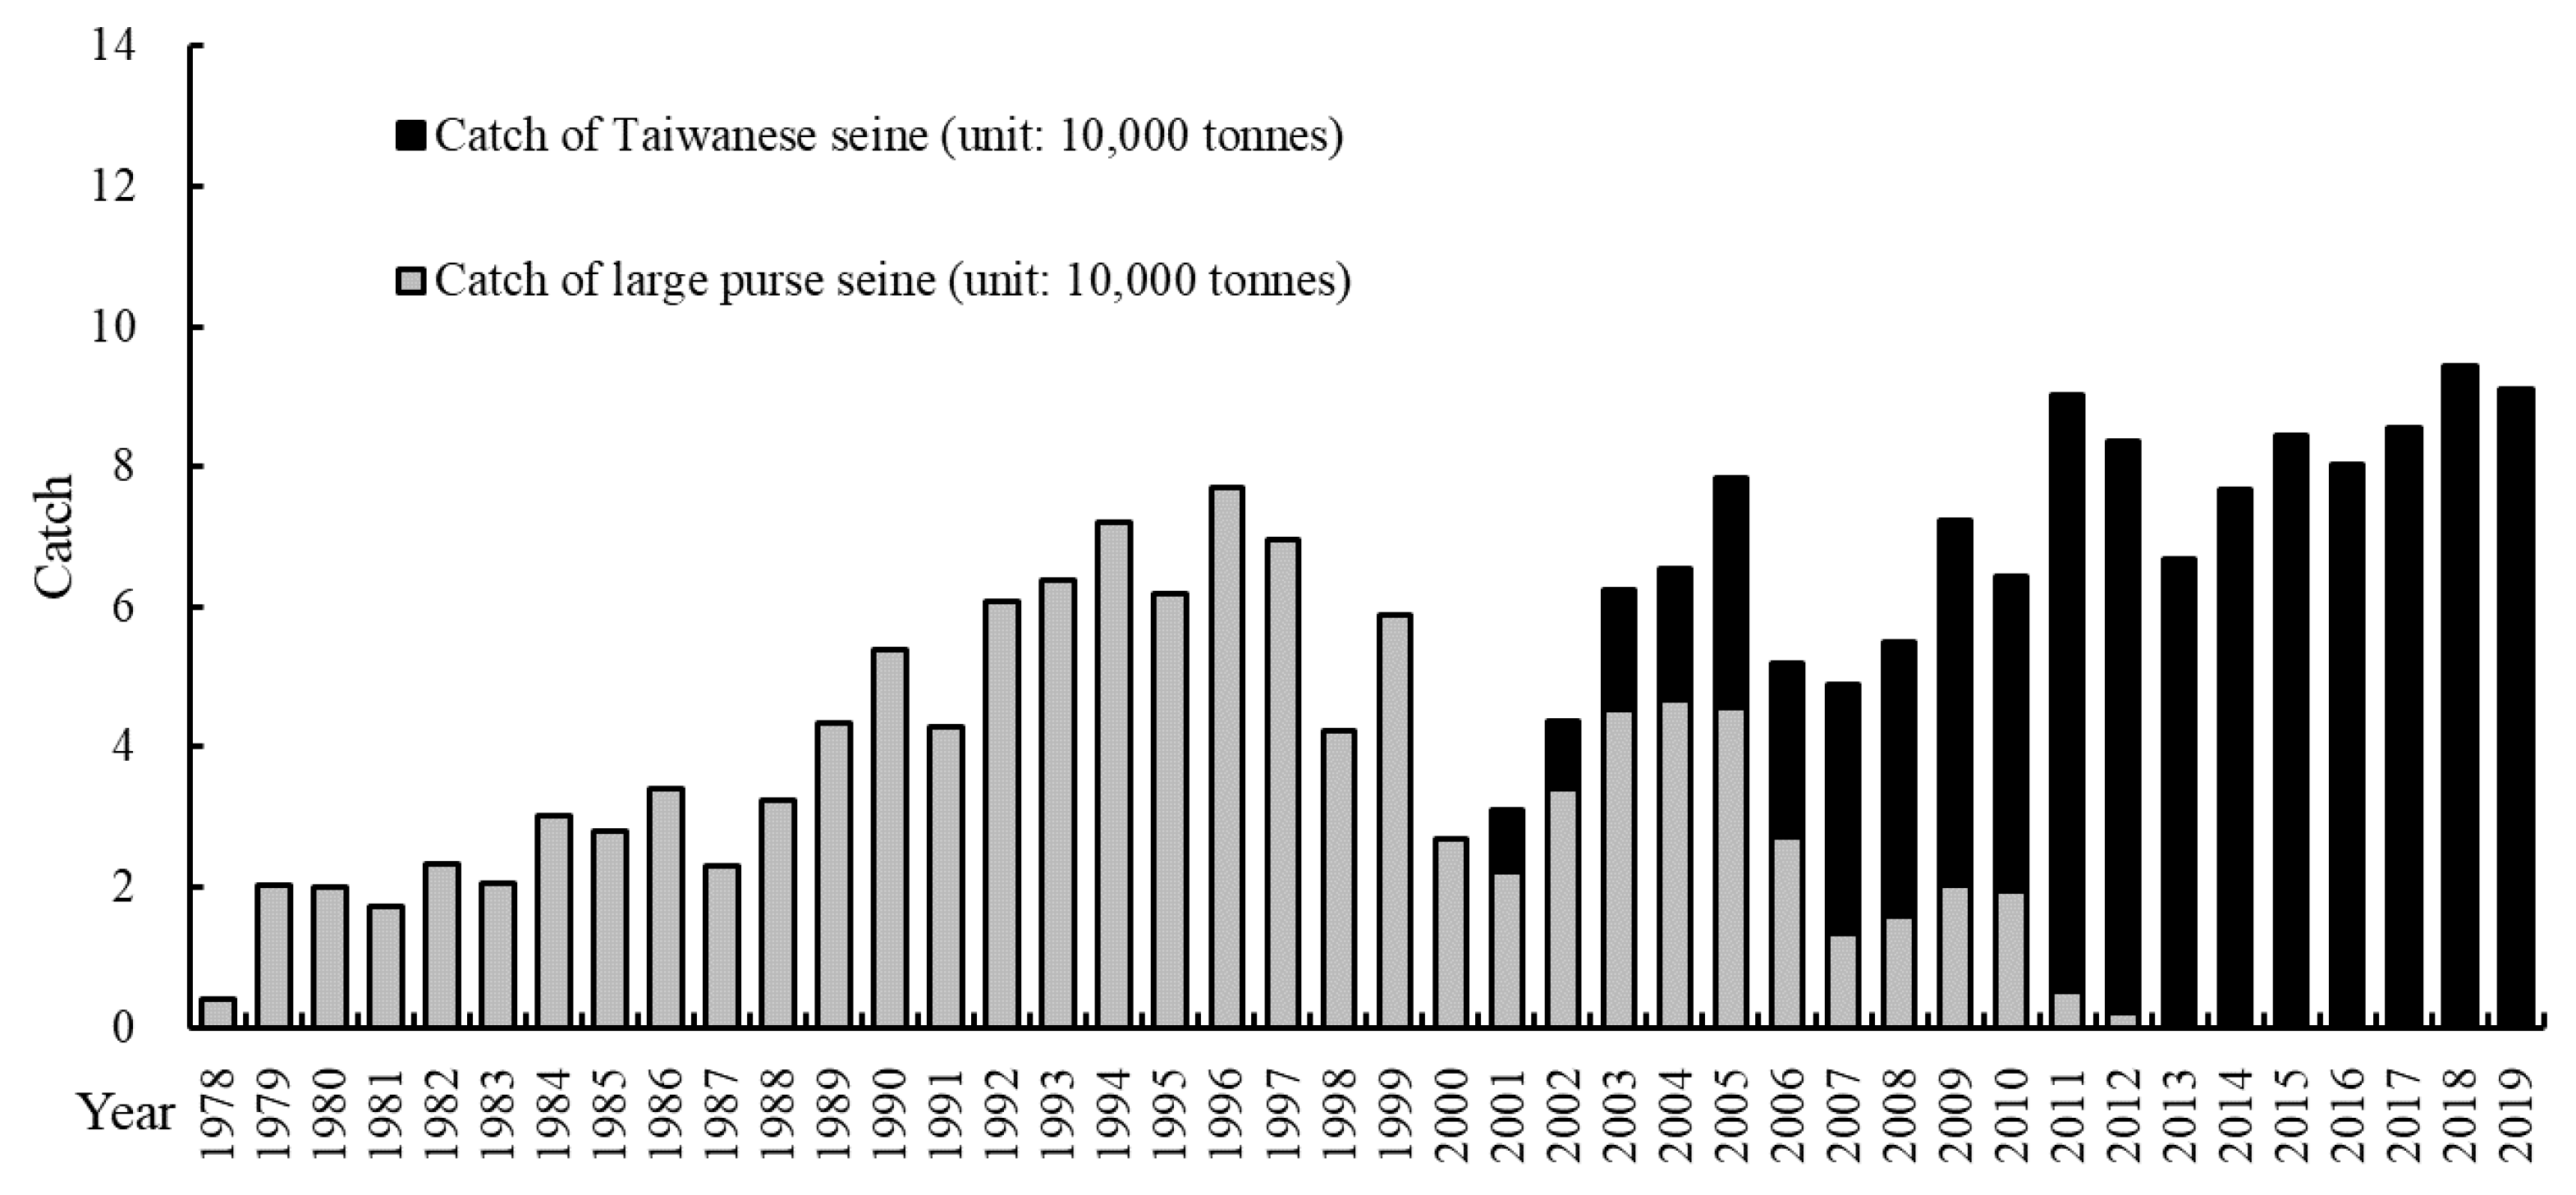
World production of Scomber japonicus (Chub mackerel) and Scomber australasicus (blue mackerel) was approximately 1.6 million tons in 2016 [1]. Only 2% of the total catch was blue mackerel, which was distributed across several countries, including Asian countries, such as Japan, Korea, Taiwan, and more. Japan had a higher mackerel production than Taiwan and Korea, with a total catch of 517,602 tons in 2017. According to the Japan Statistical Yearbook 2018 [2], this total catch had more chub mackerel than blue mackerel. However, Taiwan’s mackerel fishery differed; blue mackerel dominated the catch production almost every year. In addition, blue mackerel, which is a crucial target species in Taiwan, was >50% of the mackerel catch. Blue mackerel is primarily distributed along the continental shelf of the East China Sea (ECS) from north of the Pacific coast of Japan to the South China Sea [3]. Mackerel fisheries play a crucial role in Taiwanese fisheries, and as such, the total catch has increased since 1978. The output of a mackerel fishery has been between 70,000 and 85,000 tons in recent years. The increase in total mackerel catch was supported by the gradual replacement of large purse seines, which have completely disappeared since 2013, with Taiwanese seines (Figure 1). Studies have reported that the minimum and medium sexually mature body lengths have decreased [4]; this decrease may be due to overfishing or global warming. The Taiwanese government has implemented regulations for fishing. In 2013, fishing activity was banned in June of each year, and since 2018 no fishing activity has been permitted between December 29 and January 8 in the lunar year calendar. The total duration of the fishing ban is 50 days each year. The main purpose of these regulations is to protect spawning grounds during the spawning season, which is a major concern of the public.
Several studies related to the spawning of blue mackerel have demonstrated that spawning success is critical for mackerel stock assessments. However, more research is required to determine the correct management and sustainable development of fisheries, especially from the perspective of reproductive biology. Thus, the reproductive biology of blue mackerel, including their fecundity, size at maturity, spawning fraction, and reproductive season, must be investigated. These factors are critical to assess the spawning behavior of blue mackerel. Reproduction studies are crucial to the application of egg-based stock assessment methods, such as the annual egg production method (AEPM) and the daily egg production method (DEPM), to determine annual fecundity and batch fecundity (BF), respectively [5]. These methods have been used to assess northern anchovy resources [6] and were adopted by Roger et al. [7] to assess blue mackerel. These methods require knowledge of reproduction parameters. Most coastal fisheries are suitable for the DEPM assessment, including the assessment of blue mackerel fisheries, and several studies have applied the DEPM.
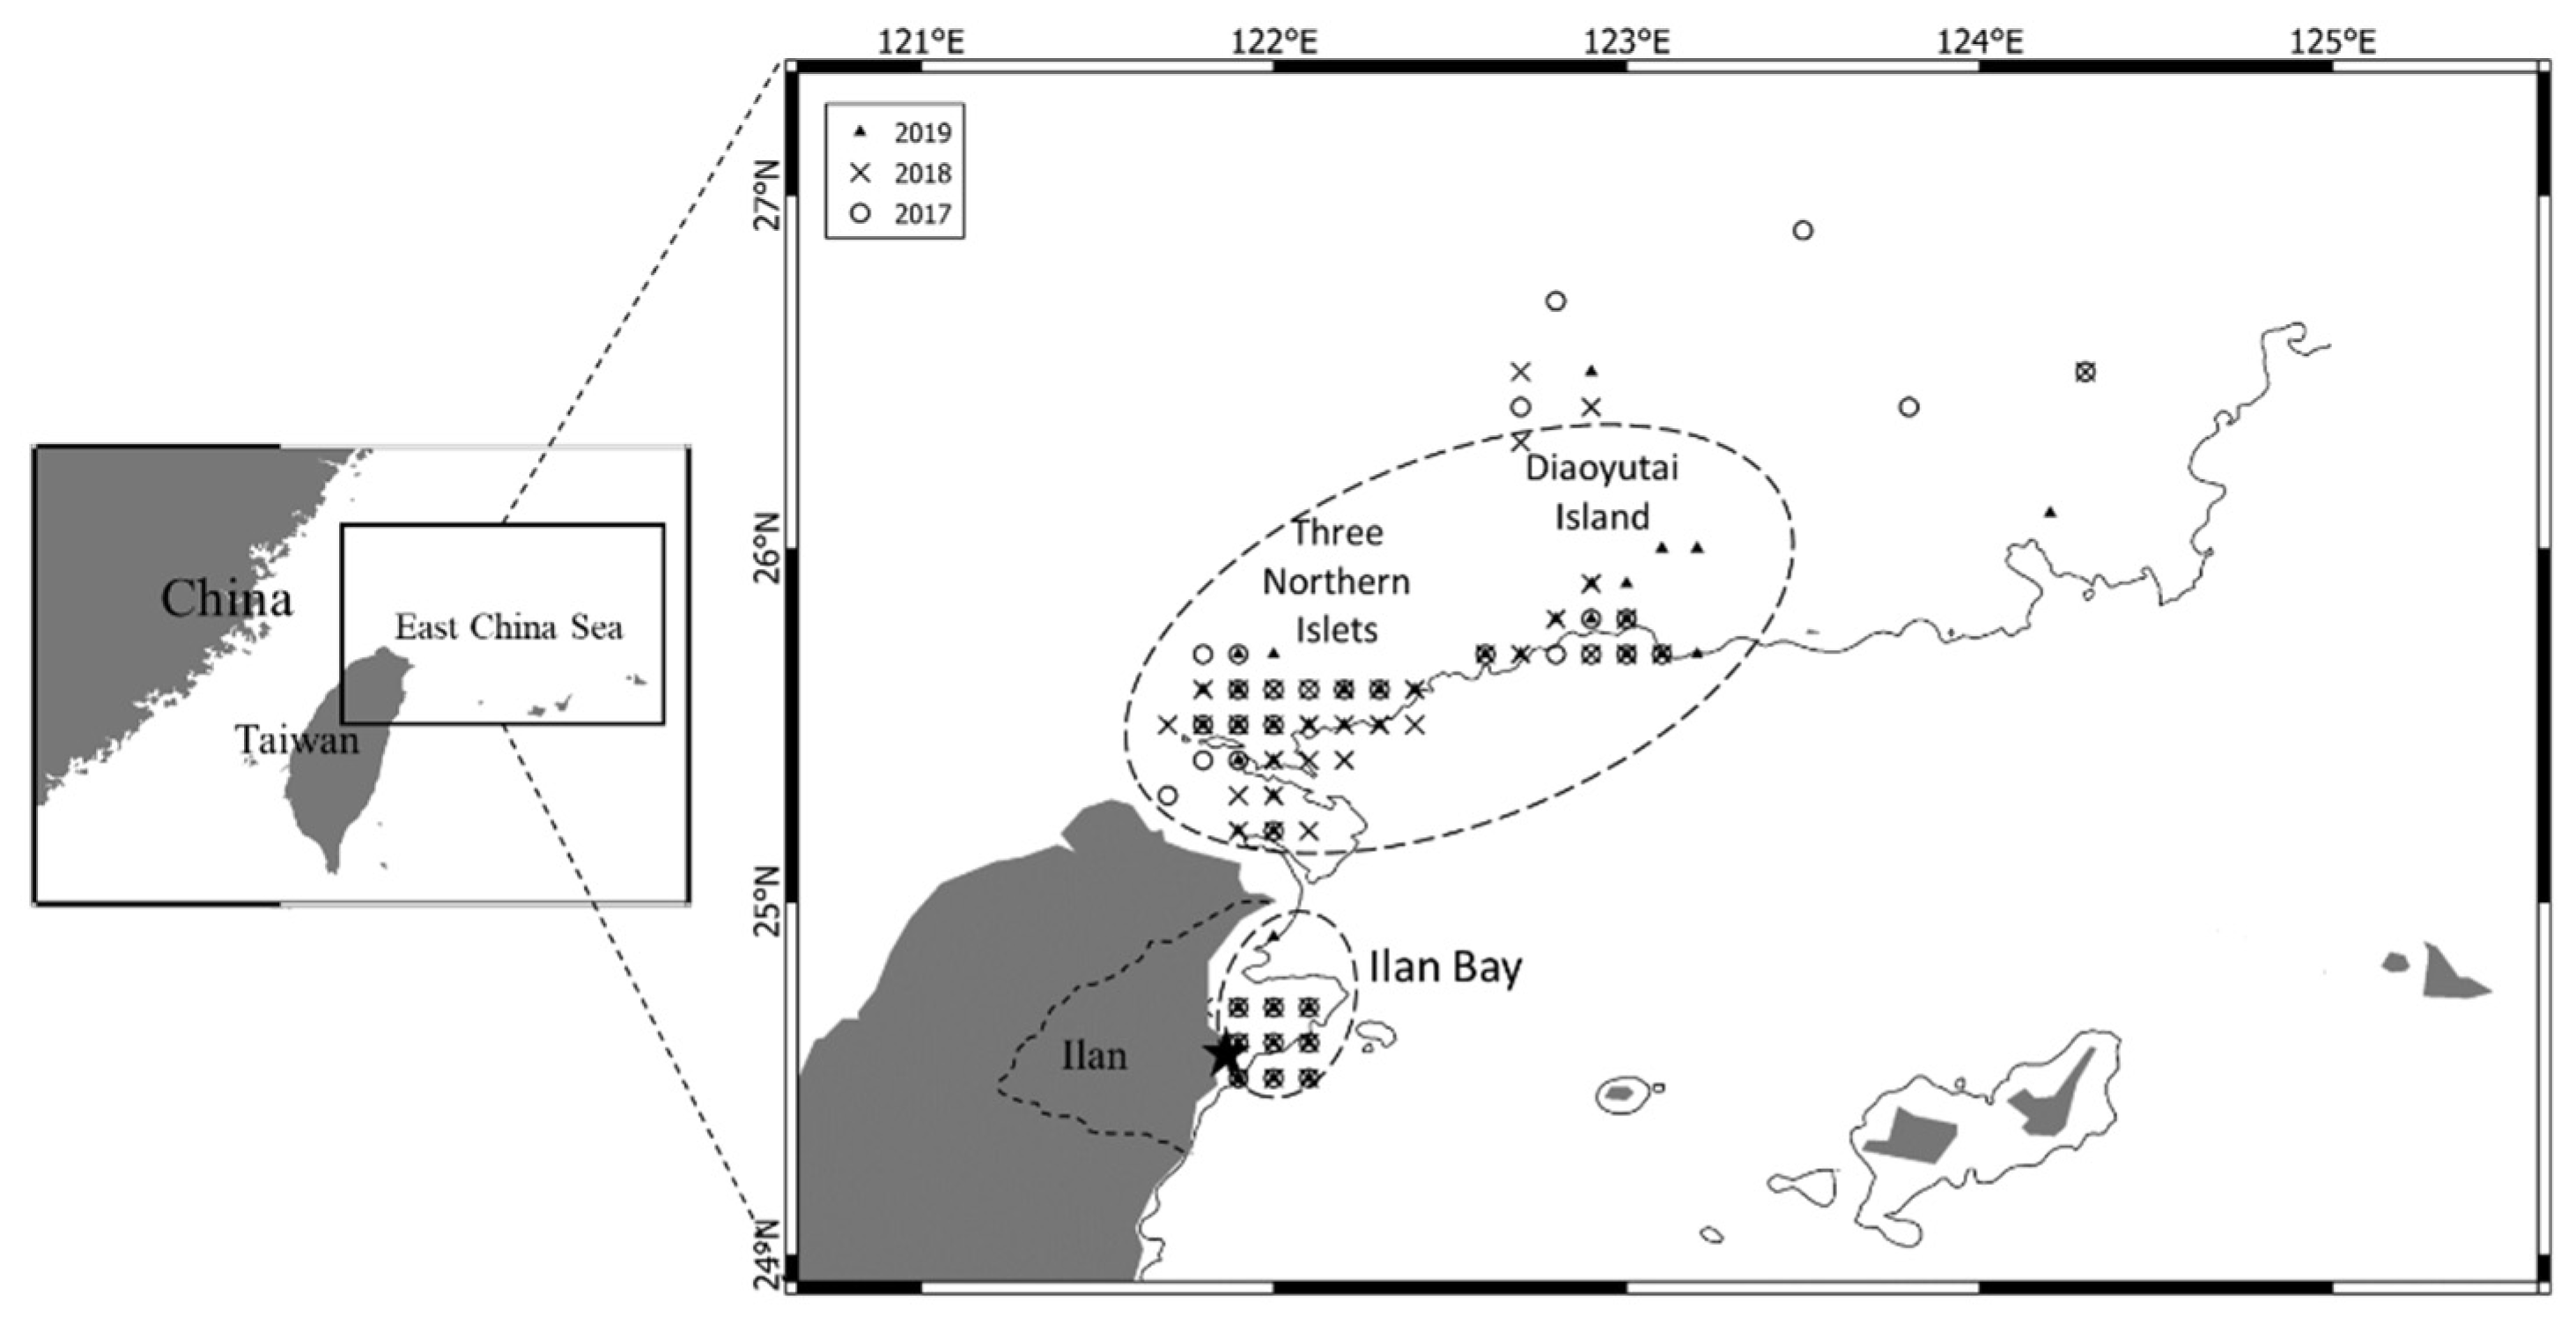
The variation in fecundity among species reveals differences in reproductive strategies [8]. Fecundity is the ability to produce numerous offspring in one spawning event, and BF is the total number of oocytes released in a single batch. BF is estimated using the DEPM, in which the number of hydrated eggs (stage IV) contained in ovaries is counted. Spawning frequency is the average number of days between the spawning events of individual female fish [7]. According to Hunter and Macewicz [9] and Hunter and Goldberg [10], spawning frequency can be estimated using the incidence of postovulatory follicles (POFs). The estimation of spawning frequency requires a mature sample during the spawning season. POFs appear in the ovary after hatching and can be observed in histological tissue under microscopy. Ward et al. [11] and Rogers et al. [7] reported that POFs could be identified in the ovaries of blue mackerel for up to 24 h after spawning, and that they may differ from those of other species due to the water temperature and other environmental factors. The ECS is rich in nutrients and is crucial in supporting the growth of pelagic species, including mackerel. The northern waters of Taiwan are vital spawning grounds for blue mackerel in the ECS. This area comprises the southern part of the ECS, from the Diaoyutai Island (known as Senkaku Island in Japan)—three northern islets—to the south of Yilan Bay (Figure 2). Blue mackerel from the ECS and coastal waters of Taiwan were demonstrated to be of the same stock [12]. Differences in the ecological characteristics of these habitats should be considered. However, the goal of this study was to determine the current status of blue mackerel to facilitate resource management of blue mackerel in Taiwan. This goal was achieved by determining the reproductive biology of blue mackerel in northeastern Taiwan by measuring size at maturity, fecundity, BF, and spawning frequency.
2. Materials and Methods
2.1. Sample Collection and Basic Measurements
A blue mackerel sample was collected from January to December between 2017 and 2019 in Nan-Fang-Ao fishing port, Yilan. The fork length (FL) and body weight (BW) were measured to the nearest millimeter and gram, respectively. Samples were brought to the laboratory for biological examination. The gonads were removed from the fish, weighed (gonad weight [GW]), and preserved in 10% buffered formalin for at least 6 months to create a hard structure for histological section. The gonadosomatic index (GSI) was calculated as follows:
GSI = (GW/BW) × 100
The gonad samples in the spawning season (January–May) between 2017 and 2019 were collected to continue the process of histology, fecundity, BF, and spawning frequency.
2.2. Histological Section and Ovary Classification
A small part of the gonad was placed in an embedding box, washed for 12 to 24 h, and fixed with 80%, 95%, and 100% alcohol. Each step was 30 min. The gonad was then soaked in xylene, twice, for 90 min each time. The infiltration step was performed by placing the embedding box in a paraffin melt of approximately 60 °C for 3–4 h. The small portion of the gonad was placed in an embedded steel box, and clean melted wax was added. The box was placed on a cooling platform, and the wax was allowed to solidify. Samples were taken from the embedding box, cut to a thickness of 5–7 µm with a microtome and then placed in a warm water bath of approximately 45 °C. The tissue sections were then lifted from the water with a slide. The sections were stained with hematoxylin, eosin, and a mounting medium, and coverslips were placed on the tissue for stage observation under a microscope. The histological observations of the blue mackerel oocytes were modified from those of Ward et al. [11] and Hunter and Macewicz [9]. The characteristics of ovaries for each macroscopic and microscopic stage (I–V) were presented in Table 1.
2.3. Fecundity and BF Estimation
Fecundity and BF were estimated using the gravimetric method [13]. Fecundity was determined by counting the vitellogenic oocytes (mature) in the ovary, which were set to 0.5–0.7 mm in diameter. Fecundity and BF were estimated for each mature fish by weighing a 0.05-g subsample of the ovary. This procedure assumed no significant differences in vitellogenic and hydrated oocyte distribution between the two lobes of the ovaries [7,14]. Total fecundity (F) was estimated using the following equation:
where GW is the gonad weight; 0.05 is the weight of the sub sample.
F = (GW/0.05) ∗ total eggs and subsample
2.4. Spawning Frequency Estimation
Spawning frequency is the average number of days in one spawning event. Spawning frequency estimation was based on the monthly proportion of captured mature fish. Spawning frequency derived from the spawning fraction could be determined from three measurements of the mature gonad (hydrated eggs, Day 0 POFs, and Day 1+ POFs) [7]. To estimate the spawning frequency, the presence and degradation of POFs must be measured. The POFs could be identified in the ovaries 1–2 days after spawning. The age of the POFs was designated as Day 0 or Day 1+, in accordance with the procedure of Rogers et al. [7] and Ward et al. [11] for S. australasicus and that of Hunter and Goldberg [10] for northern anchovy. Hydrated eggs were assumed to have been spawned within 12 h after sampling, while Day 0 POFs were assumed to have developed on the day the fish were sampled (within 12–24 h). Day 1+ POFs were assumed to have formed 1–2 days before sampling. Estimates of spawning frequency were calculated using the following three measurements: (a) hydrated oocytes (Day 0) and Day 0 POFs, (b) Day 1+ POFs, and (c) all stages combined. Spawning fraction was then calculated from the average of the sample means weighted by sample numbers [7].
where ni was the number of individuals in each sample, N was the total number collected in all samples, and S was the mean spawning fraction (Si). The spawning fraction of each sample was calculated using the following equation:
where Day 0 POF and Day 1 POF were the number of samples with Day 0 POFs and Day 1+ POFs, respectively, and ni was the total number of female fish within a sample. The numerator was divided by 2, if two stages were used. The spawning frequency was estimated using the reciprocals of the estimates of the spawning fraction [7,17].
2.5. Size at 50% Maturity
The size at which 50% of blue mackerel reach sexual maturity (L50%) was calculated by plotting the percentage of mature fish by their length class with 3-cm intervals. The logistic curve formula is as follows:
where Y was the maturation ratio, x was the FL (cm), and a and b were constants [18].
3. Results
3.1. Sample Collection
A total of 519 mature female blue mackerel from the ECS were collected from Nan-Fang-Ao fishing port in Yilan County during spawning season from 2017 to 2019. The gonads of each fish were removed for histological observation. From the samples, 304 and 43 gonads were used to estimate fecundity (stages III and IV) and BF (hydrated eggs), respectively (Table 2).
3.2. Spawning Season by GSI Observation
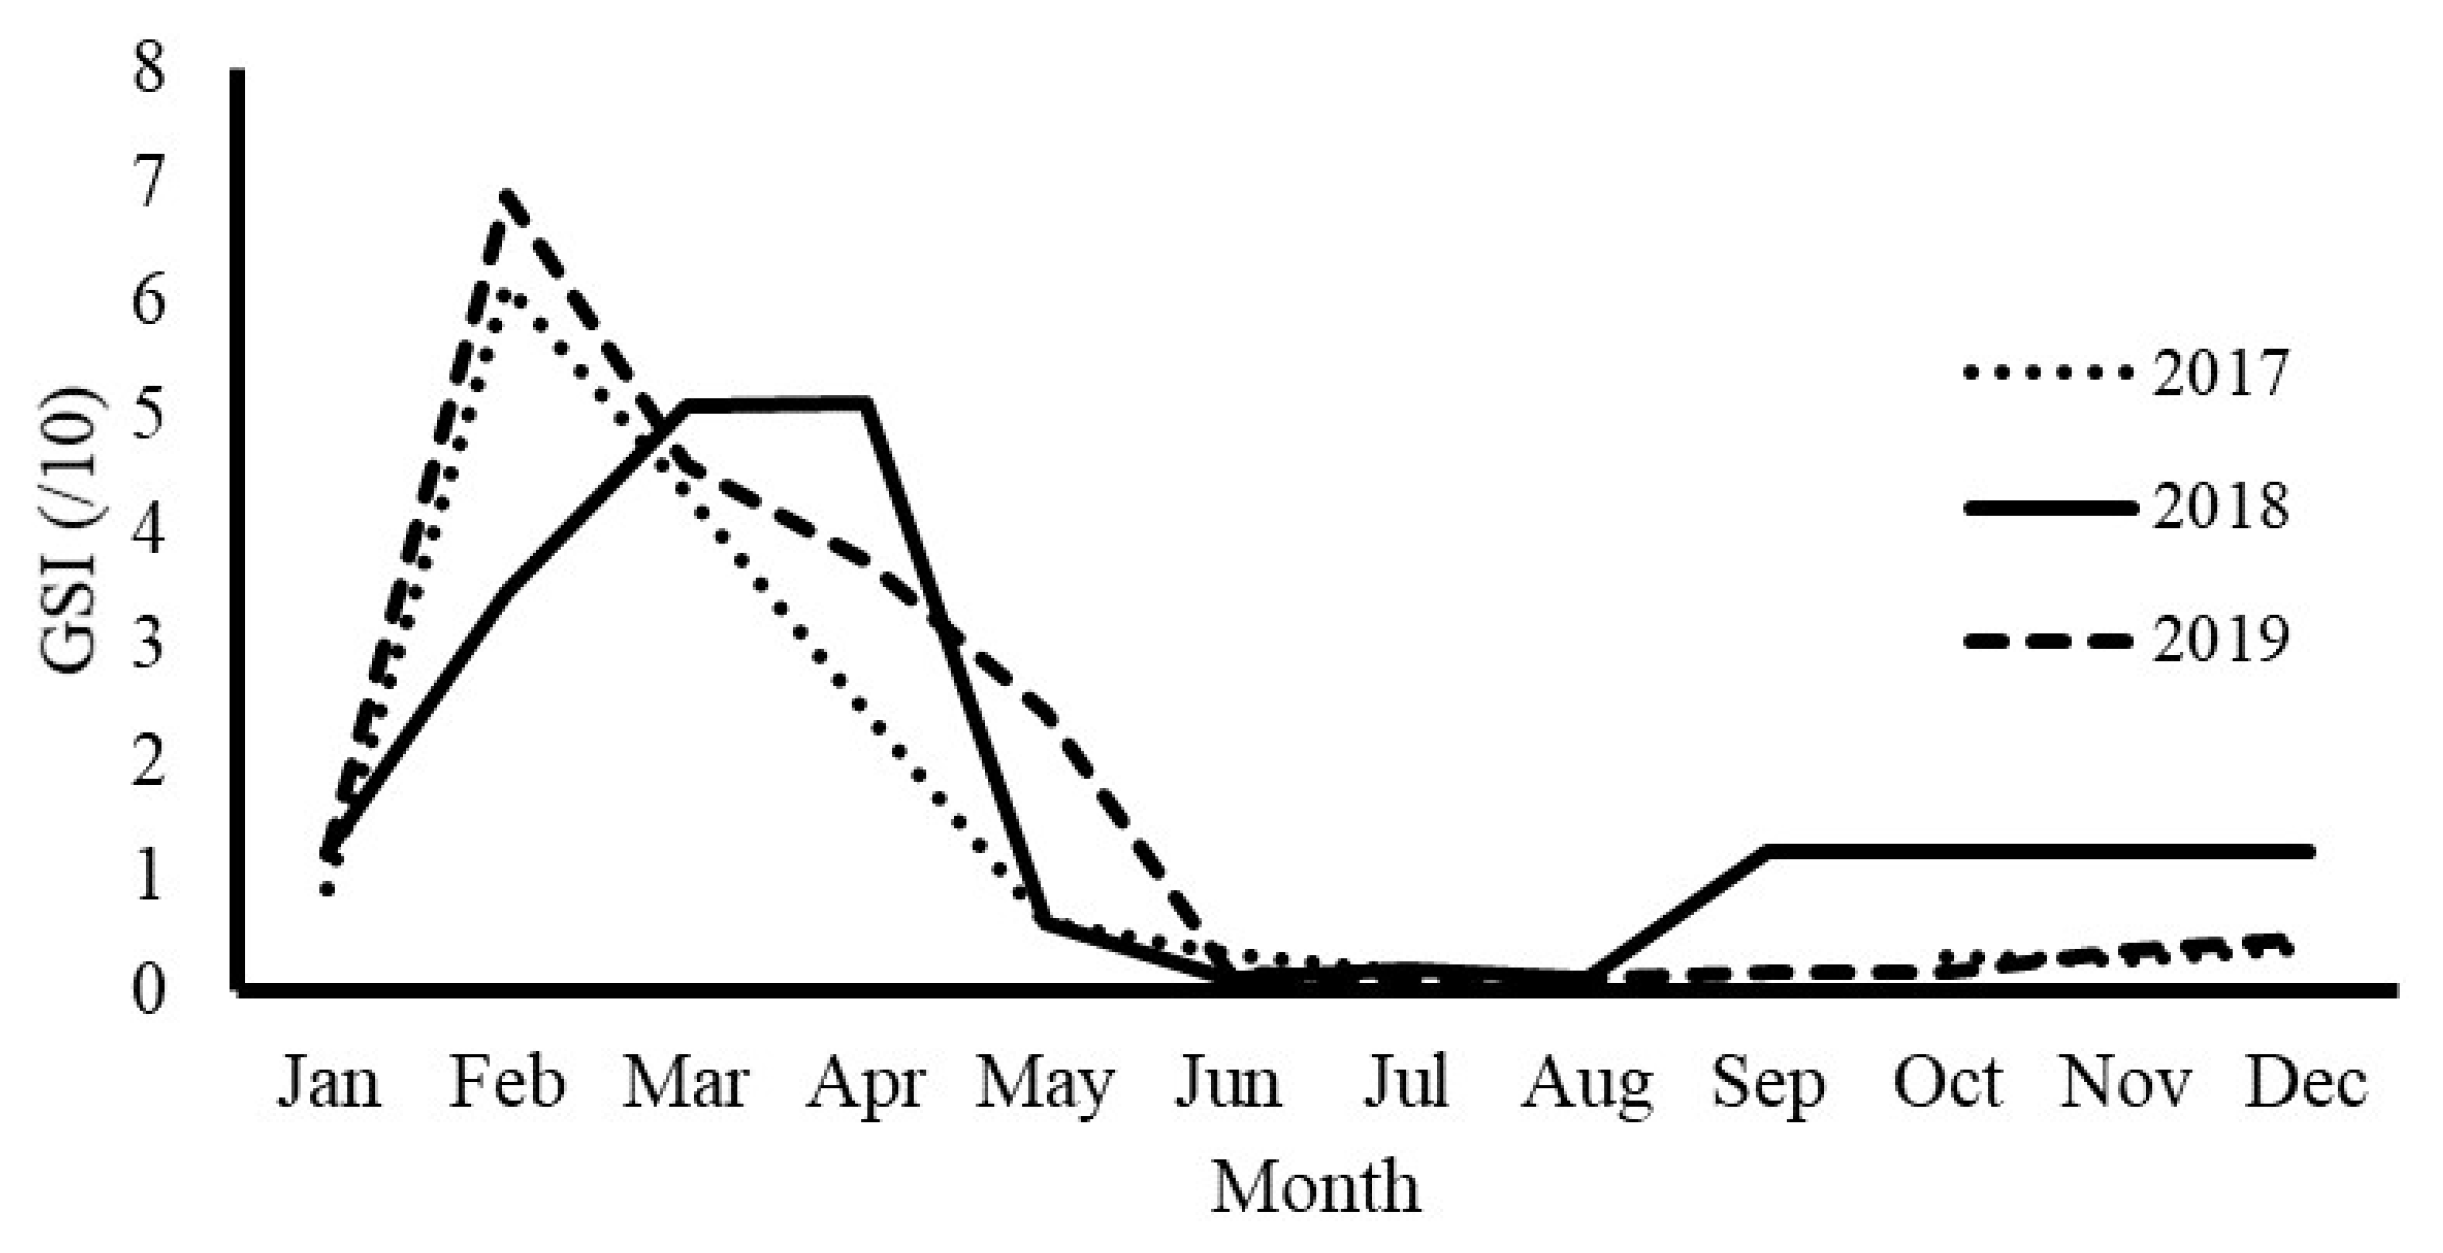
The GSI could be observed to determine the spawning season. The GSI increased gradually from January, reaching a maximum in March and April. The GSI then decreased, reaching a minimum in May and June. The peak GSI for female fish indicated the predominance of stages III and IV in February, March, and April, determined through histological section observation. According to the GSI data, the blue mackerel spawning season was from February to May, or from late winter to early summer. However, this period differed each year. In 2017, the GSI increased from January and sharply decreased in May. In 2018, the GSI slowly increased from January and remained high for several months; the same result was observed in 2019. In these years, the GSI was high until May (Figure 3).
3.3. Observation of Oocyte Development
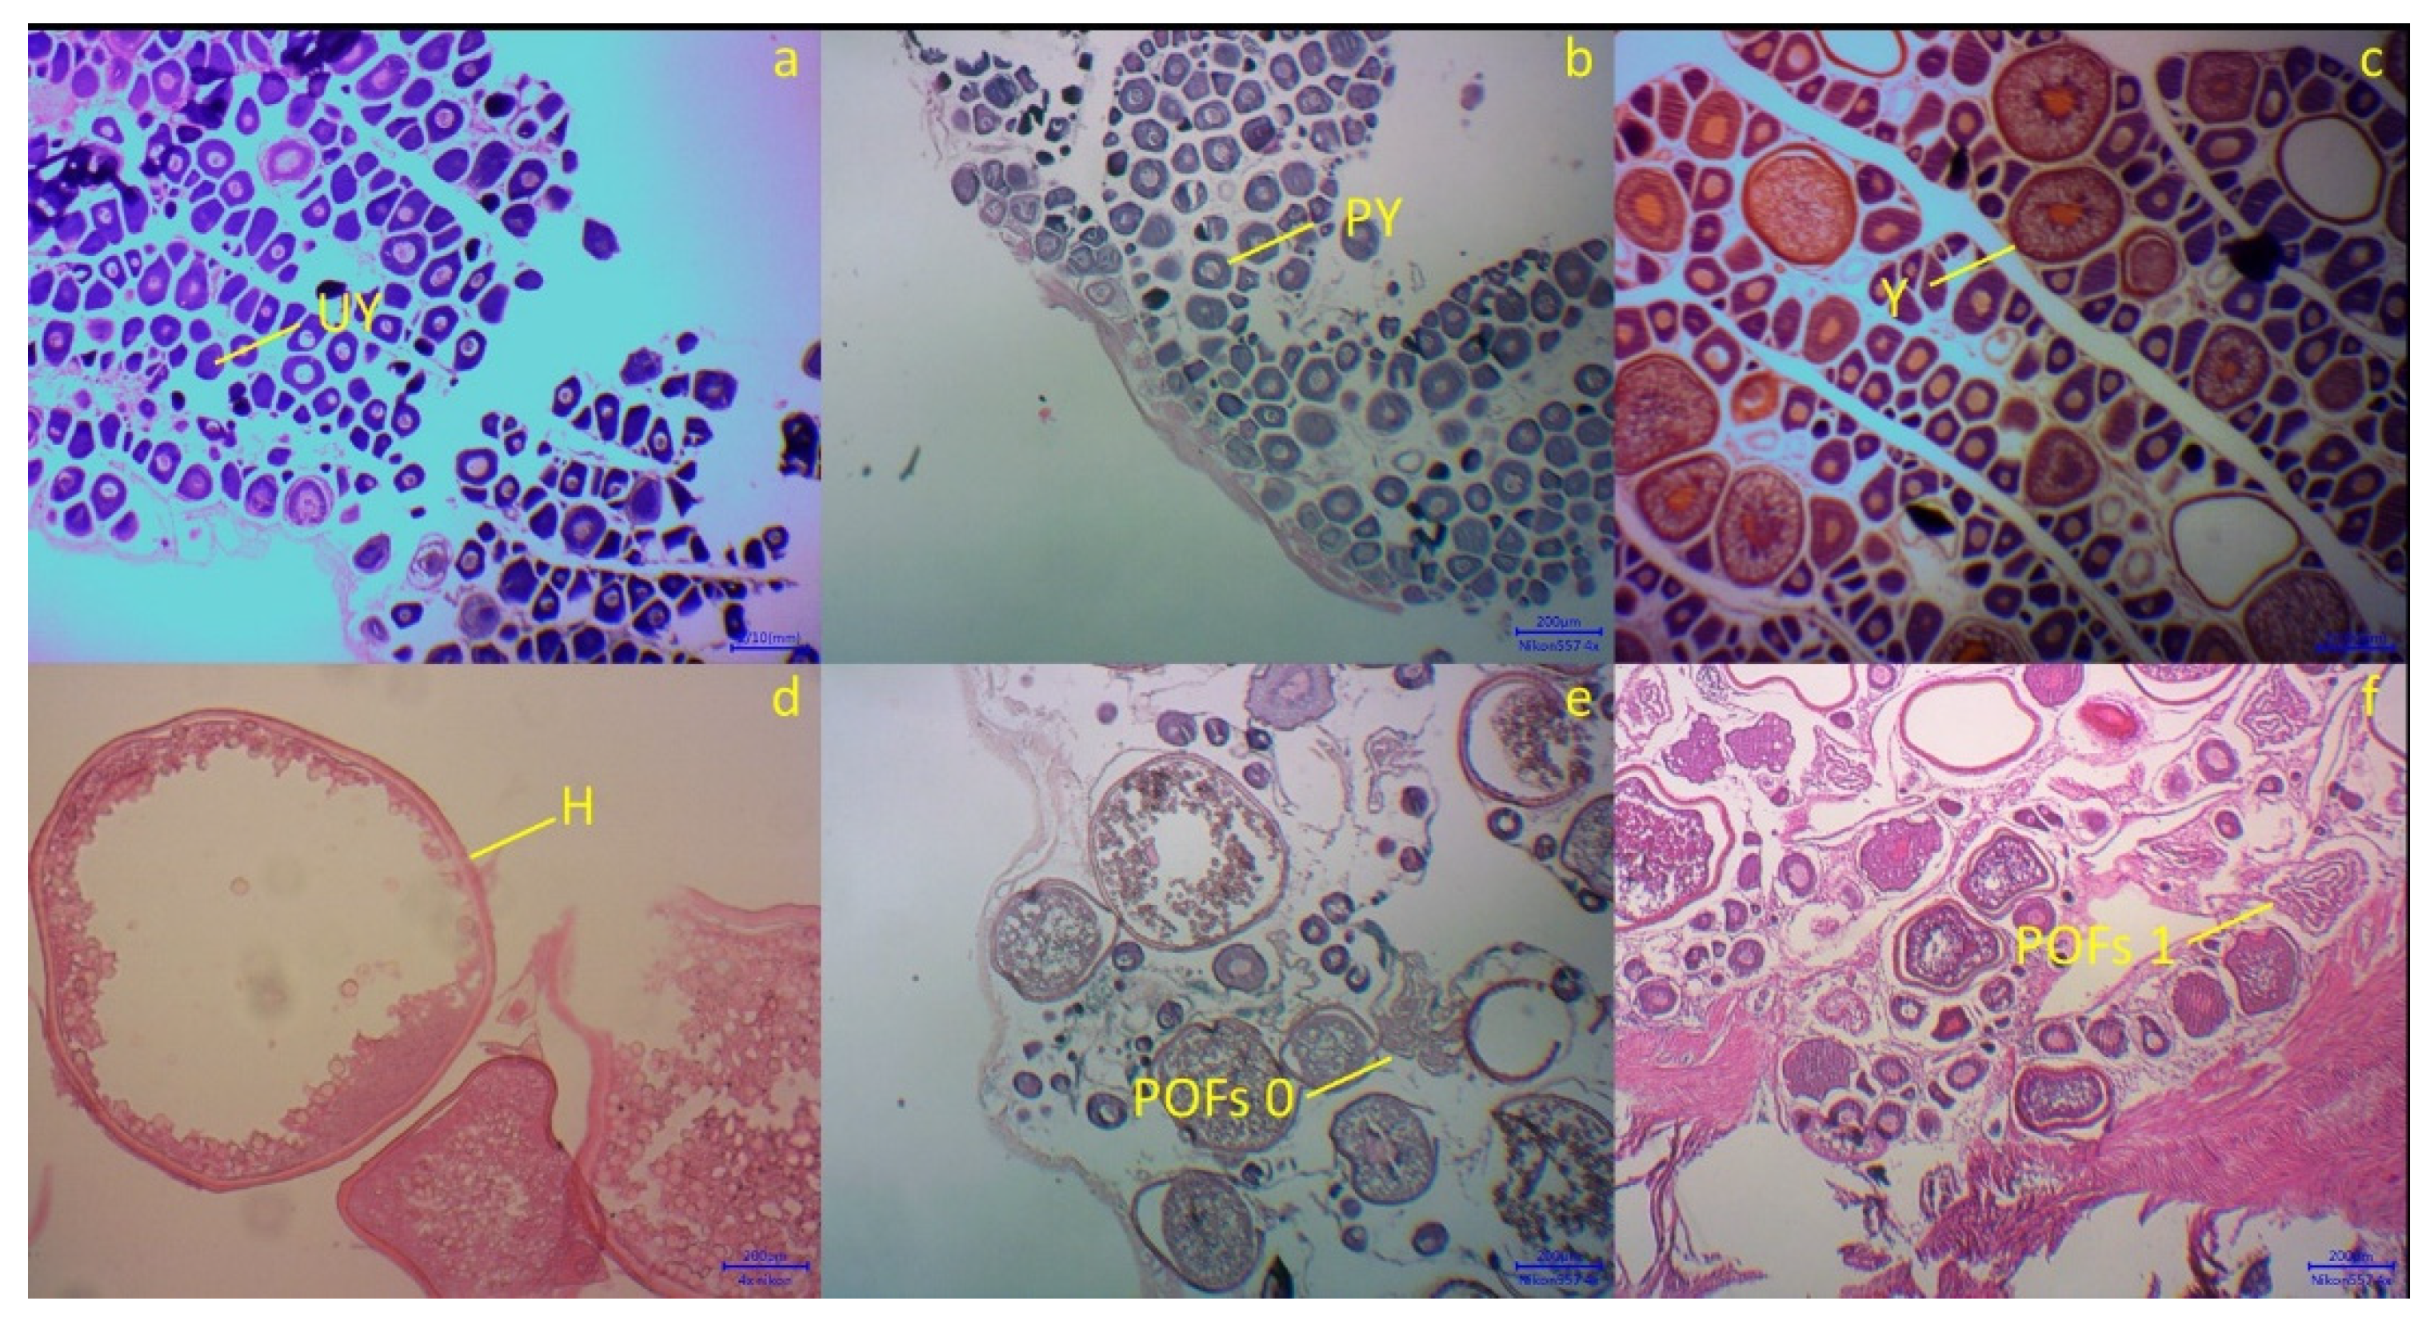
Figure 4a–e presented the microscopic stages of oocyte development: (a) Immature (stage I), ovary with unyolked (UY) and small oocytes; (b) Maturing/partially yolked (PY), the oocytes had a large nucleus; (c) Mature (yolked)/vitellogenic oocytes, yolk formation in oocytes; (d) Hydrated oocytes (H) (stage IV), showed the biggest diameter of oocytes and the GSI value sharply increased; (e) Spent, atretic (stage V), some oocytes hatched to the environment, known by existing of POFs (day 0 and day 1), unyolked, partially yolked and yolked oocytes co-existing with POFs.
3.4. Total Fecundity and BF
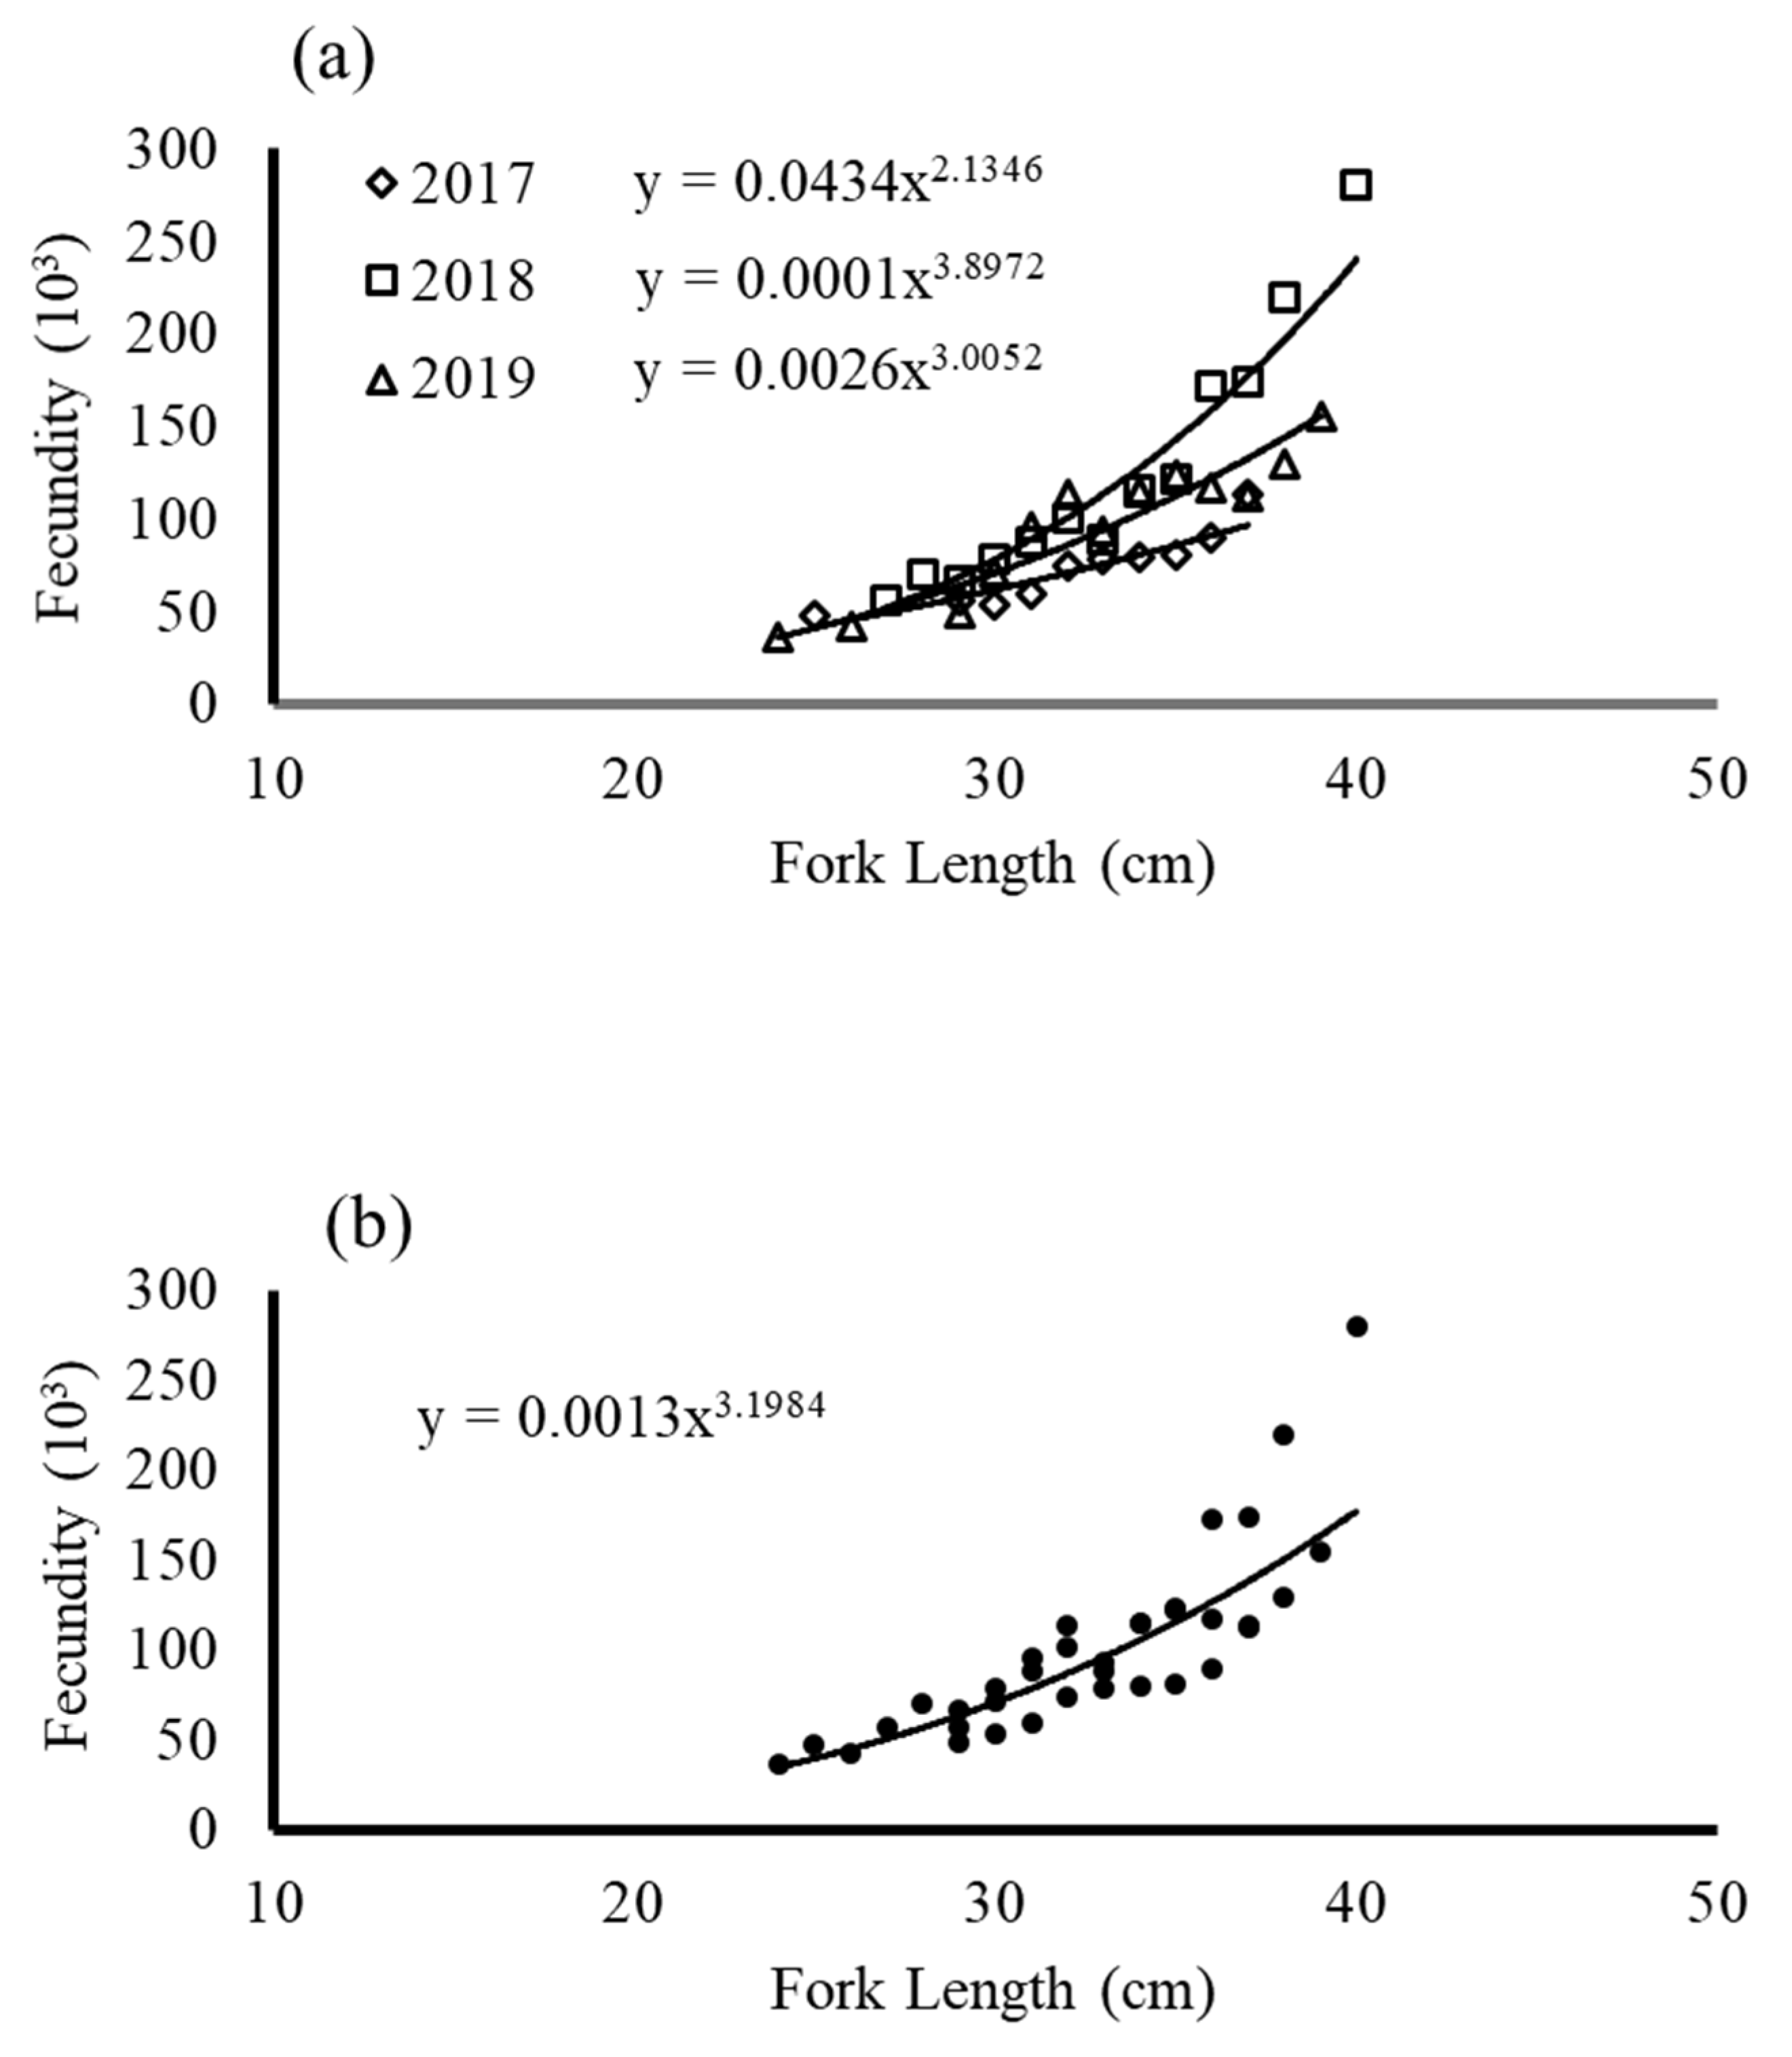
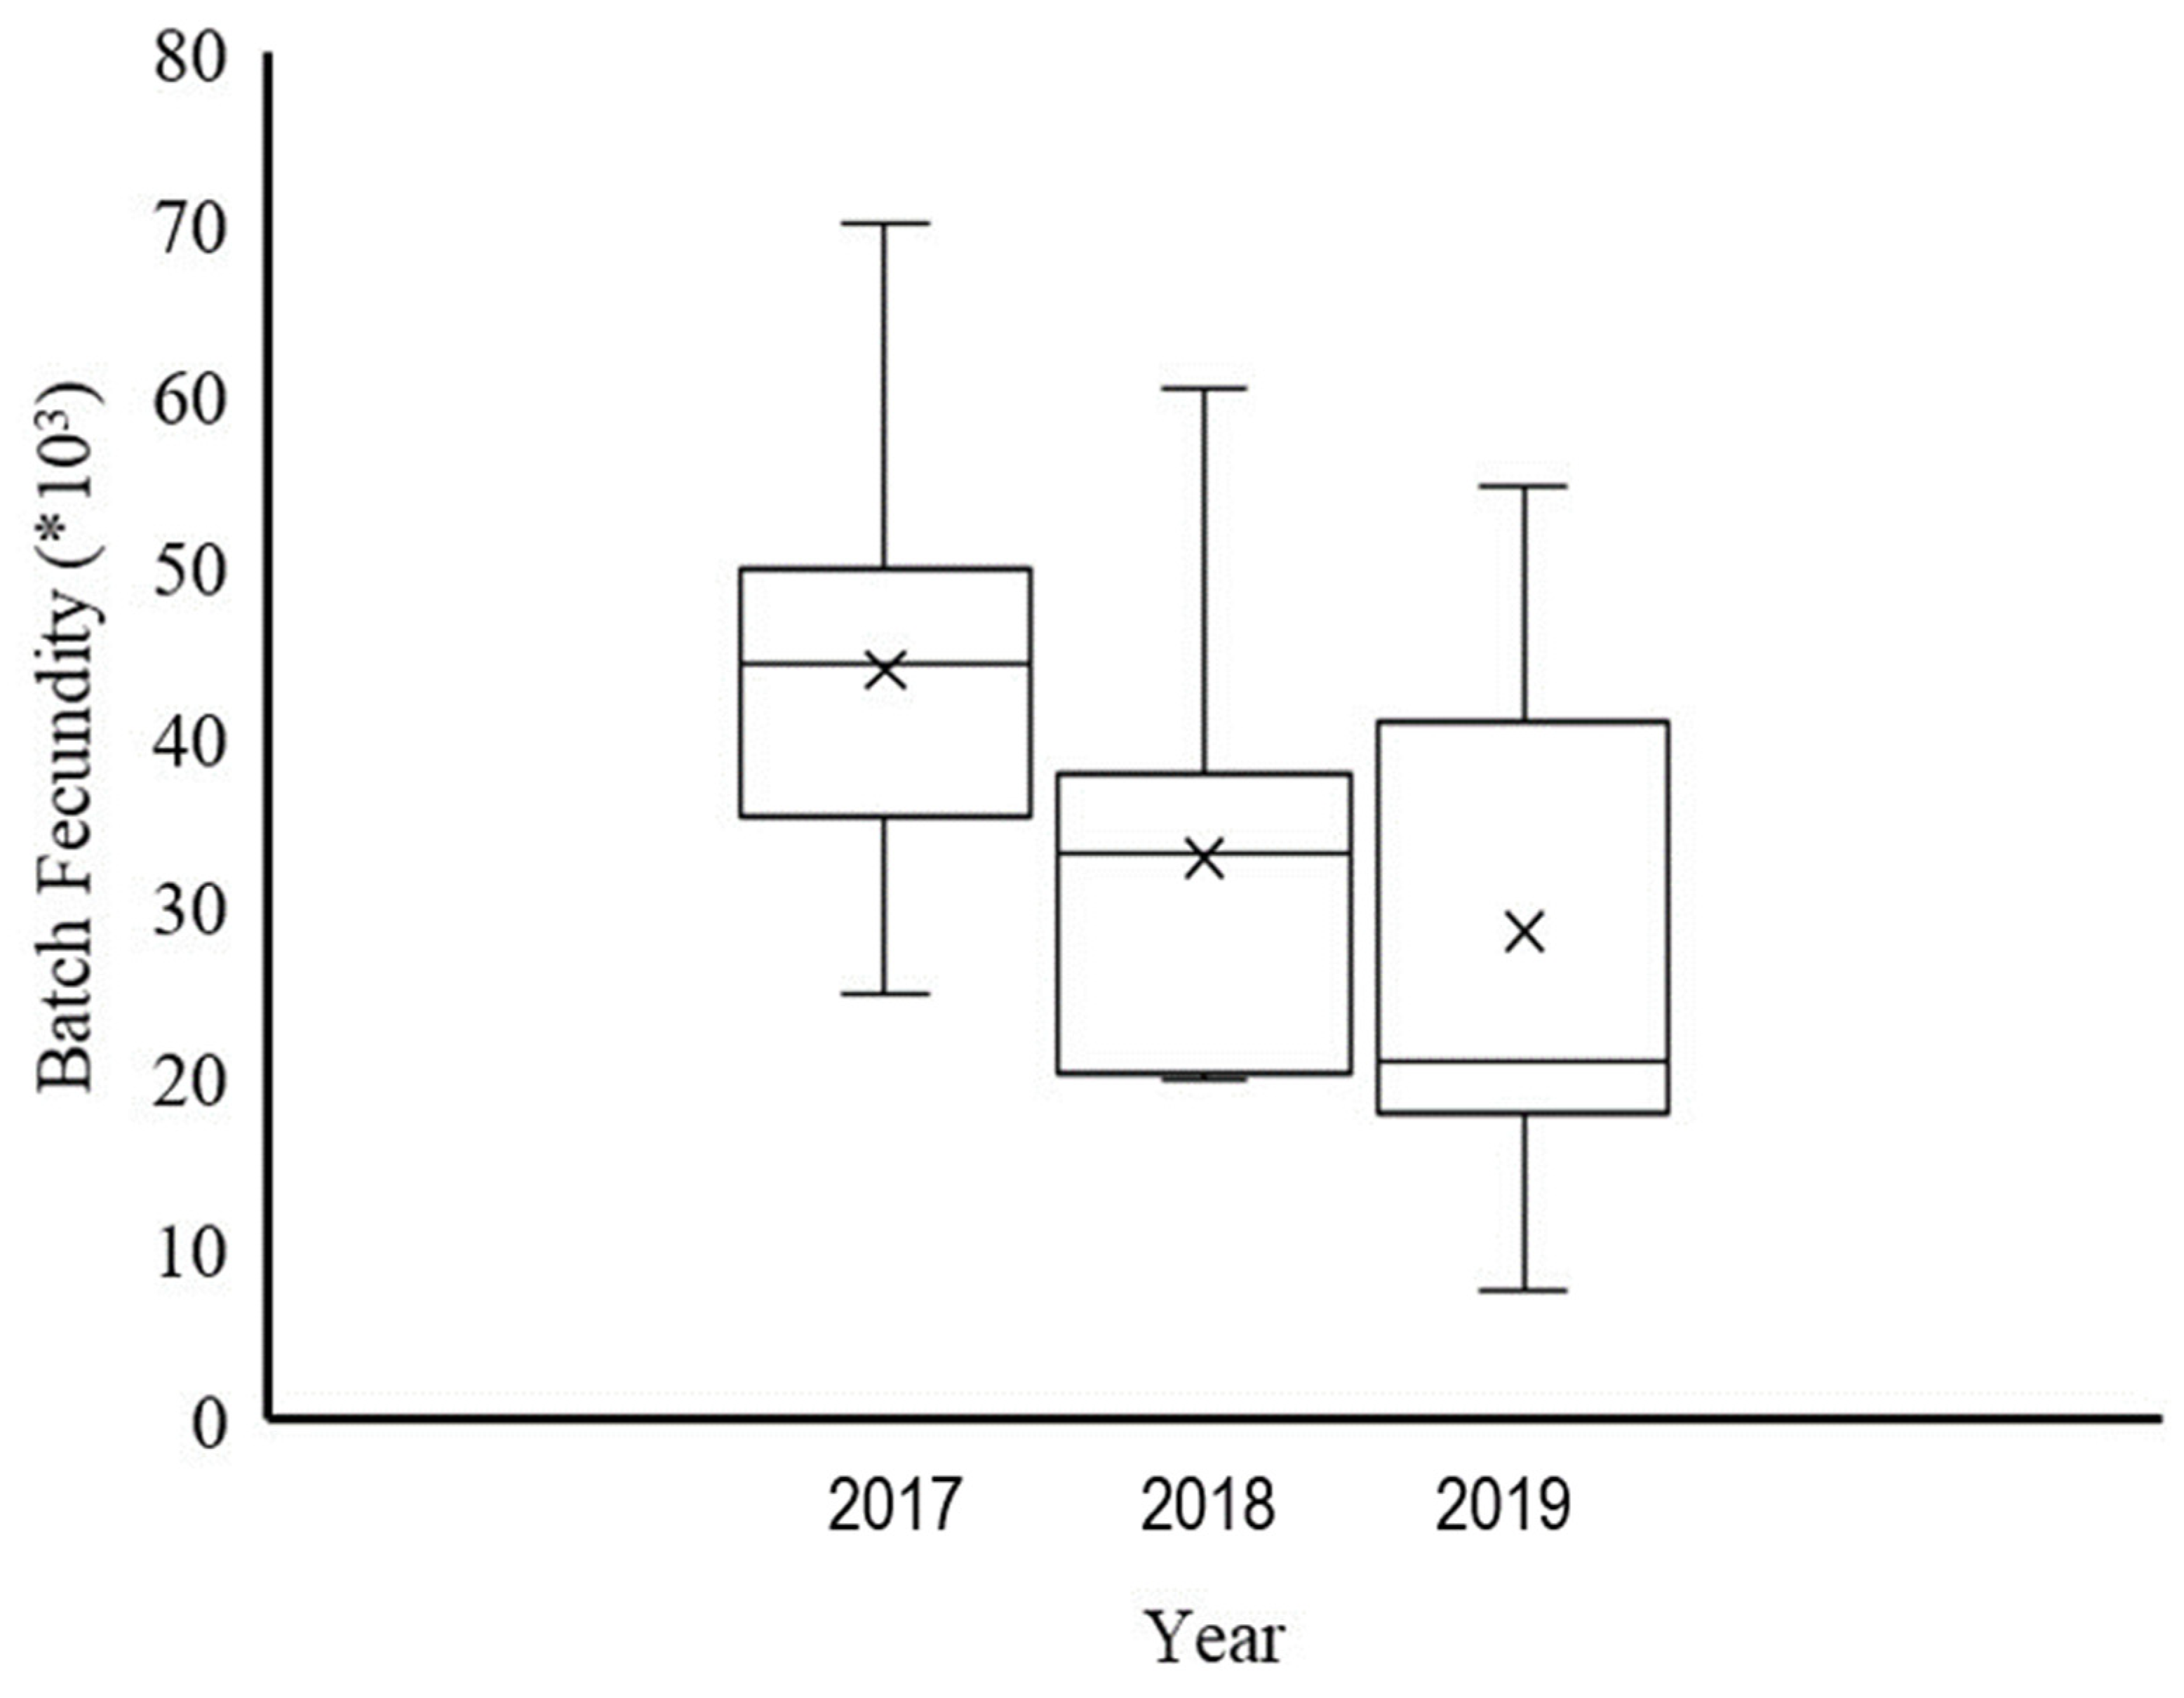
The mean total fecundity of the total samples was 76,623 oocytes (n= 112) in 2017, 108,104 oocytes (n = 113) in 2018, and 103,068 oocytes (n = 79) in 2019. Figure 5 presented the estimates of the mean total fecundity and the group length relationship; an allometric positive relationship was observed. BF, estimated by counting hydrated eggs and mean BF in oocytes (per ovary-free weight), was 43,924 (130) in 2017, 32,949 (96) in 2018, and 26,827 (68) in 2019. Figure 6 presented mean BF as box plots. The results revealed that the mean BF in 2017 was greater than the mean of the other 2 years.
3.5. Spawning Fraction and Spawning Frequency
Spawning fractions were estimated based on the results of the histological section. A total of 204, 203, and 112 tissue sections in 2017, 2018, and 2019, respectively, were used to observe the spawning fraction. Of the histological tissue sections, 48 had Day 0 POFs, 49 had Day 1+ POFs, and 72 had hydrated oocytes (Table 3). The estimated mean spawning fractions in 2017, 2018, and 2019 were 0.13, 0.05, and 0.09, respectively, and the mean spawning fraction of the 3 years was 0.10. Estimated spawning frequency (batch interval) in each month of each year was 3–10 days in 2017, 4–14 days in 2018, and 4–12 days in 2019. The spawning frequencies calculated using the three methods, namely the sums of (a) hydrated and Day 0 POFs, (b) Day 1+, and (c) all data combined, were 8, 10, and 9 days, respectively.
3.6. Size at 50% Maturity
4. Discussion
4.1. Spawning Mode
Most of the sampled fish were mature or active in reproduction. Monthly observations of gonadal tissue sections revealed that fewer than 10% of the samples had yolked oocytes in January. However, in the following months (February–April) more than 85% of the samples were ripe (yolked-hydrated), and gonads in multiple development stages (partially spent, ripe, and immature) were observed in May. This spawning mode indicated that the blue mackerel sheds eggs more than once during a spawning season. Thus, the reproductive cycle of the blue mackerel had multiple spawners and an indeterminate number of oocytes. The gonadal development observations indicated that the spawning season was from January to May. However, in 2019, the GSI remained high until June. According to Yukami et al. [19], the spawning season in the ECS occurred between February and June. Two factors may have affected the determination of the blue mackerel spawning time in this study. First, water temperature affected the spawning period and may have further affected the range of the spawning season. Hiyama et al. [20] reported that the success of spawning was inversely correlated to water temperature. In the ECS, mature blue mackerel could be found in regions with sea surface temperatures (SST) of 17–25 °C [19]. Another study reported that >80% of chub mackerel were caught in areas with SSTs of 14.72–25.72 °C [21]. Second, fishing locations may not have covered the entire spawning ground of the blue mackerel. Studies have indicated that the blue mackerel have two spawning grounds: one in the southern part of the ECS [19] and the other in the coastal area of Yilan Bay (Figure 2). However, no study has identified differences between these two locations. In this study, samples were collected randomly from these two areas during the spawning season. In April 2017, no mature samples were observed, as determined through GSI observation, which sharply decreased. However, observations of fishing activity revealed that in April 2017, no fishing locations were in the spawning ground, whereas in 2018 and 2019, samples were mostly collected from the coastal waters of Yilan Bay. The restricted fishing areas and low number of collected samples may have affected the number of mature samples or spawners collected [22].
4.2. Fecundity and BF
Fecundity was estimated by counting standing stocks of yolked oocytes (stage III). The total fecundity was calculated as the potential number of eggs released per batch spawned. The results for total fecundity indicated a significant correlation between total fecundity and fish length (Figure 6); that is, larger fish produced more eggs, and smaller fish produced fewer eggs. The 2017 results indicated higher potential egg production, as evidenced by the BF exceeding 50% of total fecundity. The resorption of oocytes in gonads was assumed to be lower. According to Morse [23], resorption of oocytes could reduce the number of eggs spawned. Thus, in 2018 and 2019, total fecundity was higher, but BF was lower. Notably, ripe eggs were not included in the batches that did not fully resorb, but these eggs may be released in upcoming batches, affecting the range of spawning season. The GSI in 2017 sharply decreased from the peak and reached a minimum earlier, whereas in 2018 and 2019, the GSI reached a maximum in several months, and a high GSI was observed through June. We assumed that reproduction in 2017 was more active and faster than it was in 2018 and 2019, which had lower BF but extended spawning seasons. This phenomenon is not well understood and requires further investigation. Pressure from environmental factors such as food availability and oceanographic conditions may have caused this result. According to Kjesbu et al. [24], female fish in better health had both higher fecundity and higher BF. Rogers et al. [7] reported a BF (134 oocytes per gram ovary weight) in southern Australia with female fish of up to 42.2 cm FL; this fecundity was higher than that observed in this study. Thus, the size of female fish may be related to variation in BF. These results suggested that the differences in BF estimation were reasonable due to the differences in species size.
4.3. Spawning Frequency
Table 4 presented monthly percentages of the blue mackerel spawn in the ECS from 2017 to 2019. A high percentage of female fish spawned each month indicating the peak of spawning activity. The percentage of female fish that spawned in February, March, and April 2017 was 31.7%, 27.1%, and 32.5%, respectively. No indication of spawning was observed in May; thus, blue mackerel were assumed to be in an inactive phase of reproduction (rest phase). The results for 2018 differed slightly; the percentage of female fish that spawned from January (10%) to April (15%) was low. In 2019, the percentage of female fish that spawned was low from January (15%) to June. The yearly averages indicated that the spawn in 2017 was higher and more concentrated at the spawning peak. In a study of S. japonicus from Japan, the female spawn was highest in late May (30.6%) and June (33.3%), but was less than 10% in both April and mid-May [25]. A similar study from Japan revealed that 47% of female fish were spawning in May and June [26]. Another study on S. japonicus from the Tsushima Current subpopulation revealed that 16.9% of female fish spawned per day [27]. These results indicated that the high average monthly percentage of female fish that spawned was possibly related to the high GSI concentration during the spawning season and the analysis method. Sample collection methods should cover all possible spawning grounds to obtain accurate percentages of female fish that spawned.
The spawning frequency (batch interval) of spawners in 2017 was lower, and spawning finished earlier, as indicated by the minimum GSI in May. In 2018 and 2019, the spawning season began earlier, in January, and finished in June. The mean spawning fraction was 0.10, and spawning frequency, that is, the sums of (a) hydrated and Day 0 POFs (b) Day 1+ POFs, and (c) all data combined, was 8, 10, and 9 days, respectively. This result was similar to the results of Roger et al. [7], revealing a spawning fraction of 0.14 and spawning frequencies of 6, 7, and 8 days on the basis of the three methods. Our histological classifications of POFs followed the methodology of Roger et al. [7]. A study by Fitzhugh [17] on king mackerel in US waters reported that the mean spawning fraction was 0.07, with high spawning frequencies of 2.9 to 4.5 days. However, the methods used differed from those of this study, which included the time for sample collection. Thus, sample collection should be performed continuously, since POF signs in the ovaries appear relatively briefly before progression to subsequent development stages (atretic). According to Hsiao [4], the spawning peak of blue mackerel was longer, lasting until June, before the late increase in water temperature. The effects of water temperature on the spawning of blue mackerel (spawning ground characteristics) must be identified to compare the results of this study with those of others. In this study, the daily temperature at the fishing location was 23–26.6 °C during the spawning season from January to May 2017. The spawners in 2017 were assumed to have adapted to that water temperature and have spawned normally. In 2018 and 2019, the SST sharply increased from 21 °C in January to 24–27.8 °C between February and May; this increase may have caused to the spawners to release fewer eggs. Dickerson et al. [28] reported that the POFs of S. japonicus found in waters of 20 °C degenerated in 24 h. However, further investigation of environmental factors and spatial spawning are required.
4.4. Sample Size
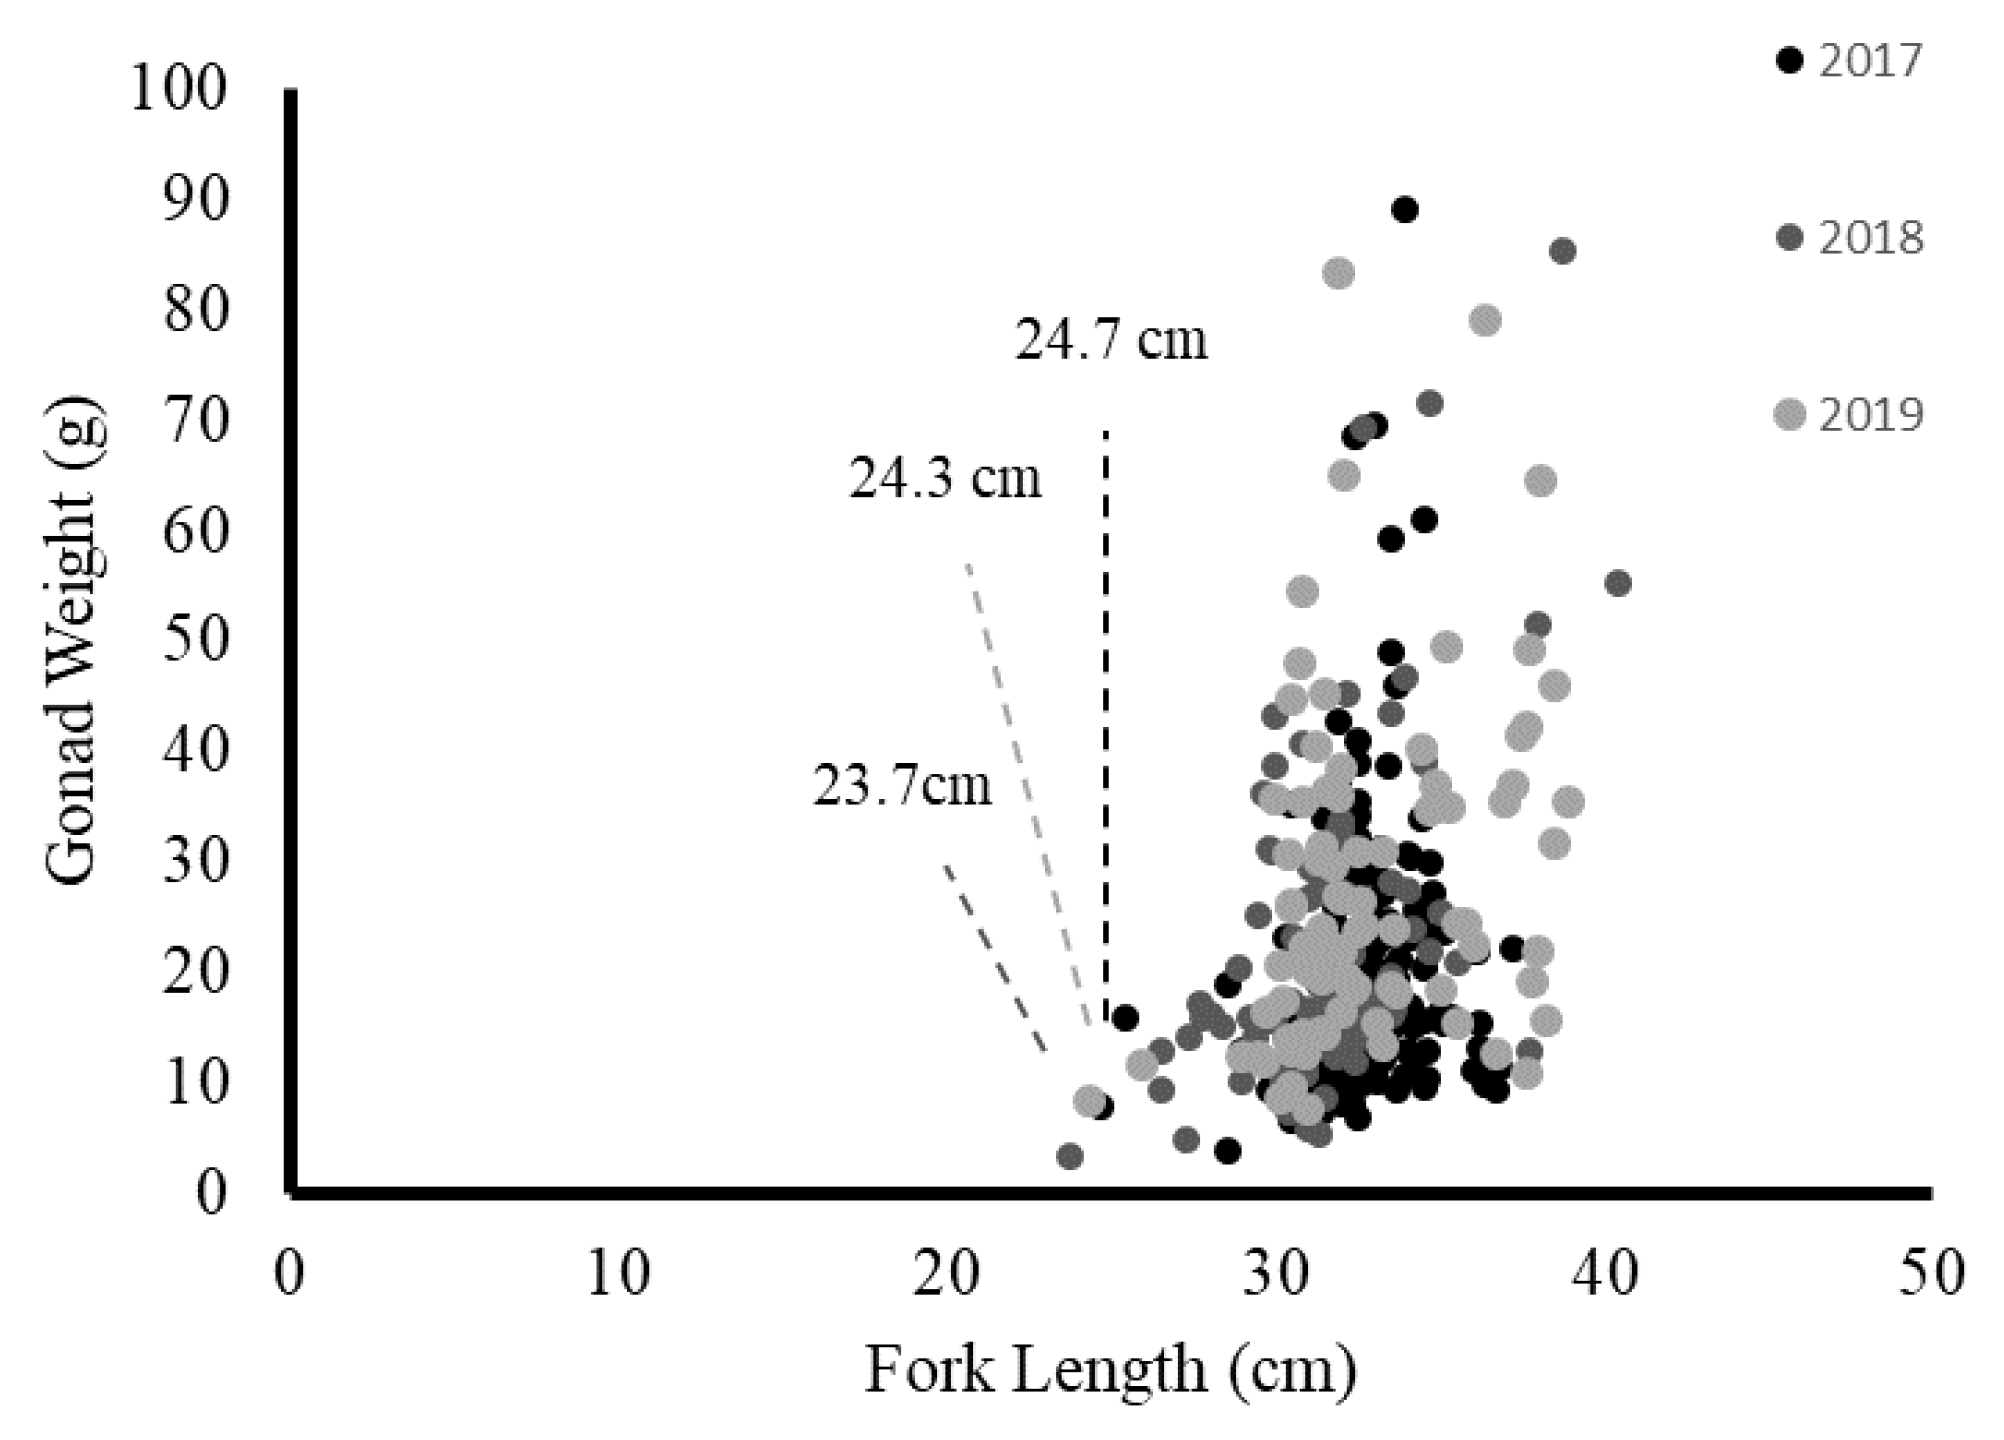
In this study, the mature blue mackerel sampled from Yilan were 23.7–39.3 cm (FL). Due to the lack of published studies on blue mackerel in northern Taiwan, the results of this study had limited comparisons. However, an unpublished report in Taiwan by Hsiao [4] indicated that the minimum mature size of blue mackerel in 2011 was 24.7 cm; this size was similar to the minimum mature size of 23.7 cm observed from 2017 to 2019 in this study. However, the 50% maturity size in this study (31.54 cm) was higher than that observed in Hsiao [4] (28 cm). Thus, the estimated blue mackerel size at sexual maturity in the ECS has substantially changed over time. The minimum size of southern Australian female blue mackerel with mature gonads was 23.6 cm, and the size at 50% maturity was 28.7 cm [7]. Yukami et al. [19] observed that all blue mackerel with a size of >31 cm were mature. This result differed slightly from the results of this study. However, the samples were collected from the eastern part of the ECS near Kyushu, Japan; this area contained the same stock of blue mackerel, but with a different spawning ground.
5. Conclusions
This biological reproduction study examined samples of blue mackerel gonads. Biological experiments, namely histological sections and egg counting, were used to determine the reproductive parameters. The observed size of the mature blue mackerel was greater than that reported in other studies. By observing the GSI, the blue mackerel from northeastern Taiwan were determined to spawn from January to May, peaking between February and April. This species is a multiple spawner, as evidenced from the histological section observations. The female blue mackerel has a high percentage of spawners, as indicated by the high GSI. The spawning frequency results indicated that 2017 had a low spawning frequency with high BF, whereas in 2018 and 2019, the spawning frequency and BF were higher. Strong interannual variation in spawning behavior was observed; this variation influenced the success of reproduction and recruitment of the stock. To determine the reasons for this annual variation, subsequent studies should analyze oceanographic data. These data could include the SST at each blue mackerel spawning ground sampling location in the ECS.
Author Contributions
Conceptualization: S.S. and H.-J.L.; methodology: S.S.; software: J.-R.L.; validation: H.-J.L. and J.-R.L. formal analysis: S.S.; investigation: H.-J.L.; resources: H.-J.L.; data curation: S.S.; writing—original draft preparation: S.S.; writing—review and editing: S.S. and H.-J.L.; supervision: H.-J.L. All authors have read and agreed to the published version of the manuscript.
Funding
This research was supported by the Fishery Agency, Council of Agriculture (110AS-6.1.2-FA-F1; 109 AS-9.2.3-FA-F1.
Institutional Review Board Statement
Not applicable.
Informed Consent Statement
Not applicable.
Acknowledgments
We thank all the valuable comments and suggestions from the reviewers and the editors. We sincerely thank all respondents for their participation in the project.
Conflicts of Interest
The authors declare no conflict of interest.
References
- FAO. The State of World Fisheries and Aquaculture 2018—Meeting the Sustainable Development Goals; FAO: Rome, Italy, 2018. [Google Scholar]
- Japan Statistic Yearbook. [Quantity of Catches of Marine Fisheries by Species]. 2018. Available online: https://www.stat.go.jp/english/data/nenkan/69nenkan/1431-08.html (accessed on 9 September 2021).
- Tzeng, T.D. Morphological variation between populations of spotted mackerel (Scomber australasicus) off Taiwan. Fish. Res. 2004, 68, 45–55. [Google Scholar] [CrossRef]
- Hsiao, Y.Y.; Lu, H.J. Changes in the Sizes-at-Maturity of Spotted Mackerel (Scomber australicus) under Fishing and Environmental Variations. Master’s Thesis, Department of Environmental Biology and Fisheries Science College of Ocean and Resource National Taiwan Ocean University, Keelung, Taiwan, 2011. [Google Scholar]
- Bernal, M.; Borchers, D.L.; Valdes, L.; de Lanzós, A.L.; Buckland, S.T. A new ageing method for eggs of fish species with daily spawning synchronicity. Can. J. Fish. Aquat. Sci. 2001, 58, 2330–2340. [Google Scholar] [CrossRef]
- Parker, K. A direct method for estimating northern anchovy, Engraulis mordax, spawning biomass. Fish Bull. 1980, 78, 541–544. [Google Scholar]
- Rogers, P.J.; Ward, T.M.; McLeay, L.J.; Lowry, M.; Saunders, R.J.; Williams, D. Reproductive biology of blue mackerel, Scomber australasicus, off southern and eastern Australia: Suitability of the Daily Egg Production Method for stock assessment. Mar. Freshw. Res. 2009, 60, 187–202. [Google Scholar] [CrossRef]
- Murua, H.; Kraus, G.; Saborido-Rey, F.; Witthames, P.R.; Thorsen, A.; Junquera, S. Procedures to estimate fecundity of marine fish species from field samples in relation to reproductive strategy. J. Northwest Atl. Fish. Sci. 2003, 33, 33–54. [Google Scholar] [CrossRef]
- Hunter, J.R.; Macewicz, B.J. Sexual maturity, batch fecundity, spawning frequency, and temporal pattern of spawning for the northern anchovy, Engraulis mordax, during the 1979 spawning season. CalCOFI Rep. 1980, 21, 139–149. [Google Scholar]
- Hunter, J.R.; Goldberg, S.R. Spawning incidence and batch fecundity in Northern Anchovy, Engraulis mordax. Collect. Repr. 1980, 77, 7964. [Google Scholar]
- Ward, T.M.; Rogers, P.J.; McLeay, L.J.; McGarvey, R. Evaluating the use of the daily egg production method for stock assessment of blue mackerel, Scomber australasicus. Mar. Freshw. Res. 2009, 60, 112–128. [Google Scholar] [CrossRef]
- Tzeng, T.D. Population structure and historical demography of the spotted mackerel (Scomber australasicus) off Taiwan inferred from mitochondrial control region sequencing. Zool. Stud. 2007, 46, 656. [Google Scholar]
- Bithy, K.; Miah, M.I.; Haque, M.S.; Hasan, K.R.; Islam, M.F. Estimation of the fecundity of Jat Puti, Puntius sophore (Hamilton). J. Environ. Sci. Nat. Resour. 2012, 5, 295–300. [Google Scholar] [CrossRef] [Green Version]
- Gonçalves, P.; Costa, A.M.; Murta, A.G. Estimates of batch fecundity and spawning fraction for the southern stock of horse mackerel (Trachurus trachurus) in ICES Division IXa. ICES J. Mar. Sci. 2009, 66, 617–622. [Google Scholar] [CrossRef]
- Hunter, J.R.; Lo, N.C.; Leong, R.J. Batch fecundity in multiple spawning fishes. NOAA Tech. Rep. NMFS 1985, 36, 67–77. [Google Scholar]
- Shiraishi, T.; Ohta, K.; Yamaguchi, A.; Yoda, M.; Chuda, H.; Matsuyama, M. Reproductive parameters of the chub mackerel Scomber japonicus estimated from human chorionic gonadotropin-induced final oocyte maturation and ovulation in captivity. Fish. Sci. 2005, 71, 531–542. [Google Scholar] [CrossRef]
- Fitzhugh, G.A.; Fioramonti, C.A.; Walling, W.I.; Gamby, M.I.; Lyon, H.O.; Devries, D.O.; Ortiz, M.A. Batch fecundity and an attempt to estimate spawning frequency of king mackerel (Scomberomorus cavalla) in US waters. 61st Gulf and Caribbean Fisheries Institute. 2009, pp. 30–37. Available online: https://nsgl.gso.uri.edu/flsgp/flsgpw08001/data/papers/005.pdf (accessed on 9 September 2021).
- de Santana, H.S.; Cantarute Rodrigues, A.; Dei Tos, C. Patterns of reproduction and growth of the catfish Iheringichthys labrosus (Lütken, 1874) after a reservoir formation. J. Appl. Ichthyol. 2016, 32, 456–463. [Google Scholar] [CrossRef]
- Yukami, R.; Ohshimo, S.; Yoda, M.; Hiyama, Y. Estimation of the spawning grounds of chub mackerel Scomber japonicus and spotted mackerel Scomber australasicus in the East China Sea based on catch statistics and biometric data. Fish. Sci. 2009, 75, 167–174. [Google Scholar] [CrossRef]
- Hiyama, Y.; Yoda, M.; Ohshimo, S. Stock size fluctuations in chub mackerel (Scomber japonicus) in the East China Sea and the Japan/East Sea. Fish. Oceanogr. 2002, 11, 347–353. [Google Scholar] [CrossRef]
- Lee, D.; Son, S.; Kim, W.; Park, J.M.; Joo, H.; Lee, S.H. Spatio-temporal variability of the habitat suitability index for Chub Mackerel (Scomber japonicus) in the East/Japan sea and the South sea of South Korea. Remote Sens. 2018, 10, 938. [Google Scholar] [CrossRef] [Green Version]
- Yoda, M.; Shiraishi, T.; Yukami, R.; Ohshimo, S. Age and maturation of jack mackerel Trachurus japonicus in the East China Sea. Fish. Sci. 2014, 80, 61–68. [Google Scholar] [CrossRef]
- Morse, W.W. Spawning and fecundity of Atlantic mackerel, Scomber scombrus, in the Middle Atlantic Bight. Fish. Bull. 1980, 78, 103–108. [Google Scholar]
- Kjesbu, O.S.; Klungsøyr, J.; Kryvi, H.; Witthames, P.R.; Walker, M.G. Fecundity, atresia, and egg size of captive Atlantic cod (Gadus morhua) in relation to proximate body composition. Can. J. Fish. Aquat. Sci. 1991, 48, 2333–2343. [Google Scholar] [CrossRef]
- Yamada, T.; Aoki, I.; Mitani, I. Spawning time, spawning frequency and fecundity of Japanese chub mackerel, Scomber japonicus in the waters around the Izu Islands, Japan. Fish. Res. 1998, 38, 83–89. [Google Scholar] [CrossRef]
- Watanabe, C.; Hanai, T.; Meguro, K.; Ogino, R.; Kimura, R. Spawning biomass estimates of chub mackerel Scomber japonicus of Pacific subpopulation off central Japan by a daily egg production method. Nippon. Suisan Gakkaishi 1999, 65, 695–702. [Google Scholar] [CrossRef]
- Shiraishi, T.; Ketkar, S.D.; Katoh, Y.; Nyuji, M.; Yamaguchi, A.; Matsuyama, M. Spawning frequency of the Tsushima Current subpopulation of chub mackerel Scomber japonicus off Kyushu, Japan. Fish. Sci. 2009, 75, 649–655. [Google Scholar] [CrossRef]
- Dickerson, T.L.; Macewicz, B.J.; Hunter, J.R. Spawning frequency and batch fecundity of chub mackerel, Scomber japonicus, during 1985. CalCOFI Rep. 1992, 33, 130–140. [Google Scholar]
Figure 1.
The total catch of two types of offshore seiners indicating the replacement of fishing gear from the large purse seine (gray bar) to the Taiwanese seine (black bar).
Figure 1.
The total catch of two types of offshore seiners indicating the replacement of fishing gear from the large purse seine (gray bar) to the Taiwanese seine (black bar).

Figure 2.
The fishing grounds (dashed area) and sampling locations (symbols) of blue mackerel in the East China Sea and Nan-Fang-Ao fishing port (black star). Fishing was performed by fishermen during the spawning season from 2017 to 2019.
Figure 2.
The fishing grounds (dashed area) and sampling locations (symbols) of blue mackerel in the East China Sea and Nan-Fang-Ao fishing port (black star). Fishing was performed by fishermen during the spawning season from 2017 to 2019.

Figure 3.
Monthly fluctuation in the gonadosomatic index for blue mackerel in northeastern Taiwan from 2017 to 2019.
Figure 3.
Monthly fluctuation in the gonadosomatic index for blue mackerel in northeastern Taiwan from 2017 to 2019.

Figure 4.
Histological sections of blue mackerel ovaries revealing the microscopic characteristics of each stage (I–V): (a) Unyolked, Stage I; (b) Partially Yolked, Stage II; (c) Yolked, Stage III; (d) Hydrated, Stage IV; (e,f) Spent or POFs, Stage V.
Figure 4.
Histological sections of blue mackerel ovaries revealing the microscopic characteristics of each stage (I–V): (a) Unyolked, Stage I; (b) Partially Yolked, Stage II; (c) Yolked, Stage III; (d) Hydrated, Stage IV; (e,f) Spent or POFs, Stage V.

Figure 5.
Relationship of fecundity and fork length (a) each year and (b) three years combined.

Figure 6.
Box plots of batch fecundity by year. The centerline of each box represents the median, and the cross symbol indicates the mean of batch fecundity; minimum and maximum values are displayed.
Figure 6.
Box plots of batch fecundity by year. The centerline of each box represents the median, and the cross symbol indicates the mean of batch fecundity; minimum and maximum values are displayed.

Figure 7.
Length at maturity of blue mackerel in northern Taiwan: (a) 2017; (b) 2018; (c) 2019.

Figure 8.
Distribution of the size at sexual maturity for blue mackerel over 3 years.


Table 1.
Criteria for the assigned stages of gonads of Scomber australasicus from collected females ranged from I to V.
Table 1.
Criteria for the assigned stages of gonads of Scomber australasicus from collected females ranged from I to V.
| Stage | Classification | Characteristics |
|---|---|---|
| I | Immature/Unyolked | Thin ovaries with very small oocytes (diameter 0.1–0.2 mm); invisible nucleus. |
| II | Maturing/Partially Yolked | Oocytes more rounded than in stage I (diameter 0.3–0.4 mm); ovaries translucent pink color; microscopically oocytes have big nucleus. |
| III | Mature/Yolked | Oocytes larger than in stage II (diameter 0.5–0.7 mm); ovaries and oocytes yellow in color; microscopically big oocytes with small nucleus. |
| IV | Hydrated | This stage showed bigger oocytes (diameter 0.8 mm–1 cm); translucent/hydrated oocytes distributed with yolked oocytes. |
| V | Spent/Atretic | Small oocytes with a small proportion of each stage dominated by immature oocytes. In this stage, POFs (POFs 0 and POFs 1) will appear, indicating recent spawning. |
Table 2.
The sample number of blue mackerel for fecundity and batch fecundity estimation from 2017 to 2019.
Table 2.
The sample number of blue mackerel for fecundity and batch fecundity estimation from 2017 to 2019.
| 2017 | 2018 | 2019 | ||||
|---|---|---|---|---|---|---|
| Month | Fecundity | Batch Fecundity | Fecundity | Batch Fecundity | Fecundity | Batch Fecundity |
| Jan | 1 | 0 | 7 | 0 | 12 | 0 |
| Feb | 17 | 4 | 29 | 0 | 30 | 5 |
| Mar | 68 | 15 | 18 | 3 | 12 | 1 |
| Apr | 28 | 0 | 56 | 10 | 21 | 5 |
| May | 3 | 0 | 2 | 0 | 4 | 0 |
| Total | 112 | 19 | 113 | 13 | 79 | 11 |
Table 3.
Spawning fraction of blue mackerel obtained from matured samples collected during spawning season from 2017 to 2019. * (spawning fraction) ** (mean spawning fraction).
Table 3.
Spawning fraction of blue mackerel obtained from matured samples collected during spawning season from 2017 to 2019. * (spawning fraction) ** (mean spawning fraction).
| Year | Month | Sample Number | No. POF Day-0 | No. POF Day 1+ | No. Hydrated | Spawning Fraction |
|---|---|---|---|---|---|---|
| 2017 | Jan | 8 | 0 | 0 | 1 | 0 |
| Feb | 41 | 8 | 5 | 8 | 0.15 | |
| Mar | 107 | 18 | 11 | 15 | 0.13 | |
| Apr | 40 | 2 | 11 | 0 | 0.16 | |
| May | 8 | 0 | 0 | 0 | 0 | |
| Subtotal | 204 | 28 | 27 | 24 | 0.13 * | |
| 2018 | Jan | 22 | 2 | 0 | 2 | 0.04 |
| Feb | 67 | 3 | 4 | 6 | 0.05 | |
| Mar | 36 | 0 | 2 | 9 | 0.03 | |
| Apr | 73 | 6 | 5 | 13 | 0.08 | |
| May | 5 | 0 | 0 | 0 | 0 | |
| Subtotal | 203 | 11 | 11 | 30 | 0.05 * | |
| 2019 | Jan | 20 | 1 | 2 | 1 | 0.08 |
| Feb | 41 | 3 | 2 | 10 | 0.06 | |
| Mar | 18 | 2 | 3 | 2 | 0.13 | |
| Apr | 26 | 3 | 1 | 7 | 0.08 | |
| May | 7 | 0 | 3 | 2 | 0.2 | |
| Subtotal | 112 | 9 | 11 | 22 | 0.09 * | |
| Total | 519 | 0.10 ** | ||||
Table 4.
The monthly percentage of female blue mackerel that spawned during spawning season from 2017 to 2019.
Table 4.
The monthly percentage of female blue mackerel that spawned during spawning season from 2017 to 2019.
| Year | Months | Total Spawn Female | Total Number of Females | Monthly Spawning (%) |
|---|---|---|---|---|
| 2017 | Jan | 0 | 8 | - |
| Feb | 13 | 41 | 31.7 | |
| Mar | 29 | 107 | 27.1 | |
| Apr | 13 | 40 | 32.5 | |
| May | 0 | 8 | - | |
| 2018 | Jan | 2 | 22 | 10 |
| Feb | 5 | 67 | 7.5 | |
| Mar | 2 | 36 | 5.6 | |
| Apr | 11 | 73 | 15 | |
| May | 0 | 5 | - | |
| 2019 | Jan | 3 | 20 | 15 |
| Feb | 5 | 41 | 12.2 | |
| Mar | 5 | 18 | 27.8 | |
| Apr | 4 | 26 | 15.4 | |
| May | 2 | 7 | 28.6 |
Publisher’s Note: MDPI stays neutral with regard to jurisdictional claims in published maps and institutional affiliations. |
© 2021 by the authors. Licensee MDPI, Basel, Switzerland. This article is an open access article distributed under the terms and conditions of the Creative Commons Attribution (CC BY) license (https://creativecommons.org/licenses/by/4.0/).
Share and Cite
MDPI and ACS Style
Sinaga, S.; Lu, H.-J.; Lin, J.-R. Mackerel (Scomber australasicus) Reproduction in Northeastern Taiwan. J. Mar. Sci. Eng. 2021, 9, 1341. https://0-doi-org.brum.beds.ac.uk/10.3390/jmse9121341
AMA Style
Sinaga S, Lu H-J, Lin J-R. Mackerel (Scomber australasicus) Reproduction in Northeastern Taiwan. Journal of Marine Science and Engineering. 2021; 9(12):1341. https://0-doi-org.brum.beds.ac.uk/10.3390/jmse9121341
Chicago/Turabian StyleSinaga, Sunarti, Hsueh-Jung Lu, and Jia-Rong Lin. 2021. "Mackerel (Scomber australasicus) Reproduction in Northeastern Taiwan" Journal of Marine Science and Engineering 9, no. 12: 1341. https://0-doi-org.brum.beds.ac.uk/10.3390/jmse9121341
Note that from the first issue of 2016, this journal uses article numbers instead of page numbers. See further details here.