1. Introduction
Maritime transport is a complex socio-technical global system and many of the risks particular to sea transport are greater than those of the other three main modes of transport. Aside from basic environmental threats such as oil pollution, cruise ships, which carry up to 8000 people, represent the threat of extraordinary loss of life in large numbers at one time in one place; if this seems alarmist, one can find innumerable cases of passenger ferries capsizing with the result of great loss of life. The International Maritime Organization (IMO) has addressed the issue of accidents investigation and reporting in its regulations in the Casualty Investigation Code [
1]. This Code, in contrast to the earlier, outdated Resolution A.884(21) (Appendix 1) [
2], requires that an accident investigation be carried out for any “very serious marine casualty,” which is defined as an accident at sea resulting in the total loss of the ship or death or serious environmental damage. The European Maritime Safety Agency (EMSA) is also obliged by the European Union (EU) Directive 2009/18/EC [
3] Article 8 to establish the principles for accident investigation and each EU Member State should establish an independent and permanent accident investigation body. In Poland, the State Marine Accident Investigation Commission (PKBWM) is responsible for accident investigation and the present case study was investigated within the framework of the PKBWM [
4].
By definition, a maritime accident means an occurrence that involves a ship and in which a person is seriously harmed or the ship sustains damage or structural failure, while the marine incident means any occurrence, other than an accident, that is associated with the operation of a ship and affects or could affect the safety of operation [
5]. In other words, when a mishap causes damage it is considered an accident, and when it merely could have, it is considered an incident. Although there is a legal framework for marine casualty investigation, there is no mention of the models to be used. For the purpose of our research the following classification of event which changes operational state of ship into failure state are: near-miss, incident, accident. According to Stoop [
6], several questions are asked in the accident (or incident) investigation. What happened? How did it happen? Why did the accident happen? What can be done to prevent the accident from happening again? What can be done to minimize the consequences of such accidents? According to Awal and Hasegawa [
7], several studies, including Laflamme [
8], Quereshi [
9], and Khanzode et al. [
10], have attempted to classify an accident investigation model that should readily provide these answers as a first step, and marine casualty models, which can be classified into several groups from different points of view, attempt to answer these questions by various means [
11]:
Traditional linear models (Sequence models [
12], Heinrich’s [
13] domino model of accident causation, Bowtie models [
14], Reason’s [
15] Swiss Cheese model);
Nonlinear models (Epidemiological accident models [
16,
17], Complex socio-technical systems [
18]),
Systems Theory Approach like Functional Resonance Accident Method (FRAM), Systems Theory Approach (STAMP), SHEL (Software–Hardware–Environment–Liveware) [
12,
19,
20,
21].
This does not reflect a static or inflexible approach. For instance, Awal and Hasegawa [
22] use different categories of accident reconstruction and suggest:
It should come as no surprise—because accidents and incidents continue to occur—that new models are constantly being developed [
11,
22,
23]. Along these lines, it may be worth considering larger issues, such as the economic model that appears to require constant growth at a time when environmental concerns, no matter how serious they sound, are never serious enough to affect the workings of large businesses. The fact is, the changes forced on stakeholders in the maritime industry themselves create a danger, as the best safety measures available are generally outmoded in too short period of time. An element of this principle emerges in this case study, though primarily we are concerned with a particular type of incident that occurs all too often among ferry services. Taking into account the variety of models used for accident investigation, we propose some modifications based on the work of Rasmussen [
24,
25]. The slightly amended proposed model is based on a risk management framework that includes a socio-technical and legal environment. The practical results of these studies will make it possible to evaluate the causes of such unanticipated abnormalities as the problematic motion of the ferry “Bielik IV” (the subject of our case study) after the failure of the main propulsion and to develop recommendations for improving the safety of navigation of ferries of this type.
2. Material: Contextual, Technical, and Met-Ocean Facts
The ferry crossing in Swinoujscie is one of two ferries connecting the island of Usedom with the mainland of Poland. The intensity of ferry traffic is 65 per day in one direction. The ferry crossing is usually operated by two ferries of the Bielik type running simultaneously. The ferry owner Żegluga Świnoujska has 4 ferries of the Bielik type. These ferries are built to sustain all but the most catastrophic conditions to be reasonably expected in these waters, such that service is literally never interrupted. They can load 33 passenger cars and take onboard up to 700 passengers at one time. Clearly a ferry accident can have catastrophic consequences.
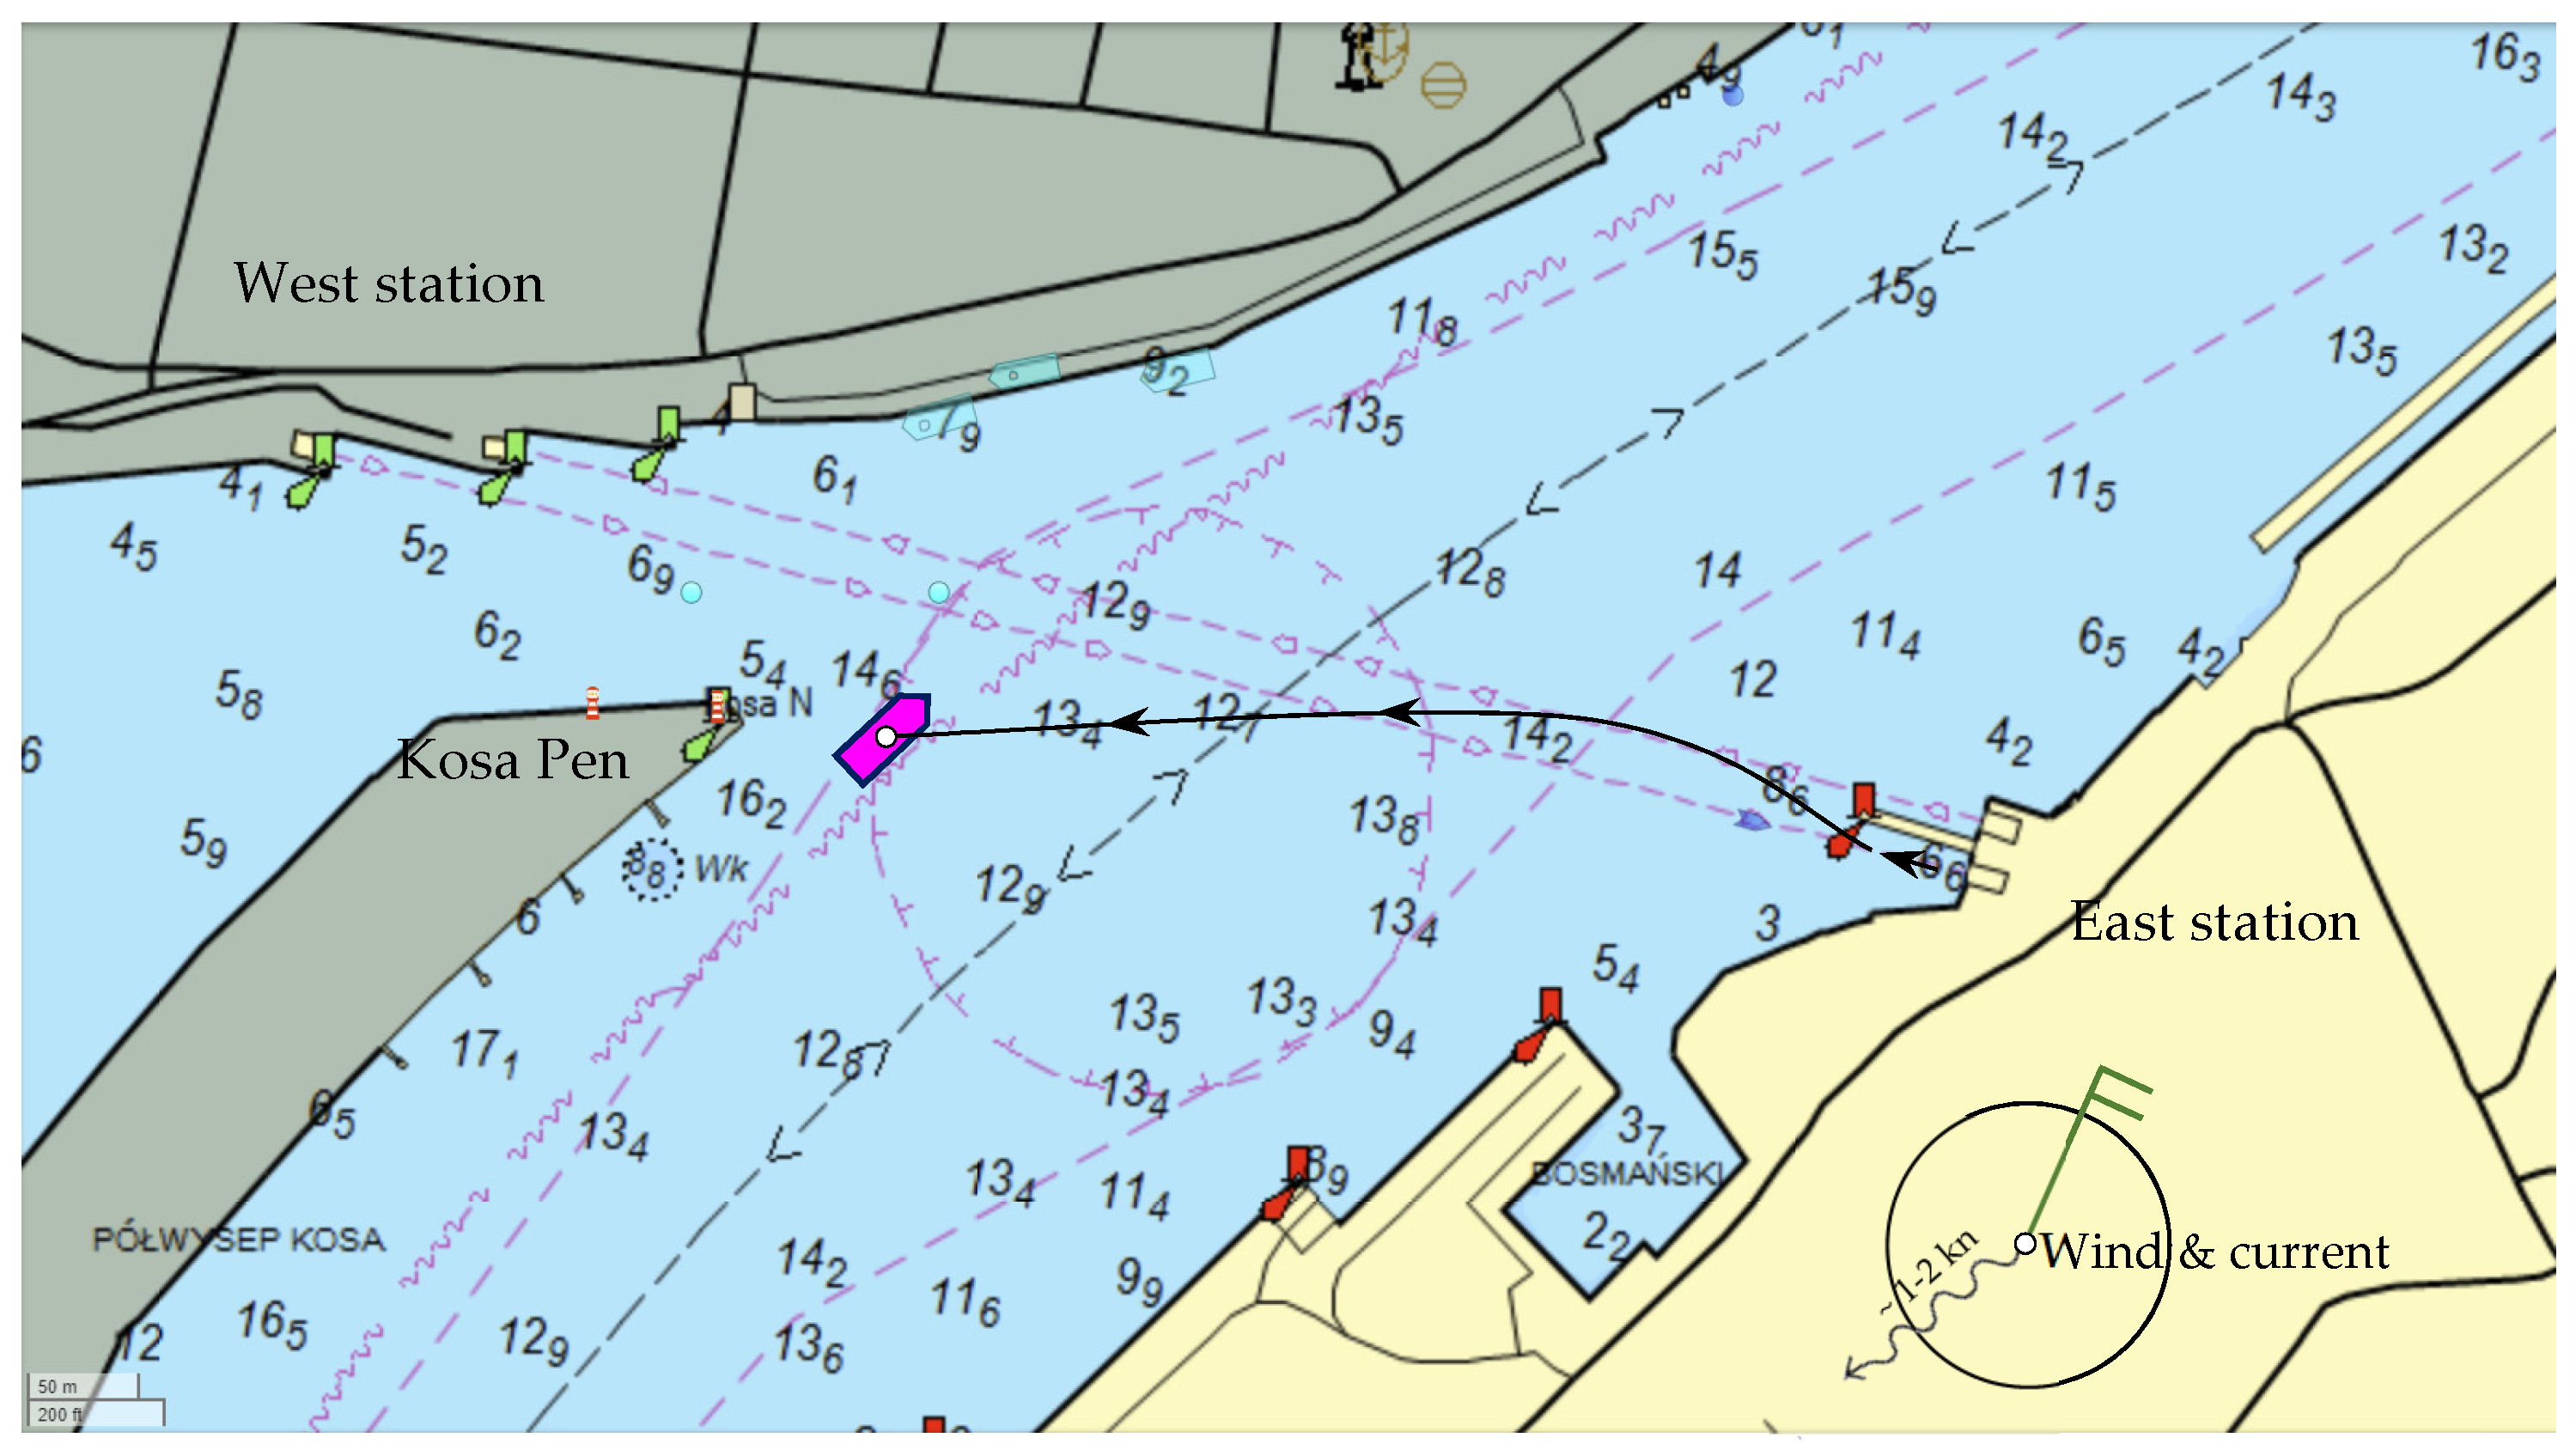
The incident involving the Świnoujście–Warszow city ferry near the Kosa peninsula occurred on 9 January 2019 (
Figure 1). The west station is marked with green lights and the east with red lights. On the east side, a pier is used for the ferries to separate them and allow safe berthing. The ferry crossing has a depth of up to 14 m and even 16 m near the emergency anchorage. The ferry anchored in an emergency situation about 50 m from the Kosa peninsula, but the anchor did not hold and the ferry was adrift, an incident that puts lives in danger. The sequence of incidental events in local time was as follows:
18:30—The ferry is loaded and unmooring from East ferry station. 18:45—Main engine failure. 18:46—Changeover to an emergency engine. The “Uran” tugboat was called for emergency via the Shipowner. 18:48—Notification of the incident to VTS Świnoujście. 18:48—Both anchors were dropped almost simultaneously. The chain length was 1.5 shackle (approx. 40 m). Both anchors dragged slightly. The emergency engine was operated forward throughout emergency anchoring. 18:53—Report to VTS Świnoujście, information about the stop at anchors. From 19:00 to 19:25—Ship moves due to the action of wind and current, stern anchor probably drags and the ship lines up with its bow to the wind and current. 19:25—The “Uran” tugboat approaches from the port side and passing tow lines fore and aft. 20:15—Bielik IV is safely moored at station no. 4 on the west side of Świnoujście Municipal Ferry Terminal.
Based on the port regulations [
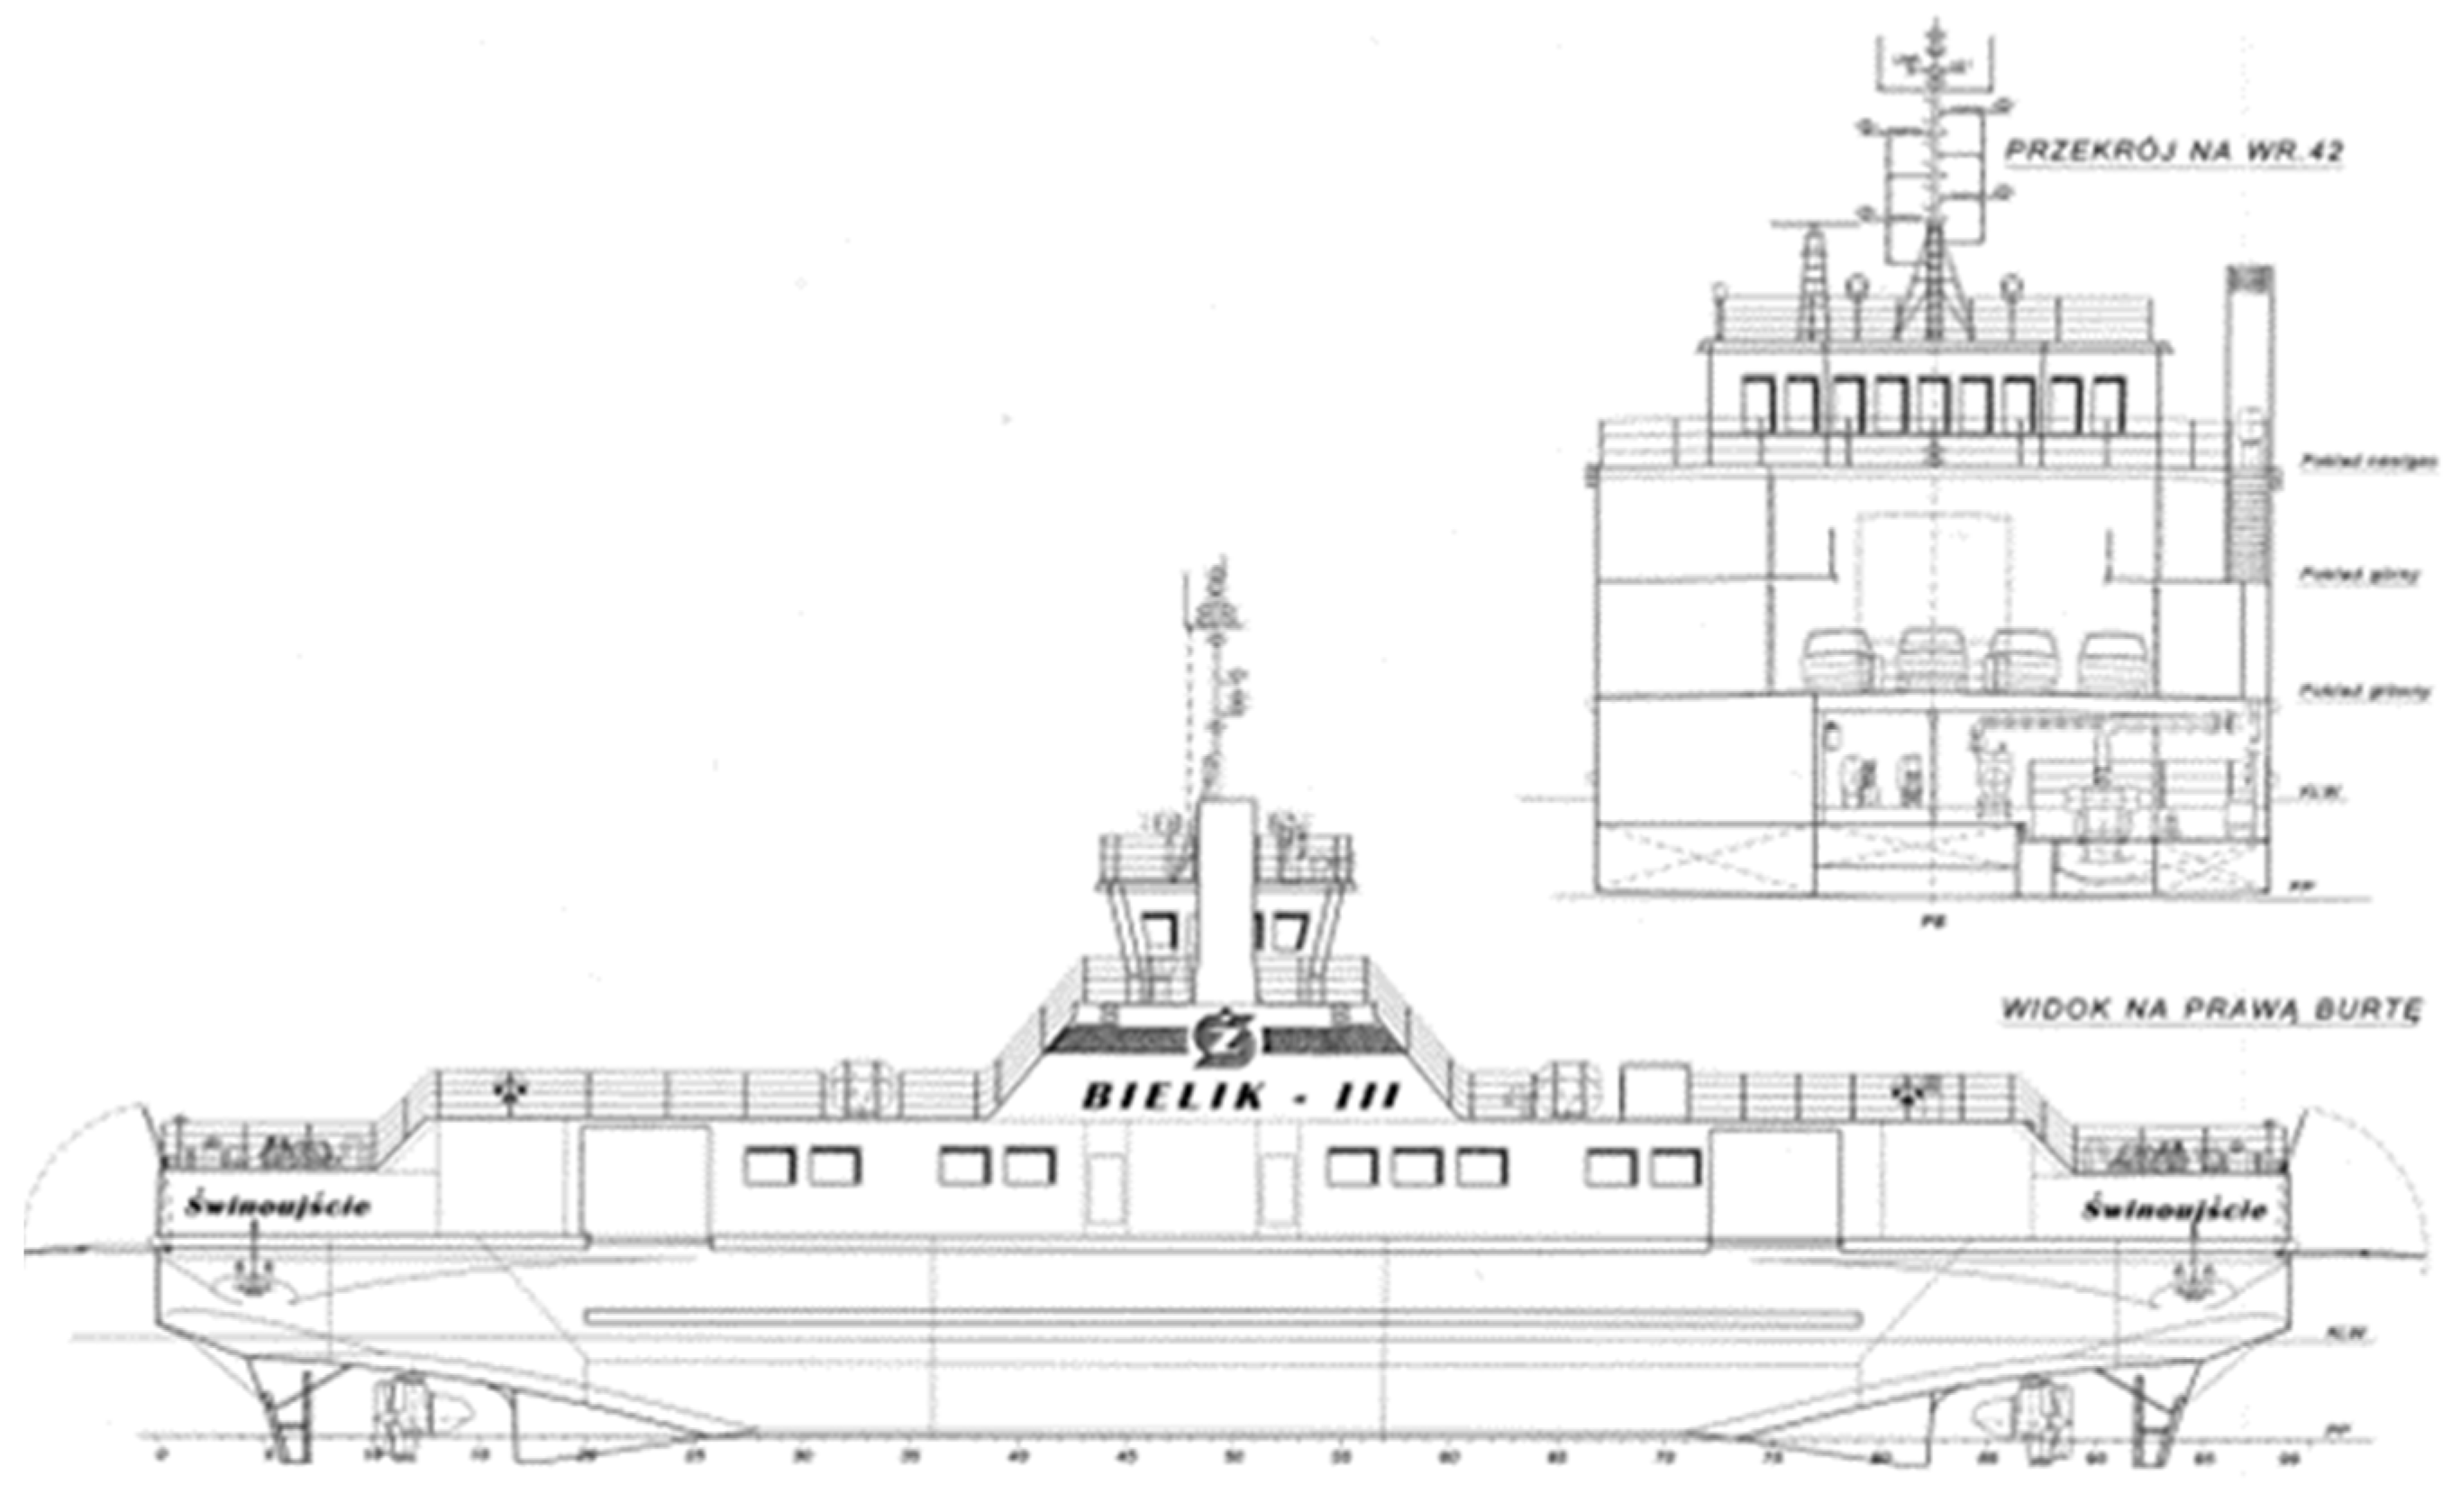
4], it can be stated that there are no conditions restricting the traffic of city ferries in Świnoujście. Anchoring during extreme weather should not in itself present any difficulty. The following particulars of the Bielik ferry (shown in
Figure 2) that was designed for inland conditions with winds up to 5°B, were determined for purposes of investigation:
Lenght overall L = 49.90 m.
Width B = 15.60 m.
Constructional draught T = 2.25 m.
Main propulsion power 750 kW.
Auxiliary (emergency) power 170 kW.
Max. number of passengers 695.
Anchor type (number of anchors): patented Hall (2).
Single anchor weight 450 kg.
One chain length 40 m (1.5 shackles).
3. Methods and Calculation
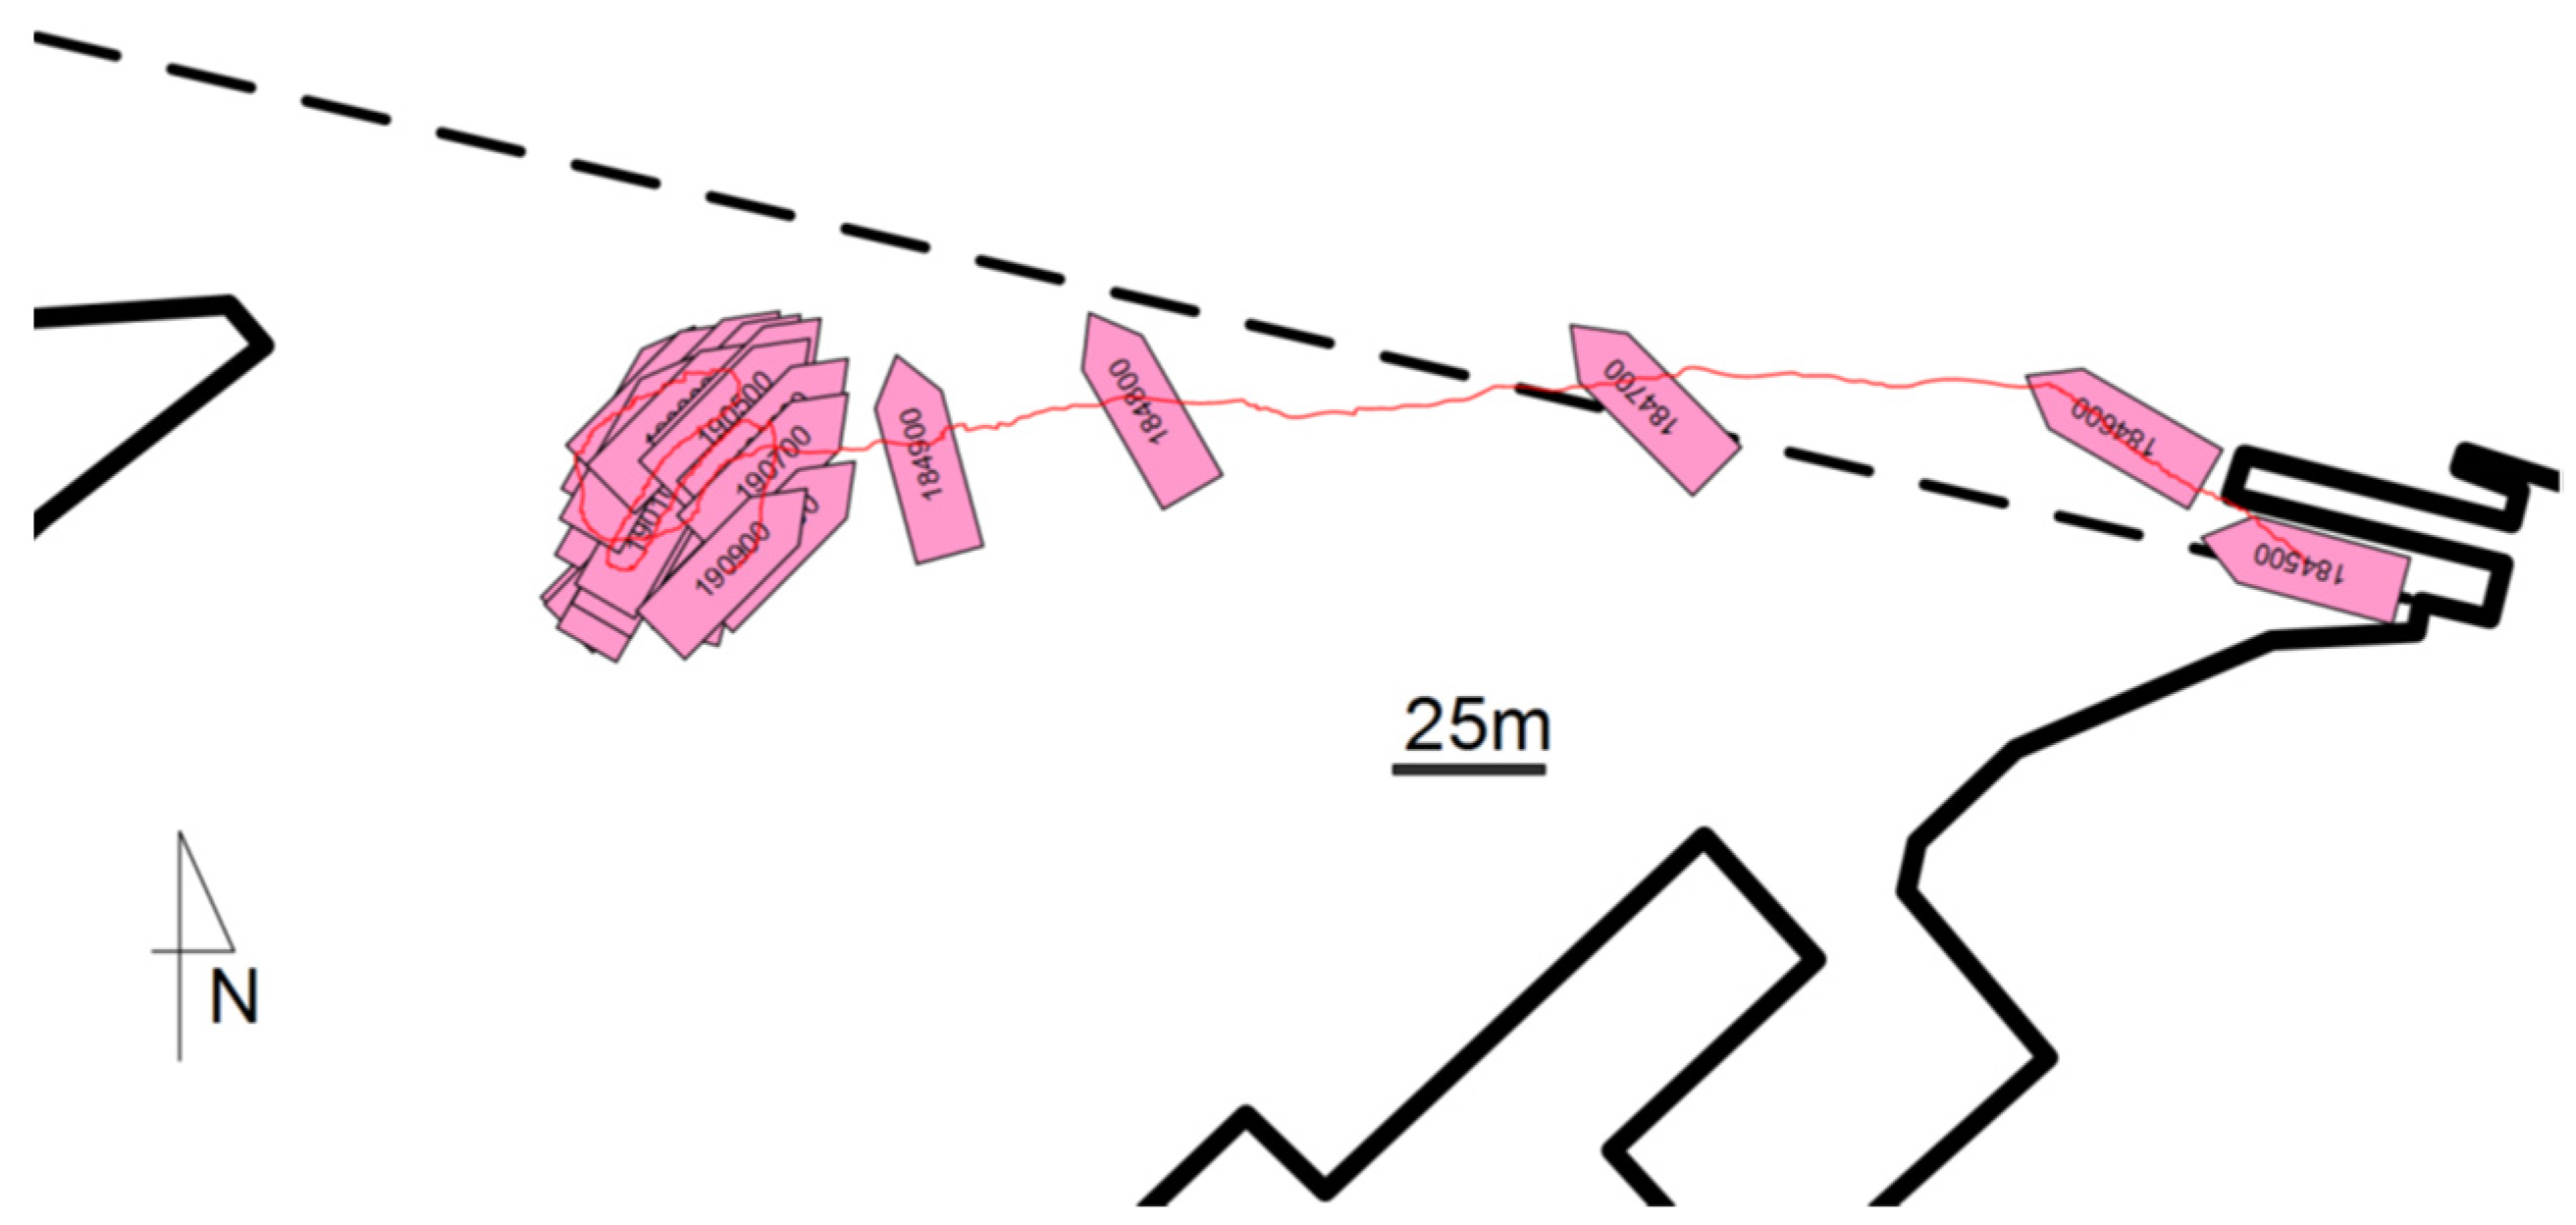
Based on video signal recordings of the Vessel Traffic Service (VTS) Szczecin–Świnoujście, the event was reconstructed and displayed on a map of the basin. The reconstruction was done by analyzing the position and course of the ferry at half-minute intervals. The video images of the ferry’s unfiltered radar echo were used for this purpose (it is a radar set up on the Kosa peninsula in the vicinity of the event).
The use and reading of the position determined by the VTS system recording (i.e., the position automatically estimated from the radar echo by the system manufacturer’s filtering algorithms) is impossible due to the errors inherent in the system. The filtered vessel position has significant jumps in both the position and course of the vessel and rarely (about 20% of the time) shows a correct echo. The reason for this is, as the operators claim, the difficult radio propagation situation in the area where the event took place. It should be noted that the very data used by the VTS operators is unreliable to a degree that raises the question of whether this jeopardizes the safety of traffic control on the route.
However, manually reconstructed data from the radar video images was used to obtain the ship position and heading that is shown in
Figure 3.
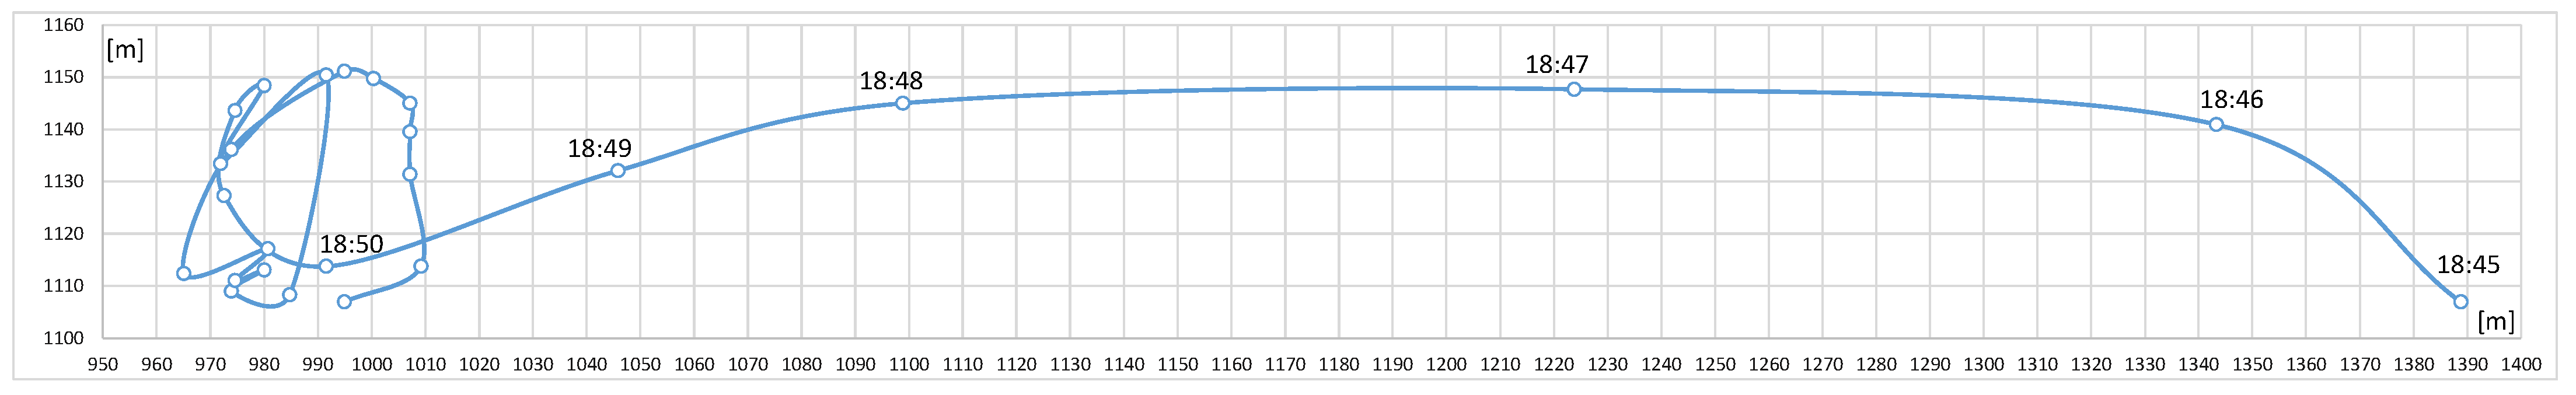
The sampling frequency is 1 min, beginning at the ship’s berth—i.e., 18:45. The sequence covers 24 min—until 19:09. It can be seen that the ferry does not anchor steadily but moves in a circle of about 40 m in diameter. This is confirmed by the records shown in the local Cartesian coordinate system, as shown in
Figure 4.
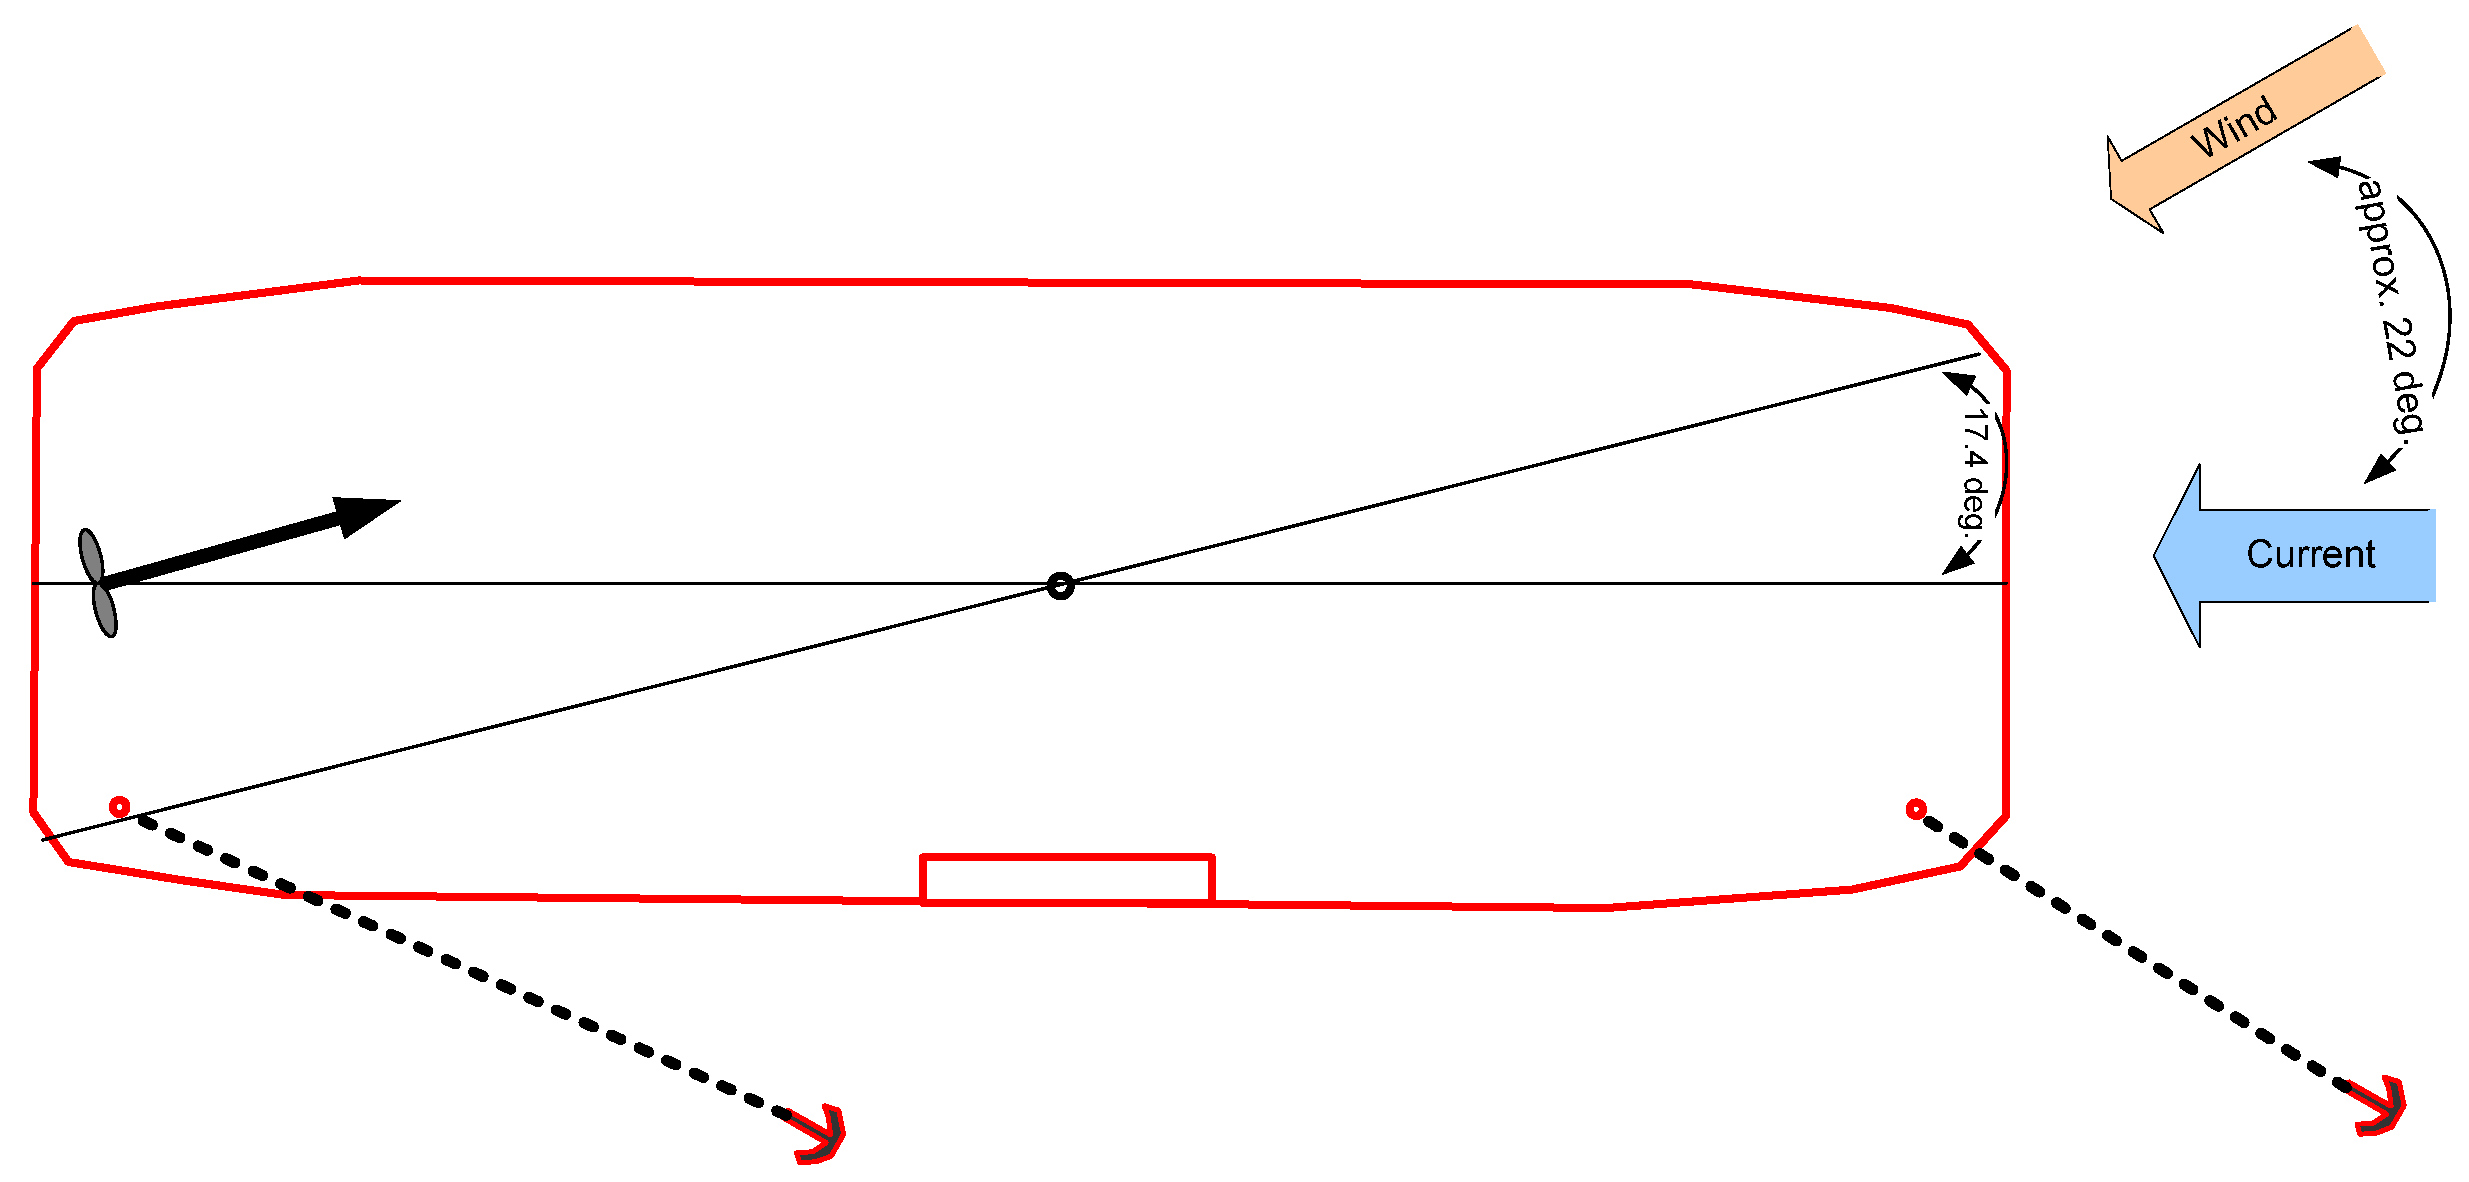
The met-ocean forces on the ship are shown in the
Figure 5, including emergency propulsion thrust direction and possible anchor circumstances.
During anchoring, the ferry was oscillating as the master struggled to remain in one place, the speed varying, at times up to 1 knot (0.5 m/s). The average heading of the ferry from 18:54 to 19:09 (i.e., after relative stabilization) was 046 degrees (NE). The angle to the wind of the shuttle, which according to VTS records came from the NNE direction, was therefore 22.5 degrees and the wind was blowing from the port side. The ferry stabilized its position and heading using the incoming current.
Unfortunately, there are no records of what the anchors looked like during the event and how the stern thruster worked, and it is difficult to accurately recreate the forces acting on the ship.
3.1. Estimation of Wind and Current Forces
The next step was to determine the wind and current forces using the commonly known dependencies in hydrodynamics and ship maneuvering.
Resultant wind forces:
where the component of the wind resultant force in vessel longitudinal and transverse directions is:
Cx, cy—aerodynamic factors,
ρp—air density,
Vwx, Vwy—longitudinal and transverse wind speed,
Pnx, Pny—longitudinal and transverse wind exposed area.
Resultant horizontal force of the currents:
where the component of the resultant force in vessel longitudinal and transverse directions is:
where:
Cpp—shallow water factor,
Cpx, Cpy—current pressure factor,
ρw—water density,
Vpx, Vpy—longitudinal and transverse current speed,
Ppx, Ppy—longitudinal and transverse current exposed area.
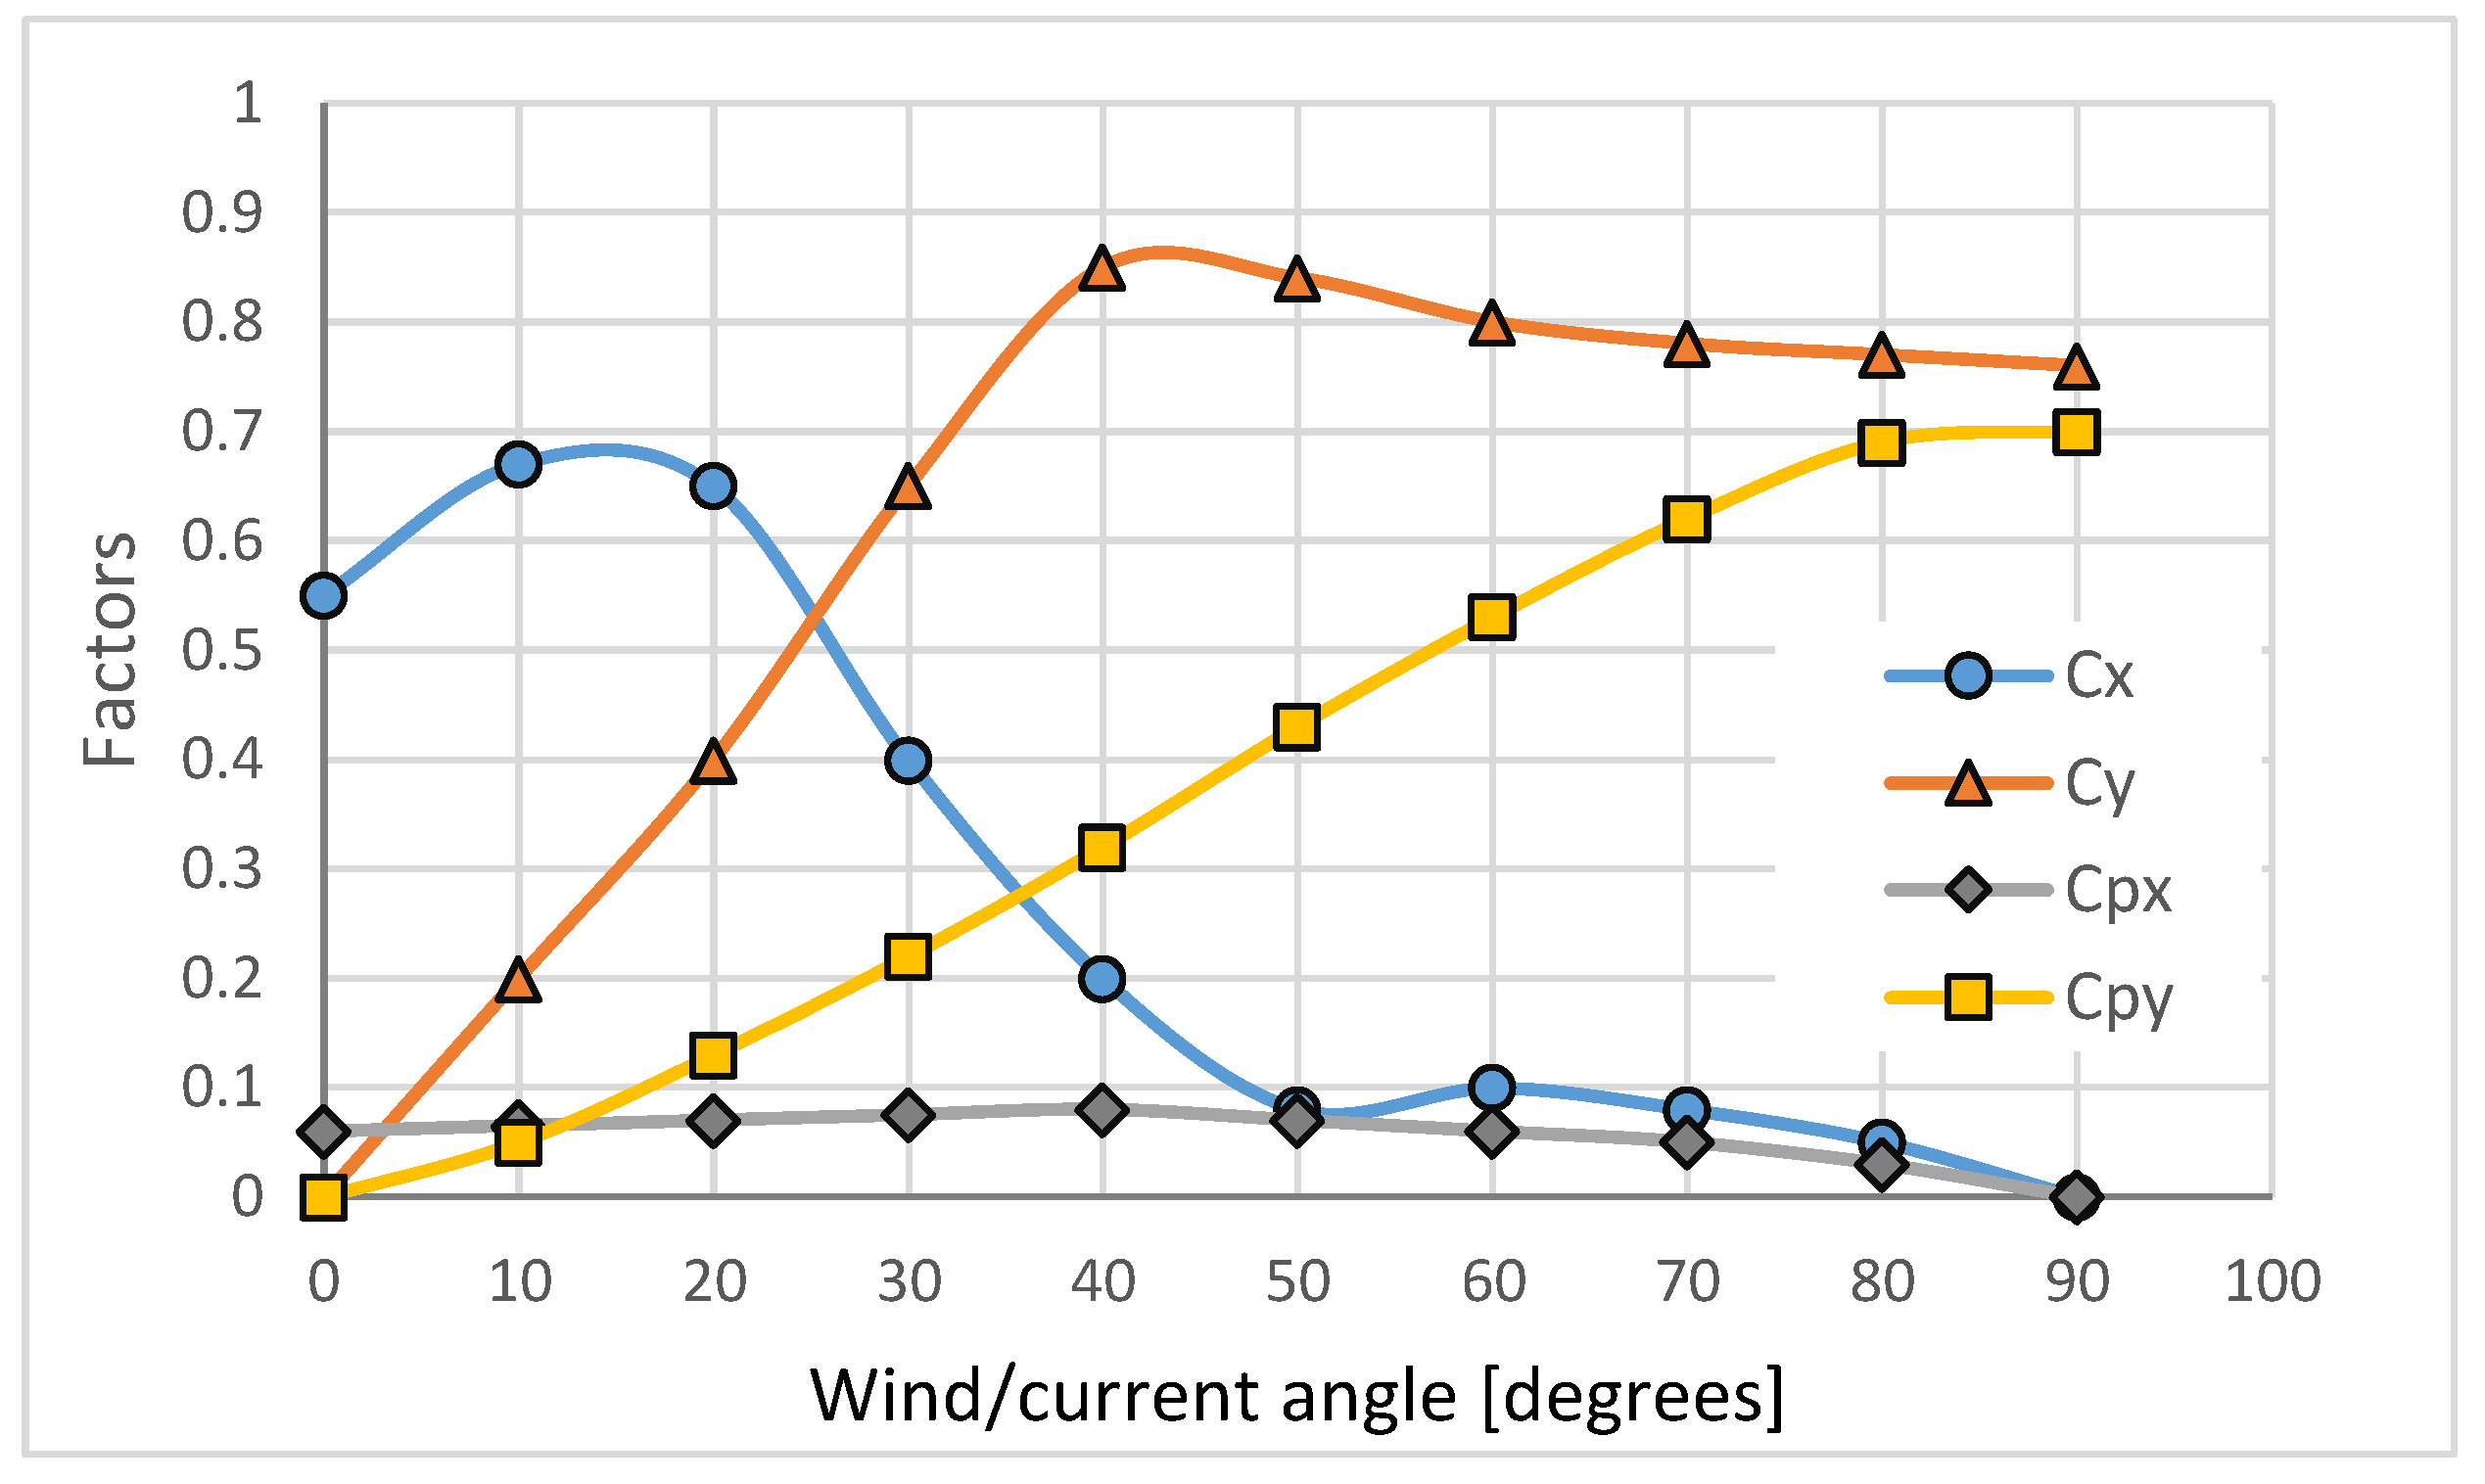
Diagrams of the coefficients Cx, Cy, Cpx, and Cpy were constructed, which are shown in
Figure 6. Since the unit is almost symmetrical, they were determined for one quarter only. It can be seen that the coefficient of transverse aerodynamic resistance (Cx), which is the most important for the anchoring calculations, reaches its highest values at a wind angle of about 15 degrees.
It should be noted that the actual wind angle of about 22.5 degrees determined from the video recording is very close to the theoretical wind angle of 17.4 degrees determined using the ship’s diagonal (see
Figure 5), and that this is also the angle at which the maximum wind force occurs (see
Figure 6), which is about 15 degrees.
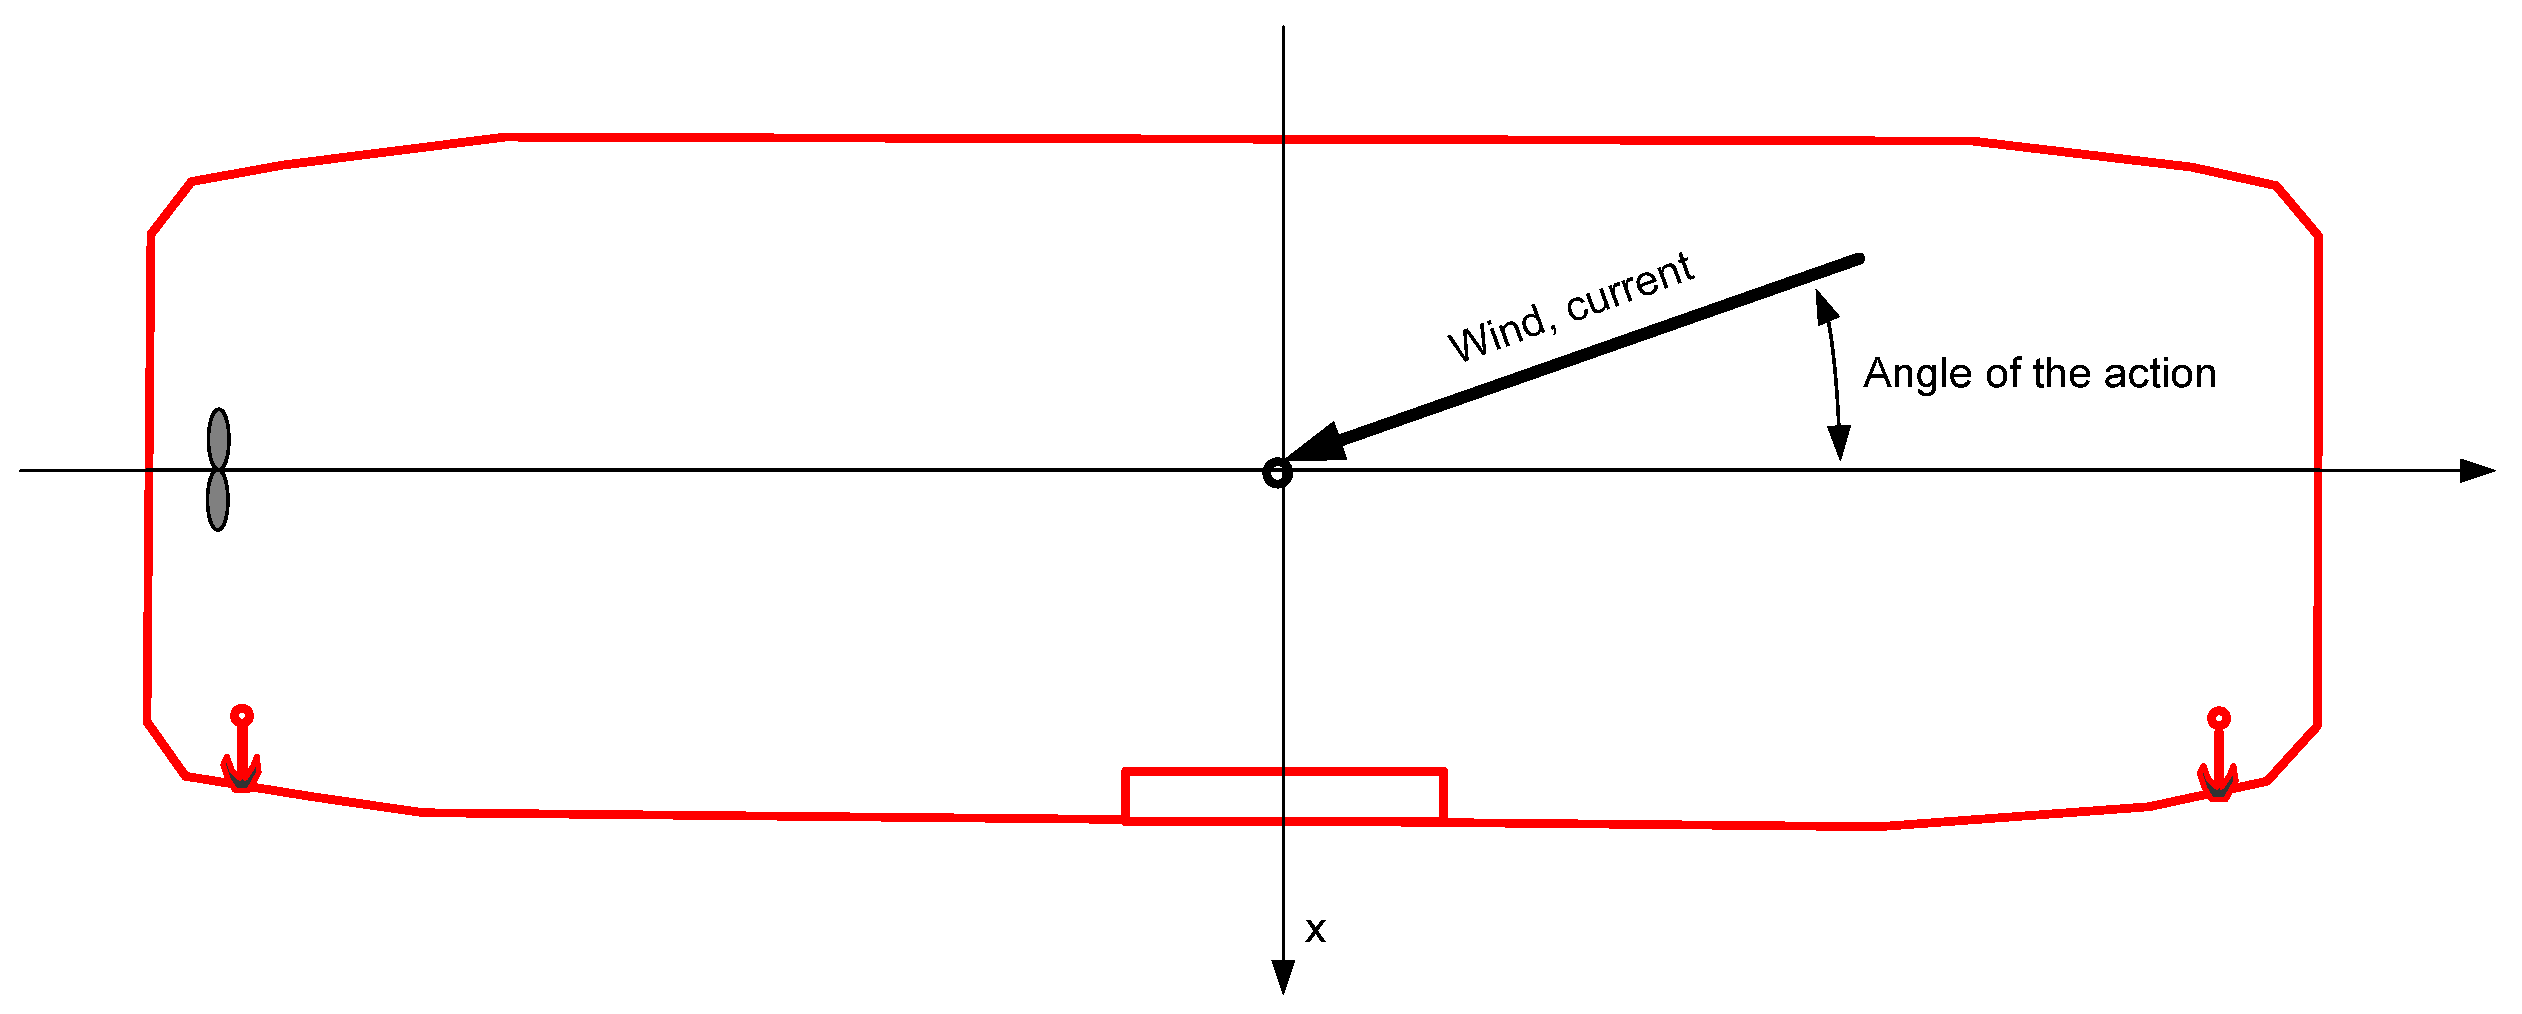
Figure 7 shows the coordinate system used for the calculations, taking into account the wind direction and current. The calculations did not take into account the resistance of the bow propeller nacelle.
In addition, the increase in the hydrodynamic resistance coefficient against the current was determined for the shallow-water vessel and presented in
Figure 8. It shows how the resistance to the current increases as a result of the forces related to the proximity of the bottom. However, in the case studied this is not relevant as the ferry has a shallow draught and the h/T (h—depth of area for the mean water level; T—the draft of ferry) ratio is 6.6, which is considered deep water, therefore the Cypp value = 1.
Furthermore, the calculation of the forces resulting from the action of the current has been verified with good results using the methods recommended by Oil Companies International Marine Forum (OCIMF) [
27]. For the wind, an angle of 17.5 degrees determined by the ship’s diagonal was used, which is close to the actual angle the ship was at during the event. The angle of the current is assumed to be zero, which also corresponds to the actual situation.
The calculations of all forces were intentionally made in metric units of tonne force, marked T (usual) or tf (new, recommended). The reason for this is the intuitive understanding of these units in the shipping industry and their use, e.g., for towing. When converting to the units SI, please note that 1T(tf) = 9.81 kN.
The analysis of the results of the wind and current impact assessment shows that:
The wind load is predominant. It is over 5 tf at 10.5 m/s wind in the crossing area.
The load from the current is minor and does not exceed half a tonne of force, as the ferry has a small chassis area and an excellent hydrodynamic shape in forward and reverse, for which it was designed.
3.2. Determination of the Shuttle Emergency Propulsion Thrust
Following Gerr [
28], the thrust of the propeller operating at zero or low speed of the vessel, called pulling force on the hull, was determined. Of course, the flow can slightly influence the calculation of the efficiency and the forces generated by the propulsion. The calculations are shown in
Table 1.
It should be noted that the thrust of typical 200 kW jet rudders is about 3 tf. In total, 250 HP units generate about 2.5 tf of pull, which confirms the calculations presented. It can therefore be assumed that the Bielik ferry’s propulsion units can generate just over 3 tf of thrust with an emergency engine, as shown in
Table 1.
3.3. The Forces and Effectiveness of the Emergency Stopping of the Ferry at Anchor
The next step was to determine the forces on the anchors and evaluate the effectiveness of the anchors in stopping the ship [
28,
29,
30,
31,
32,
33].
Anchor holding force:
where:
wα—coefficient of reduction of the holding force of the anchor due to the lifting of its shank by angle α,
K—anchor holding force coefficient,
μ—coefficient of friction,
wcb—the weight of the chain lying on the ground.
At the beginning, the so-called anchor holding force coefficient (K) was determined, which is usually the factor by which the anchor weight (Wk) is multiplied. The anchor holding force (Fk) is expressed as: Fk = K⋅Wk. Some authors [
28,
29,
30,
31,
32,
33,
34] propose a slightly modified relationship in the form Fk = K⋅(Wk
0.92), where the power factor indicates an increase in force. However, this is a minor difference that is not commonly used in research, so the classical dependence was used. The values of the holding coefficients and the chain friction against the bottom of the basin are given in
Table 2, which is an example of AC-14 and Hall type, which we have given only for comparison and indeed the anchor type for Bielik was Hall type and we assumed a coefficient for anchor hold force equal to 3.5. It should be noted that the assumption about the type of the bottom we are dealing with, and therefore the holding coefficient of the anchor, is crucial and introduces the greatest uncertainty. In this study it is assumed that the bottom is muddy with a layer of sedimentary river sand underneath. The anchor’s holding factor is conservatively chosen as K = 3.25, which means that the anchor will hold more than three times its mass.
Figure 9 shows the symbols used for further calculations regarding anchoring. The relationships that allow a calculation based on the load force of the chain by the ship, the weight of the chain and its length, the so-called chain curve (catenary), including the point of contact of the chain with the bottom of the basin (xh) and the length of the chain resting on the bottom (Sd), were used.
For the Bielik type ferries, the length of the anchor chain is only 40 m. Usually commercial vessels use chains of up to 4–6 times the depth of the basin to effectively moor. The reason is not the weight of the chain itself and the extra resistance it creates, but the fact that the angle of the lift of the anchor shank that occurs when the chain is too short has an extremely negative impact on the anchor’s holding power. Based on the literature review in this article [
35,
36,
37,
38] and OCIMF [
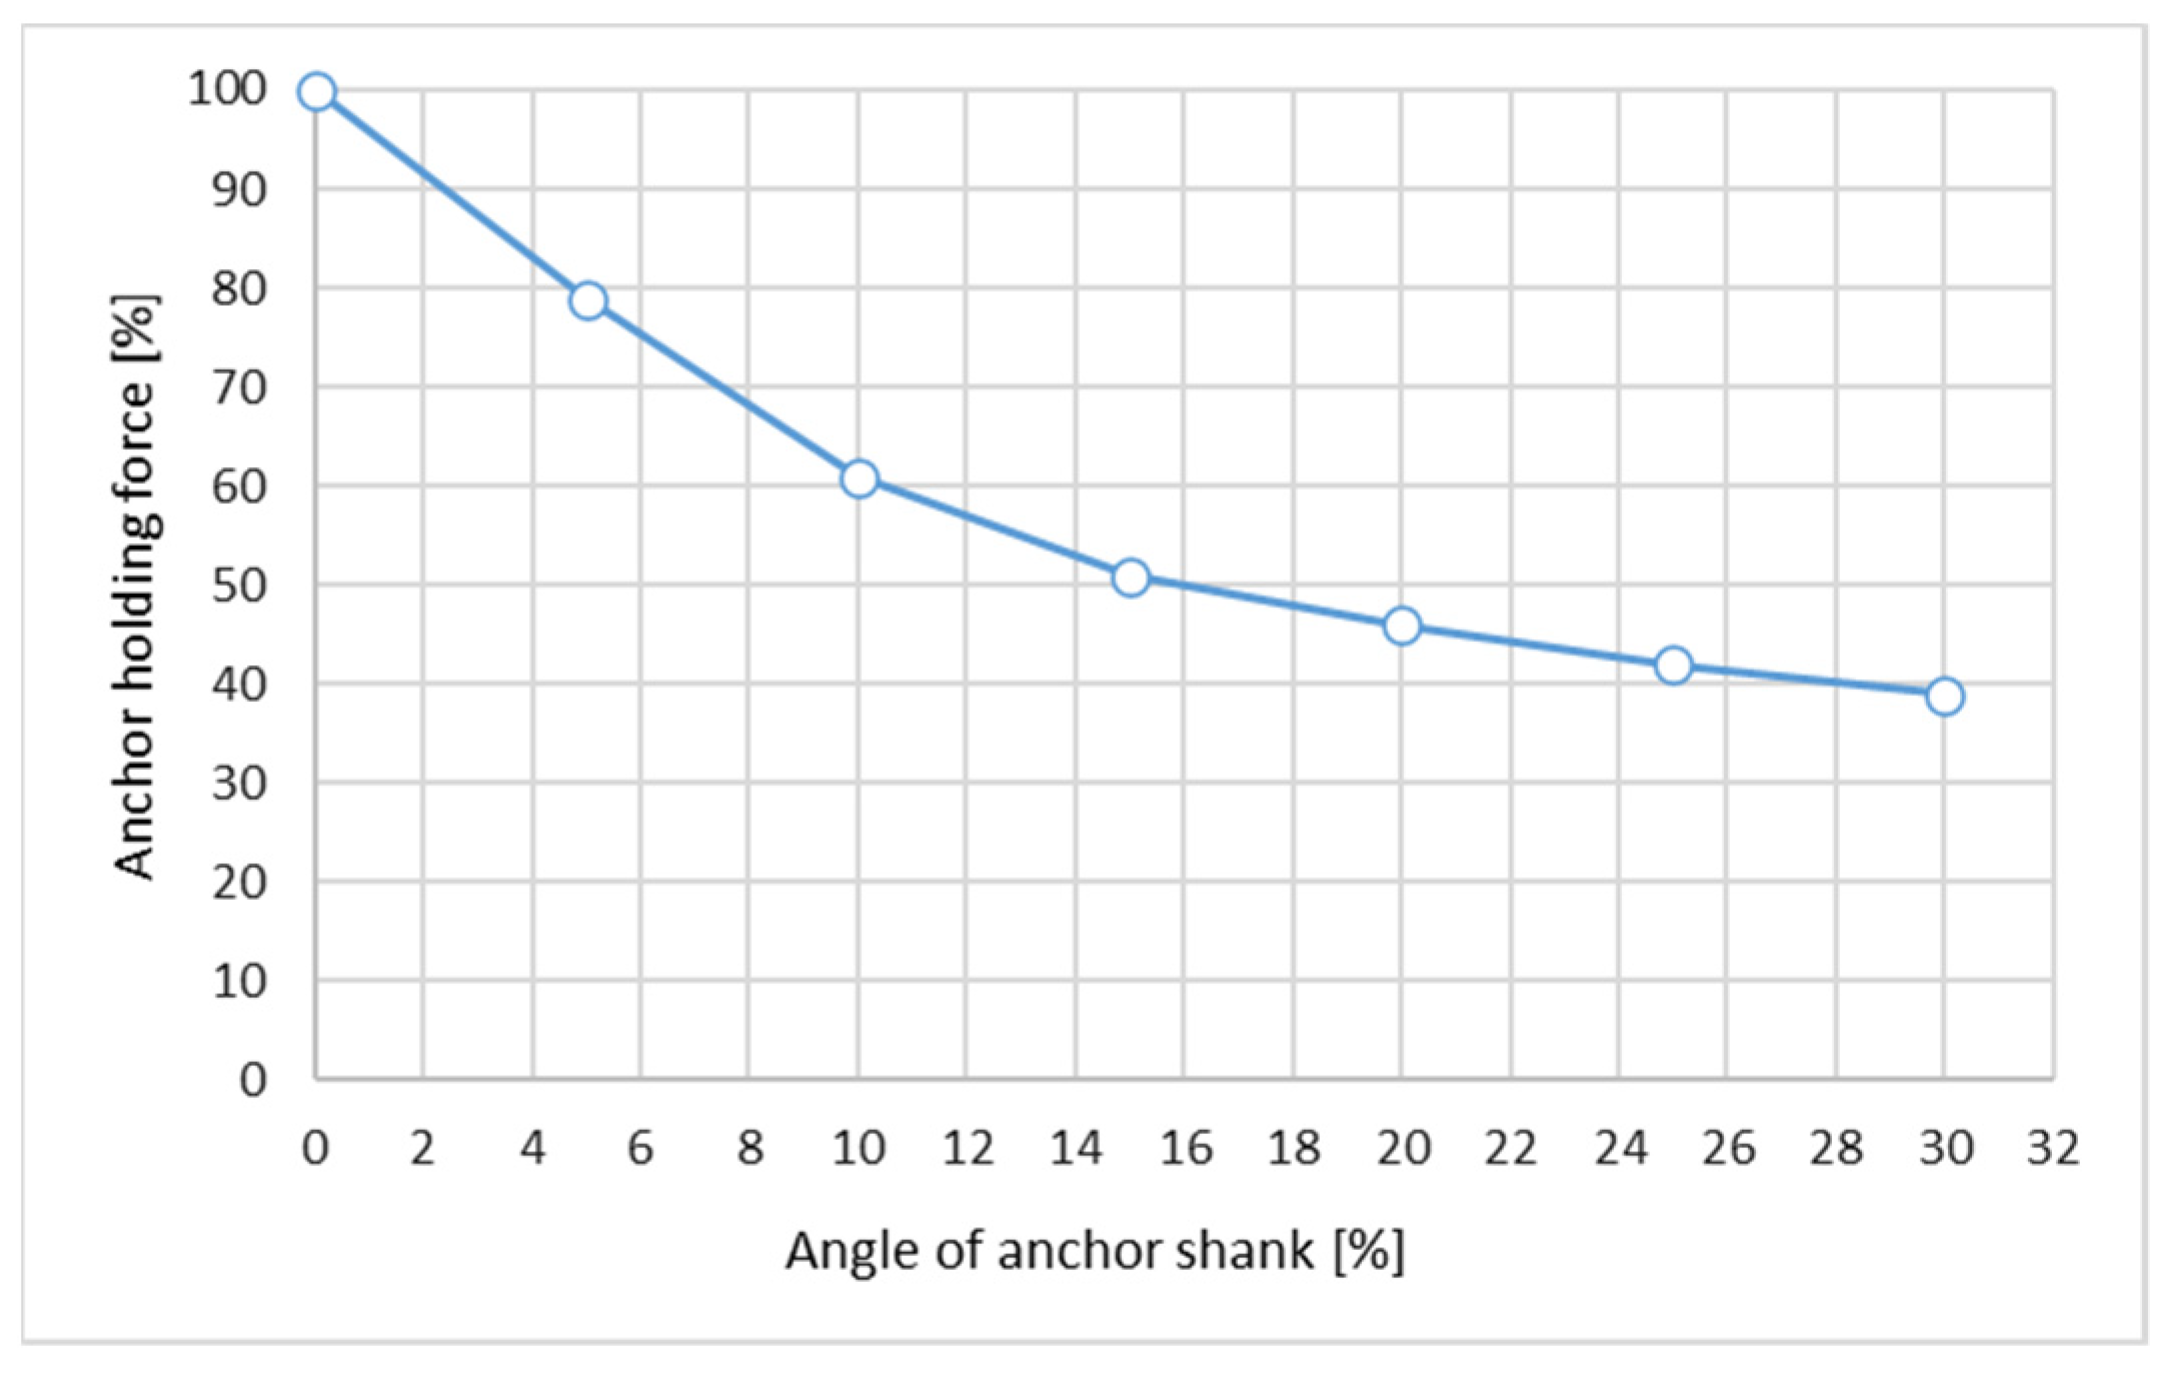
27], coefficients for Hall or similar (stockless) anchors were determined for the patented anchor, their failures to sufficiently grip resulting from the upward lifting of the anchor shank that occurs when the chain is too short and light. The values of the coefficients are shown in
Figure 10.
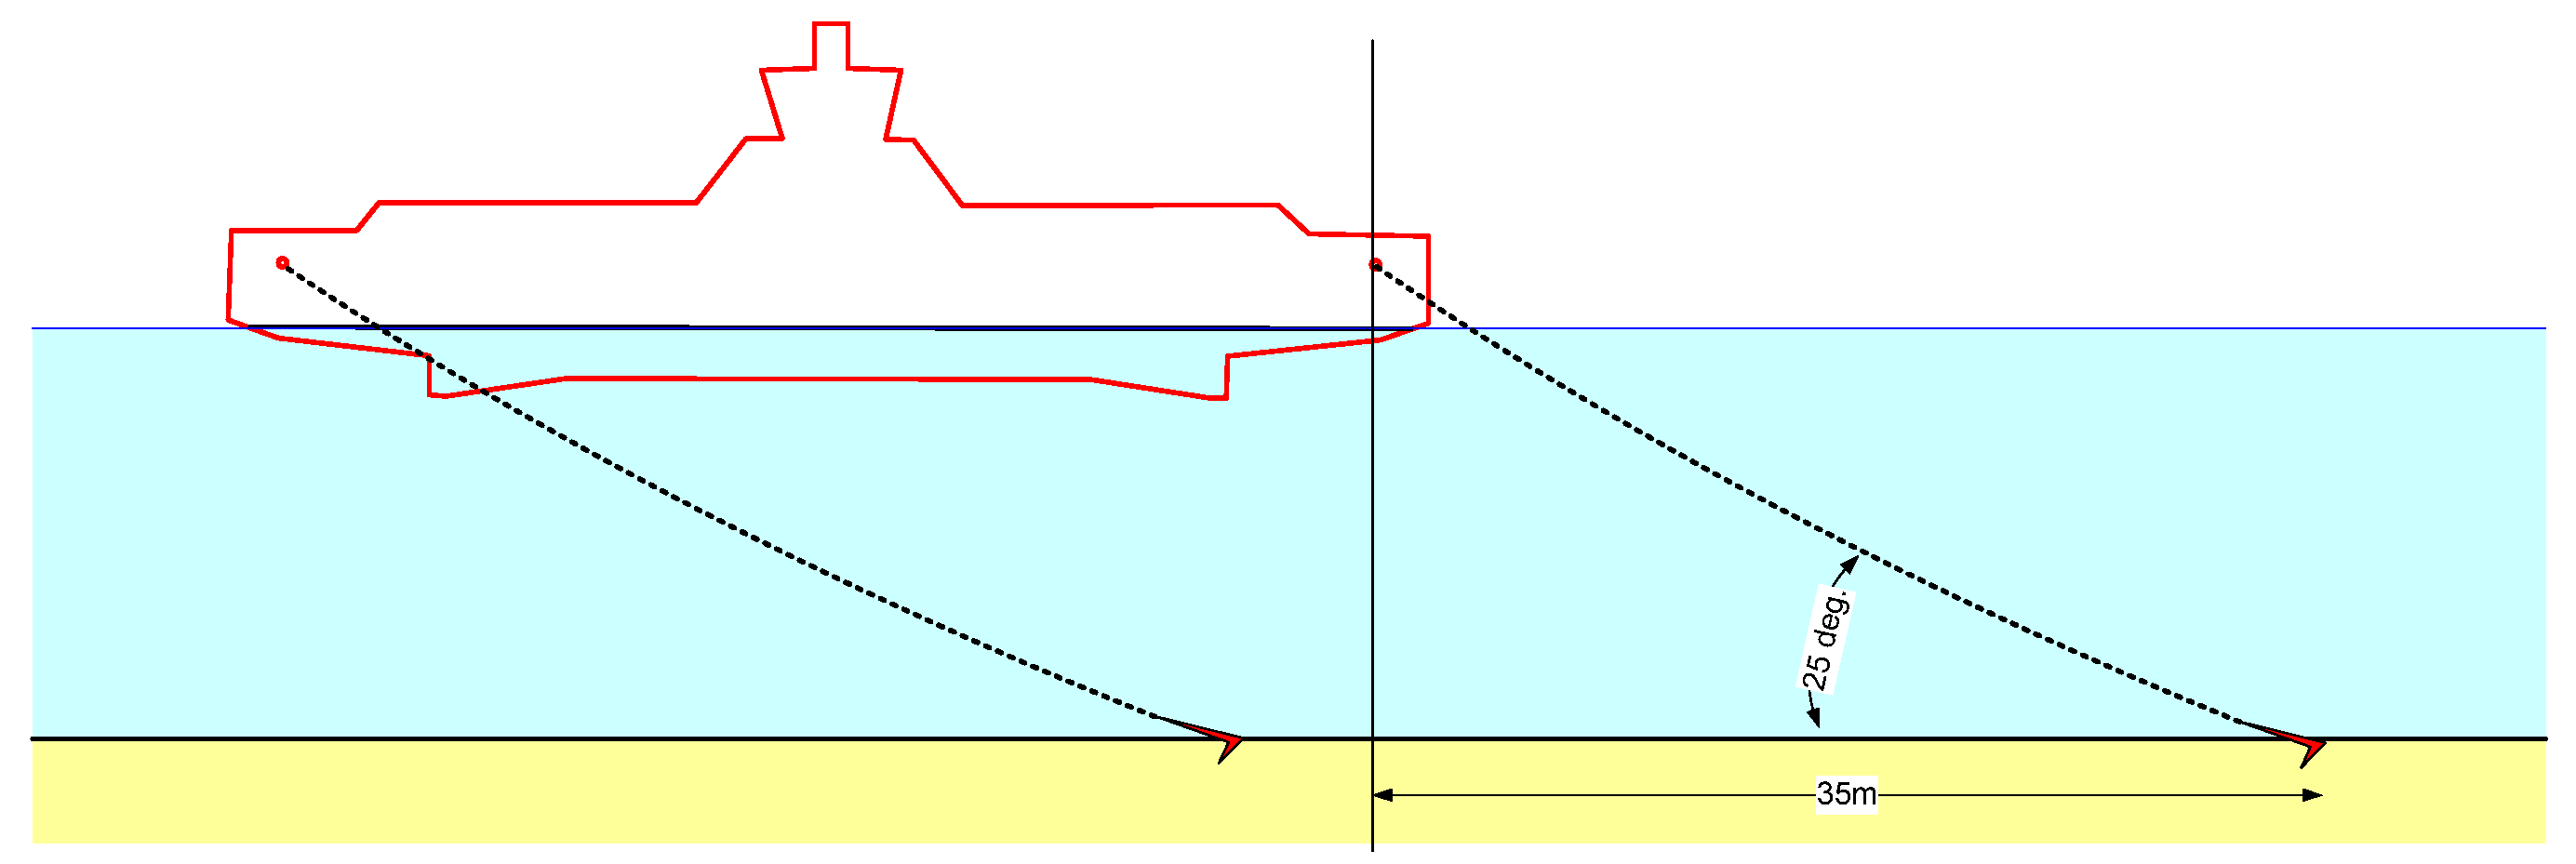
A probable anchoring pattern of the Bielik unit with two anchors ejected to the maximum chain length is shown in
Figure 11, made on scale. It can be seen that the angle formed by the anchor shank with the chain is considerable (it can theoretically be up to 25 degrees, but in practice, it is smaller due to the weight of the chain). This is due to the short and light chain and the deep water. In addition, the chain may not be in contact with the bottom of the water, which obviously has a negative effect on the anchor’s holding force.
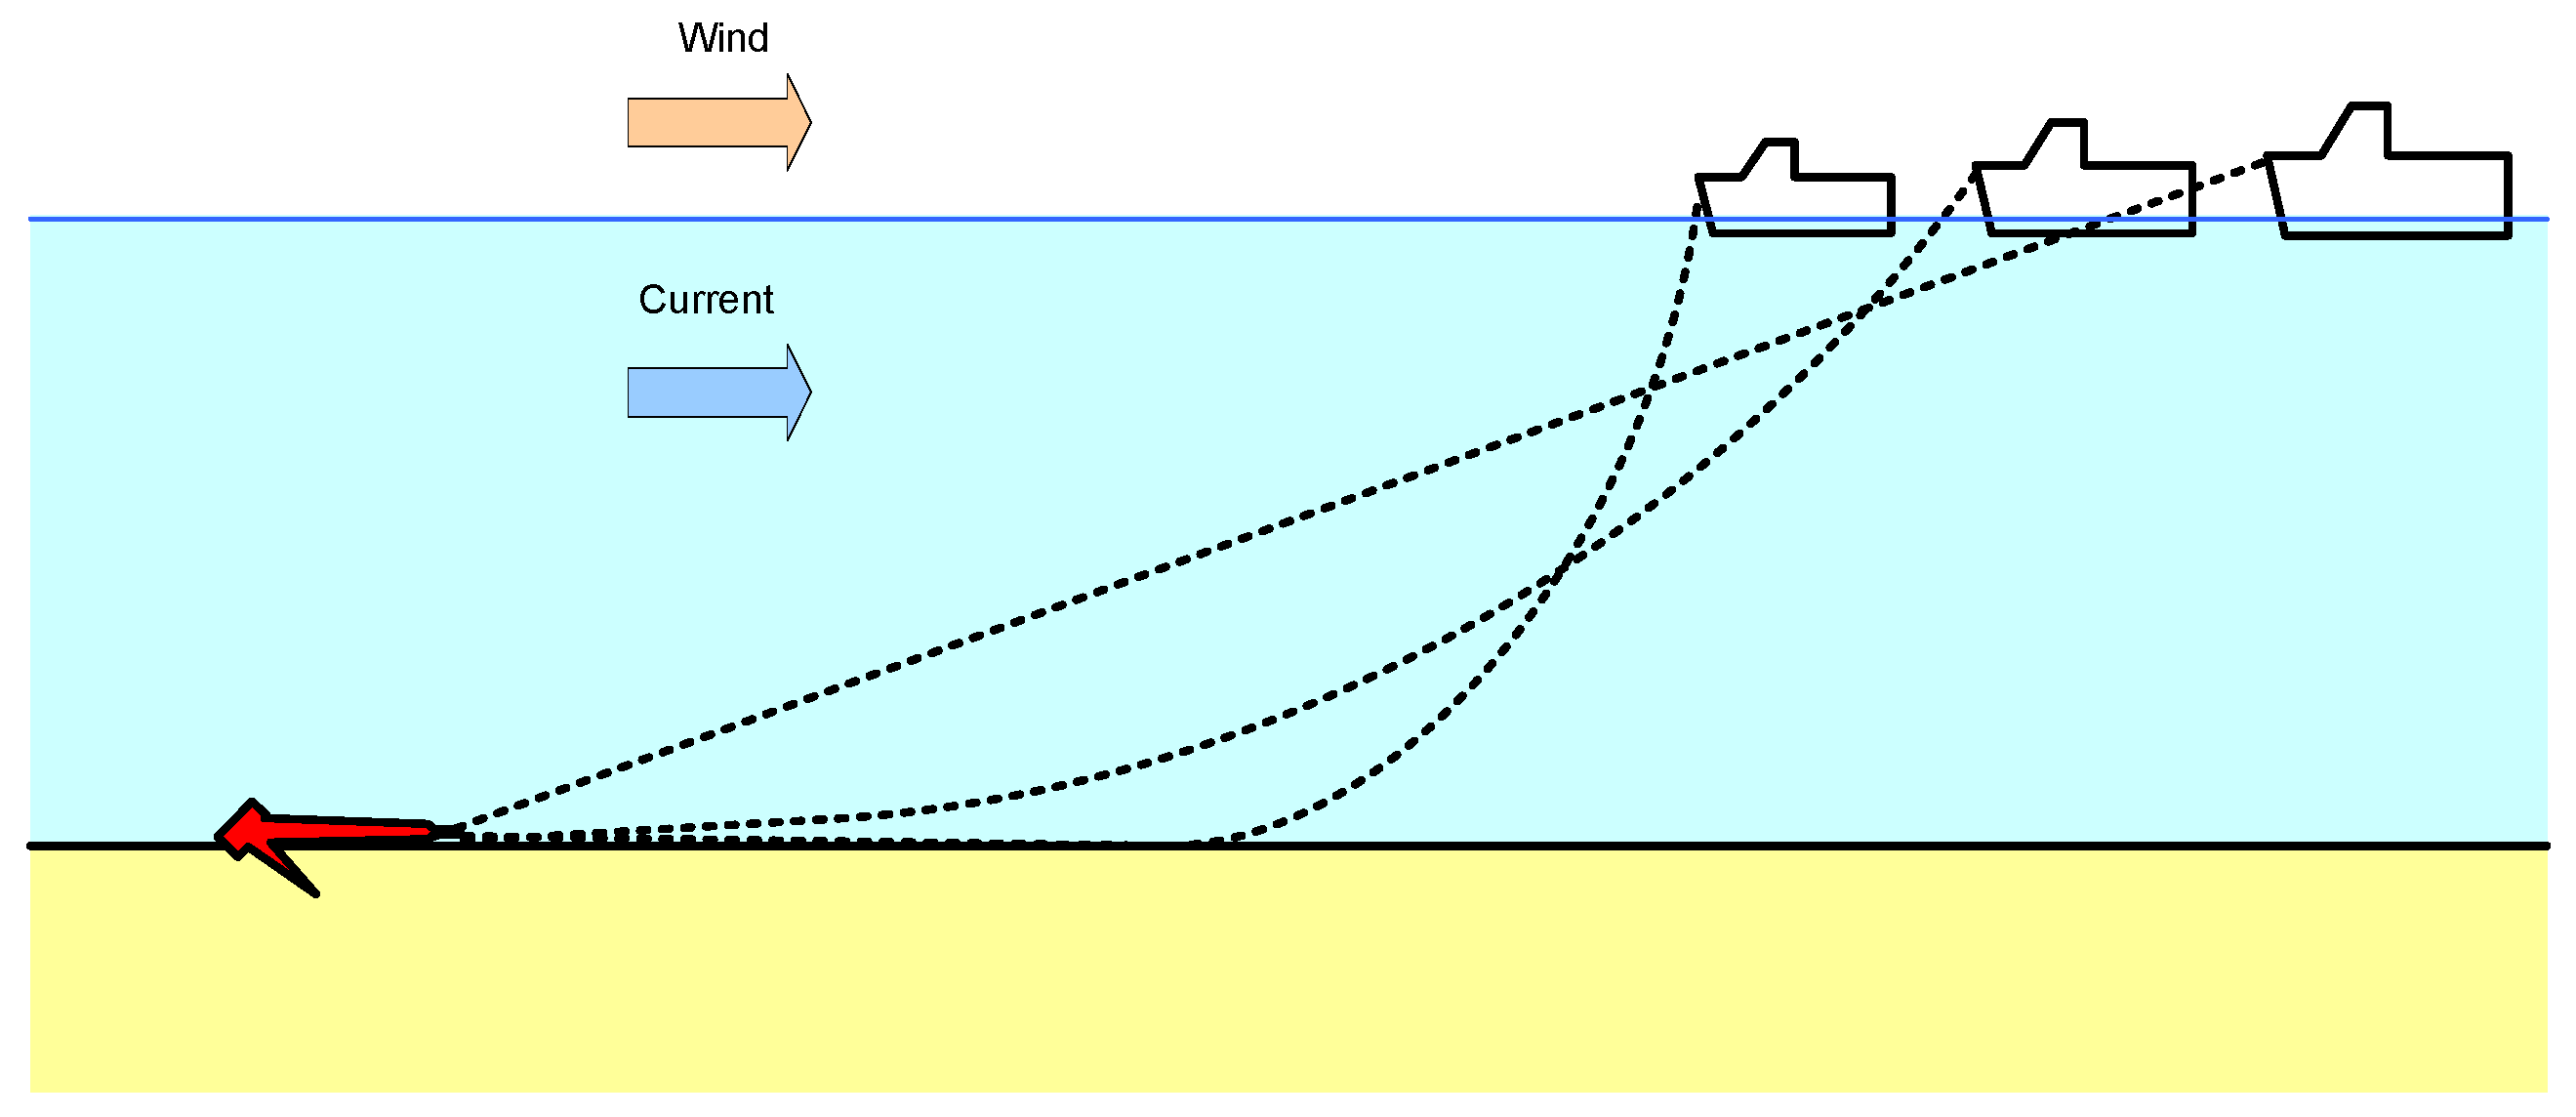
The problem of the fading of the chain curve due to increasing wind or current is illustrated in
Figure 12.
In a further step, the possibility of lengthening the anchor chain by a certain value until the anchor curve forms and the chain reaches the bottom with its part to minimize the lifting angle of the anchor shank was considered as a natural solution.
Table 3 shows the calculated forces acting on the ship when the chain is lengthened and the wind speed in the crossing area is increased and may serve as a recommendation to choose the optimal chain length in such an area. For this purpose, formulae 1., 2., 3., 5. and 6 were used to determine the aerodynamic force from the wind and the hydrodynamic force from current (assumed to be constants) for winds in the range 10–13 m/s. Two anchor holding forces were calculated using formula 7. assuming coefficients for the reduction of the holding force and for different chain lengths from 3 to 6 shackles. Thrust of the emergency engine was calculated as shown in
Table 1.
The value of the chain length at which this effect occurs under the considered conditions is 3 shackles (82.5 m). In the case considered, the chain rests on the bottom at a distance of about 10 m from the anchor shank without any lifting of the chain. A further extension of the chain is of course even more effective in terms of holding force, but it is not justified due to the water restriction and the proximity to the shore. The additional holding force of the anchor is about 1 T.
4. Discussion
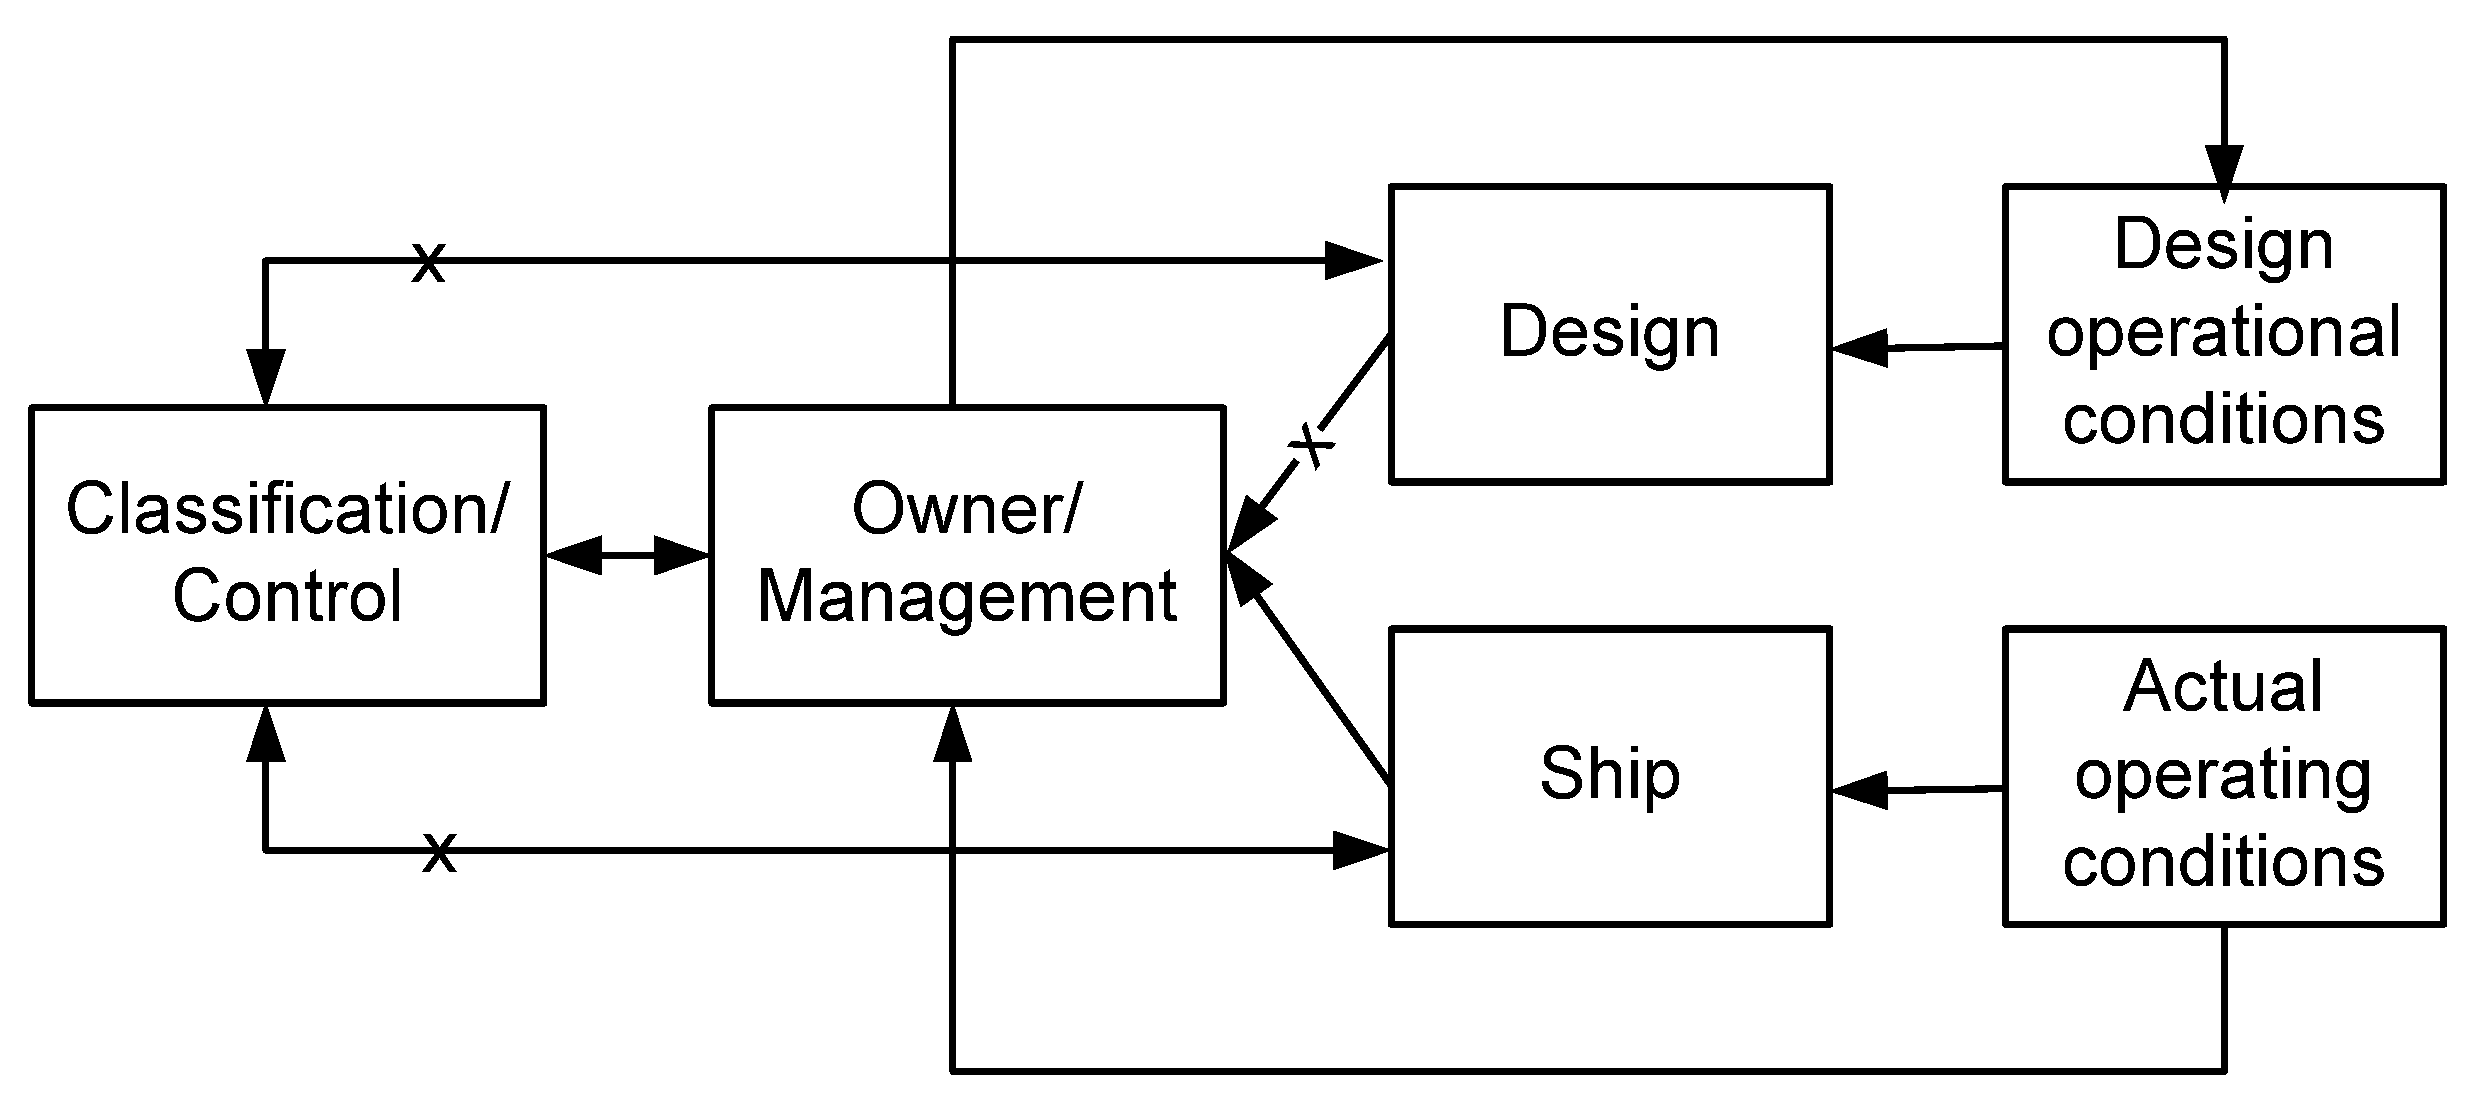
One key finding from this study is the lack of knowledge about the differences between design and operating conditions in extreme situations and the fact that the ship was designed for shallower depths than those prevailing in the Ferry Crossing. The management (shipowner) and the classification (Classification Society) and control bodies (Port State Control) were, one hopes, not aware of this. The detailed information flow between these actors is shown in
Figure 13. The missing link in the information flow and the unknown links are also shown. The lessons learned after the incident relates not only to the simple redesign of the ferry (lengthening the anchor chains) but also to the establishment of a permanent flow of information between the decision-makers during the planning process.
From the theoretical perspective the study showed that there is no link between actual operating conditions and the classification society, or that at the very least in this particular case the link failed to connect and with potentially dangerous results. A similar problem was observed in deep sea Polish ferry operators serving in the ferry link between Poland and Sweden. Several secondhand Ro-Pax ferries originally designed for the Mediterranean Sea were introduced into service in the Baltic Sea (for example, the m/f Gryf and m/f Galileusz ferries). Apparently, the power of the main engines and thrusters was not sufficient and caused problems with delays and safety of operation in more harsh wind conditions.
From the practical perspective we would like to highlight that a number of models are available, but unfortunately changing conditions and the evident lack of coordination among stakeholders unnecessarily complicates the accident/incident investigation and modeling process. The design of the hull was mentioned, but all aspects of the vessel must be designed for the purpose for which it was used. The ferry is not designed for emergency anchoring since anchors are only on one side and for shallow water (which is usually the case with this type of cross-service ferry). The missing link in the information flow between the operating body (owner) and the classification society, which focused on the condition of the ferry, which has a direct impact on safety, rather than on the operating conditions, which are different from the design, could present a relatively simple error that could have cost dozens of lives.
5. Conclusions
The main finding of this paper is that models based on socio-technical theory and systems theory can be useful for reconstructing accidents (incidents, too, of course), but that the application of such models does not take into account that external systemic issues will be predicted, such as that a vessel built for one particular maritime environment will be used in another where adverse issues may arise. This confirms the fact that even if these models are mostly proactive in nature, the maritime business environment may not be. The reconstruction carried out as part of this work led to several findings related to regulations, lack of cooperation between management and control bodies, and lack of knowledge on the part of the shipowners about the design conditions used in the construction of the ships. The ferry is designed to be anchored on one side only. This could also contribute to the postulates for a change in the design. However, such a change would mean a significant intervention in the structure of the ferry and was not proposed in the accident/incident report. Changing the anchor position on the opposite sides of the ferry would increase the ferry’s anchoring capacity. The main conclusion on accident reconstruction models is that they are reactive given the instability caused by the maritime industry’s leading decision makers.
Given this seemingly perpetual situation, our study shows that the accident investigation model of Rassmussen [
24] should be improved because there is no correlation between the design of the ship and the given conditions on the ship. The accident investigation model should be dynamic—if the conditions on the ship change, the criteria must be considered a second time in order to include a dynamic aspect in risk assessment, i.e., a model to dynamically adapt the risk model to the current operating conditions.
On the basis of the calculations and analyses carried out, it was established:
that the Bielik ferry performed significant movements with an amplitude of up to 40 m during the emergency mooring on 9 January 2019.
the wind and current forces acting on the ferry were in excess of 5 T and could not be compensated by the auxiliary drive, which was estimated at 3 T.
the anchors in the area were only able to operate sub-optimally, due to their short chain and demonstrated a lifting of their shanks, which did not provide the necessary forces to keep the vessel in place.
the missing forces to keep the ferry in place could be about 1 T under the given conditions.
In such a situation, the best solution would be to extend the anchor chains to at least twice as long as 3 shackles (about 80 m) without changing the chain diameter and anchor size. This results in the chain resting on the bottom of the basin about 10 m from the anchor shackle and minimizes the angle of lifting of the shank itself.
It should be assumed that, based on the models and calculations, the wind speeds up to and including 11 m/s, i.e., up to and including 5°B (constant without taking gusts into account) in the area of the crossing itself is maximum for the operation of the ferry in case of main propulsion failure and emergency anchoring.
The analytical tools in the form of records of the Szczecin–Świnoujście VTS system have major limitations and do not allow accurate tracking of objects in restricted areas, i.e., almost in the entire area of the Świnoujście–Szczecin waterway.
Further studies should be of an investigatory nature to determine to what degree problems of oversight undermine the science of risk management. At a different level, interdisciplinary studies should be made regarding the instability and expense, not to mention dangers, caused by the economic model applied by financiers of the maritime industry; which is to state quite frankly, that the driving force behind the industry should not be the absolute maximization of profit. Under such conditions, which are the very reason for the constant pressure to build larger, more ‘economical’ vessels, ports are under pressure to expand beyond reasonable capacities [
39,
40], and aside from enriching a few stakeholders have an adverse effect on small economies, place the environment in danger at all times (for solutions are always temporary), and, not to attempt to be comprehensive, in the case of marine science experts, engage the best maritime minds of our generation in the study of short-term problems and take innumerable hours away from the studies of more important long-term issues regarding the environment.
This paper is practical and identifies an aspect of ship operations that is sometimes neglected in operations and therefore potentially increases the overall safety of maritime and awareness of stakeholders and the maritime community. Of course, this would require an interest on the part of the stakeholders and a delivery mechanism that communicates our concerns; we urge that such should be done, and thoroughly.
As for limitations, this paper is not comprehensive in any particular way; models have been simplified, but the main points are irrefutable.
Author Contributions
Conceptualization, L.G. and M.P.; methodology, L.G., K.Ł., A.A., P.V. and M.P.; data collection, K. Ł. and L.G.; formal analysis, L.G., M.P. and K.Ł.; investigation, L.G., M.P., P.V. and K.Ł.; data curation, L.G. and A.A.; visualization, A.A., P.V. and L.G.; supervision, L.G. and M.P.; writing—original draft preparation, L.G., K.Ł., A.A., P.V. and M.P.; internal review, A.A., M.P. and L.G. All authors have read and agreed to the published version of the manuscript.
Funding
The research was based on a case study prepared by the authors for the Polish State Marine Accident Investigation Commission (PKBWM). The publication of the paper is partially financed by the research project (L7-1847; Developing a sustainable model for the growth of the “green port”) and the research group (P2-0394; Modelling and simulations in traffic and maritime engineering) at the Faculty of Maritime Studies and Transport, financed by the Slovenian National Research Agency.
Institutional Review Board Statement
Not applicable.
Informed Consent Statement
Not applicable.
Data Availability Statement
The data for this analysis came from Maritime Office in Poland and the owners of Bielik IV—Żegluga Świnoujska.
Acknowledgments
Not applicable.
Conflicts of Interest
The authors declare no conflict of interest.
Abbreviations
| EMSA | European Maritime Safety Agency |
| EU | European Union |
| FRAM | Functional Resonance Accident Method |
| IMO | International Maritime Organization |
| OCIMF | Oil Companies International Marine Forum |
| PKBWM | Poland State Maritime Accident Investigation Commission |
| SHEL | Software–Hardware–Environment–Liveware |
| STAMP | Systems Theory Approach |
| VTS | Vessel Traffic Service |
References
- IMO. Code of the International Standards and Recommended Practices for a Safety Investigation into a Marine Casualty or Marine Incident (Casualty Investigation Code)—MSC-MEPC.3/Circ.2. 2008. Available online: http://emsa.europa.eu/retro/Docs/marine_casualties/msc-mepc_3-circ_2.pdf (accessed on 12 September 2021).
- Amendments to the Code for the Investigation of Marine Casualties and Incidents, Resolution A.884(21), Appendix 1 the IMO/ILO Process for Investigating Human Factors, adopted on 4 February 2000. Available online: https://puc.overheid.nl/doc/PUC_3003_14/1/#23099 (accessed on 3 December 2021).
- Directive 2009/18/EC of the European Parliament and of the Council of 23 April 2009 Establishing the Fundamental Principles Governing the Investigation of Accidents in the Maritime Transport Sector and Amending Council Directive 1999/35/EC and Directive 2002/59/EC of the European Parliament and of the Council. Available online: https://eur-lex.europa.eu/legal-content/EN/TXT/PDF/?uri=CELEX:32009L0018&from=EN (accessed on 10 September 2021).
- Przepisy Portowe 2019. Zarządzanie nr.3 Dyrektora Urzędu Morskiego w Szczecinie z 26.06.2013. Consolidated Text as at 4 March 2019. Available online: https://www.ums.gov.pl/po/2013/Zarz_3_2013_1.pdf (accessed on 15 September 2021).
- Cassama, F. A Study on Marine Accident Causation Models Employed by Marine Casualty Investigators. World Maritime University, Dissertations. Malmö: The Maritime Commons: Digital Repository of the World Maritime University. 2015. Available online: https://core.ac.uk/download/pdf/217237205.pdf (accessed on 27 October 2021).
- Stoop, J.A. Maritime accident investigation methodologies. Inj. Control Saf. Promot. 2003, 10, 237–242. [Google Scholar] [CrossRef] [PubMed]
- Awal, Z.I.; Hasegawa, K. A study on accident theories and application to maritime accidents. Procedia Eng. 2017, 194, 298–306. [Google Scholar] [CrossRef]
- Laflamme, L. A better understanding of occupational accident genesis to improve safety in the workplace. J. Occup. Accid. 1990, 12, 155–165. [Google Scholar] [CrossRef]
- Qureshi, Z.H. A Review of Accident Modeling Approaches for Complex Critical Socio-Technical Systems. In Proceeding of the Twelfth Australian Workshop on Safety Critical Systems and Software and Safety-related Programmable Systems; 2007; Volume 86, pp. 47–59. Available online: http://citeseerx.ist.psu.edu/viewdoc/download?doi=10.1.1.294.4125&rep=rep1&type=pdf (accessed on 3 December 2021).
- Khanzode, V.; Maiti, J.; Ray, P.K. Occupational injury and accident research: A comprehensive review. Saf. Sci. 2012, 50, 1355–1367. [Google Scholar] [CrossRef]
- Mullai, A.; Paulsson, U. A grounded theory model for analysis of marine accidents. Accid. Anal. Prev. 2011, 43, 1590–1603. [Google Scholar] [CrossRef] [PubMed] [Green Version]
- Leveson, N. A new accident model for engineering safer systems. Saf. Sci. 2004, 42, 237–270. [Google Scholar] [CrossRef] [Green Version]
- Heinrich, H.W. Industrial Accident Prevention: A Scientific Approach, 2nd ed.; McGraw-Hill Book Company: New York, NY, USA, 1941; ASIN: B0007E73LS. [Google Scholar]
- Hollnagel, E. Risk + barriers = safety? Saf. Sci. 2008, 46, 221–229. [Google Scholar] [CrossRef]
- Reason, J. Managing the Risks of Organizational Accidents, 1st ed.; Ashgate Publishing Ltd.: Aldershot, UK, 1997; ISBN 1840141050. [Google Scholar]
- Hollnagel, E.; Woods, D.D.; Leveson, N. Resilience Engineering: Concepts and Precepts, 1st ed.; Ashgate Publishing Ltd.: Aldershot, UK, 2006; ISBN 9780754649045. [Google Scholar]
- Hollnagel, E. Understanding accidents-from root causes to performance variability. In Proceedings of the IEEE 7th Conference on Human Factors and Power Plants, Scottsdale, AZ, USA, 19 September 2002; IEEE: Scottsdale, AZ, USA, 2002; p. 1. [Google Scholar] [CrossRef]
- Righi, A.W.; Saurin, T.A. Complex socio-technical systems: Characterization and management guidelines. Appl. Ergon. 2015, 50, 19–30. [Google Scholar] [CrossRef] [PubMed]
- Hollnagel, E.; Goteman, O. The Functional Resonance Accident Model. Proceedings of Cognitive System Engineering in Process Plant. 2004, pp. 155–161. Available online: https://citeseerx.ist.psu.edu/viewdoc/download?doi=10.1.1.579.1930&rep=rep1&type=pdf (accessed on 12 September 2021).
- Laracy, J.R. A systems theoretic accident model applied to biodefense. Def. Secur. Anal. 2006, 22, 301–310. [Google Scholar] [CrossRef]
- Larsson, P.; Dekker, S.W.; Tingvall, C. The need for a systems theory approach to road safety. Saf. Sci. 2010, 48, 1167–1174. [Google Scholar] [CrossRef]
- Awal, Z.I.; Hasegawa, K. Accident analysis by logic programming technique. In Paper Submitted for the Proceedings of the European Safety and Reliability Conference (ESREL); Taylor & Francis Group: London, UK, 2015; pp. 13–21. ISBN 978-1-138-02879-1. [Google Scholar]
- Wang, J.; Yan, M. Application of an Improved Model for Accident Analysis: A Case Study. Int. J. Environ. Res. Public Health 2019, 16, 2756. [Google Scholar] [CrossRef] [PubMed] [Green Version]
- Rasmussen, J. Risk management in a dynamic society: A modelling problem. Saf. Sci. 1997, 27, 183–213. [Google Scholar] [CrossRef]
- Puisa, R.; Lin, L.; Bolbot, V.; Vassalos, D. Unravelling causal factors of maritime incidents and accidents. Saf. Sci. 2018, 110, 124–141. [Google Scholar] [CrossRef] [Green Version]
- Hensen, H. Tug Use in Port: A Practical Guide, 1st ed.; The Nautical Institute: London, UK, 2003; ISBN 9781870077392. [Google Scholar]
- Oil Companies International Marine Forum (OCIMF). Prediction of Wind and Current Loads on VLCCs; Witherby and Company: London, UK, 1994; ISBN 9781856090421. [Google Scholar]
- Gerr, D. Propeller Handbook: The Complete Reference for Choosing, Installing and Understanding Boat Propellers; International Marine Ragged Mountain Press: Camden, NJ, USA, 2001; ISBN 0071381767. [Google Scholar]
- Vryhof Manual—The Guide to Anchoring. Vryhof Anchors B.V. 2015. Available online: https://www.plaisance-pratique.com/IMG/pdf/Vryhof_Anchor_Manual2015.pdf (accessed on 15 September 2021).
- Shin, H.; Seo, B.; Lee, J. Experimental study of embedding motion and holding power of drag embedment type anchor on hard and soft seafloor. Int. J. Nav. Archit. Ocean. Eng. 2011, 48, 183–187. [Google Scholar] [CrossRef] [Green Version]
- Hancox, M. Oilfield Seamanship Series-Volume 3: Anchor Handling; Oilfield Publications: Ledbury, UK, 1994; ISBN 9781870945493. [Google Scholar]
- Hinz, E. The Complete Book of Anchoring and Mooring, 2nd ed.; Schiffer Publishing Ltd.: Atglen, PA, USA, 2009; ISBN 0870335391. [Google Scholar]
- Ren, Y.X.; Lei, Z.M.; Sun, L.Q.; Yan, S.W. Model tests of dragging hall anchors in sand. J. Mar. Sci. Technol. 2016, 24, 4. [Google Scholar] [CrossRef]
- Brix, J. Maneuvering Technical Manual; Seehafen Verlag: Hamburg, Germany, 1987; Volume 36, ISSN 0036-603X. [Google Scholar]
- Edwards, R.Y. Hydrodynamic Forces on Vessels Stationed in a Current. In Proceedings of the 17th Annual Offshore Technology Conference, OTC 1985, Houston, TX, USA, 6–9 May 1985; OTC: Houston, TX, USA, 1985; pp. 99–105. [Google Scholar] [CrossRef]
- Gunnu, G.; Wu, X.; Moan, T. Anchor handling vessel behavior in horizontal plane in a uniform current field during operation. In Proceedings of the 2nd Marine Operations Speciality Symposium, Singapore, 6 August–8 August 2012; Research Publishing Services: Singapore, 2012. [Google Scholar] [CrossRef]
- Remery, G.; Oortmerssen, G. The Mean Wave, Wind and Current Forces on Offshore Structures and their Role in the Design of Mooring Systems. In Proceedings of the Offshore Technology Conference, Houston, TX, USA, 29 April–2 May 1973; OTC 1741. [Google Scholar] [CrossRef]
- Batista, M.; Perkovič, M. Computation of mooring chain with the touchdown on an inclined seabed. J. Mar. Eng. Technol. 2019, 29, 1–14. [Google Scholar] [CrossRef]
- Gucma, L.; Perkovič, M.; Przywarty, M. Assessment of influence of traffic intensity increase on collision probability in the Gulf of Trieste. Annu. Navig. 2009, 15, 41–48. Available online: http://yadda.icm.edu.pl/baztech/element/bwmeta1.element.baztech-article-BATA-0011-0020 (accessed on 21 September 2021).
- Vidmar, P.; Perkovič, M.; Gucma, L.; Łazuga, K. Risk Assessment of Moored and Passing Ships. Appl. Sci. 2020, 10, 6825. [Google Scholar] [CrossRef]
| Publisher’s Note: MDPI stays neutral with regard to jurisdictional claims in published maps and institutional affiliations. |
© 2021 by the authors. Licensee MDPI, Basel, Switzerland. This article is an open access article distributed under the terms and conditions of the Creative Commons Attribution (CC BY) license (https://creativecommons.org/licenses/by/4.0/).


