
On Correlation between Wind and Wave Storms


Natural Ocean Engineering Laboratory, Mediterranea University of Reggio Calabria, 89124 Reggio Calabria, Italy
*
Author to whom correspondence should be addressed.
J. Mar. Sci. Eng. 2021, 9(12), 1426; https://0-doi-org.brum.beds.ac.uk/10.3390/jmse9121426
Submission received: 3 November 2021
/
Revised: 26 November 2021
/
Accepted: 8 December 2021
/
Published: 13 December 2021
(This article belongs to the Special Issue The Use of Storm Models in Marine Engineering Practical Problems)
Abstract
:The paper is focused on the formulation of an adequate criterion for associating wave storm events to the generating wind storm ones, and on the study of correlation between their characteristic parameters. In this context, the sea storm definition commonly used for storm identification from significant wave height data is adapted for wind storm, by processing wind speed data. A sensitivity analysis is proposed as function of the storm thresholds aiming at identifying optimal combination of wind speed and significant wave height thresholds allowing the association of relatively large number of events ensuring high correlation between wind and wave storm parameters. The analysis is carried out using as input data wind speeds and significant wave heights from four meteorological (buoys and anemometers) stations of the National Data Buoy Center moored off the East Coast of the United States. Results reveal that an optimal threshold combination is achieved assuming both wind speed and significant wave height threshold as 1.5 time their respective averages.
1. Introduction
The study of offshore climate plays a key role for any activity developed in offshore sea environment, including navigation, oil and gas, and offshore wind and wave farms. In this context the research community focuses on a variety of topics that ranges from the forecasting of environmental data [1,2,3,4,5] to the investigation of climate changes [6,7,8,9], energy resource assessment [10,11,12,13,14], simulation methods [15,16], and design and operation of offshore systems [17,18,19]. With regard to offshore structures and energy systems, the knowledge of climatic events occurring and their impact on any device is paramount both at design and at operational stages. Usually, one refers to environmental states within a time duration compatible with the stationarity assumption, described by two sea state parameters—which could be the significant wave height and the spectral peak period—and a wind state with given average wind speed and turbulence intensity. Among all the possible states, the most representative ones are selected from in-situ scatter diagram at site. However, it could be interesting to investigate the system response under nonstationary conditions, identified as sequences of environmental states exceeding critical thresholds and defined as storms. In order to do so, an in-depth study of such events and their characteristics is needed. The separation of wind events from long wind speed data sets is a crucial step for conducting both statistical and wind-excited structural response analyses. The approaches employed for this kind of extrapolation differ from each other if the phenomenon is investigated from a meteorological or engineering perspective. In the first case, wind events identification is performed by analyzing related meteorological parameters [20,21,22,23,24,25,26,27]. In the second approach, wind peaks are extrapolated from long wind speed time series with a systematic selection method without any consideration of climatic aspects, and are used for long-term statistical estimations and design value calculation; among these selection criteria are: Gumbel’s method [28] in which the largest values per fixed time period (e.g., one year) is selected; its extension with the selection of the r-largest value over a given time duration [29]; the method of independent storms [30,31] that uses a period of wind speeds below a selected (low) threshold to separate storms; and the Peak-over-threshold (POT) method that extracts maxima from sample data series to produce a series of extreme values above a chosen, adequately high, threshold [32,33].
In this paper, a criterion for associating a wave storm to its generating wind storm is formulated, starting with results achieved through wind and wave data analysis. The last is based on the storm concept intended as sequence of stationary wind or wave states exceeding pre-established critical thresholds. Specifically, it is aimed at identifying the wind and wave thresholds such that it is possible to associate a quite large number of events ensuring a high correlation between the storms’ parameters. Trends between the wind and wave storm parameters are investigated as well. The paper is organized as follows: section 2 describes the data used and the site, section 3 introduces the storms identification and association criterion, section 4 shows data analysis on the basis of the proposed criterion, and section 5 illustrates some concluding remarks. Results of this analysis are useful for survivability, reliability, and operability assessments of combined wind and wave systems, which take advantage of the complementarity of these resources. In this regard, the understanding of how nonstationary wind and wave events follow each other, their shift in terms of beginning time, time lag between peaks, and correlation over common time window where both persist over certain ranges of values, represent key elements in the development of combined technologies. Further, they can provide preliminary information on how to couple wind and wave states over longer time interval than those commonly considered in response assessments of offshore wind systems, for which wind and waves represent the main load factors.
2. Wind and Wave Data and Study Area
Data used as input of the analysis proposed in this work are those provided by the National Data Buoy Center (NDBC) (https://www.ndbc.noaa.gov/ (accessed on 8 December 2021)). The NDBC has deployed buoys around the USA coastline and Great Lakes since 1970s. From that date, the NDBC has deployed at least eight directional buoys and over a hundred wave measurement stations for operational and experimental use, covering areas from the western Atlantic to the Pacific Ocean around Hawaii, and from the Bering Sea to the South Pacific. Stations have been subject to modifications throughout the years, due to instrumental improvements and changing data storage systems as well. The NDBC time series contain wave data in terms of significant wave height, dominant (peak spectral) and average (mean) periods, mean wave direction at the peak frequency, spectral wave density data, the four Fourier directional parameters for spectral wave direction data, and meteorological data as wind direction, wind speed, wind gust, air pressure at sea level, air temperature, and sea surface temperature. In this work only significant wave height and wind speed data are considered. Regarding the wind speed data, it is worth to mention that anemometer heights on NDBC buoys vary according to buoy type. Anemometers on 3 m discus and 6 m Navy Oceanographic and Meteorological Automatic Device (NOMAD), buoys are located approximately 5 m above the waterline. Anemometers on 10 and 12 m buoys are located 10 m above the waterline. Anemometer heights at Coastal-Marine Automated Network (C-MAN) stations vary widely, depending on site structure and elevation above sea level. The NDBC adjusts wind speeds to conform to the universally accepted reference standard of 10 m. NDBC also adjusts wind speeds to 20 m, a height closer to that of typical ship anemometers. These standardized wind speeds are stored in a different file than the one which can be downloaded in the historical data page, where only unadjusted data are included. The latter are those used in this paper for the coupled analysis of wind and wave storm events. Four buoy stations were selected off the East Coast of the United States: 44004, 44008, 44014, and 41025. The time duration covered by each time series data and station characteristics are summarized in Table 1.
This study area was selected because of the great interest faced by companies in proposing new offshore wind farm projects and it is already involved in pilot projects. Among them, the Coastal Virginia Offshore Wind (CVOW) located about 43 km (27 mi) off the coast of Virginia Beach, Virginia, US, whose initial phase, was a 12 MW pilot project constructed in 2020, consisting of two 6-megawatt offshore wind turbines [34,35]. Another example is Sunrise Wind [36,37], a 880 MW offshore wind farm to be developed in New York state, about 48km east of Montauk Point on Long Island.
The results of the analysis carried out in this work could be useful in the context of reliability and operability assessment of existing offshore wind farms, for designing and planning new wind farms, and for the integration of systems with wave energy converters and the design of combined technologies.
3. Methodology: Wind and Wave Storm Identification and Association Criteria
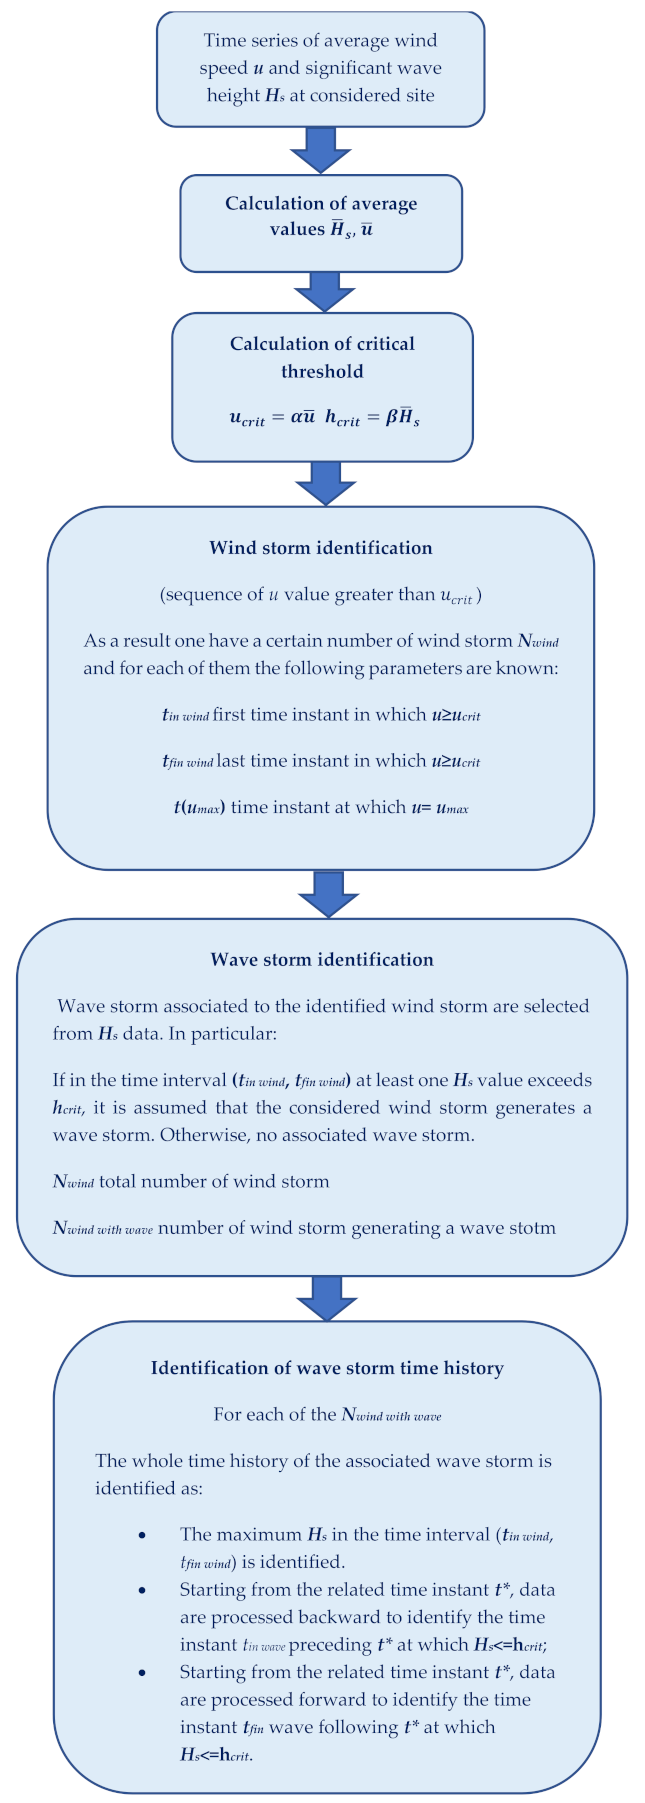
In this section the method used for identifying storm events and the association criteria of a wave event to its preceding wind one will be described. Note that in the context of this work the term “storm” refers to a nonstationary either wind or wave event, which is characterized by growth, peak, and decay stages (see Figure 1). In this regard, for what concerns the wind storm extrapolation, it is performed regardless to Beaufort’s scale [38,39,40]. Specifically, the sea storm definition adopted in long-term analysis via Storm Models [41,42,43] is adjusted for extrapolation of wind storms from wind speed data time series. Following the above-mentioned approach, a sea storm is a sequence of sea state during which the significant wave height Hs exceeds a given threshold named critical and does not fall below it for a time interval greater than twelve hours. This definition takes into account that a calm period may occur for a maximum duration of twelve hours and the storms characterized by this condition may have more than one peak. In this paper, the above definition is slightly reviewed removing the calm condition and considering only the part of the storm characterized by the sequence of sea states above the critical threshold hcrit. Thus, when Hs falls below the critical threshold it is considered the end of the storm. The adaptation of this definition to wind storm events simply consists in repeating the sea storm definition by replacing the significant wave height Hs and the critical threshold hcrit with the average wind speed u and critical wind speed ucrit, respectively. The critical thresholds of both average wind speed and significant wave height are fixed as equal or multiple times that of their averages (calculated from the whole time series) at site. The criterion adopted in this paper for storm identification and association is described in the flow chart represented in Figure 2. It involves as first steps, the calculation of average values of wind speed and significant wave height at site and the related critical thresholds ucrit, hcrit. Subsequently, the identification of sequences of wind storm events according to the definition above is performed. Then, for each wind event the related generated sea storm, if any, is extrapolated from Hs data. Specifically, considering the time interval (tin wind, tfin wind) (being tin wind, tfin wind the starting time and final time instants of the wind storm, respectively) covering the whole wind storm evolution (growth, peak and decay) if an excessed of at least one value of Hs over its critical threshold is detected it is assumed the wind storm generates a wave storm. Otherwise, no wave storm is generated and the considered wind storm is excluded from the correlation analysis. Furthermore, only events characterized by a duration of more that twelve hours are considered as relevant ones. Another important aspect is related to the time spacing between two successive storm events (either wind or wave). In this regard, it is assumed that only events with a minimum time separation of 48 h are relevant, in agreement with previous studies [31,44].
4. Data Analysis
This section proposes data analysis of wind and wave storms based on the criterion presented in the previous section. Specifically, wind and wave storms are extrapolated from time series of average wind speed and significant wave height, respectively, according to the proposed criterion. Then, for each sample wind and wave storm, correlation between relevant storm parameters is investigated. This analysis is essentially divided in two main parts: the first part deals with the proposition of a sensitivity analysis to the couple of thresholds (hcrit, ucrit) aiming to identify their most adequate combination; the second shows the correlated storm parameters trends when the optimal couple (hcrit, ucrit) is considered in storms identification and association.
4.1. Variability of Storm Number and Correlation Parameters Assuming Different Thresholds
In this section, the sensitivity of wind and wave events to their critical thresholds (hcrit, ucrit) is investigated for our storm sample. In this regard, both critical wind speed and significant wave height thresholds are correlated to the average value of related variables (see Table 2). In particular, the following ratios between critical thresholds and average values of both wind speed and significant wave height are considered: 1, 1.5, 2, 2.5. The effects of all the possible combinations of these thresholds are examined. For each couple of thresholds (hcrit, ucrit) the analysis proceeds as follows:
- Wind storms are identified as a “sequence of wind states with average wind speed exceeding the critical threshold ucrit”. Those having a too short duration (less than 12 h) and of those not satisfying the condition of established minimum time separation (48 h intended as time distance between peaks) are removed. Note that, when two wind storm peaks have a time separation less than 48 h, the one characterized by the highest value of maximum wind speed is kept in the sample and the other one is eliminated.
- The storm sample prepared following the procedure described above is divided in two subsamples: one including the wind storms during whose time window none of the significant wave height values exceed the critical threshold hcrit, and the other constituted by all wind storms during which at least one significant wave height value is over hcrit. The last subsample is assumed to be made up of those wind storms which generate a wave storm.
- For each wind storm in the second subsample the corresponding complete storm event is extrapolated from the significant wave height time series. Specifically, starting from the time instant at which the maximum Hs value is detected in the wind storm time window, Hs data are processed backward and forward the preceding and the following time instants at which Hs is below hcrit. Note that, the last two time instants define the time window over which the wave storm event evolves and the related duration.
- Finally, some parameters are calculated to characterize the events. They are: maximum wind speed umax in the wind storm, wind storm duration Dwind, maximum significant wave height Hsmax in the wave storm, wave storm duration Dwave, time distance Δt umax − Hs max between umax, and Hs max. Note that, Δt umax − Hs max is calculated as t (Hsmax) − t(umax), thus if Hs max occurs after umax it is greater than 0, negative if umax occurs after Hs max, and equal to 0 if they occur simultaneously.
At this stage of the analysis, for each couple (hcrit, ucrit) the following quantities are investigated:
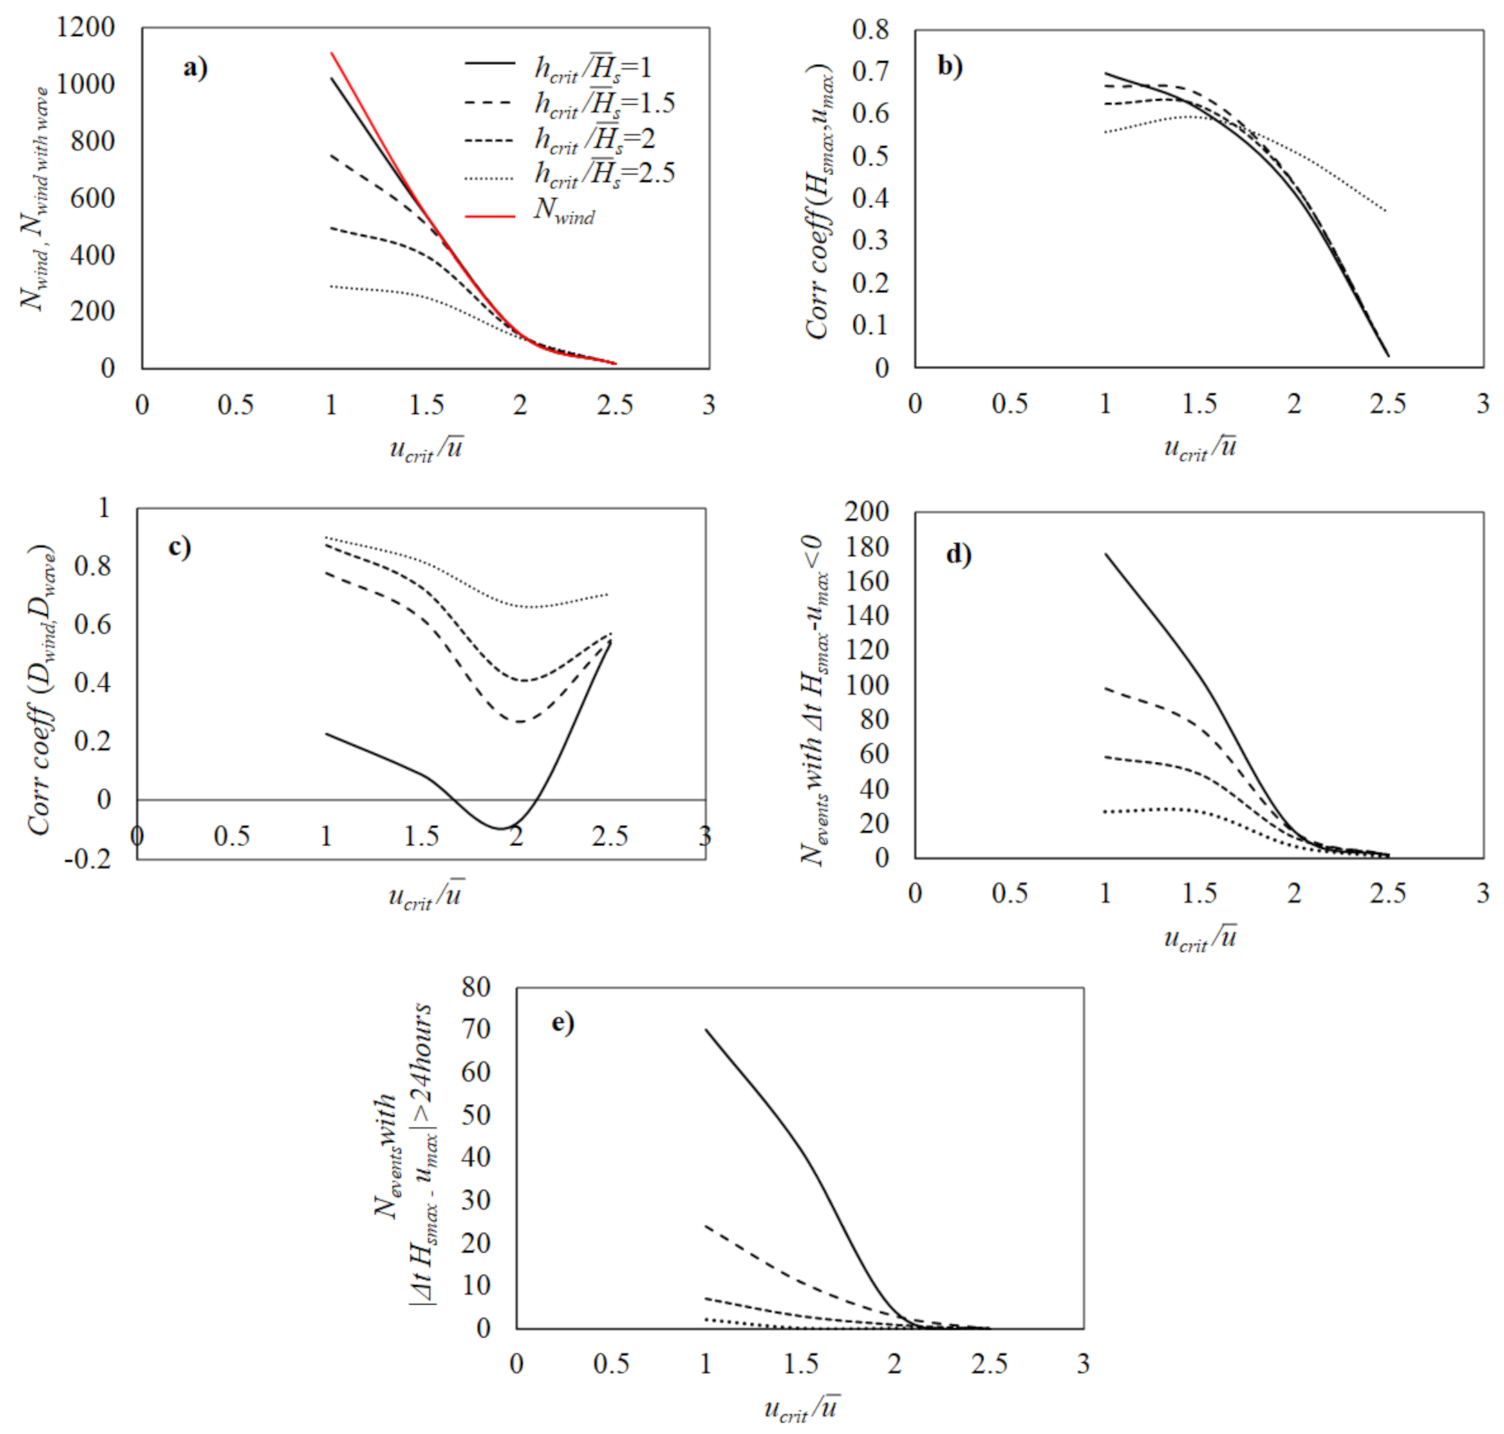
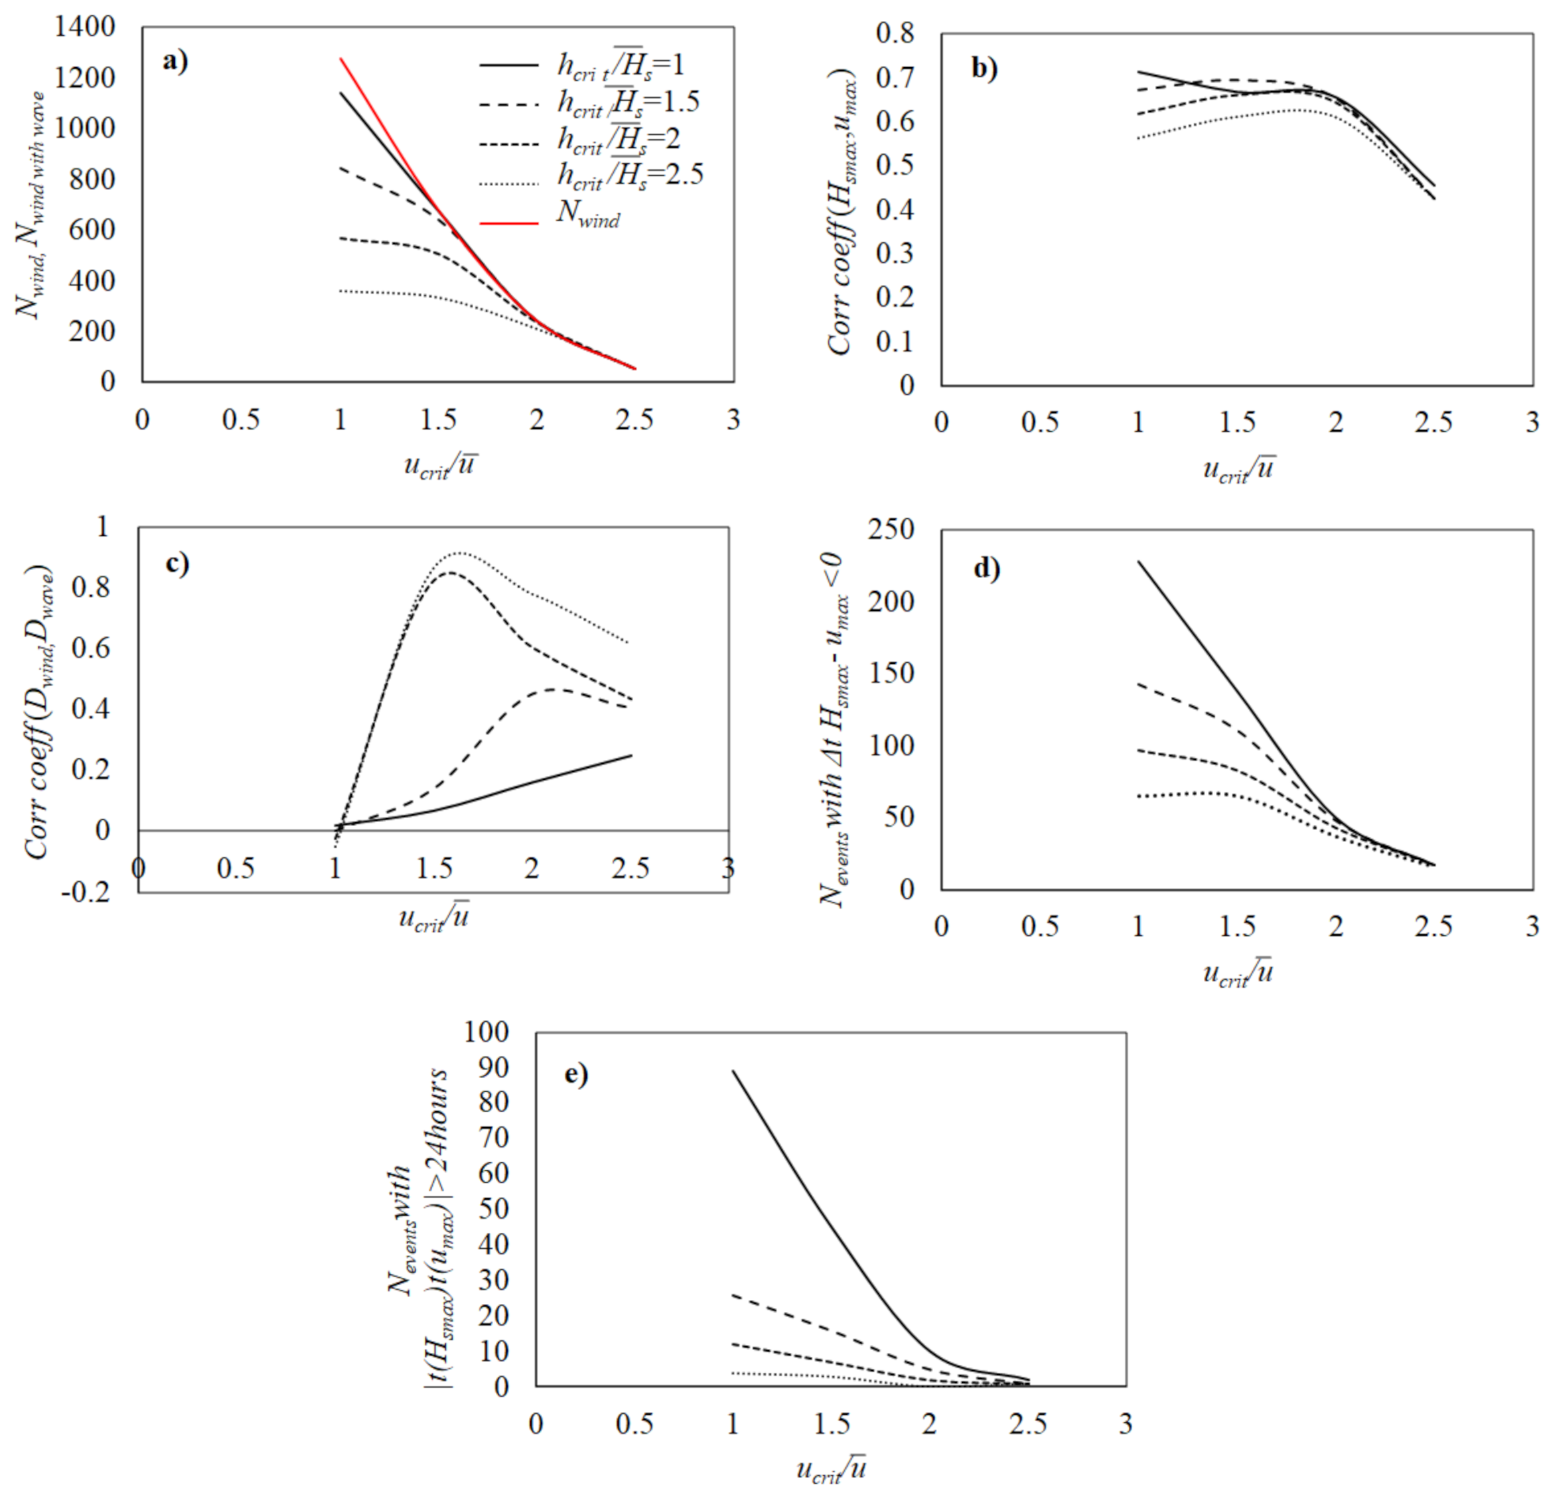
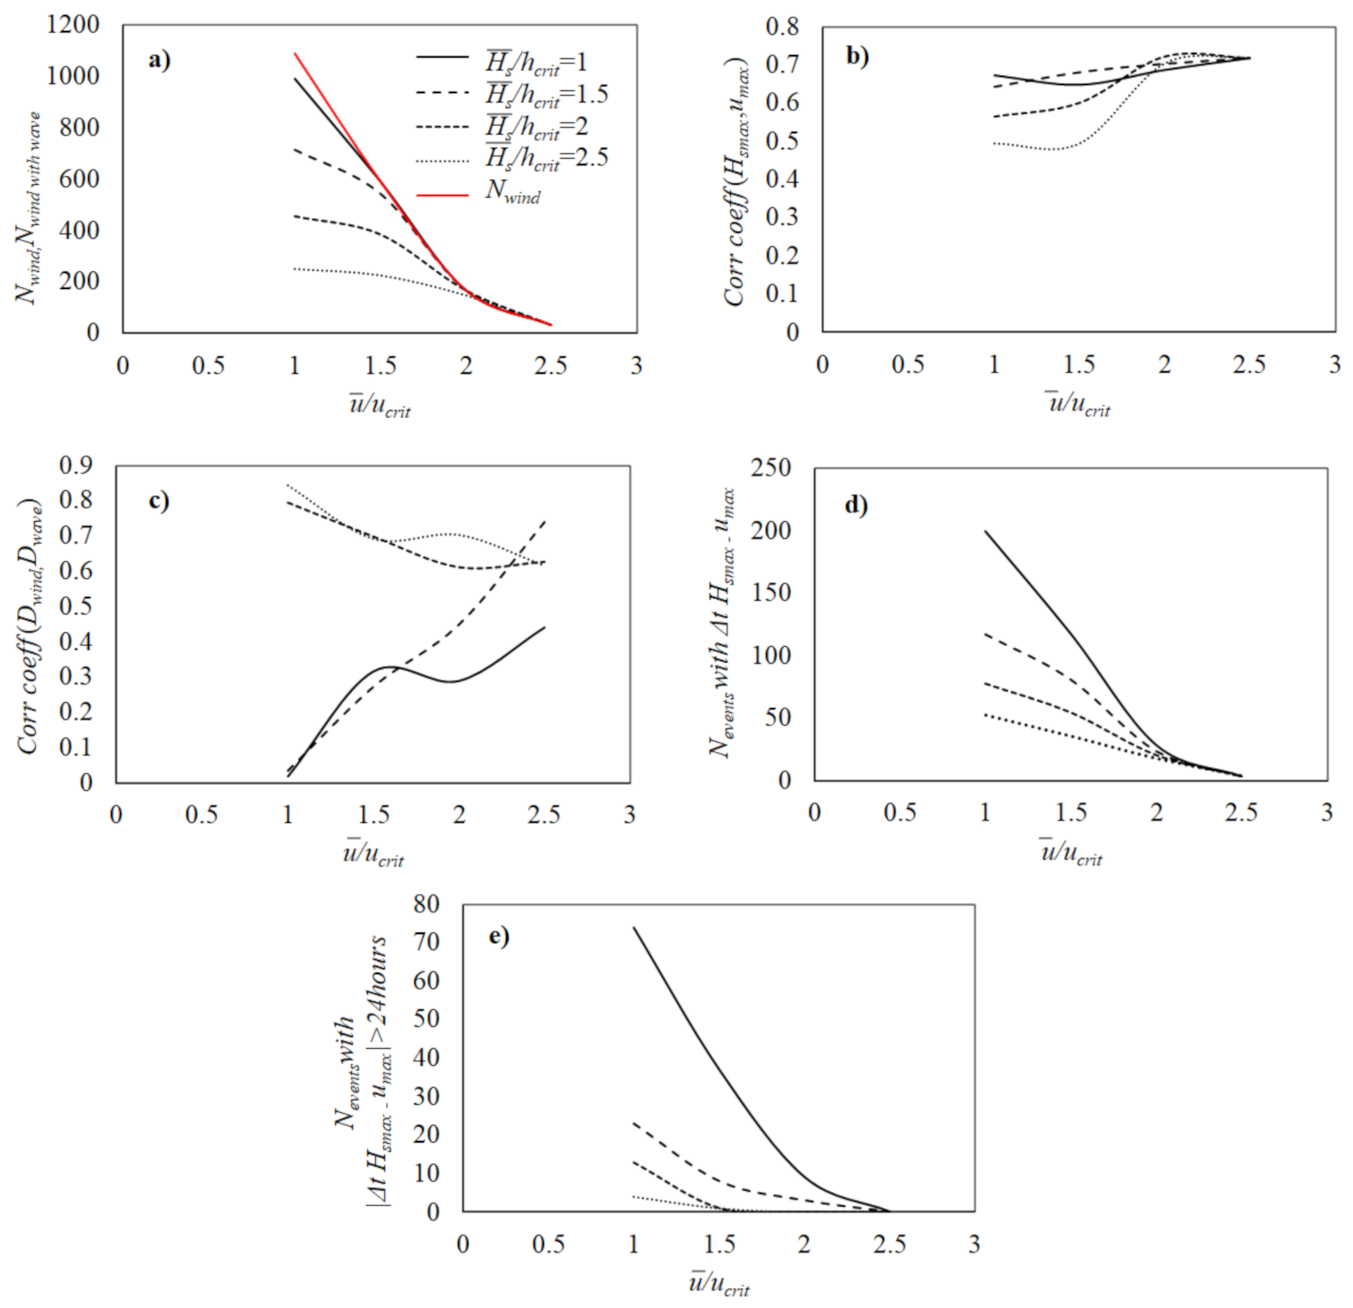
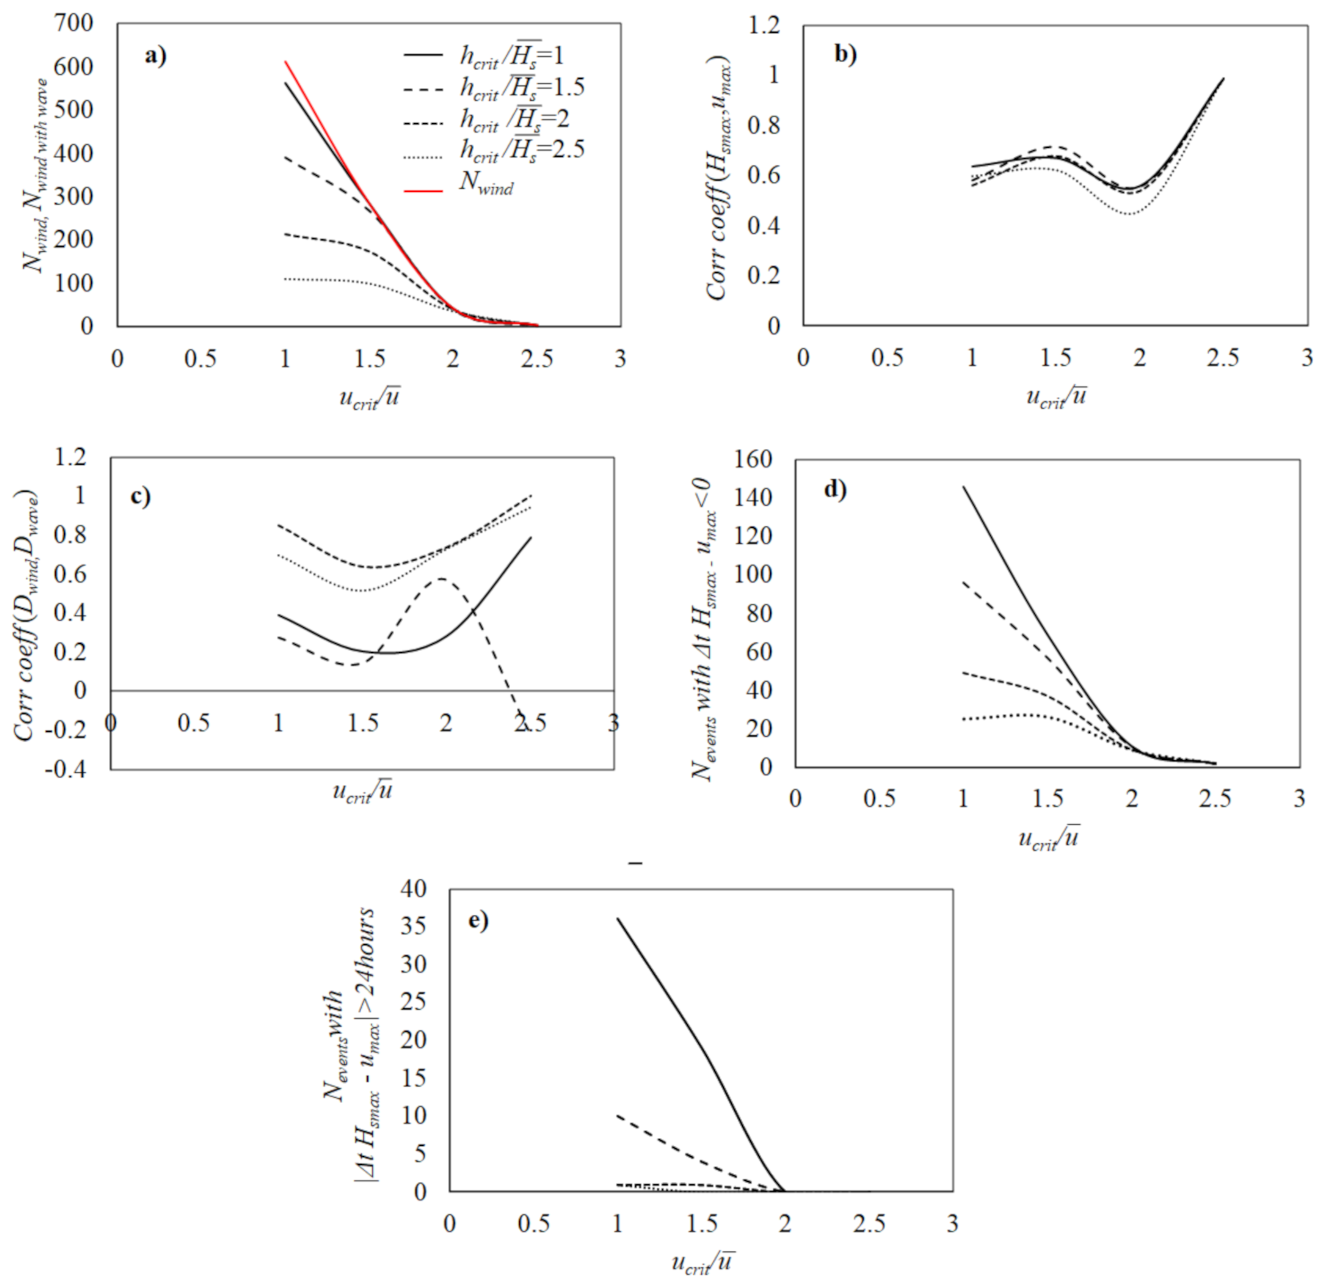
A comparison among these Figures shows that, for the investigations at points 1, 4, and 5 general considerations can be developed, while for points 2 and 3 the trend is different from one location to another. In general, from Figure 3, Figure 4, Figure 5 and Figure 6a it is seen that the events number decreases as the threshold increases, as expected. For a fixed ratio < 2, the number of wind events generating a wave storm increases as the as the ratio decreases, while for both ratios , it is possible to associate a wave storm to each identified wind storm. Certainly, by fixing high ratios , the storm sample is small and it does not include the less intense and moderate wind and wave storms, but only extreme events. For a more adequate and numerous sample, one should select lower ratios of both and .An appropriate thresholds combination could be created by fixing the wind ratio equal to 1.5 and the ratio of the significant wave height in the range (1–2), or alternatively, by taking both and equal to 1 or 1.5. The assumption of the last option above leads to a good correlation of maximum wind speed umax and significant wave height Hsmax, which in such situation is always between 0.6 and 0.7 (see Figure 3, Figure 4, Figure 5 and Figure 6b). In this regard, it is important to say that the correlation of Hsmax and umax does not exhibit a regular trend and varies from one location to another. However, for wind ratios < 2 it keeps itself always above 0.5 (see Figure 3, Figure 4, Figure 5 and Figure 6b). The correlation between wind and wave storm duration is completely irregular and does not show any particular trend: sometimes it is very high and sometimes it can be very low. Then, focusing on the time distance Δt umax −Hs max between umax and Hsmax, from Figure 3, Figure 4, Figure 5 and Figure 6d it could be noticed that the peak of wind speed could proceed or follow that of significant wave height. Another insight into Figure 3, Figure 4, Figure 5 and Figure 6d is that the number of events characterized by Δt umax − Hs max (Hs peak occurring before u peak) decreases with increasing and , and for does not depend upon the significant wave height ratio . Lastly, observing Figure 3, Figure 4, Figure 5 and Figure 6e it is seen that Δt umax − Hs max can be greater than one day and the number of events characterized by such distance between peaks decreases when both and increase up to 2, while for higher values it tends to zero. This result is quite intuitive because with such high ratios the sample includes only extreme events in which it is expected wind speed and significant wave height peaks to be very close to each other (see Figure 1). In light of the results analyzed in this section, a suggestable combination of wind and wave ratios and could be achieved by assuming both of them to be equal to 1.5. In this regard, it is worth mentioning that the value of 1.5 is the one generally used for sea storm identification. Furthermore, any combination of and in the range (1–1.5) is adequate for reliable analysis.
4.2. Trend and Correlation between Wind and Wave Storm Parameters Associated with Selected Thresholds
Based on the analysis proposed in previous section, the trends of relevant storm parameters are investigated, taking as wind and wave ratios and with a value of 1.5. Starting from our wind and wave storm sample, for each event, the following parameters are determined:
- Maximum wind speed umax;
- Wind storm duration Dwind;
- Maximum significant wave height Hsmax;
- Wave storm duration Dwave;
- Time distance Δtu max − Hs max between wind storm and wave storm peaks (Hsmax, umax);
- Standard deviation of wind speed σwind;
- Standard deviation of significant wave height σwave;
- Correlation coefficient ρ(u(t), Hs(t)) between time histories of wind speed and significant wave height over a time window including the whole evolution of both wind and wave storms. In this regard it is important to specify that this time window could include a time interval in which either the wind speeds or the significant wave heights are below their critical thresholds.
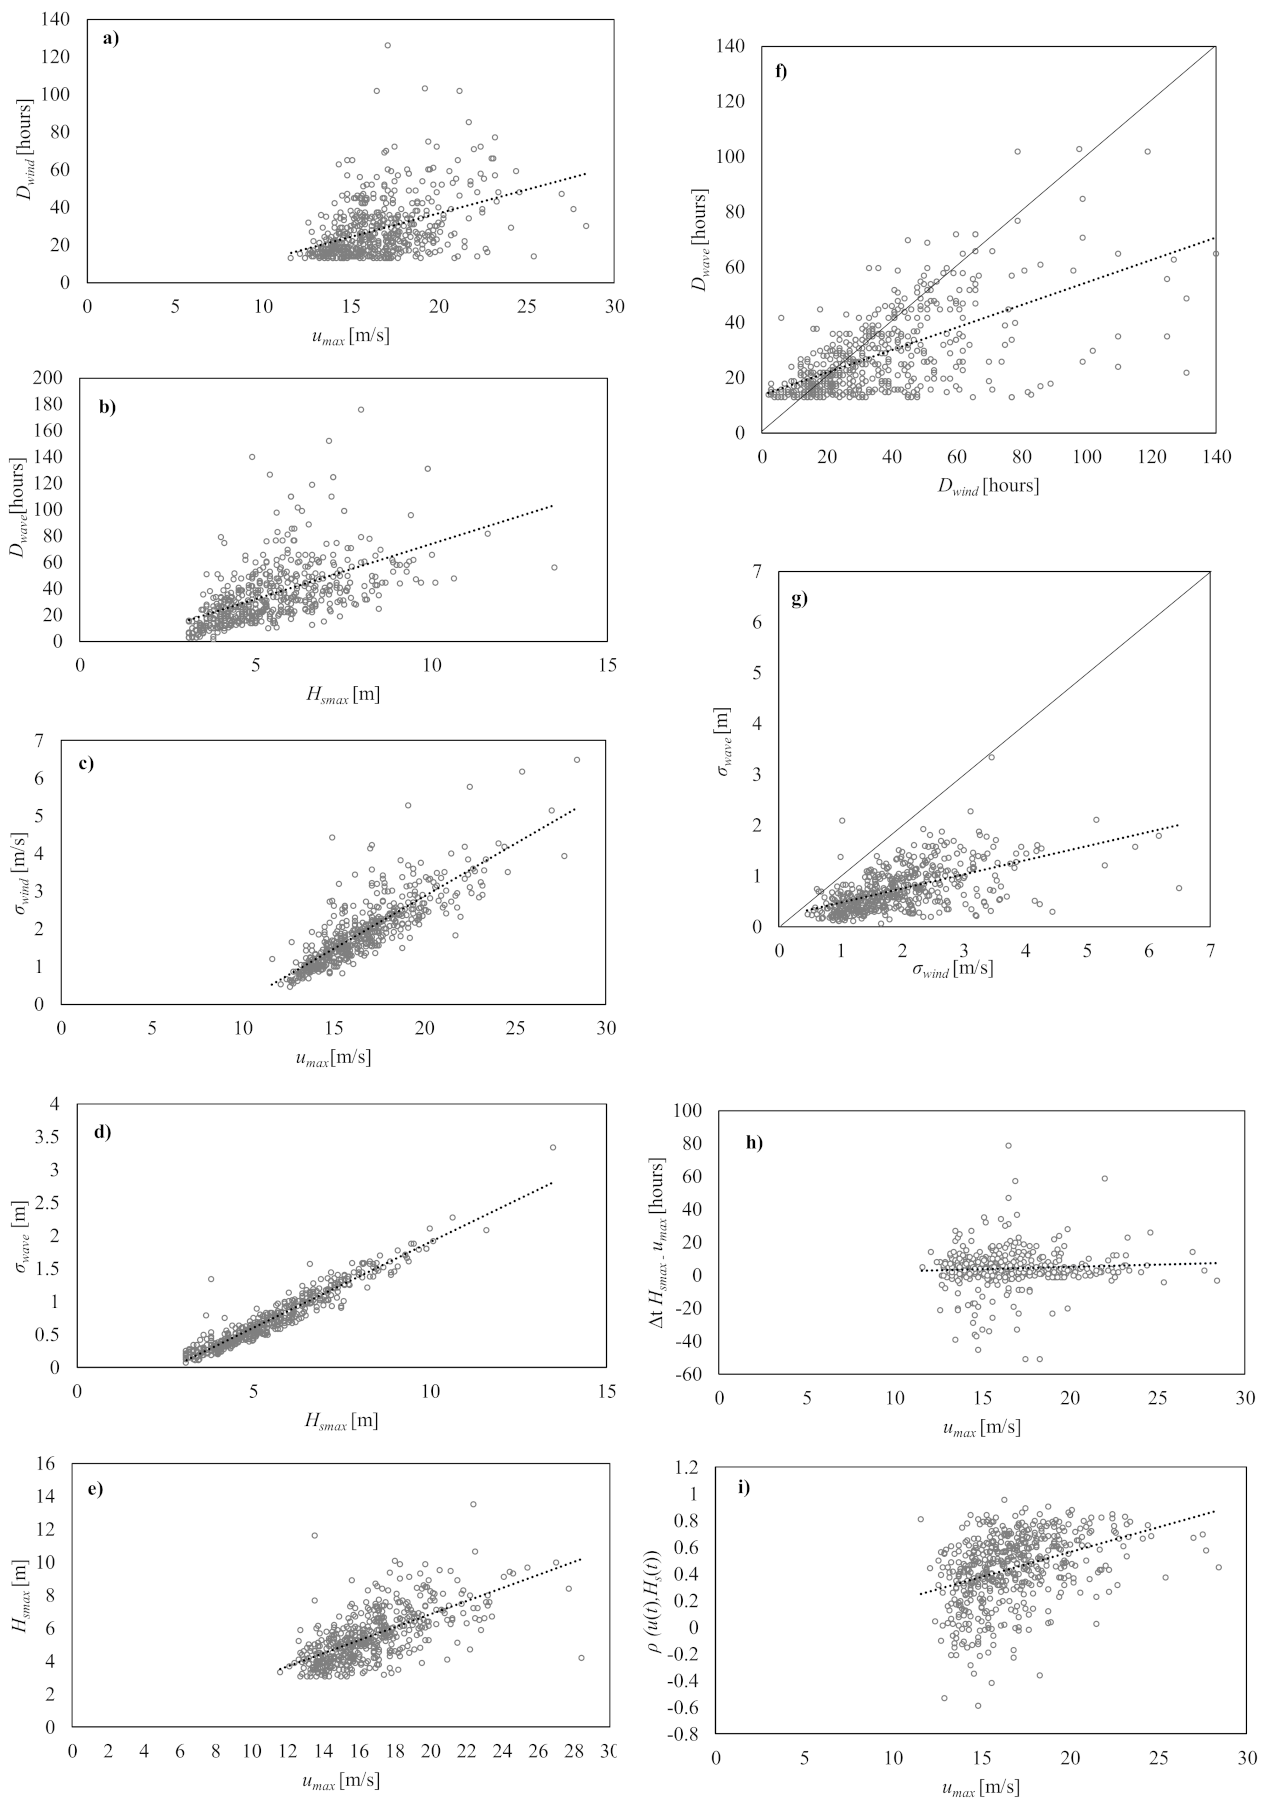
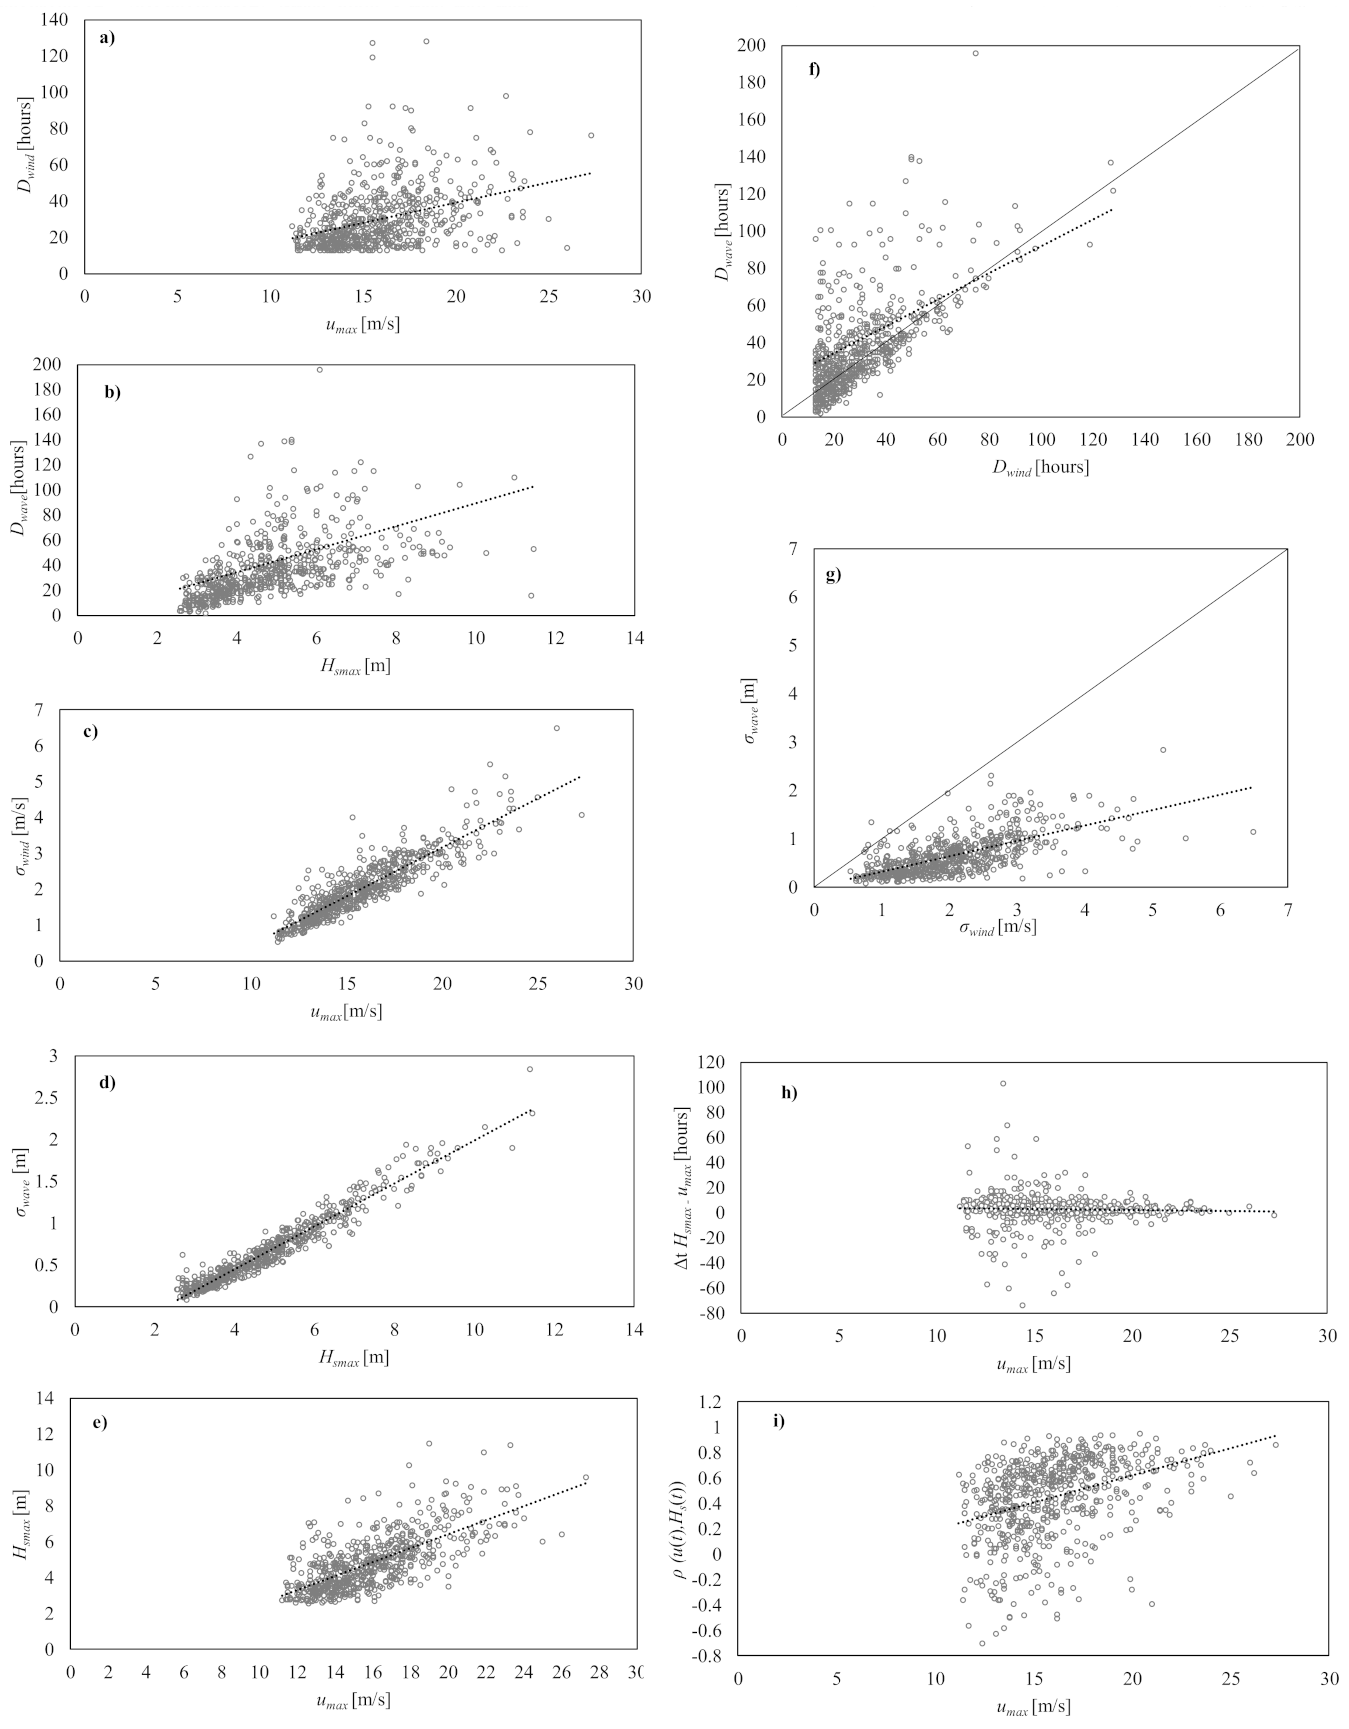
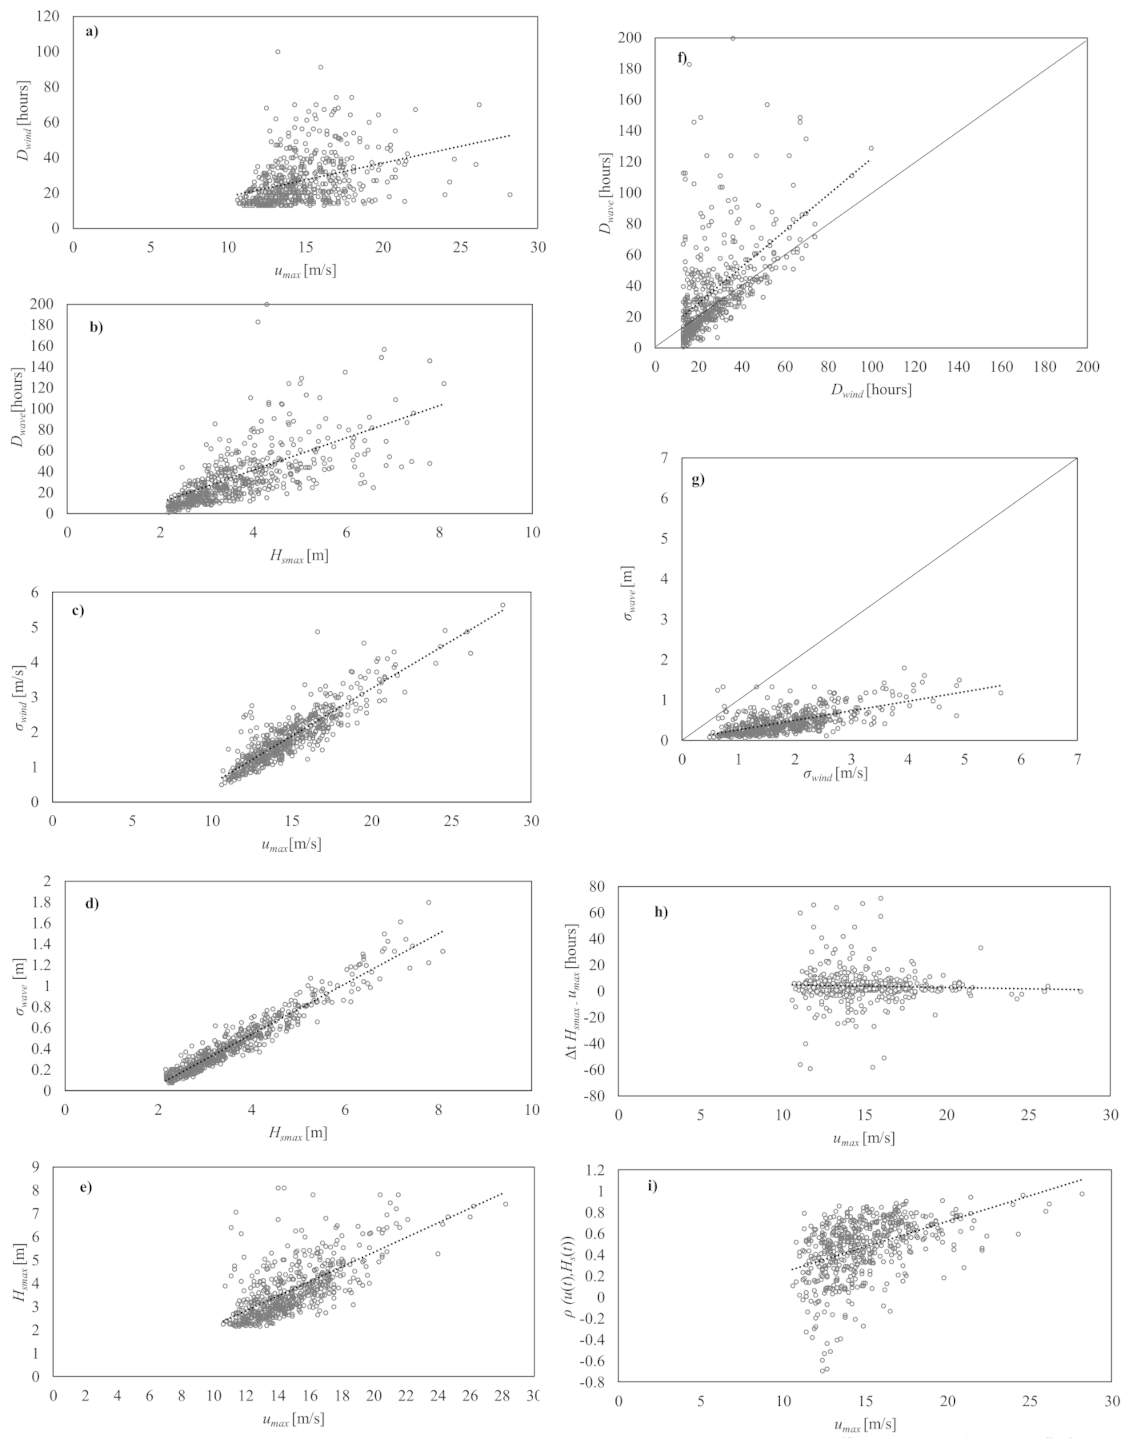
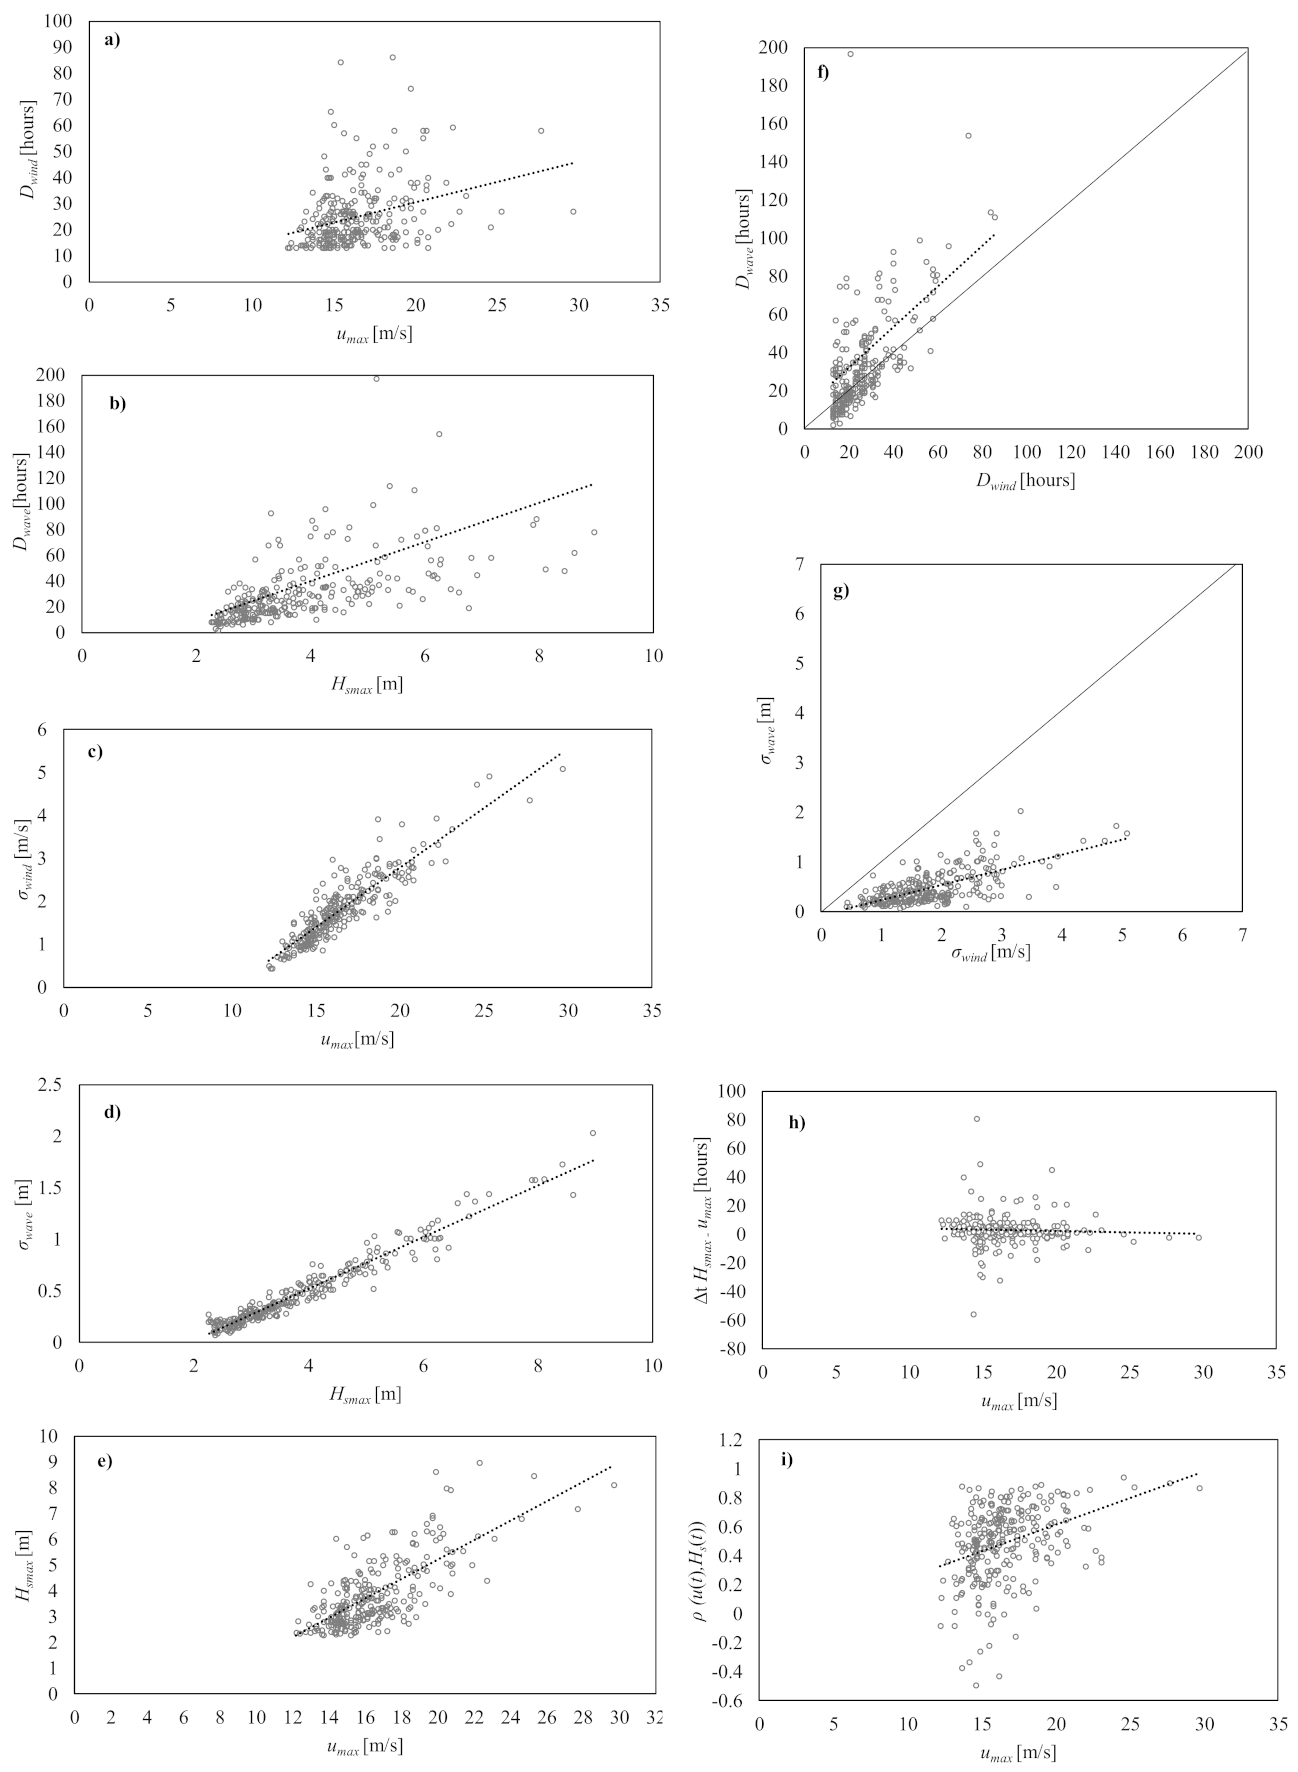
The estimations listed above are used to draw graphics to elucidate some interesting trends. Specifically, Figure 7, Figure 8, Figure 9 and Figure 10a–d, show wind storm duration Dwind versus maximum wind speed umax, wave storm duration Dwave versus maximum significant wave height Hsmax, wind speed standard deviation σwind versus maximum wind speed umax, and significant wave height standard deviation σwave versus maximum significant wave height Hsmax. Data summarized in these figures essentially confirm some well known trends. For instance, both wind and wave storm durations increase with the storm intensity and standard deviations of both wind speed and significant wave height increase as well. Figure 7, Figure 8, Figure 9 and Figure 10e–i show the relationship between wind and wave storm parameters. In detail, in Figure 7, Figure 8, Figure 9 and Figure 10e is represented Hsmax versus umax, in Figure 7, Figure 8, Figure 9 and Figure 10f Dwave versus Dwind, in Figure 7, Figure 8, Figure 9 and Figure 10g σwave versus σwind, in Figure 7, Figure 8, Figure 9 and Figure 10h Δt umax − Hs max versus umax, and in Figure 7, Figure 8, Figure 9 and Figure 10i ρ(u(t), Hs(t)) versus umax. Looking at this last group of figures, some general considerations can be developed:
- The wave storm peak Hsmax increases with the wind storm peak umax;
- The wave storm duration Dwave increases with the wind storm duration Dwind;
- Considering a given storm event the significant wave height standard deviation σwave is always less than the wind speed σwind standard deviation. This result is interesting in the context of offshore renewables energies because it indicates which energy source is more regular and justifies the interest in combined systems to the aim of smoothing the power output.
- The time distance Δt umax − Hs max may be greater than one day, in most of the storms shorter than 10 h in absolute value;
- The correlation ρ(u(t), Hs(t)) increases with the wind storm intensity umax.
5. Conclusions
In this paper, a criterion is proposed to identify and associate wind and wave storm events, based on a sensitivity analysis as a function of wind and wave critical threshold. An optimal combination of such thresholds is suggested as a result of the proposed analysis. It consists of assuming both wind and wave critical thresholds as 1.5 times the average of wind speed and significant wave height, respectively. Thanks to this assumption, it is possible to associate a large number of correlated wind and wave storm events. Furthermore, the relationship between wind and wave storm parameters are investigated with these thresholds, elucidating that, as the wind speed increases the significant wave height increases as well. However, the peak of the significant wave height does not always occur after that of the wind speed. In general, the structure of a wind storm is very similar to that of a wave storm. In addition, the wind speed is characterized by a higher variability with respect to the significant wave height. All the results mentioned above could be useful both for sample extrapolation in the context of a statistical analysis, offshore energy resource assessment, and wind and wave condition combination for response analysis of offshore structures.
Author Contributions
Conceptualization, methodology, investigation, original draft preparation, V.L.; review, editing and supervision F.A. All authors have read and agreed to the published version of the manuscript.
Funding
Valentina Laface acknowledges financial support from the project PON-AIM 1805501-2 (Line 1), financed by the Italian Minister of University and Research (MIUR).
Data Availability Statement
The data used in this paper are available at https://www.ndbc.noaa.gov/ (accessed on 8 December 2021).
Conflicts of Interest
The authors declare no conflict of interest.
References
- Shuyi, Z.; Brandon, J.B.; Wenjin, S.; Yang, Z.; Wenhong, X.; Changming, D. Improving Significant Wave Height Forecasts Using a Joint Empirical Mode Decomposition–Long Short-Term Memory Network. J. Mar. Sci. Eng. 2021, 9, 744. [Google Scholar] [CrossRef]
- Taylor, J.W.; Jeon, J. Probabilistic forecasting of wave height for offshore wind turbine maintenance. Eur. J. Oper. Res. 2018, 267, 877–890. [Google Scholar] [CrossRef]
- Zhou, S.; Xie, W.; Lu, Y.; Wang, Y.; Zhou, Y.; Hui, N.; Dong, C. ConvLSTM-Based Wave Forecasts in the South and East China Seas. Front. Mar. Sci. 2021, 8, 680079. [Google Scholar] [CrossRef]
- Bell, R.; Kirtman, B. Seasonal Forecasting of Wind and Waves in the North Atlantic Using a Grand Multimodel Ensemble. Weather Forecast. 2019, 34, 31–59. [Google Scholar] [CrossRef]
- Chen, J.; Zeng, G.Q.; Zhou, W.; Du, W.; Lu, K.D. Wind speed forecasting using nonlinear-learning ensemble of deep learning time series prediction and extremal optimization. Energy Convers. Manag. 2018, 165, 681–695. [Google Scholar] [CrossRef]
- Reguero Borja, G.; Losada, I.J.; Méndez, F.J. A recent increase in global wave power as a consequence of oceanic warming. Nat. Commun. 2019, 10, 205. [Google Scholar] [CrossRef] [PubMed] [Green Version]
- Young, I.R.; Zieger, S.; Babanin, A.V. Global Trends in Wind Speed and Wave Height. Science 2011, 332, 451–455. [Google Scholar] [CrossRef] [PubMed]
- Timmermans, W.; Gommenginger, C.P.; Dodet, G.; Bidlot, J.-R. Global Wave Height Trends and Variability from New Multimission Satellite Altimeter Products, Reanalyses, and Wave Buoys. Geophys. Res. Lett. 2020, 47, e2019GL086880. [Google Scholar] [CrossRef]
- Cao, Y.; Dong, C.; Young, I.R.; Yang, J. Global Wave Height Slowdown Trend during a Recent Global Warming Slowdown. Remote Sens. 2021, 13, 4096. [Google Scholar] [CrossRef]
- Guillou, N.; Lavidas, G.; Chapalain, G. Wave Energy Resource Assessment for Exploitation—A Review. J. Mar. Sci. Eng. 2020, 4, 5. [Google Scholar] [CrossRef]
- Guillou, N. Estimating wave energy flux from significant wave height and peak period. Renew. Energy 2020, 155, 1383–1393. [Google Scholar] [CrossRef]
- Arena, F.; Laface, V.; Malara, G.; Romolo, A.; Viviano, A.; Fiamma, V.; Sannino, G.; Carillo, A. Wave climate analysis for the design of wave energy harvesters in the Mediterranean Sea. Renew. Energy 2015, 77, 125–141. [Google Scholar] [CrossRef]
- Ferrari, F.; Besio, G.; Cassola, F.; Mazzino, A. Optimized wind and wave energy resource assessment and offshore exploitability in the Mediterranean Sea. Energy 2020, 190, 116447. [Google Scholar] [CrossRef]
- Sheridan, B.; Baker, S.D.; Pearre, N.S.; Firestone, J.; Willett Kempton. Calculating the offshore wind power resource: Robust assessment methods applied to the U.S. Atlantic Coast. Renew. Energy 2012, 43, 224–233. [Google Scholar] [CrossRef]
- Jägera, W.S.; Naglerb, T.; Czadob, C.; McCallc, R.T. A statistical simulation method for joint time series of non-stationary hourly wave parameters. Coast. Eng. 2019, 146, 14–31. [Google Scholar] [CrossRef] [Green Version]
- Ma, J.; Zhou, D.; Han, Z.; Zhang, Z.; Bao, Y.; Dong, L. Fluctuating wind and wave simulations and its application in structural analysis of a semi-submersible offshore platform. Int. J. Nav. Archit. Ocean. Eng. 2019, 11, 624–637. [Google Scholar] [CrossRef]
- Fu, F. In Chapter Eight: Design of Offshore Structures; Design and Analysis of Tall and Complex Structures. Fu, F., Ed.; Butterworth-Heinemann, 2018; pp. 251–293. ISBN 9780081010181. [Google Scholar] [CrossRef]
- Hirdaris, S.E.; Bai, W.; Dessi, D.; Ergin, A.; Gu, X.; Hermundstad, O.A.; Huijsmans, R.; Iijima, K.; Nielsen, U.D.; Parunov, J.; et al. Loads for use in the design of ships and offshore structures. Ocean Eng. 2014, 78, 131–174. [Google Scholar] [CrossRef]
- Acero, W.G.; Li, L.; Gao, Z.; Moan, T. Methodology for assessment of the operational limits and operability of marine operations. Ocean Eng. 2016, 125, 308–327. [Google Scholar] [CrossRef]
- Charba, J. Application of gravity current model to analysis of squall-line gust front. Mon. Weather Rev. 1974, 102, 140–156. [Google Scholar] [CrossRef] [Green Version]
- Goff, R.G. Vertical structure of thunderstorm outflows. Mon. Weather Rev. 1976, 104, 1429–1440. [Google Scholar] [CrossRef]
- Wakimoto, R.M. The life cycle of thunder storm gust fronts as viewed with Doppler radar and rawinsonde data. Mon. Weather Rev. 1982, 110, 1060–1082. [Google Scholar] [CrossRef] [Green Version]
- Sherman, D.J. The passage of a weak thunderstorm downburst over an instrumented tower. Mon. Weather Rev. 1987, 115, 1193–1205. [Google Scholar] [CrossRef] [Green Version]
- Hjelmfelt, M.R. Structure and life cycle of microburst out flows observed in Colorado. J. Appl. Meteorol. 1988, 27, 900–927. [Google Scholar] [CrossRef]
- Fujita, T.T. Downburst: Meteorological features and wind field characteristics. J. Wind Eng. Ind. Aerodyn. 1990, 36, 75–86. [Google Scholar] [CrossRef]
- Gast, K.D.; Schroeder, J.L. Supercell rear-flank down draft as sample din the 2002 thunderstorm outflow experiment 2003. In Proceedings of the 11th International Conference on Wind Engineering, Lubbock, TX, USA, 2–5 June 2003. [Google Scholar]
- Gunter, W.S.; Schroeder, J.L. High-resolution full-scale measurements of thunderstorm outflow winds. In Proceedings of the 12th Americas Conference on Wind Engineering, Seattle, WA, USA, 16–20 June 2013. [Google Scholar]
- Gumbel, E.J. Statistics of Extremes; Columbia University Press: New York, NY, USA, 1958; p. 377. [Google Scholar]
- Weissman, I. Estimation of parameters and large quantities based on the k largest observations. J. Am. Stat. Assoc. 1978, 73, 812–815. [Google Scholar]
- Cook, N.J. Towards better estimation of wind speeds. J. Wind Eng. Ind. Aerodyn. 1982, 9, 295–323. [Google Scholar] [CrossRef]
- Cook, N.J. The Designer’s Guide to Wind Loading of Building Structures. Part 1: Background, Damage Survey, Wind Data and Structural Classification; Building Research Establishment; Garston and Butterworths: London, UK, 1986; p. 371. [Google Scholar]
- Natural Environment Research Council (NERC). Flood Studies Report; Natural Environment Research Council (NERC): London, UK, 1975; Volume 1. [Google Scholar]
- Pickands, J. Statistical Inference Using Extreme Order Statistics. Ann. Stat. 1975, 3, 119–131. [Google Scholar]
- Efficient Estimation of Distributional Tail Shape and the Extremal Index with Applications to Risk Management. Available online: https://www.scirp.org/journal/paperinformation.aspx?paperid=71870 (accessed on 6 December 2021).
- Dominion Awarded $47 Million by DOE for Offshore Wind Turbine Demonstration Project. Available online: https://news.dominionenergy.com/2014-05-07-Dominion-Awarded-47-Million-by-DOE-for-Offshore-Wind-Turbine-Demonstration-Project (accessed on 20 May 2015).
- Davidson, R. VOWTAP Shelved ’Indefinitely’. Available online: https://www.windpowermonthly.com/article/1409862/vowtap-shelved-indefinitely (accessed on 6 December 2021).
- Trabish, H.K. Dominion Virginia to be First U.S. Utility in Offshore Wind. Available online: https://www.utilitydive.com/news/dominion-virginia-to-be-first-us-utility-in-offshore-wind/262670/ (accessed on 8 December 2021).
- Sunrise Wind—Offshore Wind Farm Project|4C Offshore. Available online: https://www.4coffshore.com/windfarms/united-states/sunrise-wind-united-states-us6b.html (accessed on 3 November 2021).
- British Admiralty. Manual of Seamanship; H.M. Stationary Office: London, UK, 1952.
- Thomson, R.E. Oceanography of British Columbia Coast; Department of Fisheries and Oceans: Ottawa, ON, Canada, 1981. [Google Scholar]
- Meyers, J.J.; Holm, C.H.; McAllister, R.F. Handbook of Ocean and Underwater Engineering; McGraw-Hill Book Company: New York, NY, USA, 1969. [Google Scholar]
- Boccotti, P. Wave Mechanics and Wave Loads on Marine Structures; Butterworth-Heinemann & Elsevier: Amsterdam, The Netherlands, 2014. [Google Scholar]
- Laface, V.; Arena, F. A new equivalent exponential storm model for long-term statistics of ocean waves. Coast. Eng. 2016, 116, 133–151. [Google Scholar] [CrossRef]
- Laface, V.; Bitner-Gregersen, E.; Arena, F.; Romolo, A. A parameterization of DNV-GL storm profile for the calculation of design wave of marine structures. Mar. Struc. 2019, 68, 102650. [Google Scholar] [CrossRef]
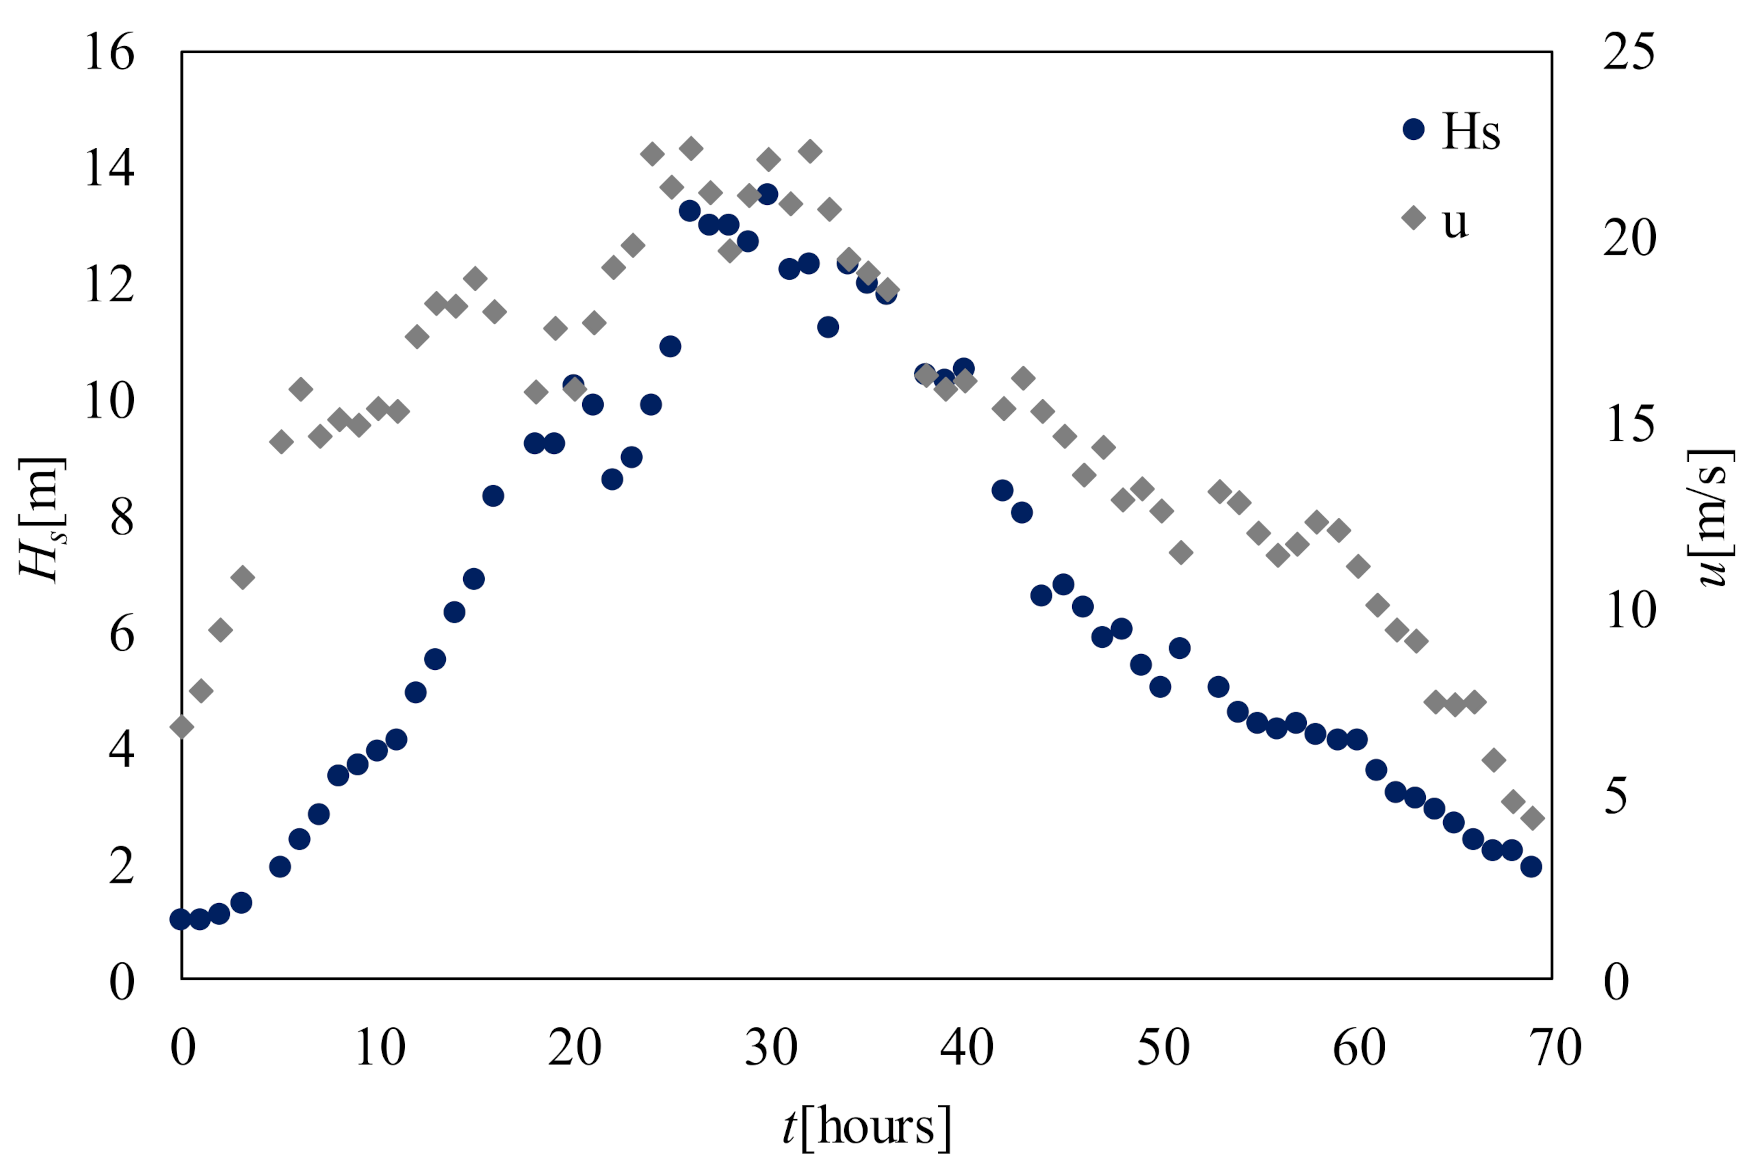
Figure 1.
Example of wind and wave storms over a time window that includes the evolution and subsequent decay of both events (example for the most severe storm recorded by NDBC buoy 44004).
Figure 1.
Example of wind and wave storms over a time window that includes the evolution and subsequent decay of both events (example for the most severe storm recorded by NDBC buoy 44004).

Figure 2.
Flow chart describing storm identification and association criteria.

Figure 3.
Buoy 44004: (a) number of wind storm events Nwind and number of wind storms generating a wave storm Nwind with wave, (b) correlation coefficient between Hs max and umax, (c) correlation coefficient between wind storm and wave storm durations Dwind and Dwave, (d) number of events in which the peak of wave storm occurs before that of wind storm, (e) number of events with a time distance Δt Hs max − umax between wind storm and wave storm peaks that is more than one day.

Figure 4.
Buoy 44008: (a) number of wind storm events Nwind and number of wind storms generating a wave storm Nwind with wave, (b) correlation coefficient between Hs max and umax, (c) correlation coefficient between wind storm and wave storm durations Dwind and Dwave, (d) number of events in which the peak of wave storm occurs before that of wind storm, (e) number of events with a time distance Δt Hs max − umax between wind storm and wave storm peaks that is more than one day.

Figure 5.
Buoy 44014: (a) number of wind storm events Nwind and number of wind storms generating wave storm Nwind with wave, (b) correlation coefficient between Hs max and umax, (c) correlation coefficient between wind storm and wave storm durations Dwind and Dwave, (d) number of events in which the peak of wave storm occurs before that of wind storm, (e) number of events with a time distance Δt Hs max − umax between wind storm and wave storm peaks that is more than one day.

Figure 6.
Buoy 41025: (a) number of wind storm events Nwind and number of wind storms generating wave storm Nwind with wave, (b) correlation coefficient Hs max and umax, (c) correlation coefficient between wind storm and wave storm durations Dwind and Dwave, (d) number of events in which the peak of wave storm occurs before that of wind storm, (e) number of events with a time distance Δt Hs max − umax between wind storm and wave storm peaks that is more than one day.

Figure 7.
Buoy 44004: (a) Dwind versus umax, (b) Dwave versus Hsmax, (c) σwind versus umax, (d) σwave versus Hsmax. (e) Hsmax versus umax, (f) Dwave versus Dwind, (g) σwave versus σwind, (h) Δt Hs max − umax versus umax, (i) ρ(u(t), Hs(t)) versus umax.
Figure 7.
Buoy 44004: (a) Dwind versus umax, (b) Dwave versus Hsmax, (c) σwind versus umax, (d) σwave versus Hsmax. (e) Hsmax versus umax, (f) Dwave versus Dwind, (g) σwave versus σwind, (h) Δt Hs max − umax versus umax, (i) ρ(u(t), Hs(t)) versus umax.

Figure 8.
Buoy 44008: (a) Dwind versus umax, (b) Dwave versus Hsmax, (c) σwind versus umax, (d) σwave versus Hsmax. (e) Hsmax versus umax, (f) Dwave versus Dwind, (g) σwave versus σwind, (h) Δt Hs max − umax versus umax, (i) ρ(u(t), Hs(t)) versus umax.
Figure 8.
Buoy 44008: (a) Dwind versus umax, (b) Dwave versus Hsmax, (c) σwind versus umax, (d) σwave versus Hsmax. (e) Hsmax versus umax, (f) Dwave versus Dwind, (g) σwave versus σwind, (h) Δt Hs max − umax versus umax, (i) ρ(u(t), Hs(t)) versus umax.

Figure 9.
Buoy 44015: (a) Dwind versus umax, (b) Dwave versus Hsmax, (c) σwind versus umax, (d) σwave versus Hsmax. (e) Hsmax versus umax, (f) Dwave versus Dwind, (g) σwave versus σwind, (h) Δt Hs max − umax versus umax, (i) ρ(u(t), Hs(t)) versus umax.
Figure 9.
Buoy 44015: (a) Dwind versus umax, (b) Dwave versus Hsmax, (c) σwind versus umax, (d) σwave versus Hsmax. (e) Hsmax versus umax, (f) Dwave versus Dwind, (g) σwave versus σwind, (h) Δt Hs max − umax versus umax, (i) ρ(u(t), Hs(t)) versus umax.

Figure 10.
Buoy 41025: (a) Dwind versus umax, (b) Dwave versus Hsmax, (c) σwind versus umax, (d) σwave versus Hsmax. (e) Hsmax versus umax, (f) Dwave versus Dwind, (g) σwave versus σwind, (h) Δt Hs max − umax versus umax, (i) ρ(u(t), Hs(t)) versus umax.
Figure 10.
Buoy 41025: (a) Dwind versus umax, (b) Dwave versus Hsmax, (c) σwind versus umax, (d) σwave versus Hsmax. (e) Hsmax versus umax, (f) Dwave versus Dwind, (g) σwave versus σwind, (h) Δt Hs max − umax versus umax, (i) ρ(u(t), Hs(t)) versus umax.


Table 1.
NDBC 44004, 44008, 44014, and 41025 buoy stations: time covering, geographic location, anemometer height, and water depth.
Table 1.
NDBC 44004, 44008, 44014, and 41025 buoy stations: time covering, geographic location, anemometer height, and water depth.
| Buoy | Time | Latitude | Longitude | Anemometer Height [m] | Water Depth [m] |
|---|---|---|---|---|---|
| 44004 | 28 March 2003–31 December 2020 | 38.484 N | 70.433 W | 5 | 3182.1 |
| 44008 | 18 August 1982–31 December 2020 | 40.498 N | 69.251 W | 4.1 | 68.9 |
| 44014 | 01 October 1990–31 December 2020 | 36.609 N | 74.842 W | 3.2 | 47 |
| 41025 | 28 March 2003–31 December 2020 | 35.010 N | 75.454 W | 3.8 | 48.8 |
Table 2.
NDBC 44004, 44008, 44014, and 41025 average wind speed and significant wave height.
| Buoy | Hs [m] | U [m/s] |
|---|---|---|
| 44004 | 2.05 | 7.33 |
| 44008 | 1.71 | 6.39 |
| 44014 | 1.44 | 6.16 |
| 41025 | 1.51 | 7.35 |
Publisher’s Note: MDPI stays neutral with regard to jurisdictional claims in published maps and institutional affiliations. |
© 2021 by the authors. Licensee MDPI, Basel, Switzerland. This article is an open access article distributed under the terms and conditions of the Creative Commons Attribution (CC BY) license (https://creativecommons.org/licenses/by/4.0/).
Share and Cite
MDPI and ACS Style
Laface, V.; Arena, F. On Correlation between Wind and Wave Storms. J. Mar. Sci. Eng. 2021, 9, 1426. https://0-doi-org.brum.beds.ac.uk/10.3390/jmse9121426
AMA Style
Laface V, Arena F. On Correlation between Wind and Wave Storms. Journal of Marine Science and Engineering. 2021; 9(12):1426. https://0-doi-org.brum.beds.ac.uk/10.3390/jmse9121426
Chicago/Turabian StyleLaface, Valentina, and Felice Arena. 2021. "On Correlation between Wind and Wave Storms" Journal of Marine Science and Engineering 9, no. 12: 1426. https://0-doi-org.brum.beds.ac.uk/10.3390/jmse9121426
Note that from the first issue of 2016, this journal uses article numbers instead of page numbers. See further details here.