Article

Level III Reliability Design of an Armor Block of Rubble Mound Breakwater Using Probabilistic Model of Wave Height Optimized for the Korean Sea Wave Conditions and Non-Gaussian Wave Slope Distribution

Department of Civil Engineering, University of Seoul, Seoul 02504, Korea
J. Mar. Sci. Eng. 2021, 9(2), 223; https://0-doi-org.brum.beds.ac.uk/10.3390/jmse9020223
Submission received: 15 January 2021 / Revised: 6 February 2021 / Accepted: 12 February 2021 / Published: 19 February 2021
(This article belongs to the Section Coastal Engineering)

Abstract

:
In this study, a Level III reliability design of an armor block of rubble mound breakwater was developed using the optimized probabilistic wave height model for the Korean marine environment and Van der Meer equation. To demonstrate what distinguishes this study from the others, numerical simulation was first carried out, assuming that wave slope follows Gaussian distribution recommended by PIANC. Numerical results showed that Gaussian wave slope distribution overpredicted the failure probability of armor block, longer and shorter waves, and on the contrary, underpredicted waves of the medium period. After noting the limitations of Gaussian distribution, some efforts were made to develop an alternative for Gaussian distribution. As a result, non-Gaussian wave slope distribution was analytically derived from the joint distribution of wave amplitude and period by Longuet–Higgins using the random variables transformation technique. Numerical results showed that non-Gaussian distribution could effectively address the limitations of Gaussian distribution due to its capability to account for the nonlinear resonant wave–wave interaction and its effects on the wave slope distribution that significantly influences the armor block’s stability. Therefore, the non-Gaussian wave slope distribution presented in this study could play an indispensable role in addressing controversial issues such as whether or not enormous armor blocks like a Tetrapod of 100 t frequently mentioned in developing countermeasures against rough seas due to climate change is too conservatively designed.

1. Introduction

Water waves generated offshore by various mechanisms propagate toward nearby beaches, and during this process, waves become irregular due to the variability inherent in the marine environment. When such irregular waves enter the shallow water, waves undergo drastic changes due to shoaling, refraction, and diffraction, and as a result, wave height grows, leading to the breaking down of waves at the final stage of shoaling process [1]. Port’s outer facilities are deployed in such an irregular and harsh marine environment and, therefore, should be designed to secure sufficient durability even in a harsh marine environment. Nonetheless, armor blocks of the port’s outer facilities have been designed using a deterministic design method based on the Hudson equation [2] in Korea. Considering its simple structural form, which makes its practical applications more amenable, the Hudson equation’s popularity is understandable. However, it has flaws such that the structural form of Hudson’s equation and its parameters cannot reflect sea wave conditions accurately enough for the optimal design of armor block. It is worthy of note that the wave period of incoming waves and storm waves’ duration period were overlooked in Hudson’s equation as well. The limitation of the deterministic design method is on full display on the enormous armor blocks such as a TTP of 100 t frequently mentioned in developing countermeasures against rough seas due to climate change, leading to a critique raised in the coastal engineering community that the port’s outer facilities in Korea are too conservatively designed.
An alternative that can address the limitations of the deterministic design method seems to be reliability design. In the reliability design, the degree of safety can systematically be evaluated by statistically describing the uncertainty inherent in the armor block’s hydraulic stability strength and wave force acting on the armor block. Moreover, by allowing a reasonable failure probability of a armor block, design factors that can be conservatively evaluated in a deterministic design can be easily specified, leading to significant cost savings. Considering the irregularities inherent in sea wave conditions, reliability design should be carried out based on long-term situ wave data. However, in Korea, situ wave data continuously measured over a long period are not available in most cases. As a result, reliability design was performed based on the probability model preferred in the United States [3,4,5]. However, according to Cho and Kim [6] and Cho et al. [7], the Korean marine environment has a significant structural difference from Europe or the United States. This difference is on full display in the East Sea, where enough fetch length required for the full development of wind waves is secured only in a limited direction due to its counterclockwise twisted shape. The rationale for this reasoning can be found in the fact that, unlike the United States, where swells of a long period are prevailing since short waves are left behind the wave packet due to its slow celerity over the course of propagation, swells of a wide variety of periods are occurring on the east coast of Korea [6,7,8].
In light of the facts mentioned above, the reliability design of a port’s outer facilities should be implemented based on the optimized probability model for the Korean marine environment, but these efforts are very rare. Based on the Van der Meer equation [9,10,11], wave slope and wave height dictate the stability of the armor block of rubble mound breakwater. For short-term wave height, the Rayleigh distribution for the offshore, the two-parameter Weibull distribution [12] and modified Glukhovskiy distribution [13] for shallow waters are most frequently mentioned in the current literature [1,7,14]. On the other hand, for the long-term wave height, the tri-variate Weibull distribution is preferred [1,7,14]. Lately, some efforts to develop a probabilistic model optimized for the Korean marine environment was made by Choi and Cho [1]. In this study, Choi and Cho [1] first hindcasted the significant wave heights and peak periods off the Ulsan harbor every hour from 1 January 2003 to 31 December 2017 based on the meteorological data by Japan Meteorological Agency (JMA) and National Oceanic and Atmospheric Administration (NOAA), and SWAN. Then, Choi and Cho [1] proceeded to derive a long-term probabilistic model from the numerically simulated wave data using maximum likelihood method (MLM) and showed that the agreements were more remarkable in the modified Glukhovskiy distribution than in the three variates Weibull distribution, which has been preferred in the literature.
Unlike wave height distribution, for which considerable research achievement has been made over the last decades, wave slope distribution has drawn less attention despite its great engineering value. Due to the lack of a robust probabilistic model, in Korea, wave slope has been empirically estimated in reliability design practice such as the following: Wave height is first simulated using Monte Carlo simulation based on the probabilistic model mentioned above, and then wave period is evaluated from simulated wave height using a simple empirical relationship. Finally, wave slopes are estimated from these simulated wave heights and empirically evaluated periods. In doing so, wave period has been assumed to be linearly proportional to wave height [3,4,5]. However, according to Cavanie et al. [15], Longuet–Higgins [16], Park and Cho [17], as sea wave conditions become harsh, the correlation between wave height and its associated wave period is progressively weakened. As a result, wave height and its associated wave period behave as a mutually independent random process. These behavioral characteristics imply that reliability design based on empirical relationship telling that wave period is linearly proportional to wave height can cause significant errors. On the contrary, wave slope is assumed to follow Gaussian distribution [18] in Europe or the United States. However, Gaussian distribution presents limitations, such as imposing a no-negligible probability of occurrence even for negative wave slope. Therefore, it is subject to extensive test in the near future whether Gaussian distribution preferred in Europe or the United States can be applied to the Korean marine environment and harsh sea wave conditions due to climate change.
In this rationale, this study aims to develop a Level III reliability design method for the armor block of rubble mound breakwaters based on the Van der Meer equation and a probabilistic model optimized for the Korean marine environment. In doing so, the armor block’s failure probability is analytically derived from the Van der Meer equation using the transformation technique of random variables [19]. Following Choi and Cho [1], the modified Glukhovskiy distribution was used as a probabilistic model for wave height. In the case of wave slope, in an effort to develop an alternative to Gaussian distribution, non-Gaussian wave slope distribution is analytically derived using the random variable transformation technique from the joint distribution of wave amplitude and period by Longuet–Higgins [16], which is the most frequently mentioned in the current literature. The non-Gaussian wave slope distribution presented in this study was verified using the situ wave data collected between 26 April 2017–20 April 2018, using an ultrasonic wave height meter (Nortek) near the Mang-Bang beach ( 129 ° 13 34.56 E, 37 ° 24 11.22 N) (see Figure 1) on the east coast of Korea where the water depth was 26.5 m [6,7].
This article is structured as follows: for the sake of self-containment, Section 2 provides details about the deterministic design of armor block of rubble mound breakwaters based on the Van der Meer equation and Level I, II reliability design method. In Section 3, a probabilistic wave height model optimized for the Korean marine environment by Choi and Cho [1] is presented. The derivation procedure of non-Gaussian wave slope distribution using the random variable transformation technique from the joint distribution of wave amplitude and period by Longuet–Higgins [16] is also presented in Section 3. In Section 4, Level III reliability-based design of armor block of rubble mound breakwater is presented, and in Section 5, numerical results are provided.

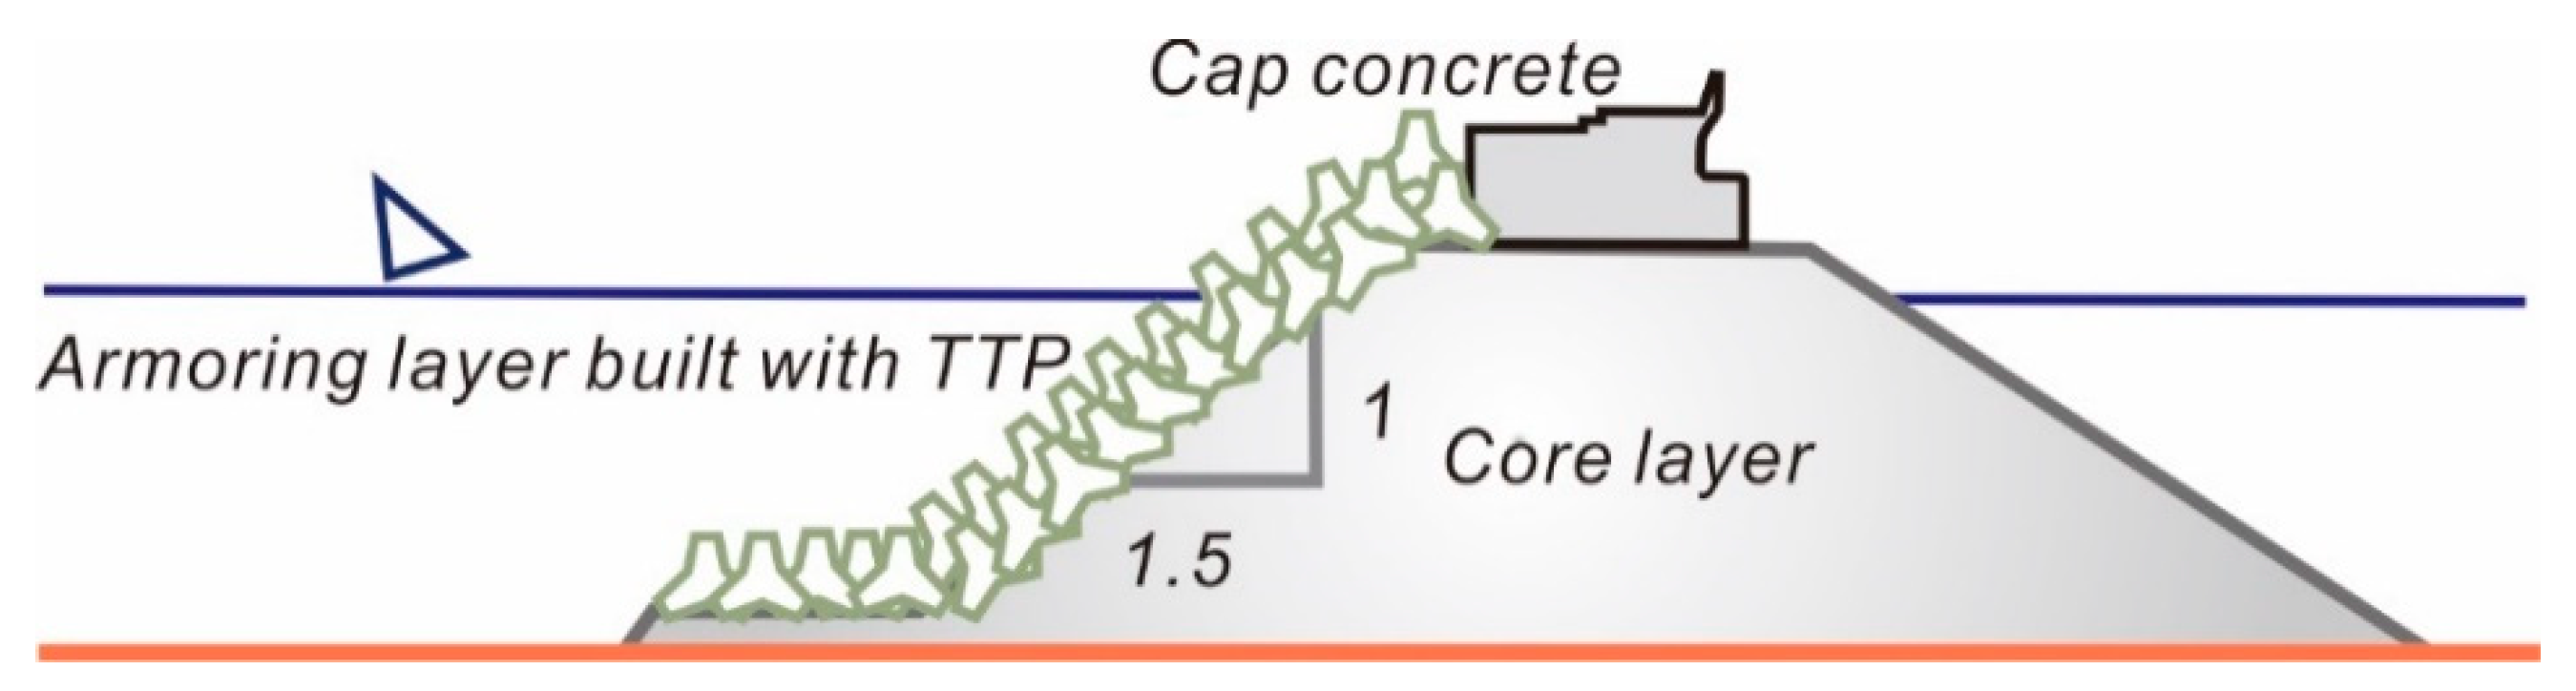
2. Design of Armor Block of Rubble Mound Breakwater

2.1. Deterministic Design Based on the Van der Meer Equation

Van der Meer [18] carried out a series of hydraulic model tests at Delft Hydraulics, retrieving the pioneering study of Thompson and Shuttler [20]. These hydraulic model tests were the most comprehensive ones, including various wave conditions and permeability characteristics of the armor and core block. Based on the data accumulated in the process, Van der Meer [9,10,11,18] proposed an empirical equation for plunging and surging breaker.
In the case of rubble mound breakwater of 1:1.5 slope, the size of tetrapod (TTP) is given by (see Figure 2):
H S Δ D n = ( 3.75 N o d 0.5 N z 0.25 + 0.85 ) S o m 0.2
In Equation (1), Δ = ρ r o c k / ρ w a t e r 1 is the relative density, D n = ( W T T P / ρ r o c k ) 1 / 3 is the nominal diameter of armor block, W T T P is the weight of armor block, N z is the relative damage level, S o m is the wave slope, N o d is the number of waves during a storm, ρ r o c k and ρ w a t e r are the density of armor block and water, respectively.
After rearranging terms in Equation (1) to clarify the physical mechanisms underlying the Van der Meer equation, it can be rewritten as follows:
S R = H S ( 3.75 N o d 0.5 N z 0.25 + 0.85 ) S o m 0.2 Δ D n
where random variables are denoted by bold letters.
As shown in Equation (2), when the armor block’s hydraulic stability strength R is less than the wave force S , the armor block of rubble mound breakwater is unstable, and otherwise, it is stable.

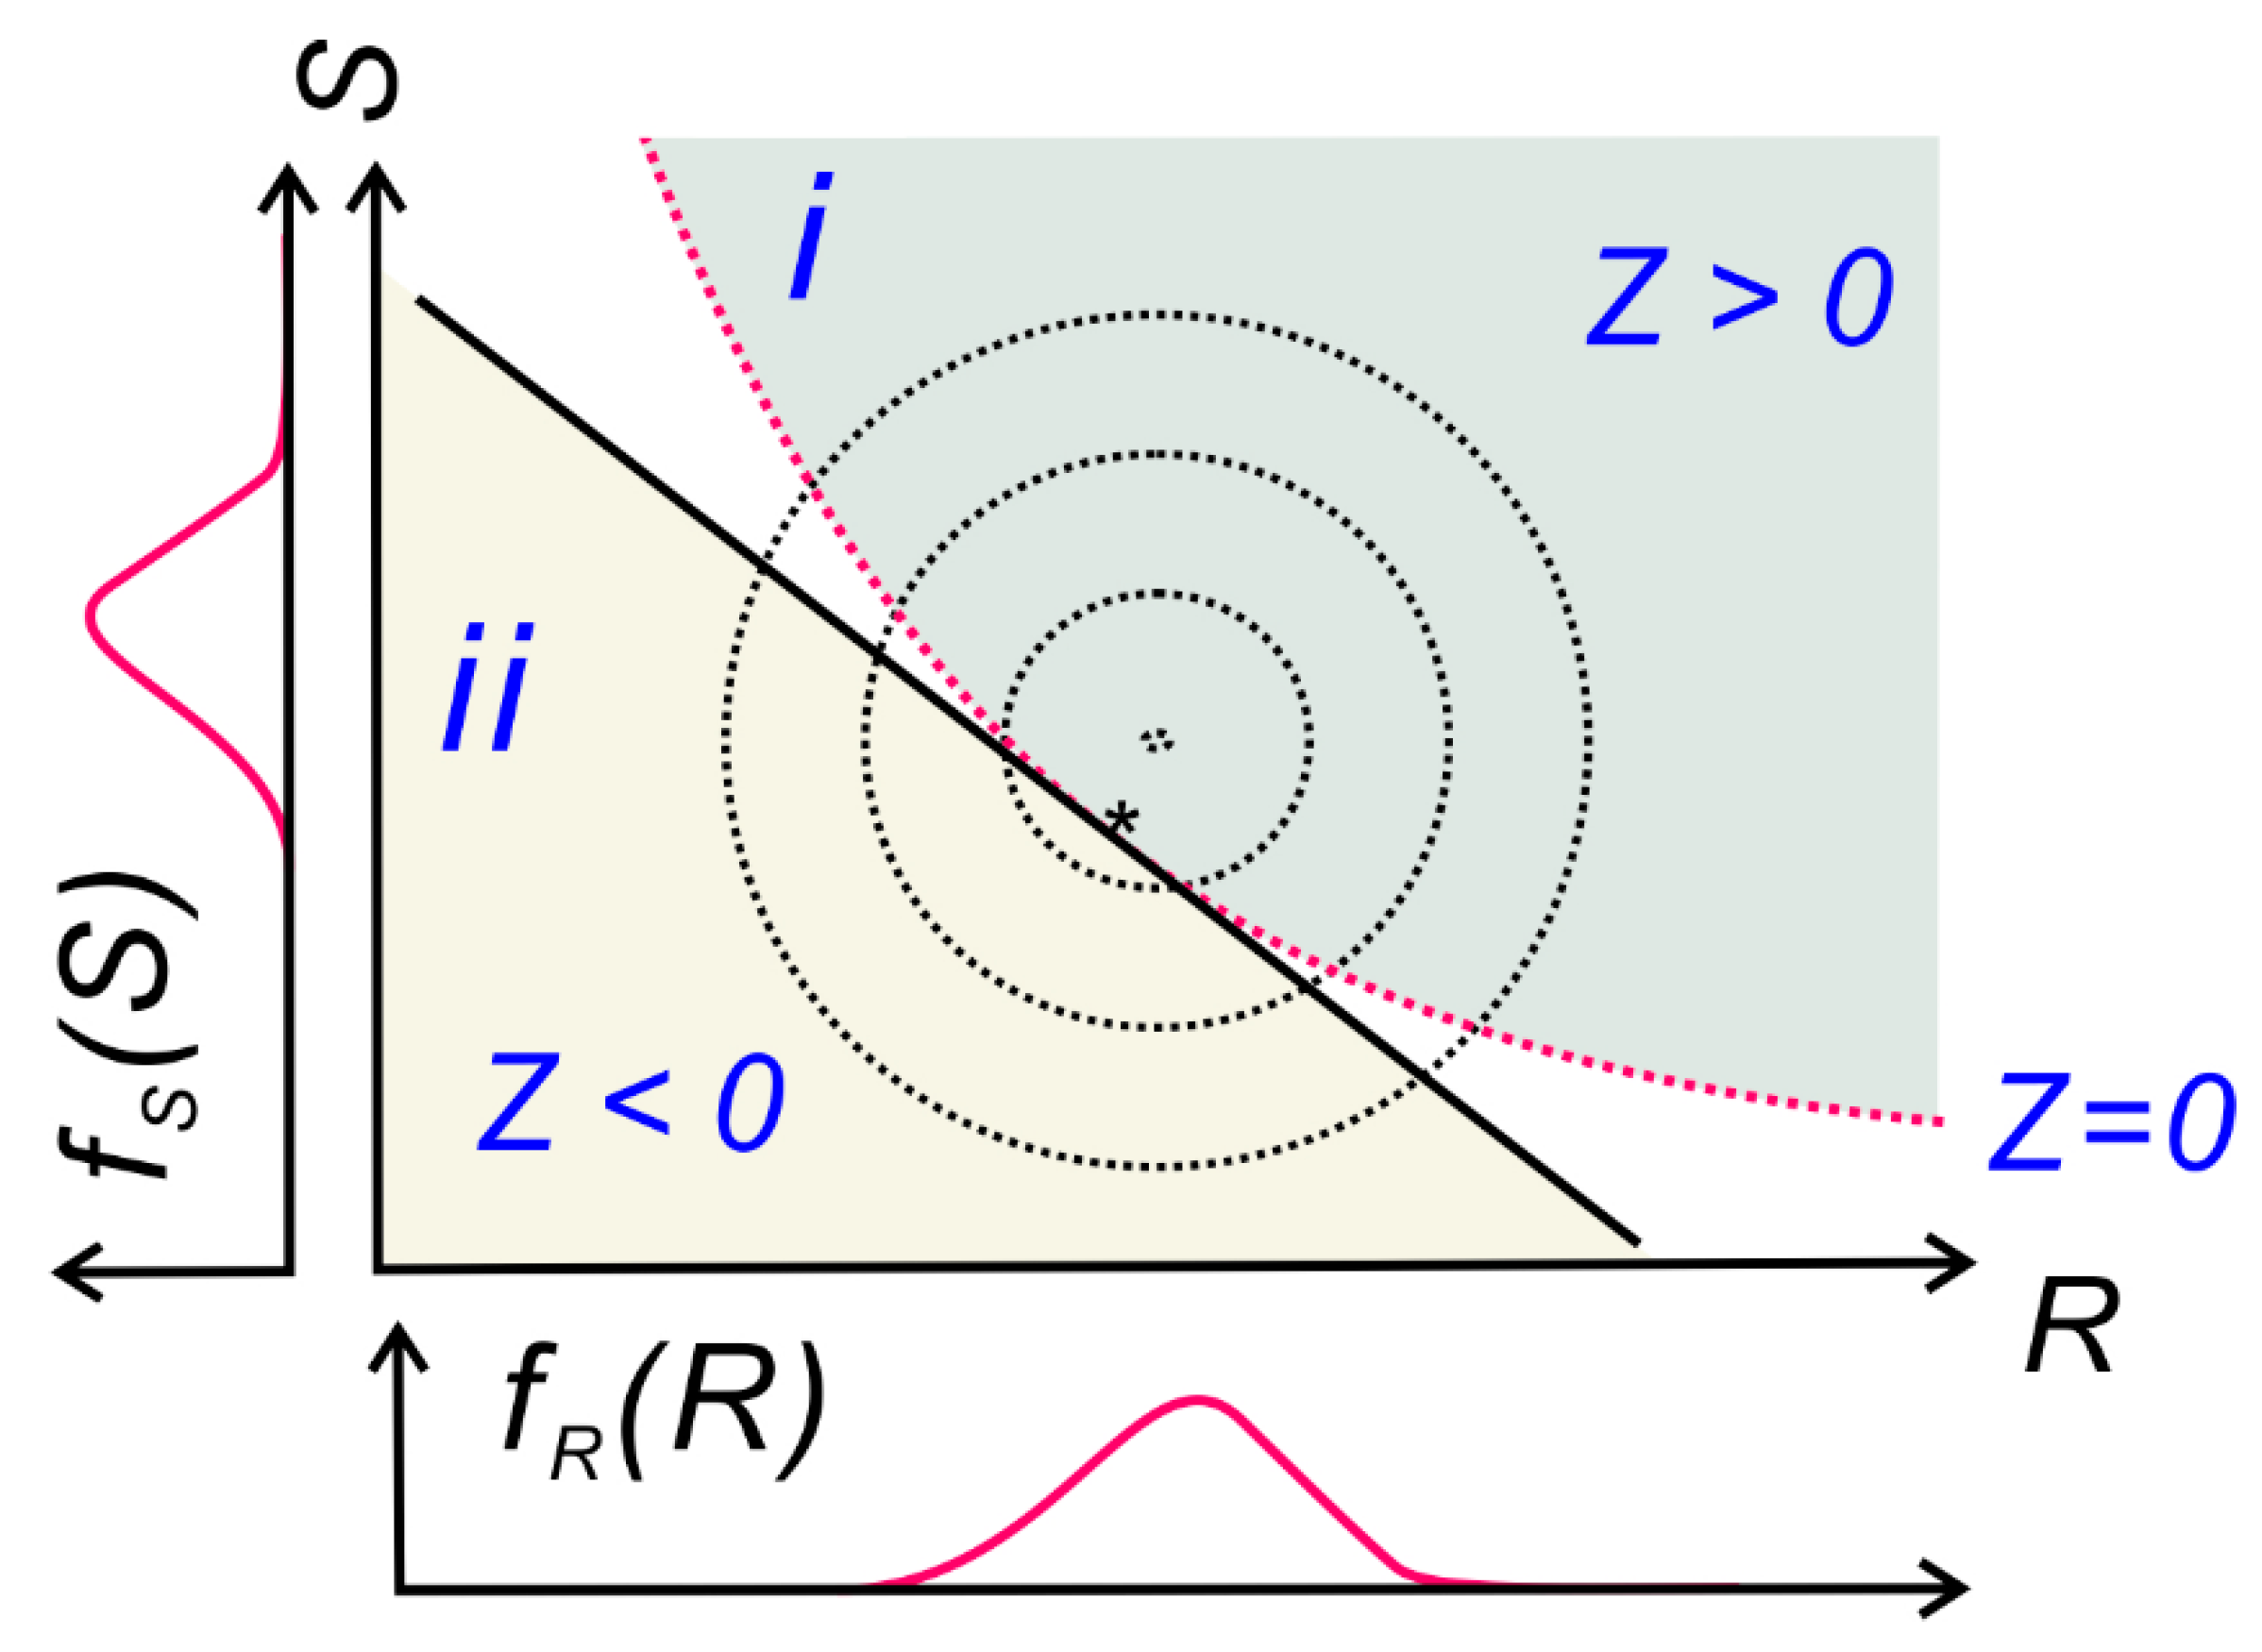
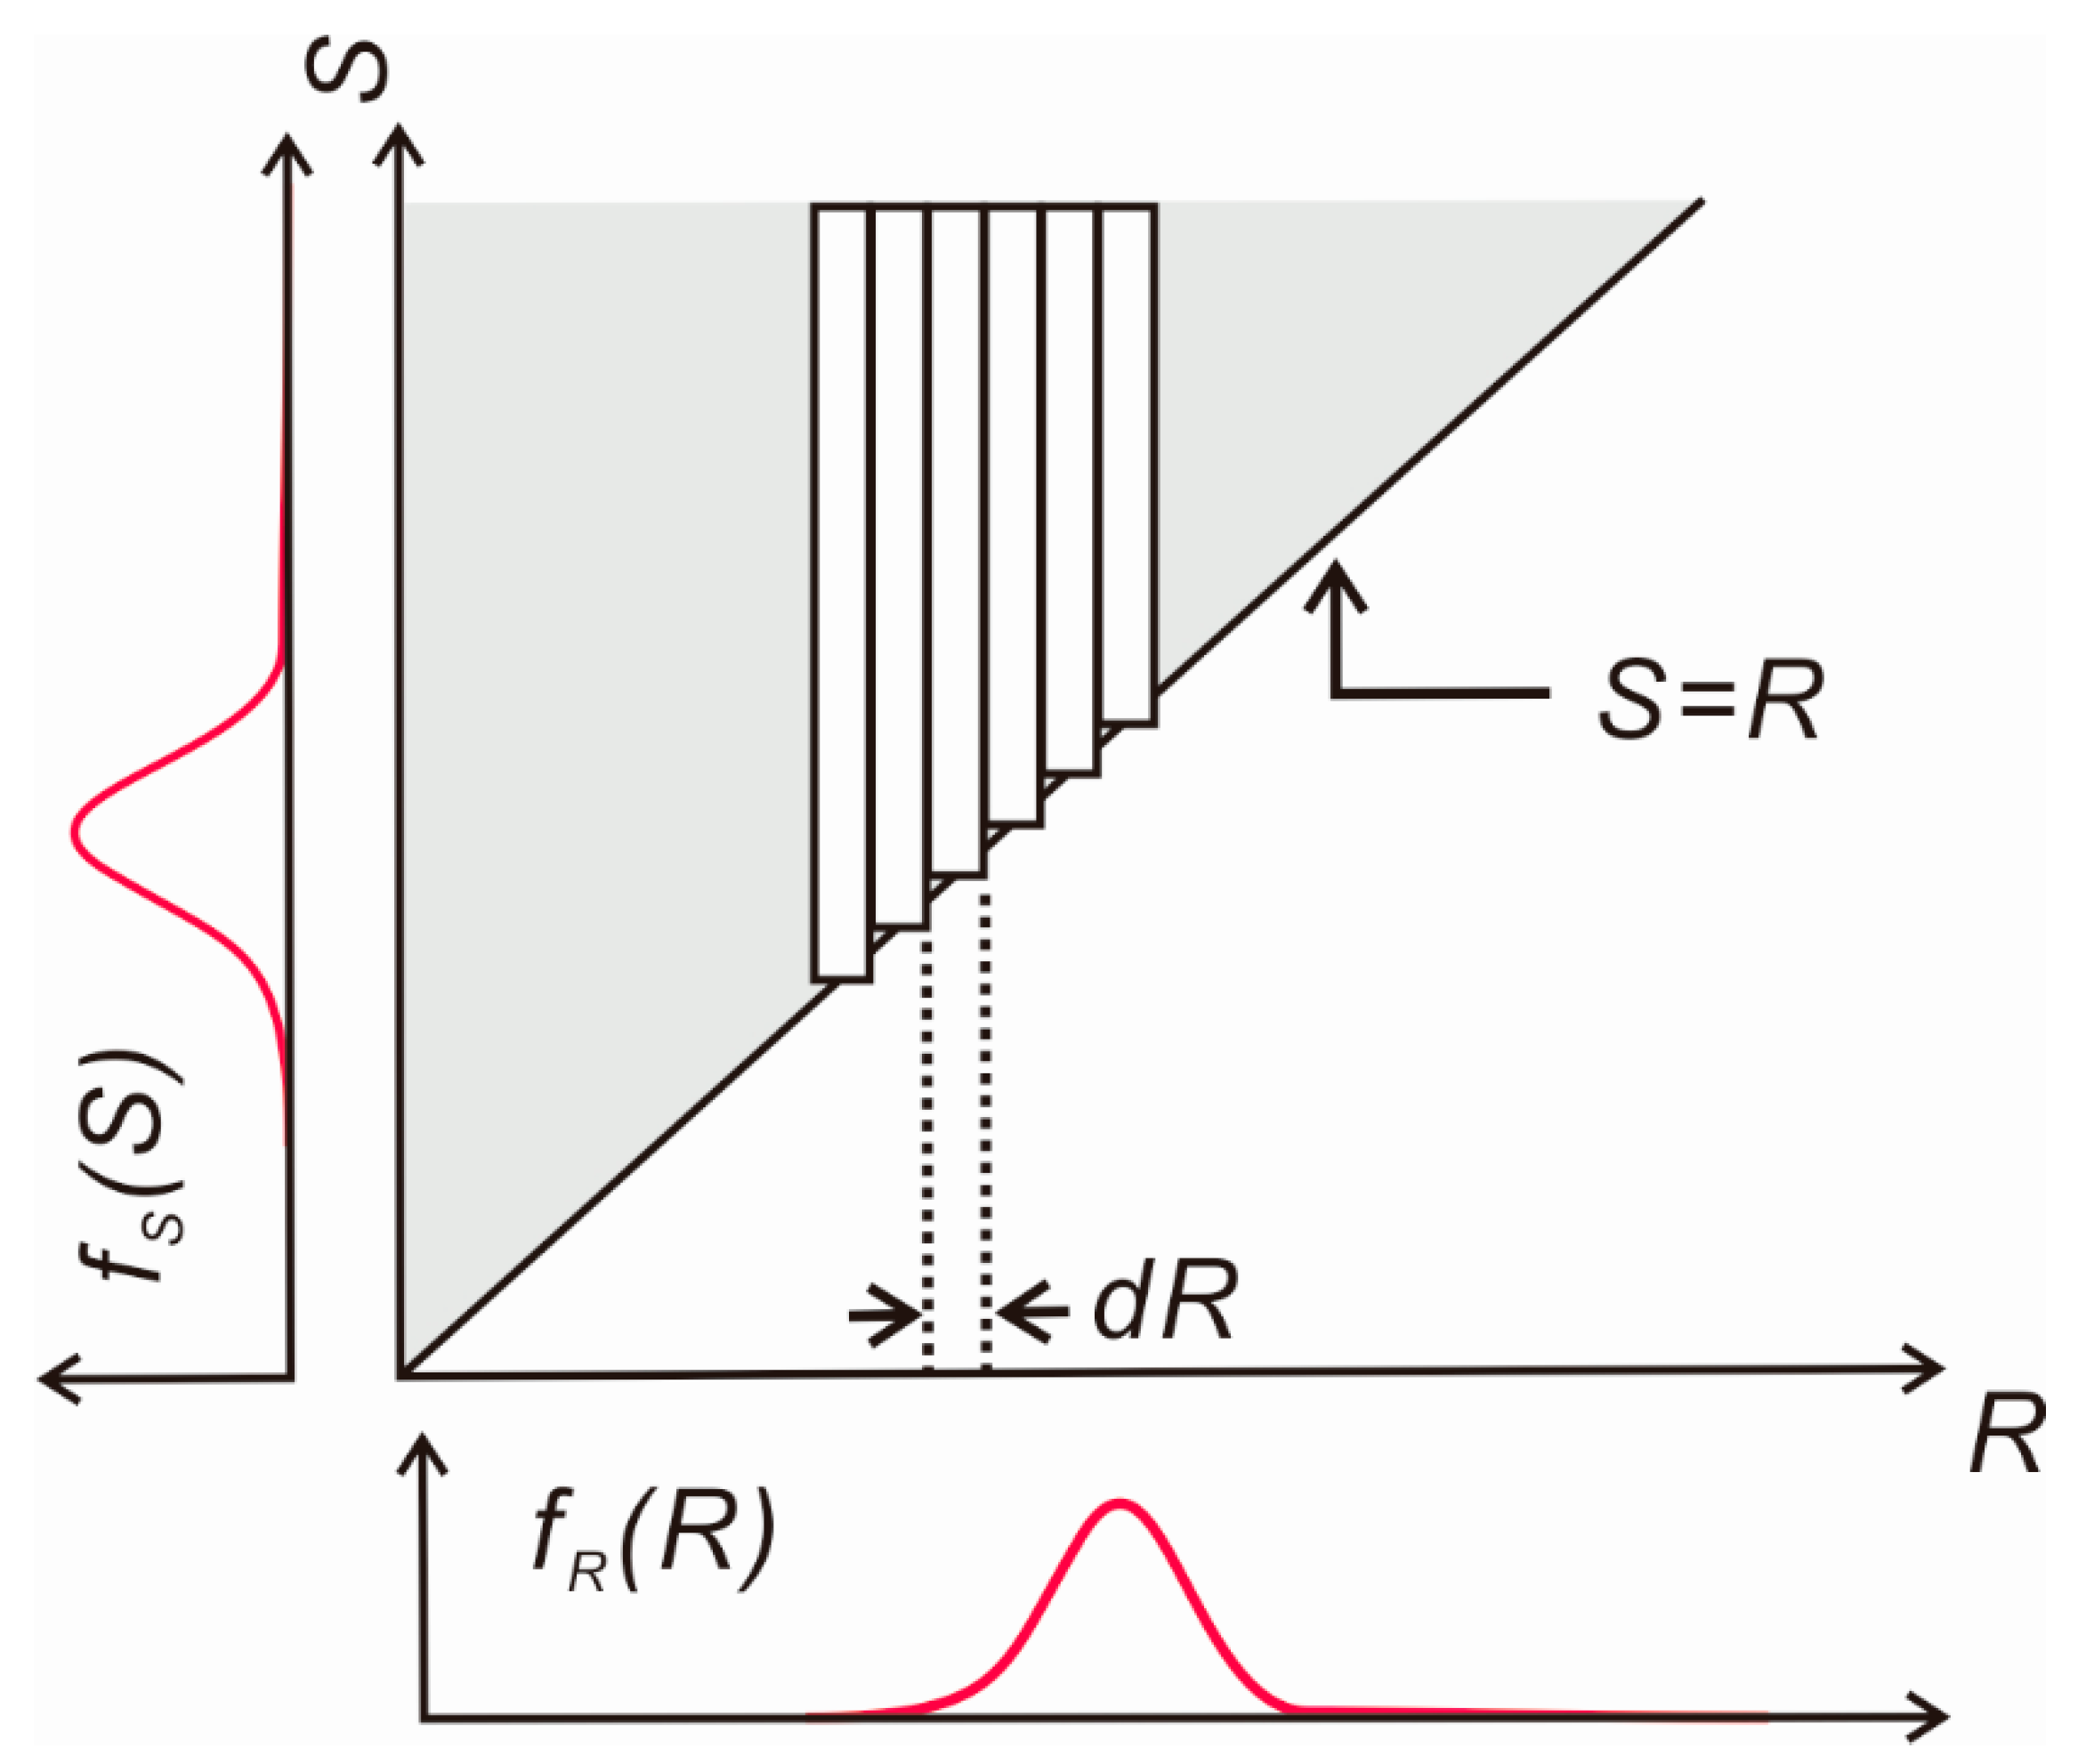
2.2. Reliability Design

In the hierarchy of reliability design, the deterministic design discussed in Section 2.1 can be classified as a Level I reliability design. According to Van der Meer [9,10], it is the ratio of wave height to the nominal diameter of armor block that determines the stability of armor block, and this point of view leads to the Level I partial safety factor method described below.

2.2.1. Partial Safety Factor Method (Level I)

For the sake of convenience in the following analysis, Van der Meer [18] first reclassified six mutually independent random processes into the armor block’s hydraulic stability strength and wave force. Then, Van der Meer [18] proceeded to introduce the hydraulic stability strength reduction factor and load factor that account for the irregularities inherent in the armor block’s hydraulic stability strength and wave force rather than describing the irregularities inherent in random variables such as N o d , N z , Δ , D n , H S and S o m that dictate the armor block’s stability by introducing a probability model for each random variable. In this case, the reliability function Z defined as the difference between the armor block’s hydraulic stability strength and wave force acting on the structure can be written as:
Z = 1 γ Z ( 3.75 N o d 0.5 N z 0.25 + 0.85 ) S o m 0.2 Δ D n γ H S H S T
With the given values of the reliability function Z , the state of armor block of rubble mound breakwater can be classified such as the following:
{ Z > 0 ,    stable Z = 0 ,    failure Z < 0 ,    unstable
In Equation (3), the hydraulic stability strength reduction factor γ Z and load increase factor γ H S can be written as [21]:
γ Z = 1 k α ln k β P f
γ H S = H S T P f H S T L + σ F H S [ 1 + ( H S 3 T L H S T L 1 ) k d p f ] + k s P f N
where T L is a design life cycle of the structure, H S T L is the central estimate of H S with a return period equal to the design life cycle of the structure, H S 3 T L is the central estimate of H S with a return period equal to three times the design life cycle T L of the structure, H S T P f is the central estimate of H S with a return period corresponding to the permissible failure probability of the structure, P f is the permissible failure probability, F H s is a random coefficient introduced to account for the short-term variability of H S , having a mean value of 1.0 and the variational coefficient σ F H S [18], T P f is the a return period corresponding to the permissible failure probability of the structure, N is the number of wave data used in the evaluation of probability coefficients of wave height probability distribution, k α , k β , and k s are the coefficients obtainable by carrying out optimization for each failure mode [18].

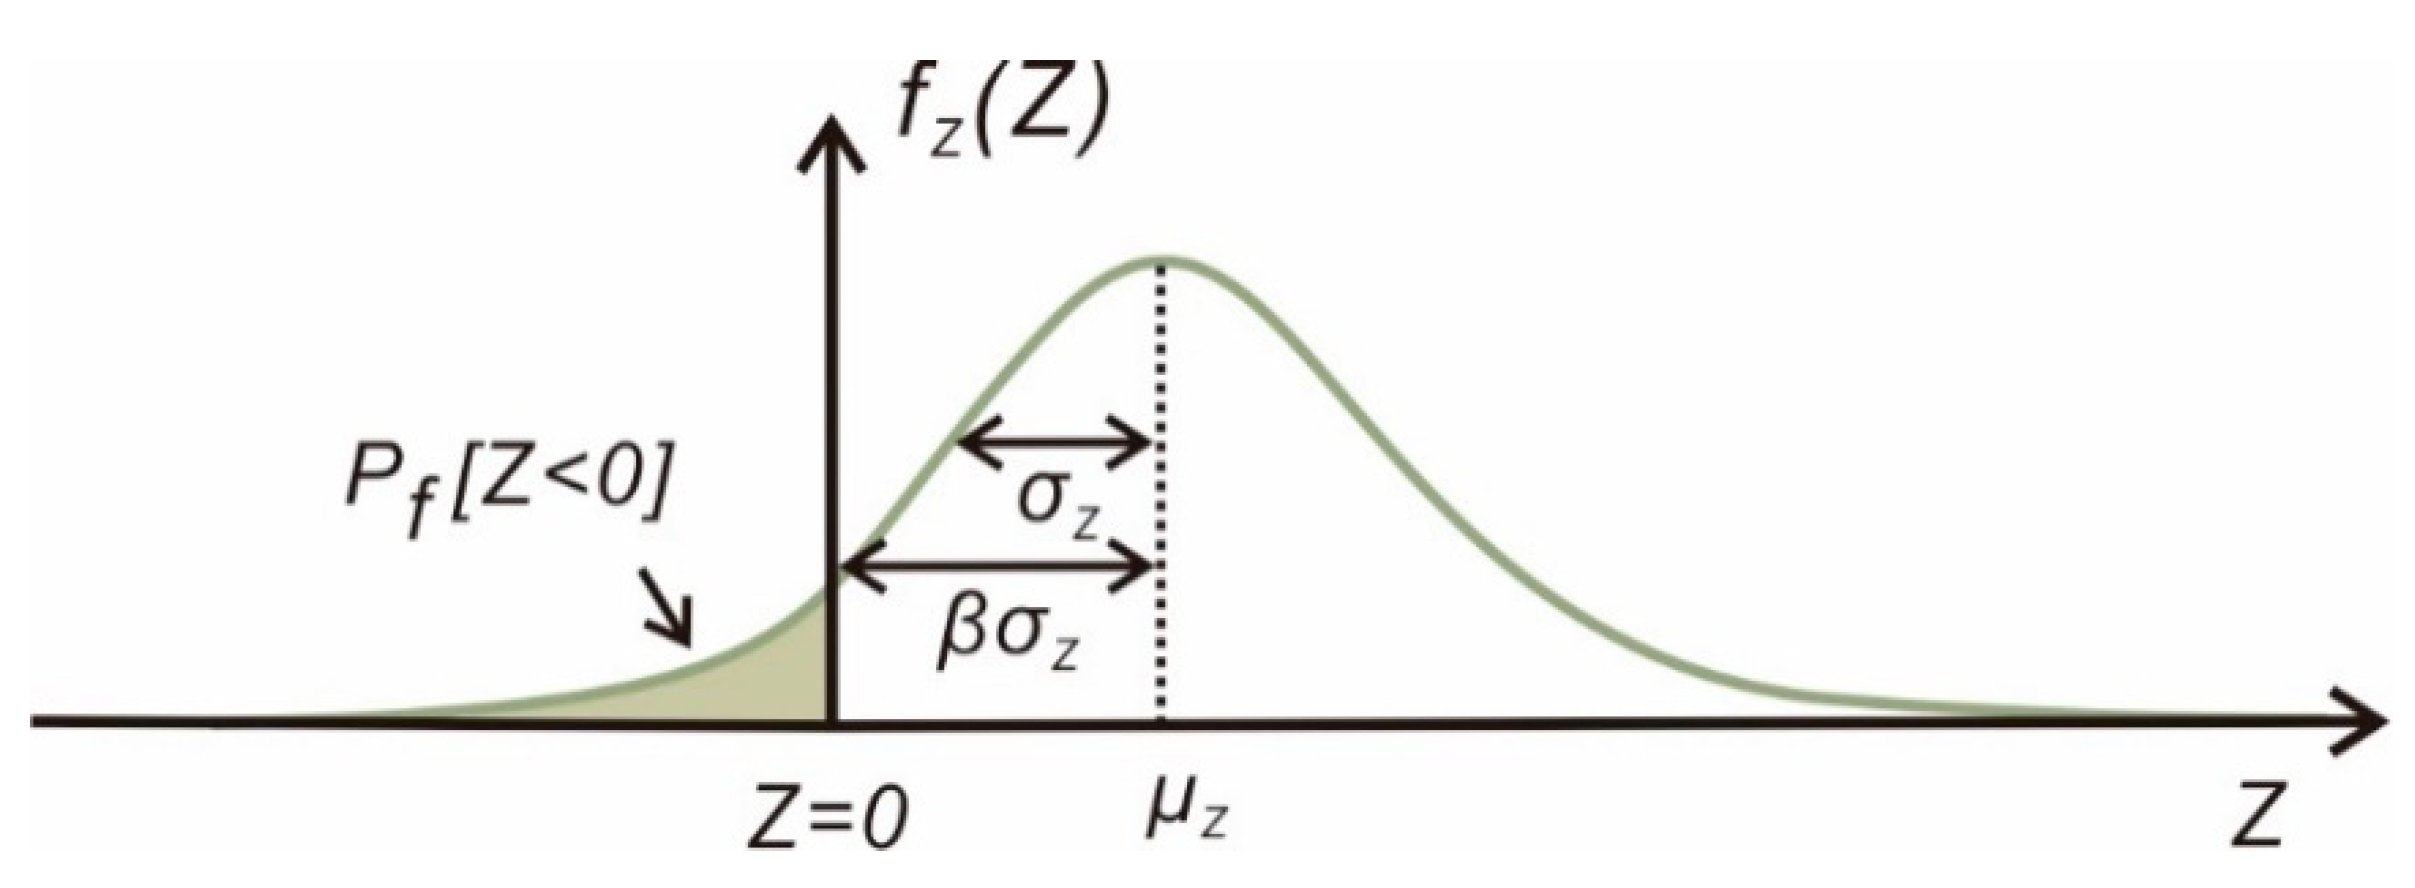
2.2.2. Level II Reliability Design

While the reliability function nonlinearly depends on the armor block’s hydraulic stability strength and wave force, in the Level II reliability design method, the reliability index β around the most probable failure point (MPFP) or design point is first calculated, from which the probability of failure can be obtained. In doing so, the reliability function Z is assumed to follow the Gaussian distribution and linearized around the MPFP such that only the first-order term is retained after expanding the reliability function around the MPFP using a Taylor Series. Here, β denotes the distance from the mean of the reliability function to the limit state and can be written as (see Figure 3):
β = μ Z σ Z
MPFP denotes a point where the reliability function’s probability density function reaches its peak along the line Z = 0 (limiting state).

3. Probabilistic Model

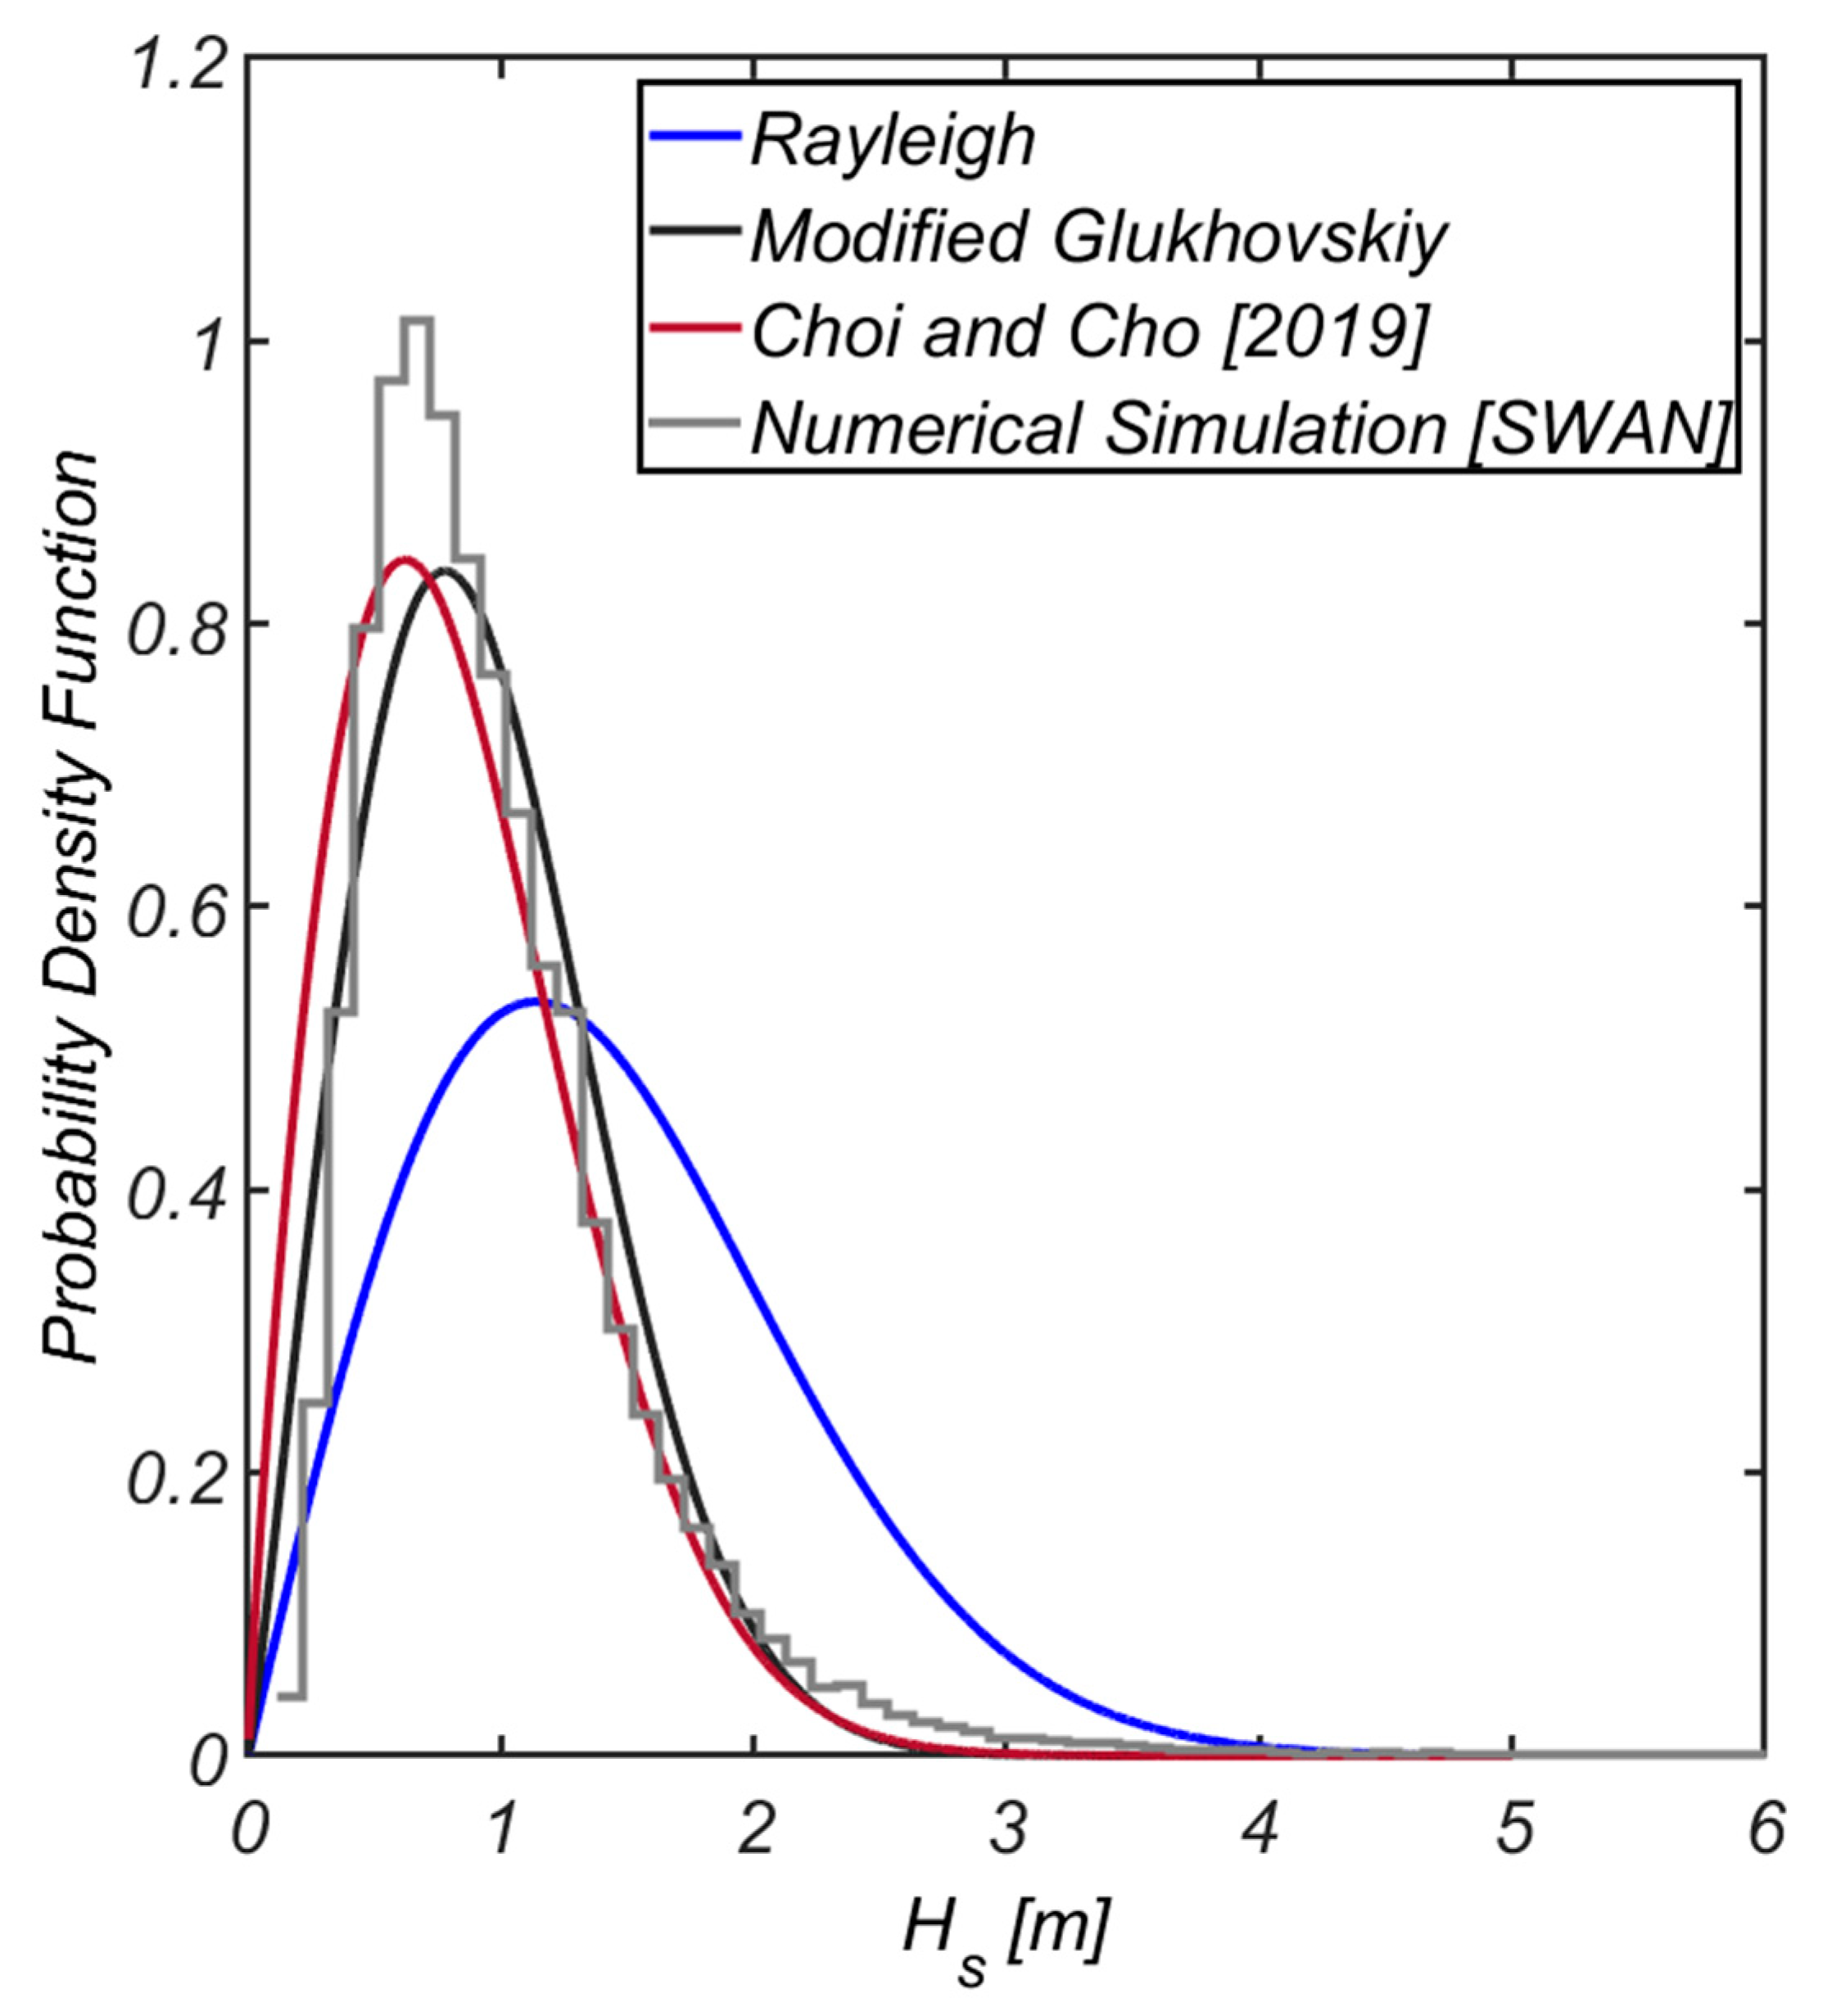
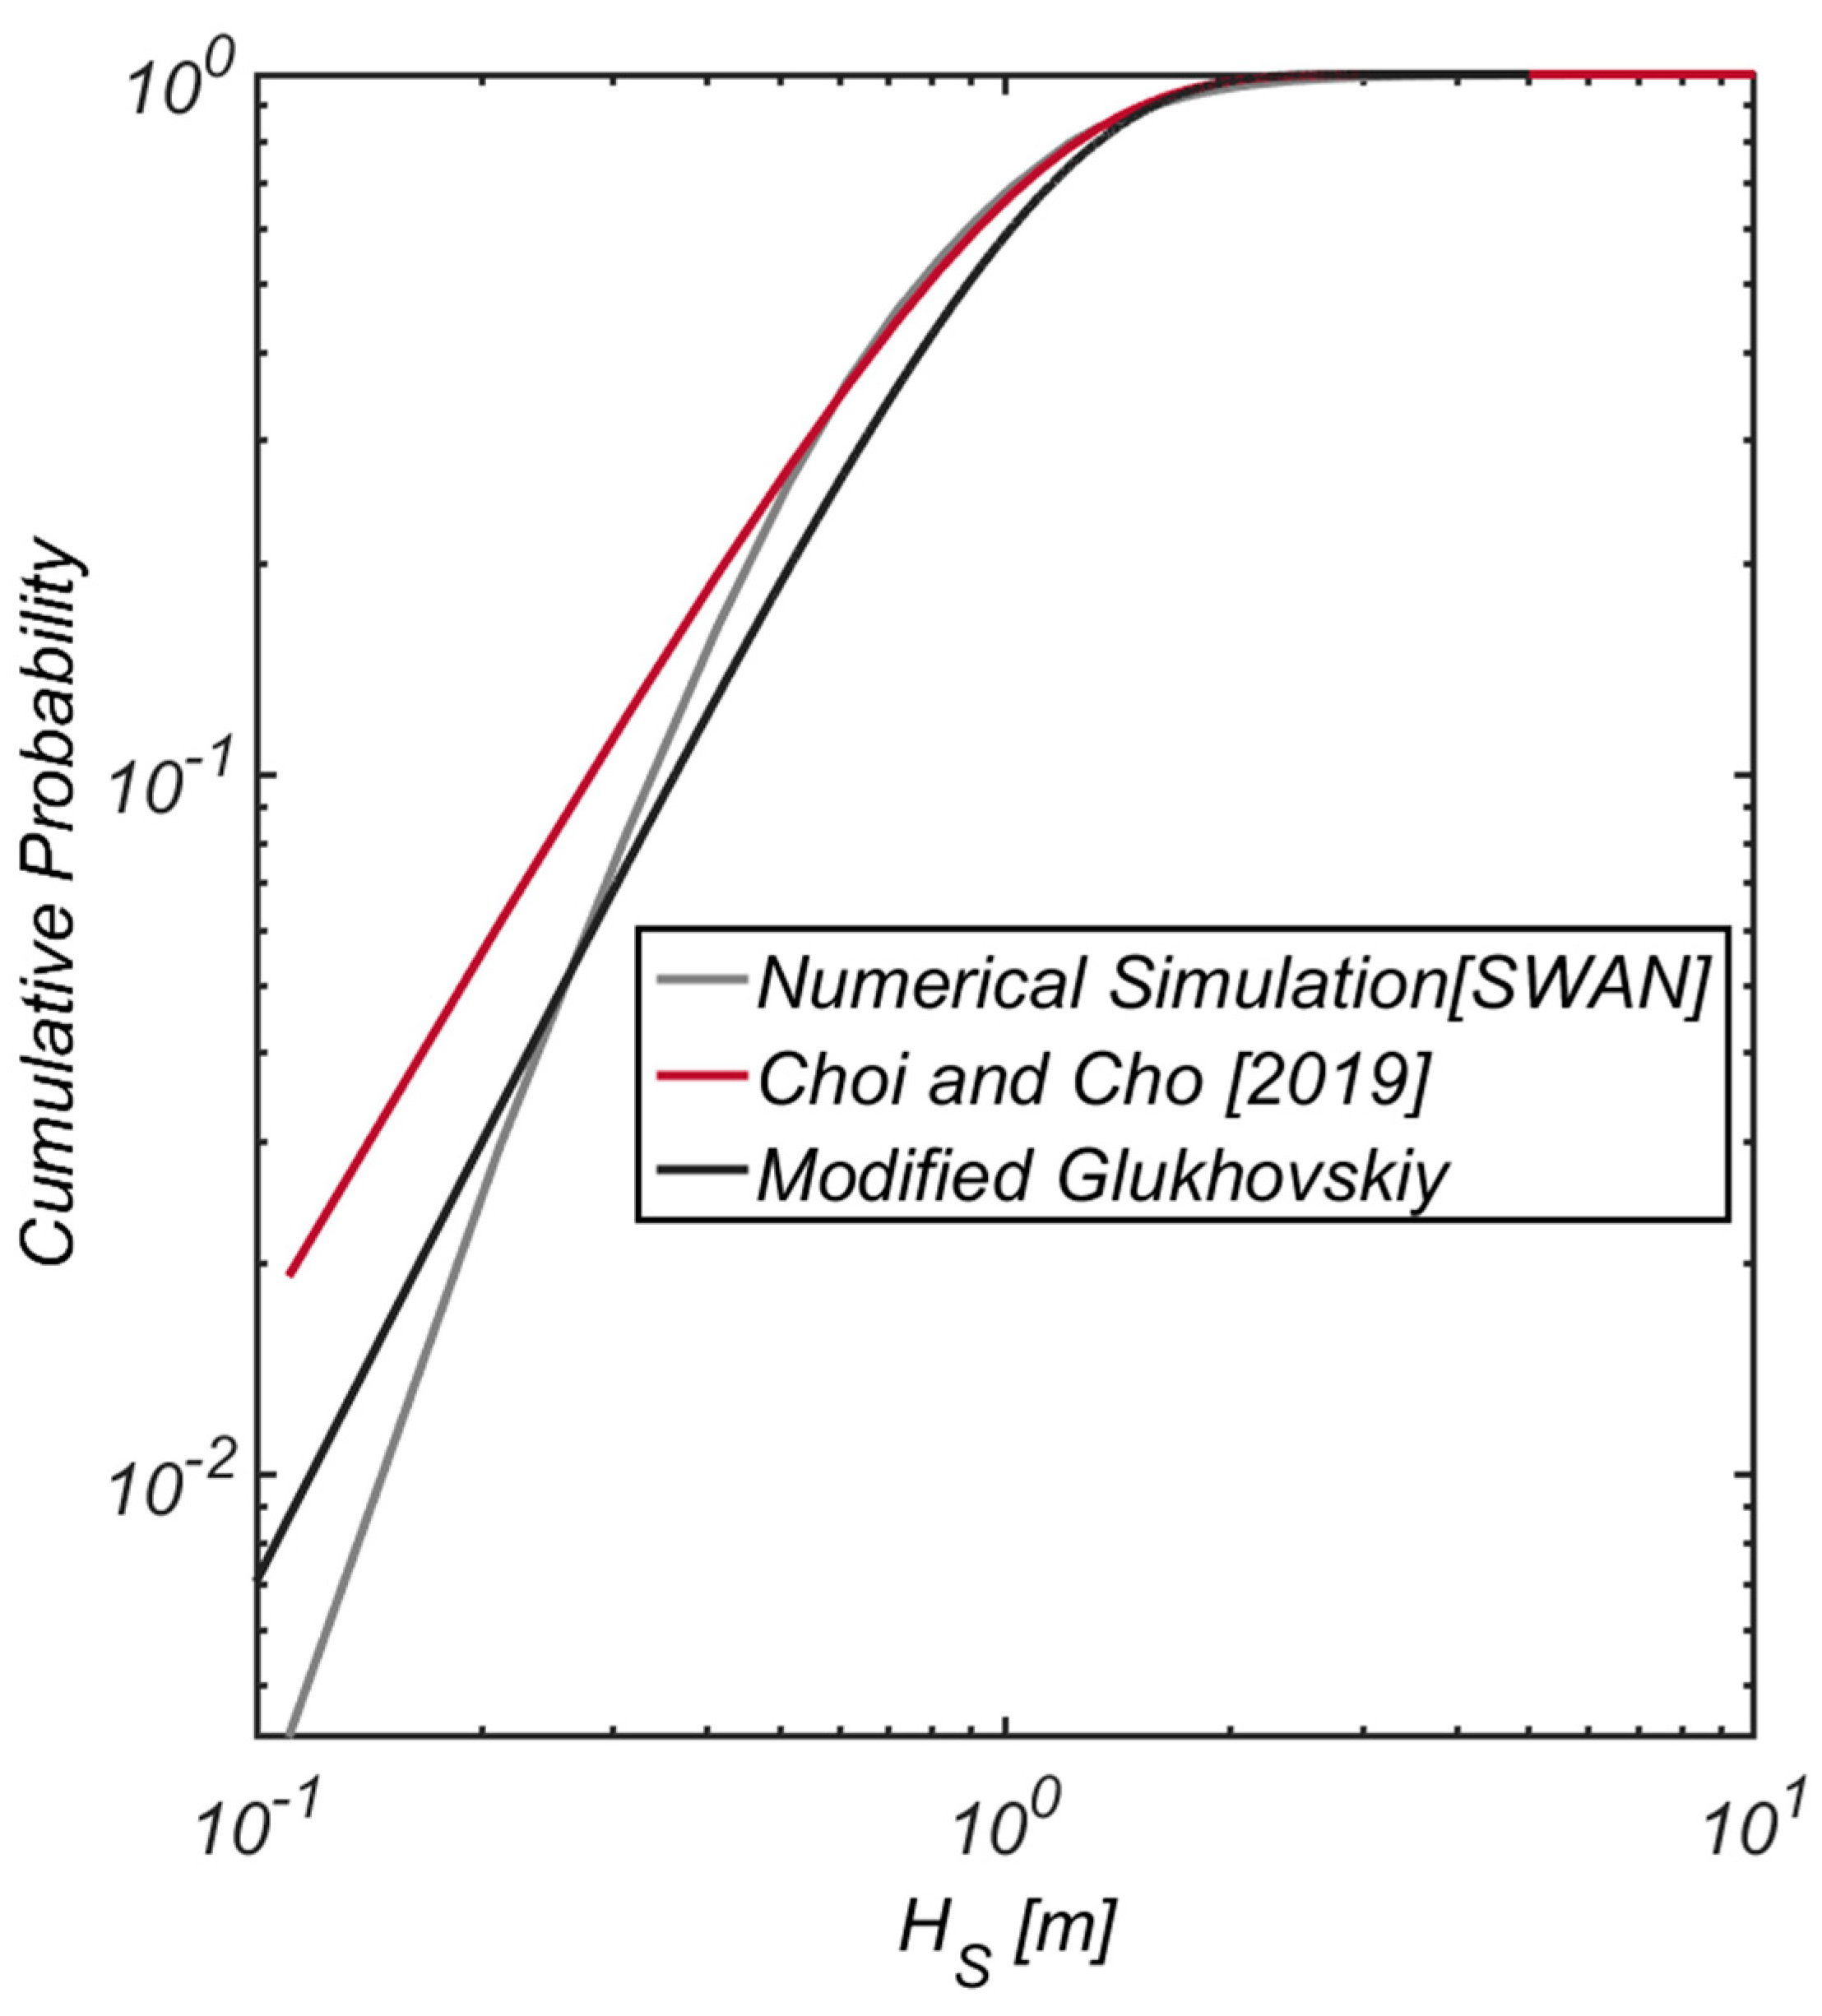
3.1. Wave Height Distribution

Rayleigh distribution is the most frequently referred probabilistic model of wave height in the current literature, and despite being a linear model, it shows good agreement with situ data in the case of deep-water random waves [22]. As irregular waves enter the shallow water, wave height distribution undergoes drastic changes due to shoaling, refraction, diffraction, and wave breaking. It was Glukhovskiy [23] who first developed wave height distribution at a finite depth. Later, the uncertainty concerned with the evaluation of probability parameters of the early model [24] was addressed by Klopman and Stive [13] and Klopman [25]. As of now, modified Glukhovskiy distribution has been regarded as a representative shallow-water wave height distribution [1]. However, modified Glukhovskiy distribution is known to give conservative values over the surf zone, the last stage of the shoaling process [26]. Lately, Battjes and Groenendijk [12] proposed composite Weibull distribution by classifying the sample space of wave height into two groups to effectively explain wave height attenuation due to wave breaking to address the deficiency of modified Glukhovskiy distribution mentioned above. Later, composite Weibull distribution developed by Battjes and Groenendijk [12] becomes the preferred probabilistic model of wave heights over the surf zone. On the other hand, the three variates of the Weibull distribution were frequently mentioned in the current literature as the long-term wave height distribution.
For the sake of self-containment, Rayleigh distribution, Glukhovskiy distribution, and composite Weibull distribution were presented in Section 3.1.1, Section 3.1.2, and Section 3.1.3, respectively. In Section 3.1.4 and Section 3.1.5, the details about the tri-variates Weibull distribution and optimized wave height distribution for the Korean marine environment were provided.

3.1.1. Rayleigh Distribution

Rayleigh distribution F H ( h ) can be written as [22]:
F H ( h ) = P [ H < h ] = 1 exp [ ( h 2 H S ) 2 ]
where P [ H < h ] denotes a probability that wave height H is less than h .

3.1.2. Modified Glukhovskiy Distribution

Modified Glukhovskiy distribution F H ( h ) can be written as:
F H ( h ) = P [ H < h ]    = 1 exp [ A ( h H M E A N ) κ ]
where A and κ are probability coefficients depending on the relative depth d ˜ [ = d / h ] and can be written as:
κ = 2 1 d ˜
A = [ Γ ( 1 κ + 1 ) ] κ
As shown in Equation (9), modified Glukhovskiy distribution is converging to Rayleigh distribution as d ˜ .

3.1.3. Composite Weibull Distribution

Composite Weibull distribution F H ( h ) can be written as [12]:
F H ˜ ( h ˜ ) = P [ H ˜ < h ˜ ]
= { 1 exp [ ( h ˜ H ˜ 1 ) κ 1 ] ,    h ˜ < H ˜ T r 1 exp [ ( h ˜ H ˜ 2 ) κ 2 ] ,    h ˜ H ˜ T r
where h ˜ = h / H R M S is the normalized wave height.
The probability density function f H ( h ) of composite Weibull distribution can be written as [27]:
f H ˜ ( h ˜ ) = d F H ˜ ( h ˜ ) d H ˜
= { κ 1 H 1 ˜ κ 1 H ˜ 1 κ 1 1 exp [ ( h ˜ H 1 ˜ ) κ 1 ] ,    h ˜ < H t r ˜ κ 2 H 2 ˜ κ 2 H ˜ 2 κ 1 1 exp [ ( h ˜ H 2 ˜ ) κ 2 ] ,    h ˜ H t r ˜
where H ˜ 1 = H 1 / H R M S , H ˜ 2 = H 2 / H R M S , H R M S is the root mean squared wave height, and the transition wave height H ˜ t r = H t r / H R M S can be written as [12]:
H t r ˜ = 0.35 + 5.8 d tan α H R M S
In Equation (14), d is the water depth, and tan α is the bottom slope.
As shown in Equations (12) and (13), composite Weibull distribution is defined by the probability parameters such as κ 1 , κ 2 , H 1 ˜ , H 2 ˜ , and H t r ˜ , and the evaluation method of these parameters can be found in Battjes and Groenendijk [12] and Choi and Cho [1].

3.1.4. Tri-Variates Weibull Distribution

The tri-variates Weibull distribution is known to provide a satisfactory description of the statistical distribution of long-term wave height, and its distribution function F H ( h ) can be written as [14]:
F H ( h ) = P [ H < h ]    = 1 exp [ ( h μ L H L ) κ L ]
where μ L , H L , and κ L are the probability parameters that are to be determined from the situ wave data using maximum likelihood method (MLM).

3.1.5. Optimized Probabilistic Model of Wave Height for the Korean Sea Wave Conditions

Lately, Choi and Cho [1] developed a probabilistic model optimized for the marine environment in Korea. In this study, Choi and Cho [1] first hindcasted the significant wave heights and peak periods off the Ulsan harbor every hour from 1 January 2003 to 31 December 2017 based on the meteorological data by Japan Meteorological Agency (JMA) and National Oceanic and Atmospheric Administration (NOAA), and SWAN. Then, Choi and Cho [1] derived a long-term probabilistic model of wave height using MLM from the numerically simulated wave data. It was shown that the agreements were more remarkable in the probability distribution in line with modified Glukhovskiy distribution than in the three parameters Weibull distribution, which has been preferred in the literature (see Figure 4 and Figure 5).
The wave height probability density function f H ( h ) by Choi and Cho [1] can be written as:
f H ( h ) = d F H ( h ) d h
= A p κ p H p ( h H p ) κ p 1 exp [ A p ( h H p ) κ p ]   
The corresponding wave height distribution function F H ( h ) can be written as:
F H ( h ) = P [ H < h ]
= 1 exp [ A p ( h H p ) κ p ]
According to Choi and Cho [1], the parameters of modified Glukhovskiy distribution given in Equation (17) have a value of A p = 15.92 , H p = 4.374 m , κ p = 1.824 with a confidence level of 95 % .

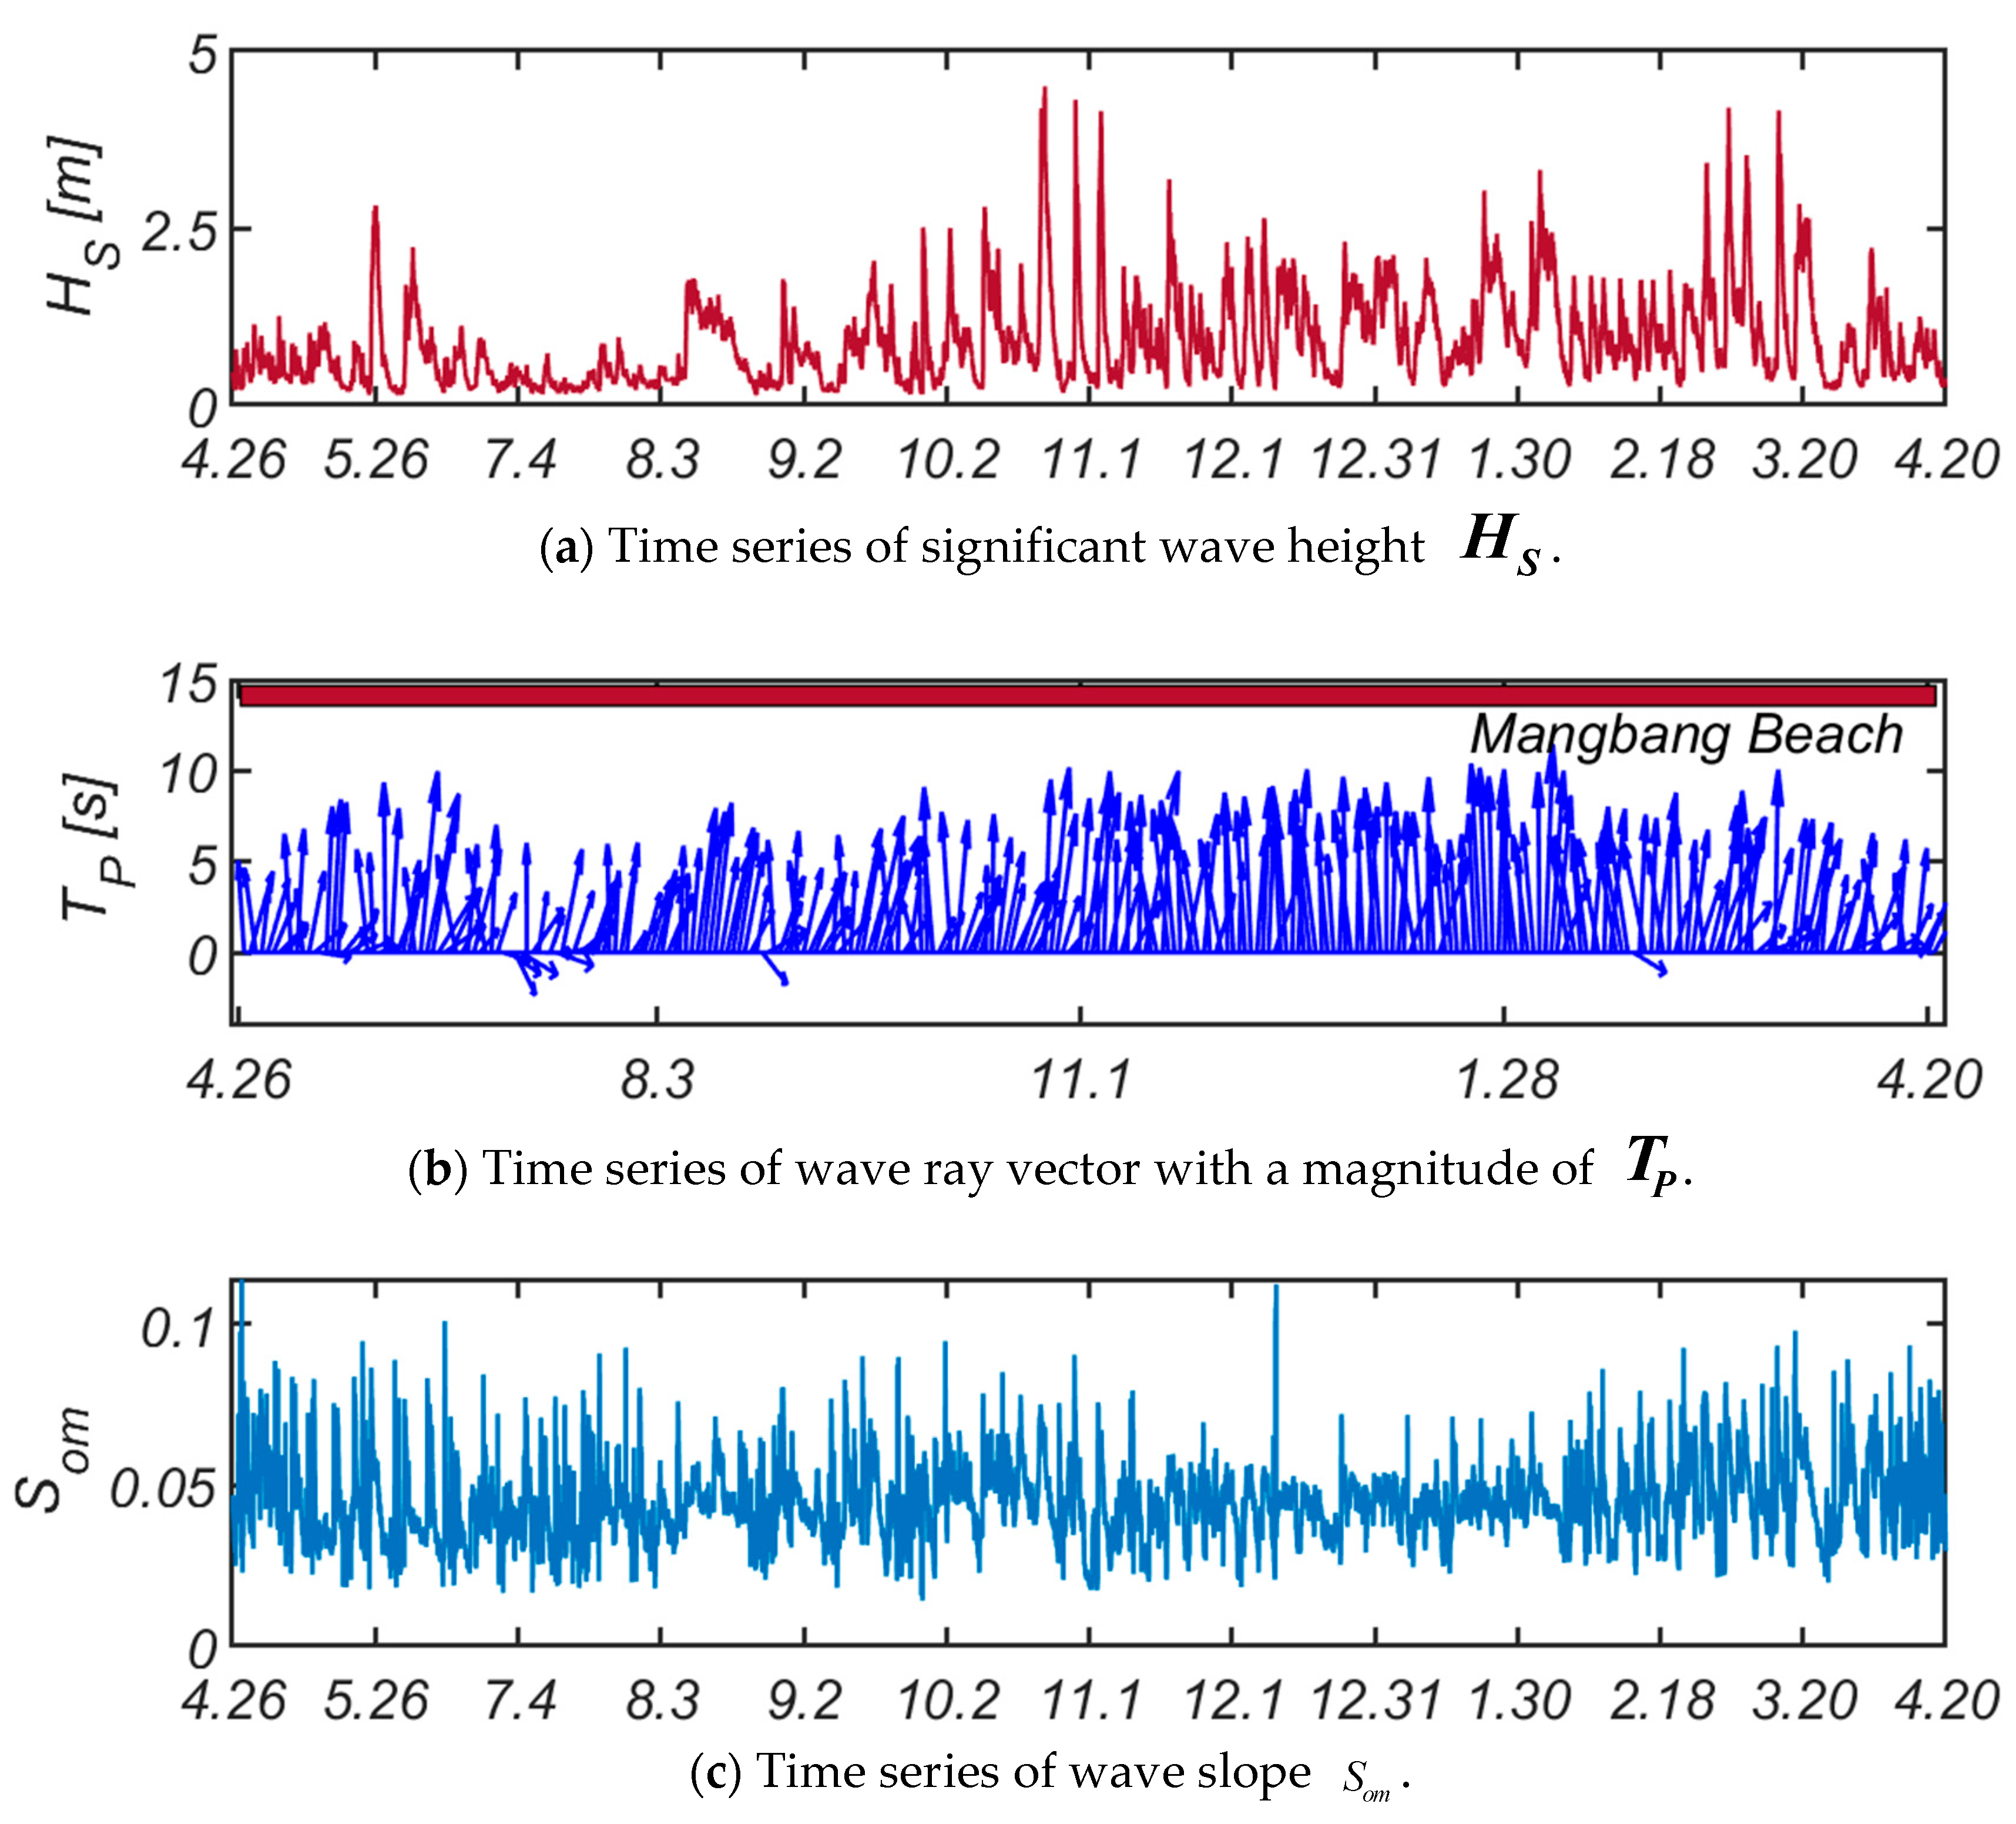
3.2. Wave Slope Distribution

3.2.1. Gaussian Distribution

For the case of wave slope that significantly influences the armor block’s hydraulic stability strength, the Gaussian distribution was preferred in Europe or the United States [18] and can be written as [18,28]:
f S o m ( S o m ) = 1 2 π σ S exp [ 1 2 ( S o m μ S σ S ) 2 ]
where μ S is the mean wave slope, and σ S is the standard deviation of wave slope.
Even though the Gaussian distribution in Equation (18) has been preferred due to its simple structural form, the Gaussian wave slope distribution is known to have flaws such as the non-negligible occurrence probability of negative wave slope, overpredicted longer and shorter waves, and underprediction of waves of the medium period.

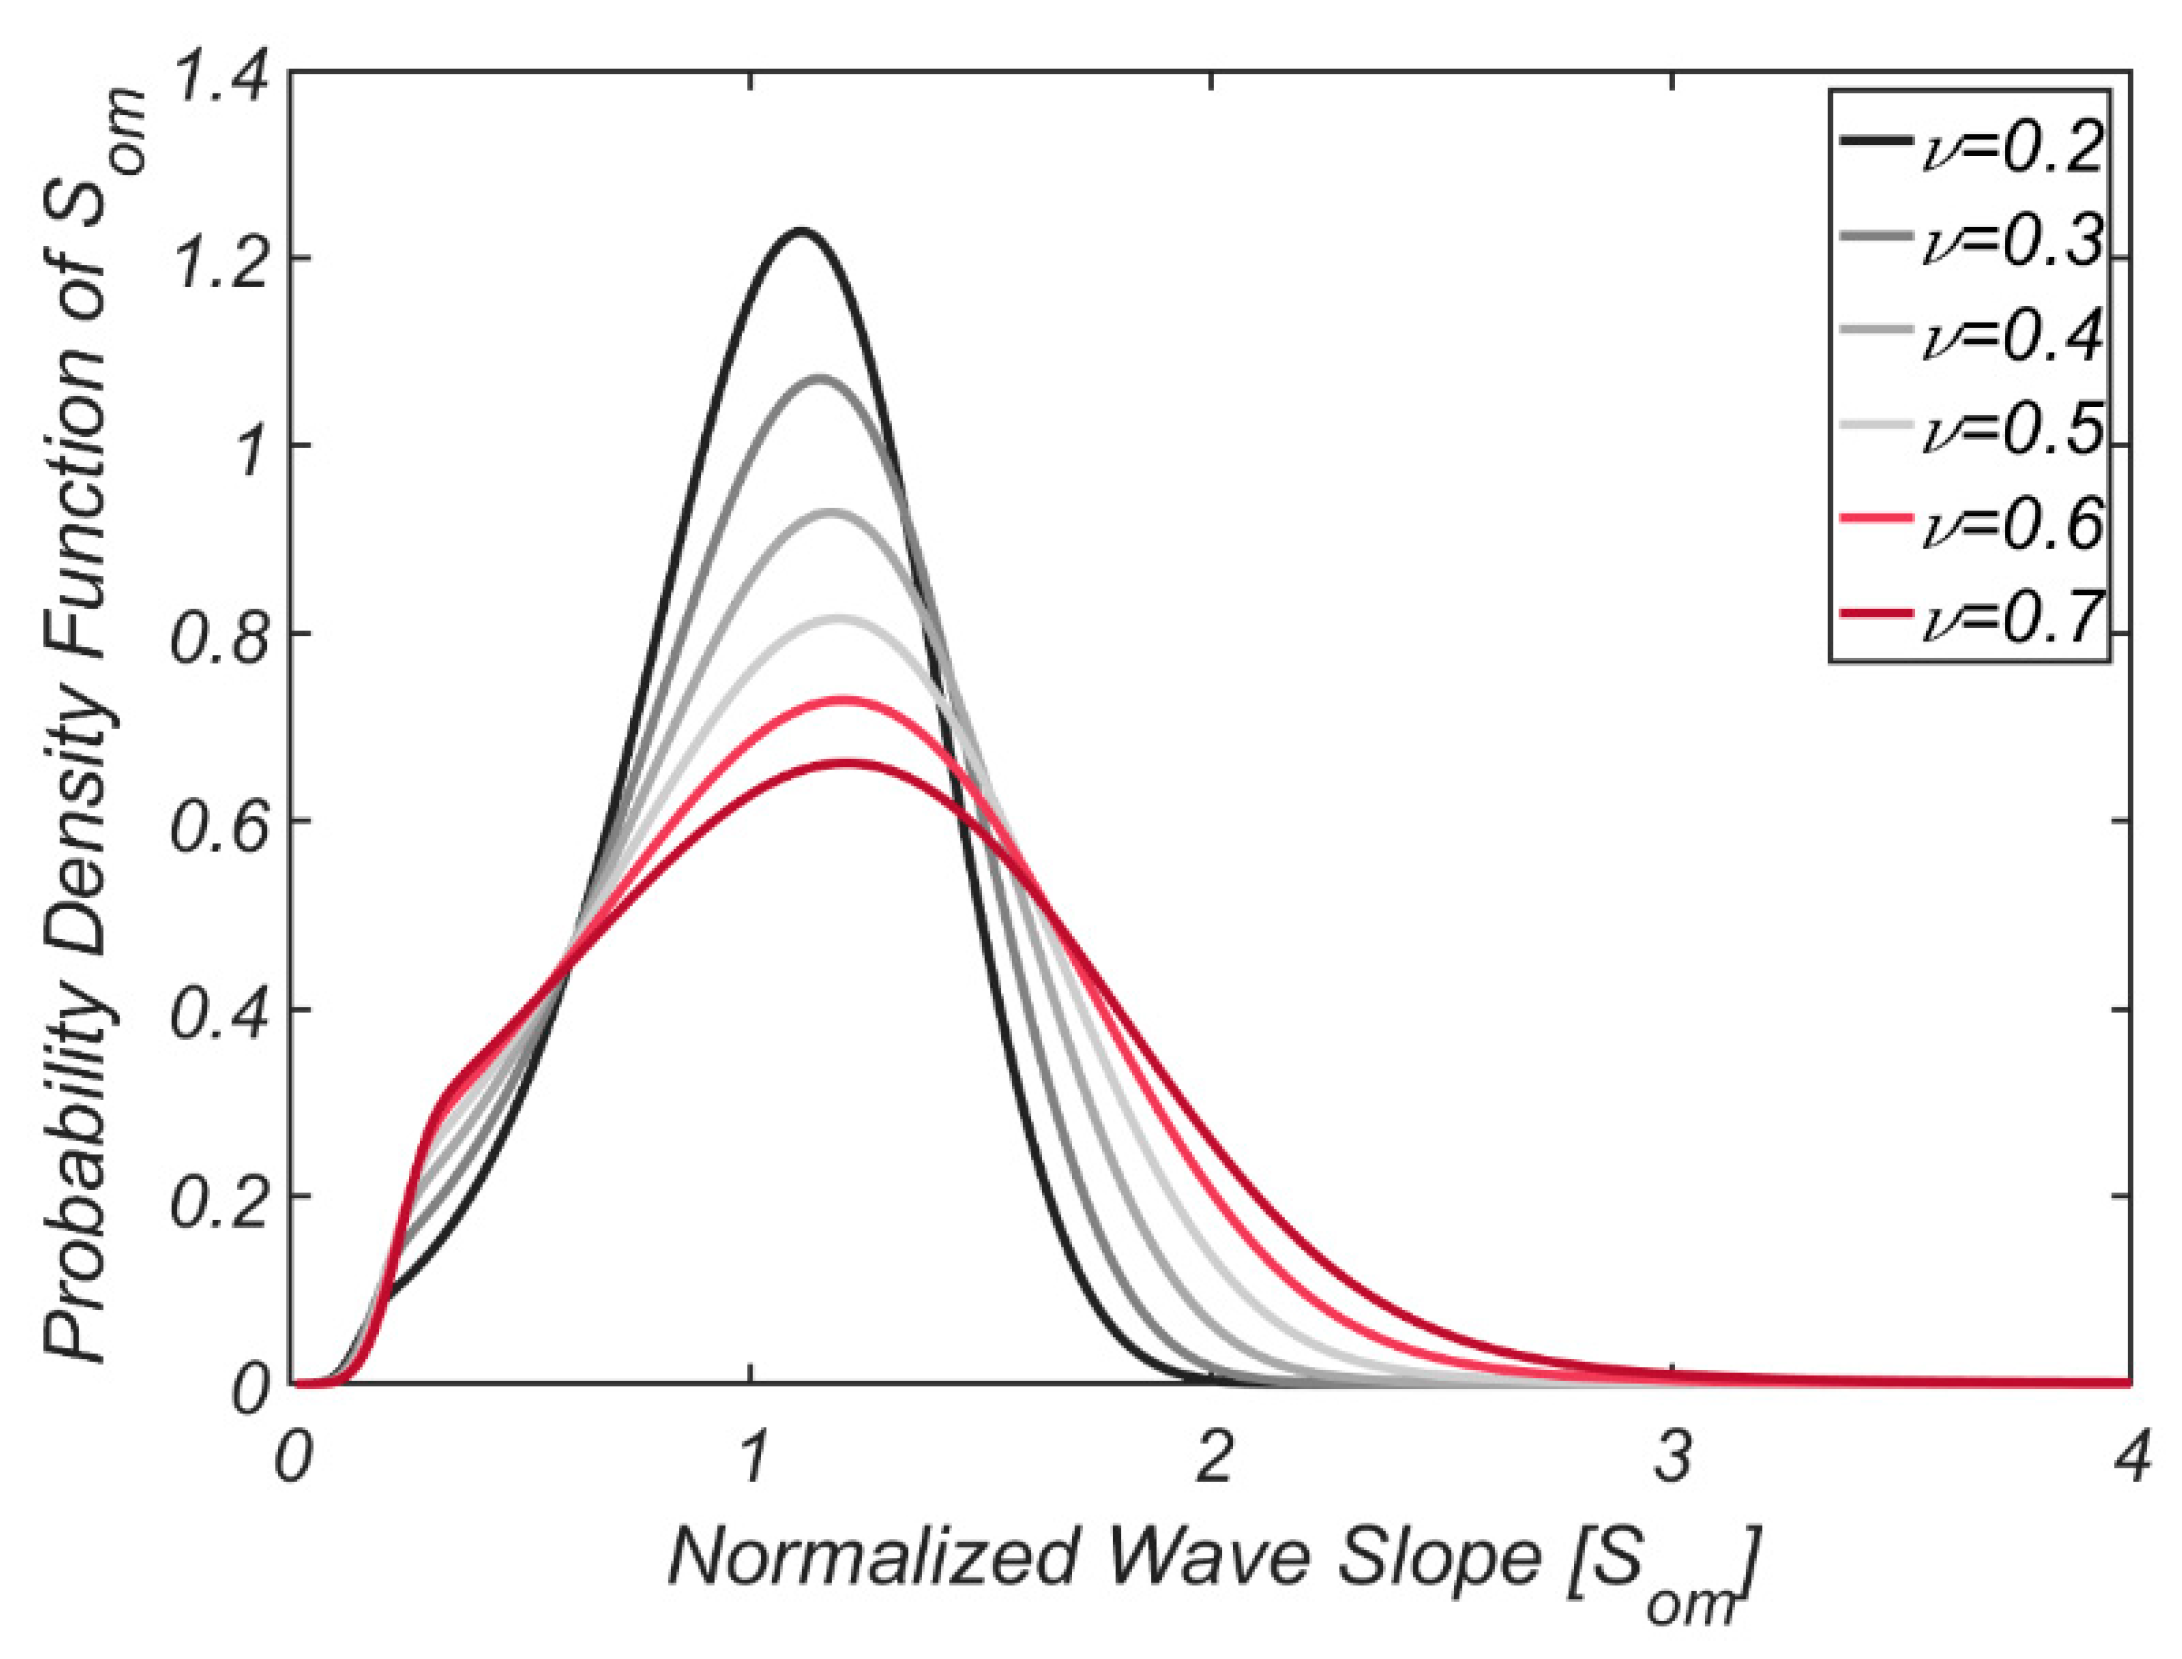
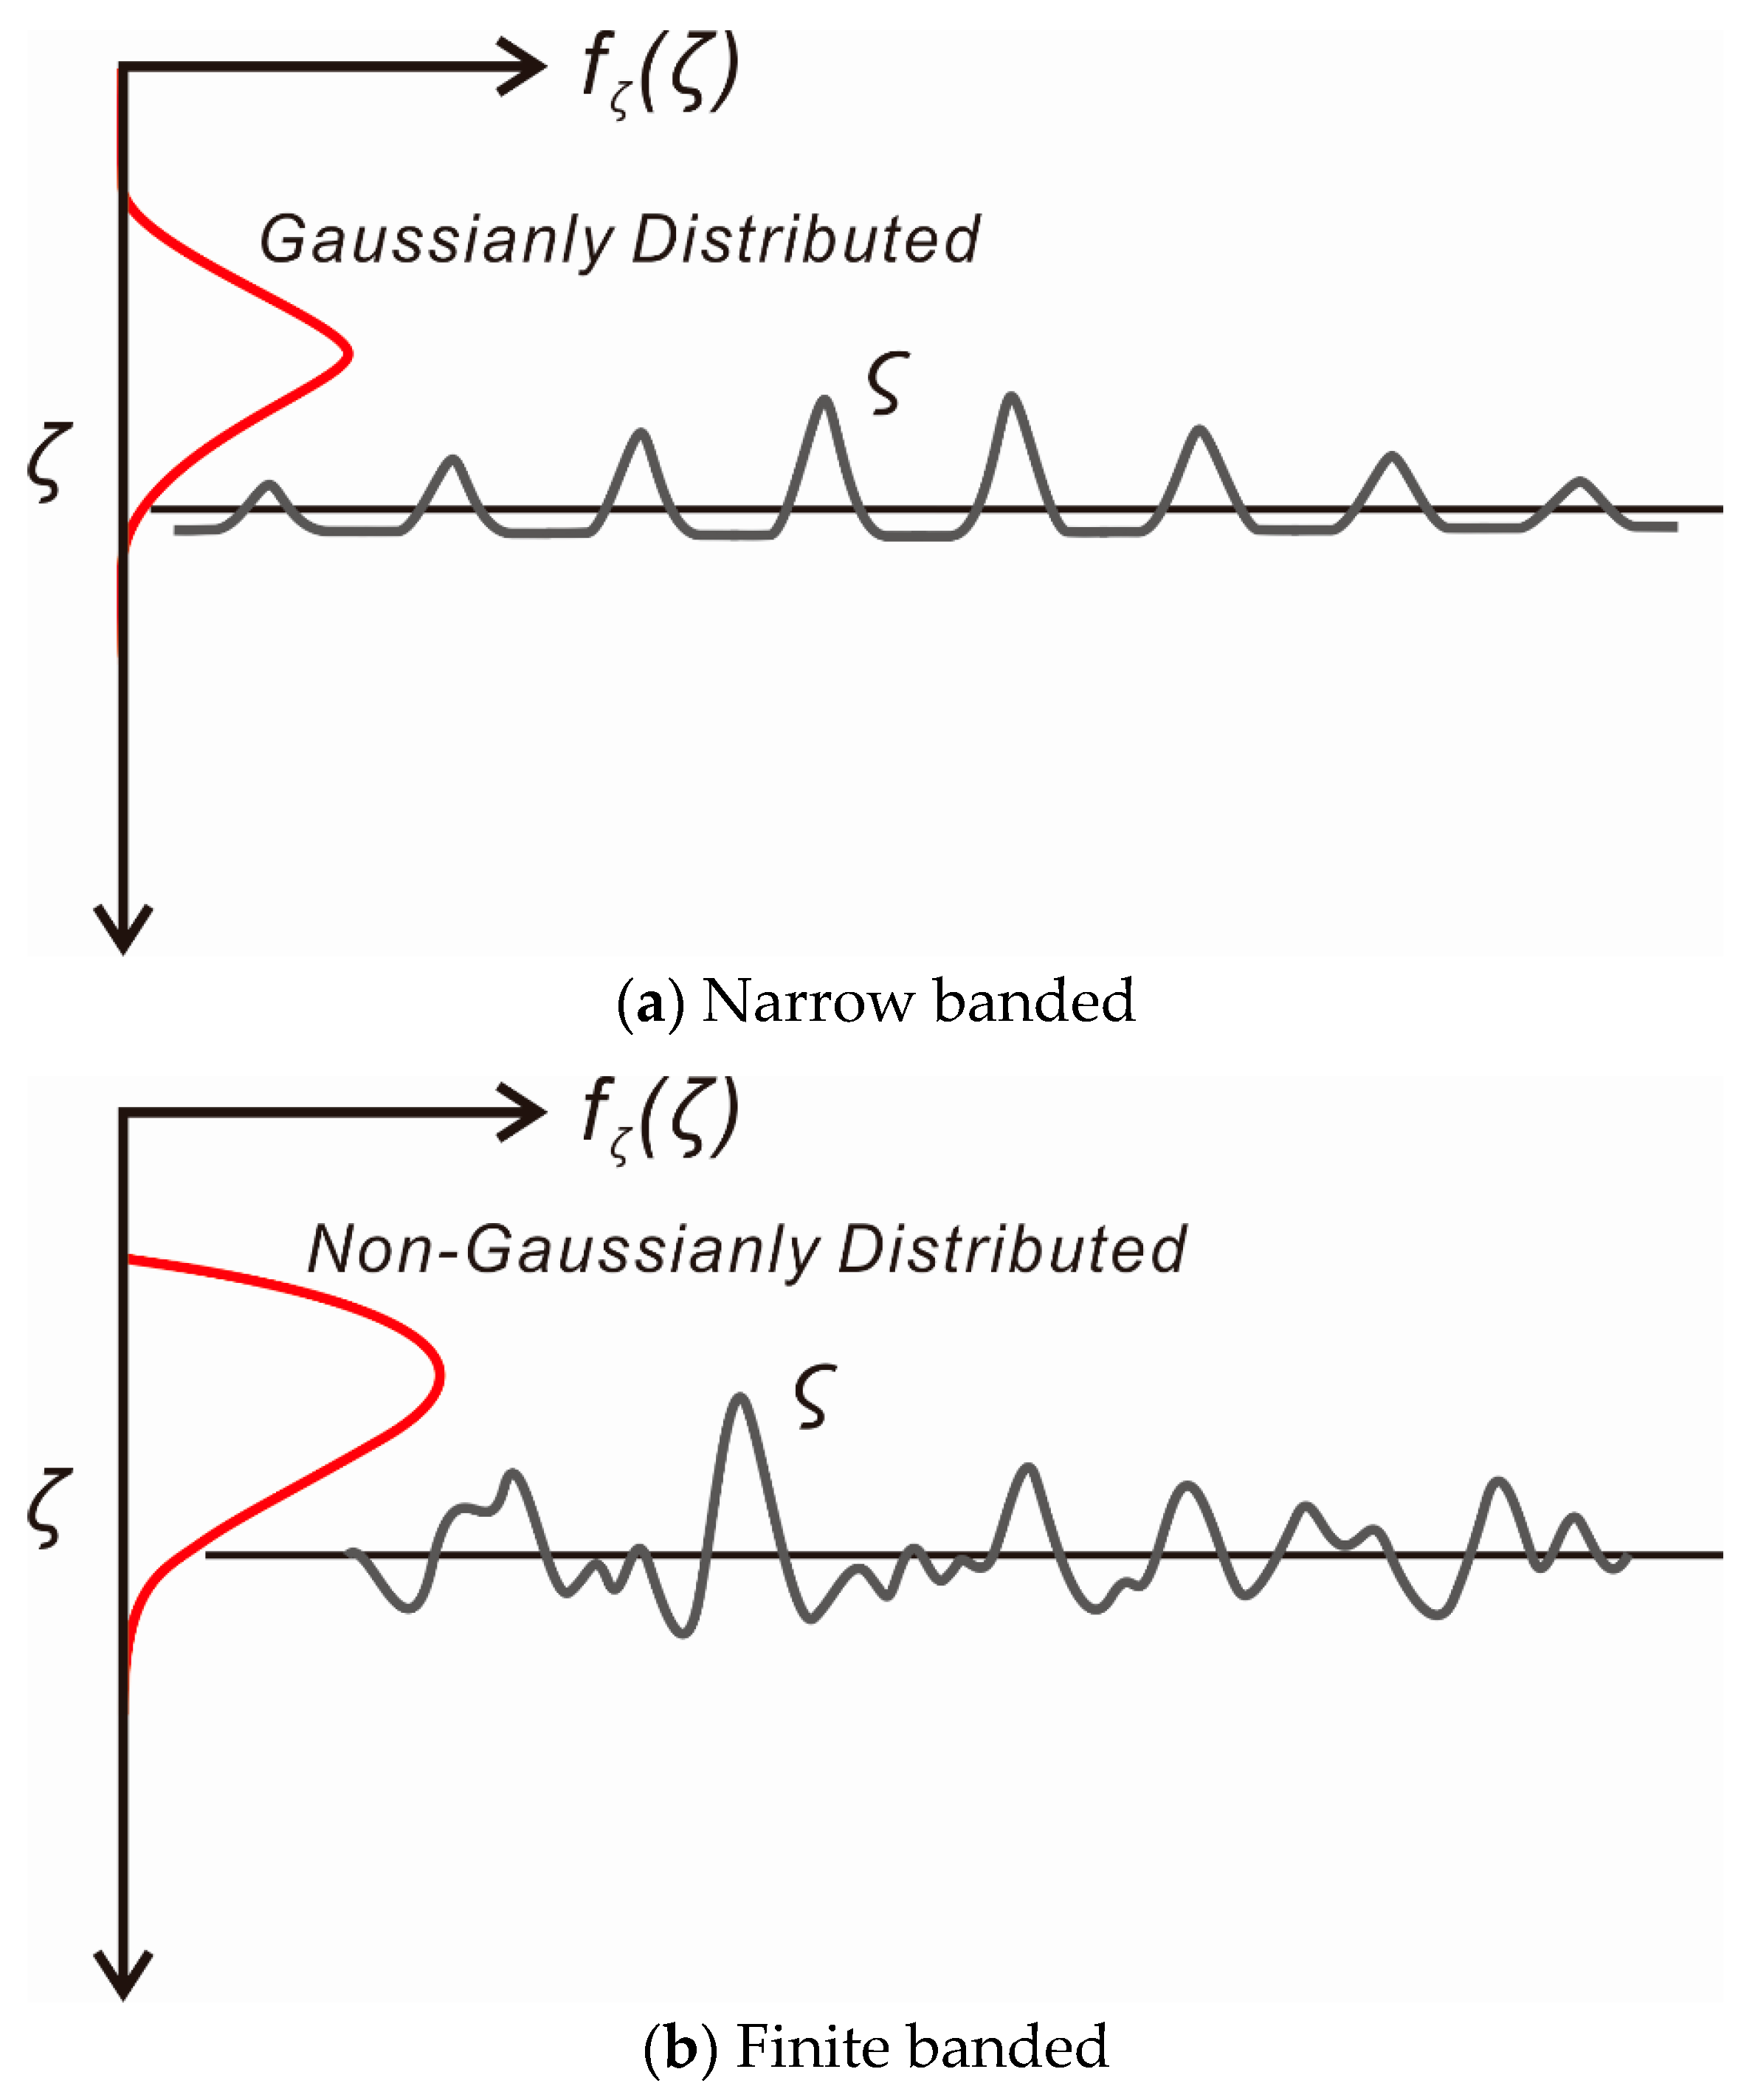
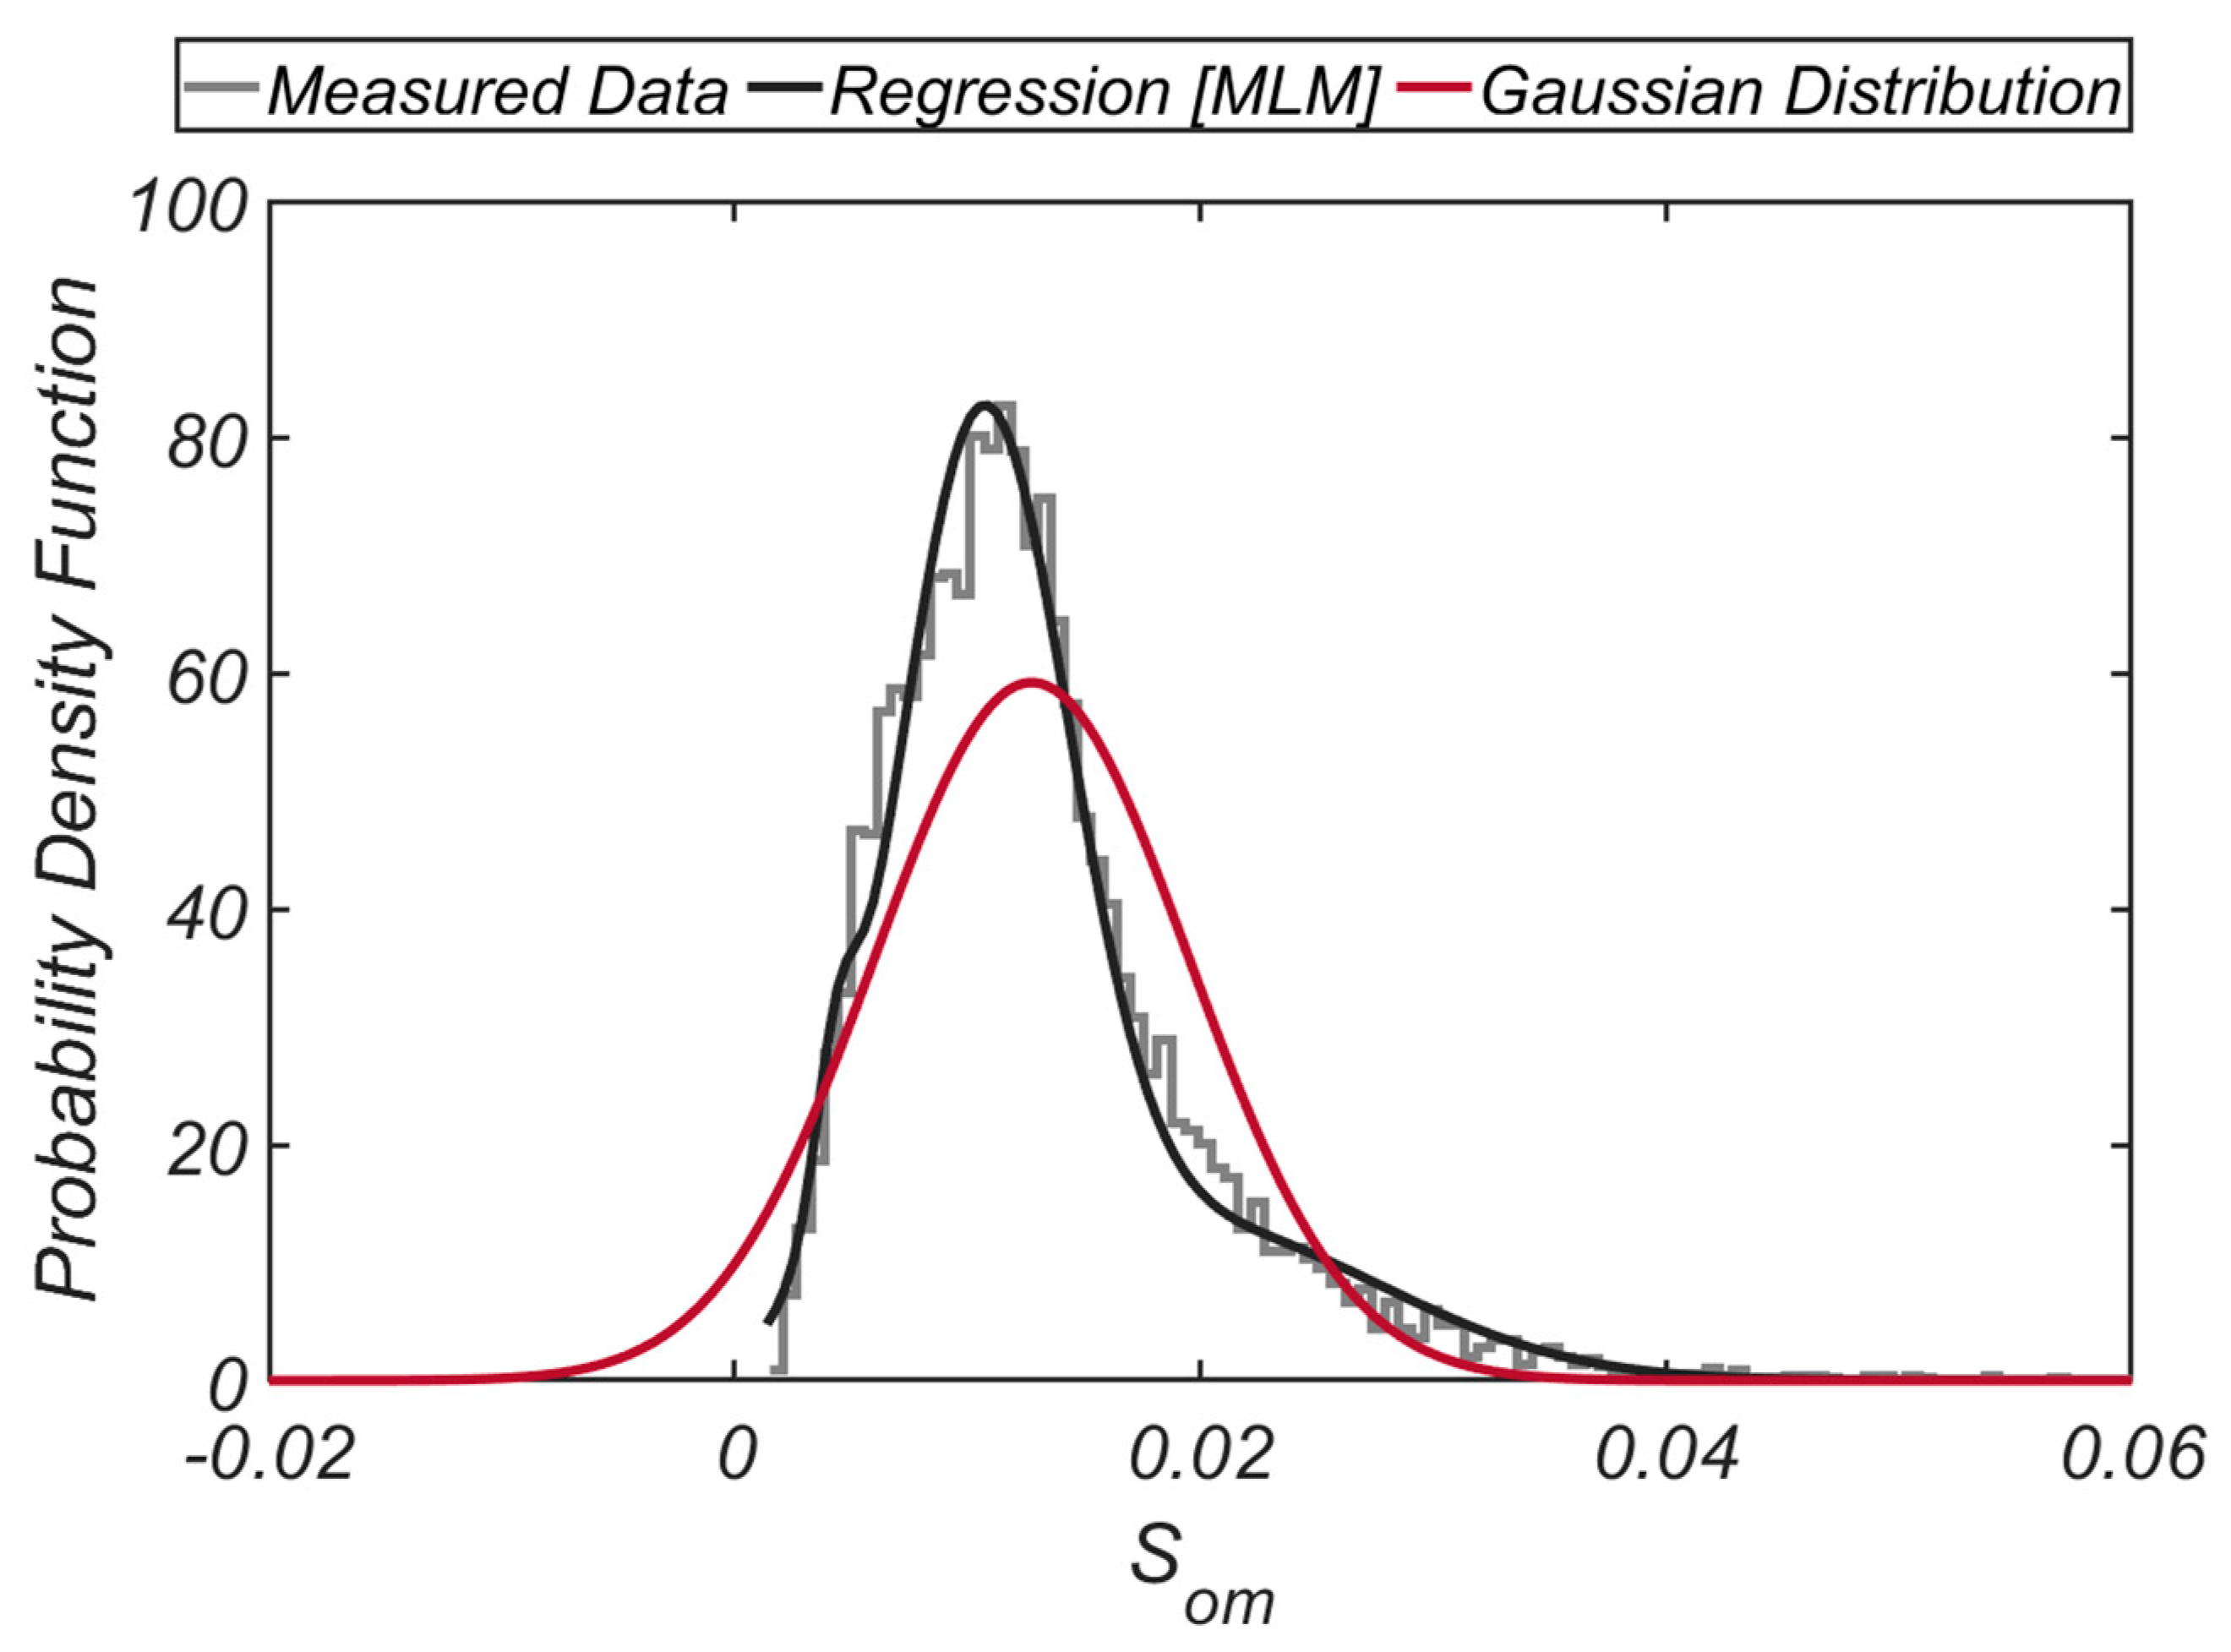
3.2.2. Non-Gaussian Wave Slope Distribution

Upon noting the limitations that Gaussian distribution presents, some efforts were made in this study to develop an alternative for Gaussian distribution preferred in Europe or the United States. As a result, the non-Gaussian distribution of wave slope is analytically derived from the joint distribution of wave amplitude and period by Longuet–Higgins [16] using the standard transformation technique of random variables [19]. In doing so, what improvements non-Gaussian wave slope distribution could make over the Gaussian distribution will also be examined.
The derivation of non-Gaussian wave slope distribution begins with the joint distribution of amplitude A and its associated period T by Longuet–Higgins [16], which can be written as:
f A T ( A , T ) = 1 4 2 π ν ( 1 + ν 2 4 ) ( A T ) 2 exp [ A 2 { 1 + 1 ν 2 ( 1 1 T ) 2 } ]
where ν is the bandwidth parameter and is defined as follows [16]:
ν = ( m o m 2 m 1 2 1 ) 1 / 2
In Equation (20), m i denotes the i t h moment of the wave spectrum S ς ς ( ω ) and can be written as:
m i = o ω i S ς ς ( ω ) d ω
where ω is the angular frequency.
After carrying out the deep-water approximation, wave slope can be written as:
S o m = H L o
= 4 π A g T 2
where L o is the deep water wave length.
Non-Gaussian wave slope distribution can be derived from Equation (22) using the standard random variables transformation technique [19]. However, as of now, only one relationship is available, and as a result, an auxiliary random variable should be introduced to solve these ill-posed problems, which can be written as:
S D = T
The derivation proceeds by first obtaining the joint distribution of S o m and S D , f S o m S D ( S o m , S D ) , from Equations (22) and (23), and the joint distribution of amplitude and its associated period f A T ( A , T ) defined in Equation (19) using the standard technique of transformation of random variables [19].
The transformation mentioned above can be written as:
f S o m S D ( S o m , S D ) = f A T ( A , T ) J | d ( A , T ) d ( S o m , S D ) |
In Equation (24), Jacobian J | | denotes the ratio of the area involved in mapping [ A , T ] [ S o m , S D ] .
Lastly, the wave slope distribution can be obtained by carrying out the integration of f S o m S D ( S o m , S D ) over the entire sample space of auxiliary random variable introduced to solve the ill-posed problem (marginal integration) and f S o m ( S o m ) , obtained in this way, can be written as:
f S o m ( S o m ) = o f S o m S D ( S o m , S D ) d S D
= 1 4 2 π ν ( 1 + ν 2 4 ) ( g 3 S o m 5 16 π 3 ) 2 o S D 4 exp [ f ( S D ) ] d S D
In Equation (25), f ( S D ) is given by:
f ( S D ) = ( g S o m 2 S D 2 4 π ) 2 [ 1 + ( 1 1 S D ) 2 ν 2 ]
Figure 6 shows f S o m ( S o m ) for ν = 0.2 , 0.3 , 0.4 , 0.5 , 0.6 , 0.7 , 0.8 . For the sake of comparison, Gaussian distribution with the same mean and standard deviation as non-Gaussian wave slope distribution presented in this study is included in Figure 7. In Figure 6, the enhanced bandwidth of the wave spectrum implies that sea wave conditions become harsh, and as a result, the number of component waves appearing in the random wave field increases. As resonant wave–wave interaction is initiated from a resonant triad formed among the component waves, the wave energy shift to longer and shorter waves, and these wave energy redistributions are intensified as the sea conditions become harsher [ ν 1.0 ], which is well known in the coastal engineering community after the studies of Hasselmann [29] and Phillips [30] on the development of wind waves. Interestingly, as the sea conditions become rough [ ν 1.0 ], the probability mass moves toward relatively steep and mild slope waves in Figure 6, which complies with the wave energy redistributions under resonant wave–wave interaction mentioned above. On the contrary, in Gaussian distribution, some anomalies such as the non-negligible occurrence probability of negative wave slope and overshooting near the mean wave slope can be found. In non-Gaussian wave slope distribution, when wave slope is relatively small, the probability increases rapidly from zero. After the rapid growth zone, it reaches the plateau, where the variation of wave slope distribution becomes mild. This trend becomes more pronounced with increasing ν (see Figure 6 and Figure 7).
These unique features of non-Gaussian wave slope distribution are concerned with long waves appearing in the wave field due to the nonlinear sub-harmonic resonant interaction. The presence of probability plateau can be foreseeable from the joint distribution of amplitude and period by Longuet–Higgins [16] shown in Figure 8. The increase in ν implies that nonlinearity is more pronounced, and as a result, long waves appear more frequently in the wave field due to the resonant wave–wave interaction (see Figure 9), and the probability of a relatively small wave slope increases, leading to the formation of probability plateau in the wave slope distribution mentioned above. In light of the Van der Meer equation, it can be easily perceived that the deformation of wave slope distribution enforced by the resonance interaction significantly affects the armor block’s hydraulic stability strength and its failure probability. Therefore, the non-Gaussian wave slope distribution presented in this study, which can account for the nonlinear sub-harmonic resonant interaction and its effects on the wave slope distribution, is expected to play a significant role in the reliability design practice of armor block.
Putting together the facts mentioned above, PIANC’s [18] recommendation that wave slope follows Gaussian distribution should be revised. Moreover, armor block reliability design based on the non-Gaussian wave slope distribution presented in this study could effectively address too conservatively designed armor block problems frequently occurred in developing the countermeasures against rough seas due to climate change.

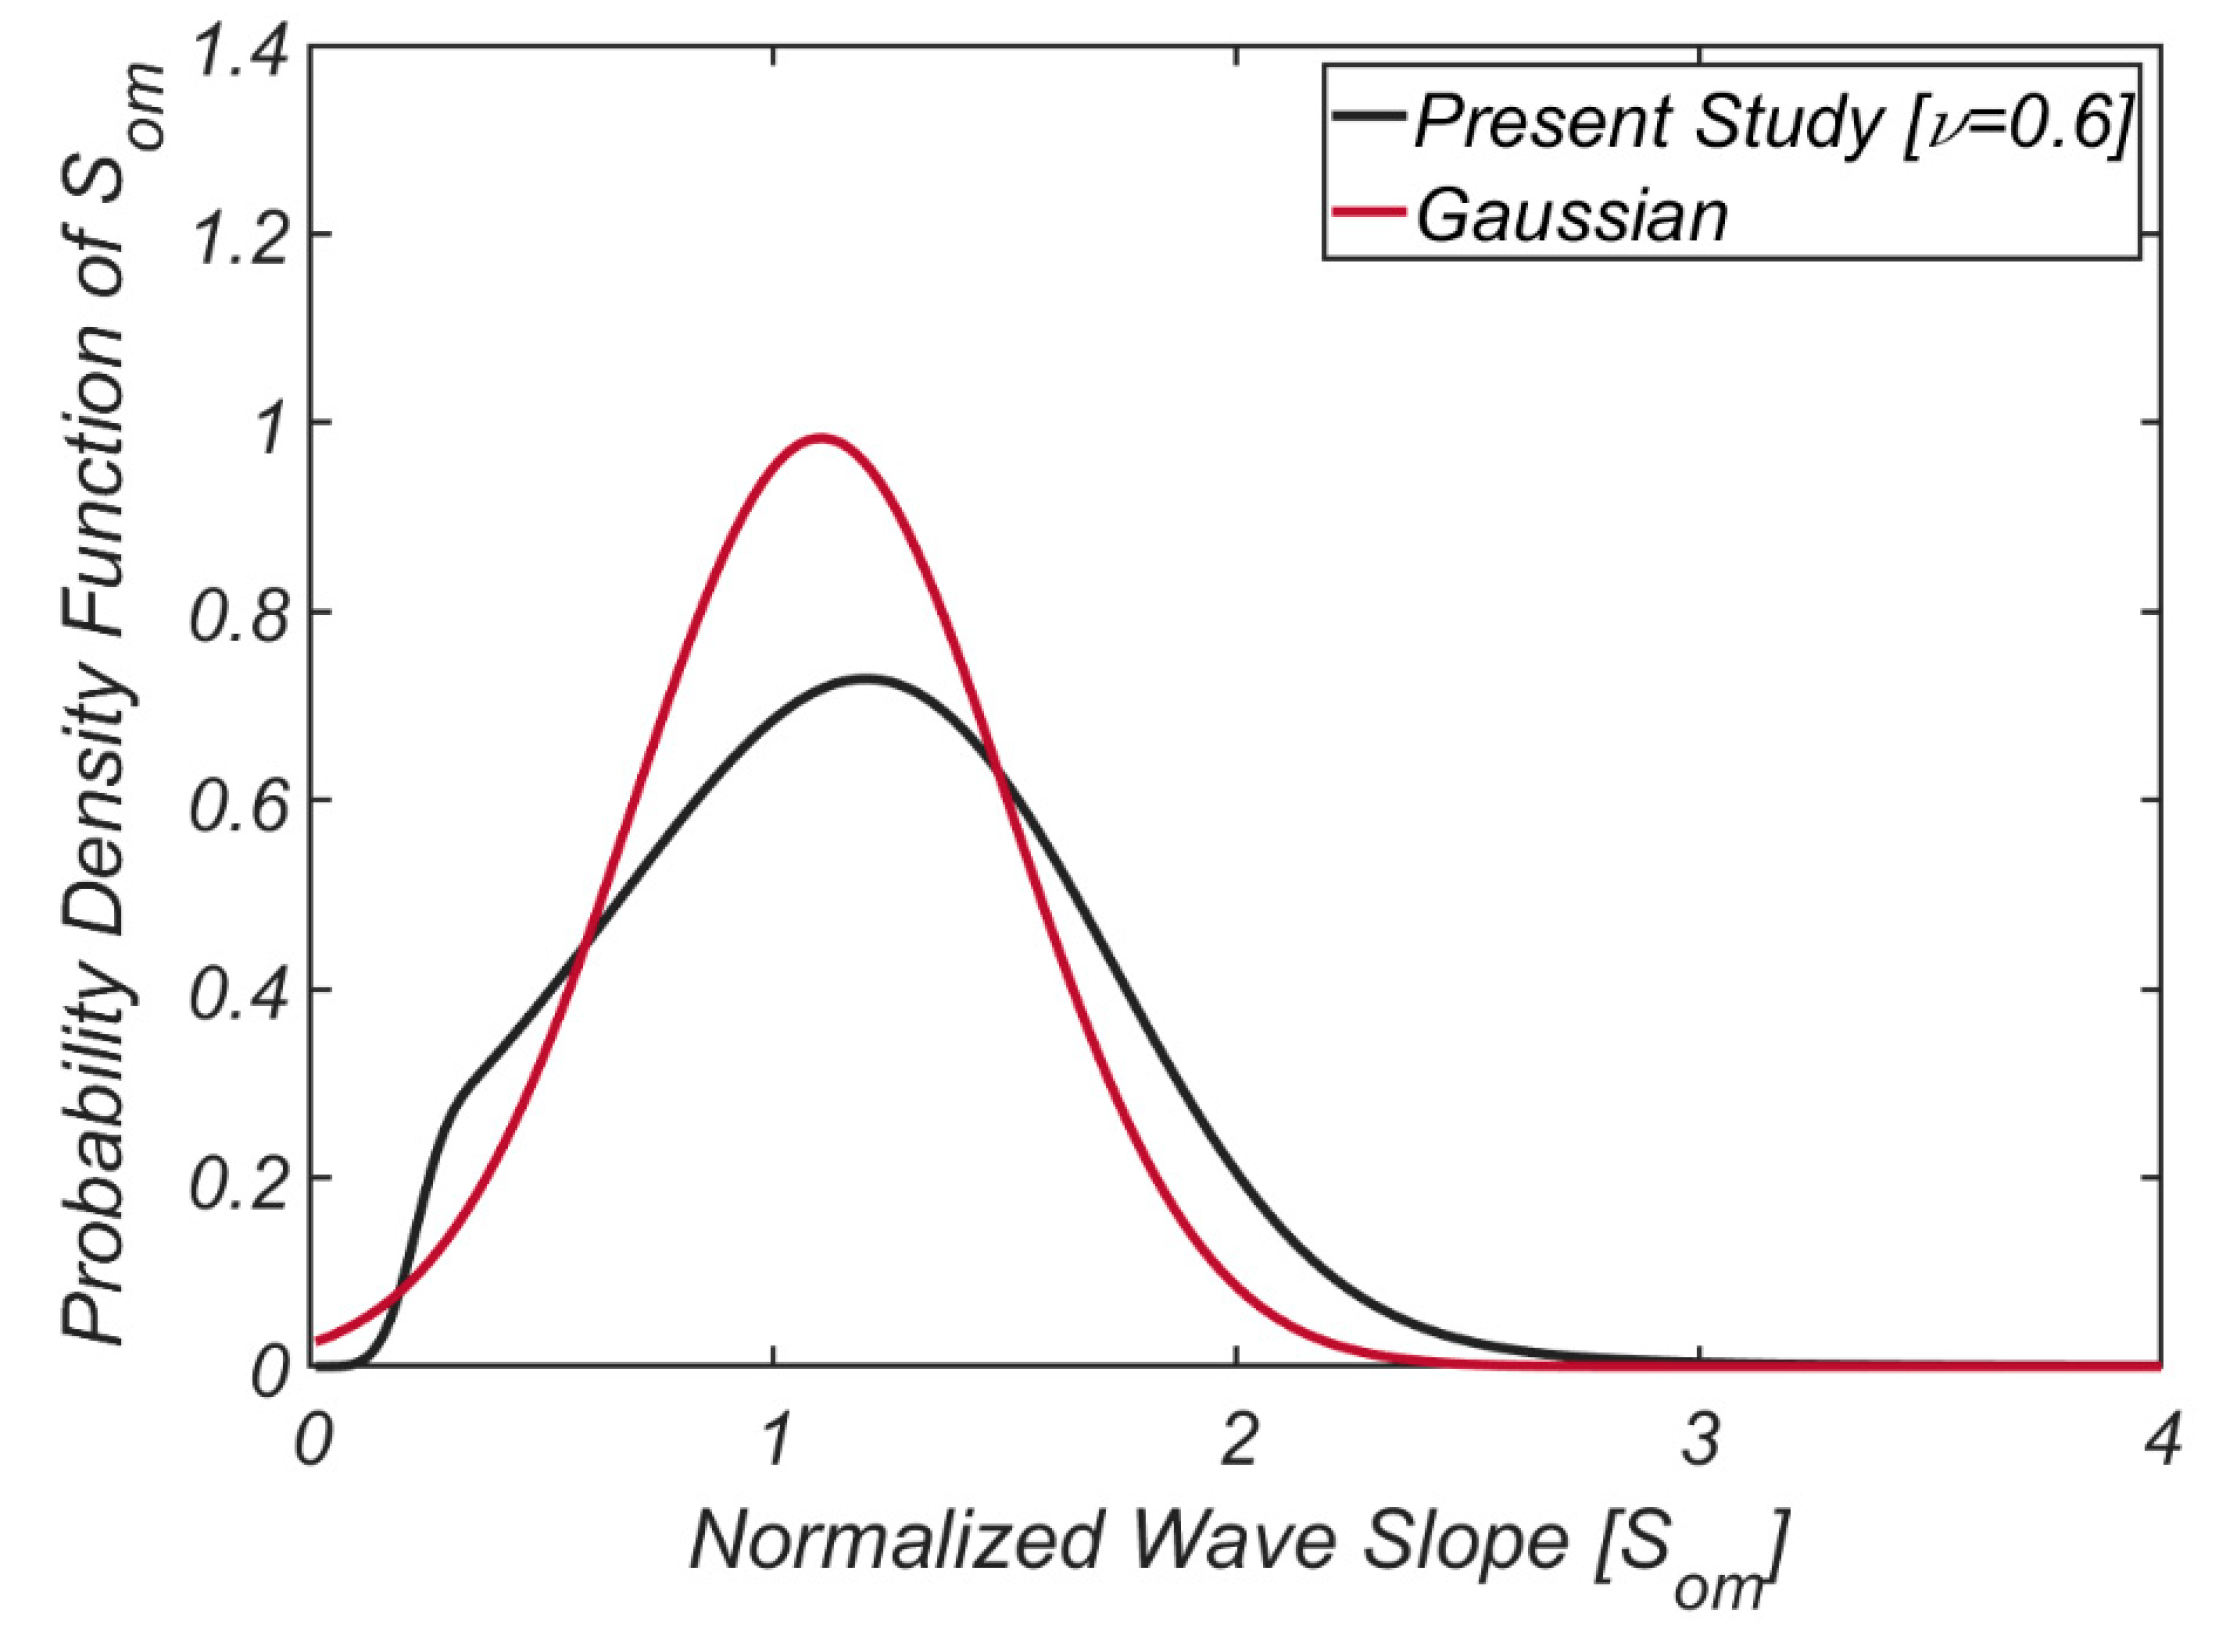
3.2.3. Verification of Non-Gaussian Wave Slope Distribution

In Figure 10, the times series data of measured peak wave period T P , significant wave height H S , and the wave slope S o m between 26 April 2017–20 April 2018 using an ultrasonic wave height meter (Nortek) near the Mang-Bang beach [ 129 ° 13 34.56 E, 37 ° 24 11.22 N] (see Figure 1) on the east coast of Korea were depicted. Figure 11 showed the frequency analysis results of the situ wave slope data, and for the sake of comparison, Gaussian distribution of the same mean and standard deviation was also included. As discussed in Section 3.2.2, the Gaussian distribution limitation, such as providing a non-negligible occurrence probability even on the negative wave slope, can be re-affirmed. The Gaussian distribution flaws such as under-prediction of longer and shorter waves and over-prediction of the medium-period waves can also be found.

4. Level III Reliability-Based Design of an Armor Block of Rubble Mound Breakwater

Based on the Van der Meer equation, the reliability function Z can be written as:
Z = ( 3.75 N o d 0.5 N z 0.25 + 0.85 ) S o m 0.2 Δ D n H S
= R S
With the given statistical properties of the reliability function Z , the reliability of the structure defined as the probability of Z > 0 can be written as:
P [ Z > 0 ] = 1.0 P f [ Z > 0 ]
Even though the reliability function Z depends on six mutually independent random processes such as the N o d , N z , Δ , D n , H S and S o m ; hereafter, the reliability function Z is assumed to depend on the armor block’s hydraulic stability strength R and wave force S acting on the structure for the sake of convenience in the following analysis of armor block’s failure probability.
In this case, the typical behavior characteristics of the reliability function Z in the [ R , S ] plane can be depicted such as in Figure 12. In Figure 12, the joint distribution of R and S is also included for comparison. In Figure 12, f R ( r ) and f S ( s ) denote the probability density function of the armor block’s hydraulic stability strength and wave force, respectively. Red dotted line denotes the limiting state, and black solid line denotes the linear approximation of the limiting state Z = 0 .
When Level III reliability-based design is applied, the failure probability is analytically derived by carrying out the integration of the probability density function of Z over the sample space where Z < 0 , which can be written as:
P [ Z < 0 ] = Z < 0 f Z ( z ) d z
= Z < 0 f R ( R ) f S ( S ) d R d S = Z < 0 f X i ( X 1 ) f X 2 ( X 2 ) f X n ( X n ) d X 1 d X 2 d X n
Assuming that the armor block’s hydraulic stability strength and wave force acting on the structure are mutually independent, the joint distribution of R and S , f R S ( R , S ) , can be written as:
f R S ( R , S ) = f R ( R ) f S ( S )
Further assuming armor block’s hydraulic stability strength and wave force to depend on the wave slope S o m and H S , R can be written as:
R = A S o m 0.2
where A is given by:
A = ( 3.75 N o d 0.5 N z 0.25 + 0.85 ) Δ D n
As the probabilistic model of wave force S = H S T , Weibull distribution is preferred in Europe and the United States, which can be written as [27]:
f H S T ( H ) = κ W H W ( H H W ) κ W 1 exp [ ( H H W ) κ W ]
where H W is the scale factor, and κ W is the shape factor.
Assuming that wave force follows the Weibull distribution, the mean E [ H S T ] and variance E [ H S T 2 ] of wave force can be written as:
E [ H S T ] = H W Γ [ 1 + 1 κ W ]
E [ H S T 2 ] = H W 2 ( Γ [ 1 + 2 κ W ] Γ 2 [ 1 + 1 κ W ] )
In Equations (34) and (35), E [ ] denotes the expected value of the random variable in the bracket, and Γ [ ] is the Gamma function [31].
Applying the standard transformation technique of random variables [19] to Equation (31), the probability density function of armor block’s hydraulic stability strength R can be written as:
f R ( R ) = f S o m ( S o m ) J | d S o m d R |
where Jacobian J | | denotes the ratio of the area involved in mapping [ S o m ] [ R ] .
After completing the transformation involved in Equation (36); finally, the probability density function of R can be written as:
f R ( R ) = 5 A 2 π σ S ( A R ) 6 exp [ 1 2 ( ( A R ) 5 μ S σ S ) 2 ]   
From Equations (29), (30), (33), and (37), the failure probability of armor block P [ R < S ] can be written as:
P [ R < S ] = R = 0 S = R f R S ( R , S ) d R d S
Here, upon assuming that the armor block’s hydraulic stability strength and wave force are mutually independent, Equation (38) can be rewritten as:
P [ R < S ] = R = 0 f R ( R ) d R S = R f S ( S ) d S
After substituting the Weibull distribution into Equation (39) and carrying out the integration, the following relationship can be obtained:
S = R f S ( S ) d S = 1 0 S = R f S ( S ) d S
= exp [ ( R H P ) κ W ]
After inserting Equation (40) into Equation (39) and carrying out the integration (see Figure 13); lastly, the failure probability of armor block P [ R < S ] can be written as:
P [ R < S ] = 1 2 μ σ e f ( ς ) d ς
where f ( ς ) is given by:
f ( ς ) = 1 2 ς 2 ( A H W ) κ W ( μ S σ S ς ) κ W 5
Even though the armor block’s failure probability P [ R < S ] in Equation (41) cannot be given in closed form, using the stationary phase method [32] based on the fact that the integrand in Equation (41) is concentrated near the peak ς = ς o , P [ R < S ] in Equation (41) can be written as:
P [ R < S ] = 1 2 e f ( ς o ) | f ( ς o ) | 2
where f ( ς o ) is given by:
f ( ς o ) = 1 κ W 5 ( κ W 5 + 1 ) ( A H W ) κ W σ S 2 ( μ S σ S ς o ) κ W 5 + 2
Stationary point ς o in Equations (43) and (44) can be evaluated from the following relationship:
f ( ς o ) = ς o κ W σ S 5 ( A H W ) κ W ( μ S σ S ς o ) κ W 5 1
= 0

5. Numerical Results

5.1. Level III Reliability-Based Design of an Armor Block Using the Probabilistic Model of Wave Height Optimized for the Korean Sea Wave Conditions and Gaussian Wave Slope Distribution

The modified Glukhovskiy distribution by Choi and Cho [1] can be rewritten as follows:
F H ( h ) = P [ H < h ]
= 1 exp [ A P ( H H p ) κ p ] = 1 exp [ ( H H p A P 1 / κ p ) κ p ]   
Therefore, it can be easily perceived that probability parameter in Weibull distribution can be written as
H W = H p A P 1 / κ p
κ W = κ p
To demonstrate the robustness of the probabilistic model presented in this study, the probability density functions of the armor block’s hydraulic stability strength for varying D n [ 2.0 , 2.05 , , 2.5 m ] were depicted in Figure 14. It was shown that with the increase in D n , a significant probability mass shifts to the higher hydraulic stability strength of armor block as expected, and in doing so, the standard deviation also increases. As D n is increasing by 0.05 m, the armor block’s hydraulic stability strength increases by as much as 2.5%. In Figure 15, the joint distribution of R and S was depicted for D n = 1.9 m and 2.3 m , respectively. It was shown that as D n is decreasing, a significant probability mass shifts to the weaker hydraulic stability strength of armor block.
Figure 16 shows armor block failure probability as D n varies, and the failure probability evaluated based on the Weibull distribution is also included for comparison. In the Weibull distribution, the armor block’s failure probability is overestimated compared to the probabilistic wave height model optimized for the Korean marine environment, which means that the armor block has been designed too conservatively. In Table 1 and Table 2, properties of probability parameters used in the simulation are listed.

5.2. Level III Reliability-Based Design of an Armor Block Using the Probabilistic Model of Wave Height Optimized for the Korean Sea Wave Conditions and the Non-Gaussian Wave Slope Distribution

In this section, the effect of the non-Gaussian wave slope distribution (see Section 3.2.2) on the joint distribution of armor block’s hydraulic stability strength R and wave force S , the probability density function of armor block’s hydraulic stability strength, and armor block’s failure probability will be examined. Figure 17 shows the joint distribution of the armor block’s hydraulic stability strength and wave force for D n = 2.3 m and ν = 0.4 , and the joint distribution of the armor block’s hydraulic stability strength and wave force based on the Gaussian wave slope distribution was also included for comparison. The most discernable difference is that in the case of non-Gaussian wave slope distribution, the center of probability mass shifts toward the weaker hydraulic stability strength of armor block [ 3.1 < R < 3.4 ], and in doing so, the sample space in the [ R S ] plane where non-negligible probability mass resides shrinks as well. Figure 18 shows the variation of the probability density function of the armor block’s hydraulic stability based on the non-Gaussian wave slope distribution as wave conditions become harsher.
It is worthy of note that as sea wave conditions are becoming harsher, the armor block’s weakened hydraulic stability strength is quantitatively verified. Moreover, as sea wave conditions are becoming harsher [ ν 1.0 ], the probability density mass shifts toward stronger and weaker hydraulic stability strength of armor block, which also complies with the deformation characteristics of the non-Gaussian wave slope distribution enforced by the nonlinear resonant wave–wave interaction (see Section 3.2.2).
In Table 3, the most probable armor block strength for varying bandwidth of wave spectrum was summarized. In Figure 19, the probability density function of R based on the non-Gaussian wave slope distribution is compared with the one based on the Gaussian distribution for D n = 2.3 m , and ν = 0.6 . It was shown that while armor block’s hydraulic stability strength R should have a larger value [ 3.8 < R < 5.0 ] in the mild seas where moderate swells are prevailing, in Gaussian wave slope distribution, mild seas are occurring less frequently, leading to the under-estimation of armor block’s hydraulic stability strength.
In order to examine how the non-Gaussian wave slope distribution affects the failure probability of armor block P [ R < S ] , in Figure 20, P [ R < S ] as D n varies was depicted, and P [ R < S ] based on the Gaussian wave slope distribution was also included for comparison. In the Gaussian wave slope distribution, the armor block’s failure probability was over-estimated, and these trends are enhanced when D n is small. On the other hand, the over-estimation problem is diminished as D n is becomes larger.

6. Conclusions

The armor block of rubble mound breakwater built in a rough sea should be designed to be robust enough to survive even in harsh wave conditions. However, most armor block of a rubble mound breakwater in Korea has been designed using a deterministic design method based on Hudson equation [2]. Lately, in developing countermeasures against rough seas due to climate change, the Hudson equation’s stability coefficient was readjusted to have smaller values, and as a result, it was not difficult to find the enormous armor blocks such as a TTP of 100 t. These design practices have raised a critique in the coastal engineering community that the port’s outer facilities in Korea are too conservatively designed. An alternative that can address the limitations that the deterministic design method presented seems to be reliability design. If the irregularities inherent in the marine environment are considered, reliability design should be carried out based on the long-term wave data. However, situ wave data continuously measured over a long period are very rare in Korea. Therefore, reliability design was performed based on the probability model preferred in the United States [3,4,5].
In this rationale, this study developed a reliability design method of armor block of rubble mound breakwaters based on the Van der Meer equation and a probabilistic wave height model optimized for the Korean marine environment. In this process, the armor block’s failure probability is analytically derived from the Van der Meer equation using the random variable transformation technique [19]. Now that the armor block’s failure probability is analytically derived, this study’s design method could be classified as a Level III reliability design. The design method presented in this study does not depend on the specific probability distribution of the random variables involved in the van der Meer equation and can be extended to any kinds of probability distributions available in the literature [18].
To demonstrate what distinguishes this study from the others, numerical simulation was first carried out, assuming that the wave slope follows the Gaussian distribution recommended by PIANC [18]. In doing so, the modified Glukhovskiy distribution by Choi and Cho [1] was used as a probabilistic wave height model. It was shown that Gaussian wave slope distribution has flaws such as the over-estimated failure probability of armor block and the non-negligible occurrence probability of the negative wave slope. It was also shown that Gaussian wave slope distribution over-predicted longer and shorter waves and under-predicted waves of the medium period. Upon noting the limitation of Gaussian distribution, some efforts were also made to develop an alternative for Gaussian distribution. As a result, the non-Gaussian wave slope distribution was analytically derived from the joint distribution of wave amplitude and period by Longuet–Higgins [16] using the random variable transformation technique.
Numerical results showed that non-Gaussian distribution could effectively address the limitations of Gaussian distribution due to its capability to account for the nonlinear resonant wave–wave interaction and its effects on the wave slope distribution. In the case of Gaussian wave slope distribution, the armor block’s failure probability was over-estimated, and these trends were enhanced when the armor block is small. On the other hand, these over-estimation problems were diminished as the armor block became larger. These discrepancies occurred since the armor block should be more robust and of immense hydraulic stability strength in the mild seas where mild slope waves prevail. However, Gaussian wave slope distribution predicted that mild slope waves occurred less frequently in the mild seas due to its lack of apparatus accounting for the nonlinear sub-harmonic resonant wave–wave interaction.
In light of the Van der Meer equation, it can be easily perceived that the deformation of wave slope distribution enforced by the presence of long waves appeared in wave field due to the nonlinear sub-harmonic wave–wave interaction has a significant effect on the armor block’s hydraulic stability strength and its failure probability. Therefore, the non-Gaussian wave slope distribution presented in this study could play an indispensable role in resolving the controversial issue such as whether or not enormous armor blocks like a Tetrapod of 100 t frequently mentioned in developing the countermeasures against the rough seas due to climate change is too conservatively designed.
However, it is worth mentioning that even though the Level III reliability design method of an armor block presented in this study is not limited to a specific site, to extend its application to other sites such as the west coast of Korea, it is a prerequisite that the probability parameters of modified Glukhovskiy wave height distribution should be re-evaluated using the hindcasted wave data for at least 15 years.

Funding

This research received funding as stated in Acknowledgments.

Institutional Review Board Statement

Not applicable.

Informed Consent Statement

Not applicable.

Data Availability Statement

No new data were reported.

Acknowledgments

This research was a part of the project titled ’Practical Technologies for Coastal Erosion Control and Countermeasure’, funded by the Ministry of Oceans and Fisheries, Korea. The author would like to thank the Korean Ministry of Oceans and Fisheries for funding this project.

Conflicts of Interest

The author declares no conflict of interest.

References

  1. Choi, S.H.; Cho, Y.J. Development of a probabilistic model for the estimation of yearly workable wave condition period for offshore operations-centering on the sea off the Ulsan harbor. J. Korean Soc. Coast. Ocean Eng. 2019, 31, 115–128. [Google Scholar] [CrossRef] [Green Version]
  2. US Army Corps of Eng. Shore Protection Manual, 4th ed.; Coastal Eng. Res. Center, US Government Printing Office: Washington, DC, USA, 1984. [Google Scholar]
  3. Kim, S.W.; Suh, K.D.; Oh, Y.M. Comparative study of reliability design methods by application to Donghae Harbor breakwaters. 1. Stability of amour blocks. J. Korean Soc. Coast. Ocean Eng. 2005, 17, 188–201. [Google Scholar]
  4. Kim, S.W.; Suh, K.D.; Lee, C.E.; Park, D.H. Reliability analyses of breakwater armor blocks of harbors in Korea. J. Korean Soc. Coast. Ocean Eng. 2009, 21, 15–29. [Google Scholar]
  5. Suh, K.D.; Kweon, H.M.; Yoon, H.D. Calculation of expected damage to breakwater armor blocks considering variability in wave Direction. J. Korean Soc. Coast. Ocean Eng. 2003, 15, 21–32. [Google Scholar]
  6. Cho, Y.J.; Kim, I.H. Preliminary study on the development of platform for the selection of an optimal beach stabilization measures against the beach erosion–centering on the yearly sediment budget of the Mang-Bang beach. J. Korean Soc. Coast. Ocean Eng. 2019, 31, 28–39. [Google Scholar] [CrossRef]
  7. Cho, Y.J.; Kim, I.H.; Cho, Y.J. Numerical analysis of the grand circulation process of Mang-Bang beach-centered on the shoreline change from 2017.4.26 to 2018.4.20. J. Korean Soc. Coast. Ocean Eng. 2019, 31, 101–114. [Google Scholar] [CrossRef]
  8. Chang, P.S.; Cho, Y.J. Preliminary study on the development of a platform for the optimization of beach stabilization measures against beach erosion III—Centering on the effects of random Waves occurring during the unit observation period, and infra-gravity waves of bound mode, and boundary layer streaming on the sediment transport. J. Korean Soc. Coast. Ocean Eng. 2019, 31, 434–449. [Google Scholar]
  9. Van der Meer, J.W. Deterministic and probabilistic design of break water armor blocks. Proc. Am. Soc. Civ. Eng. J. Waterw. Ports Coastal Ocean Eng. Div. 1988, 114, 1. [Google Scholar]
  10. Van der Meer, J.W. Stability of Cubes, Tetrapodes and Accropode. In Proceedings of the Breakwaters ’88 Conference, Eastbourne, UK, 4–6 May 1988; Design of Breakwaters, Institution of Civil Engineers: London, UK, 1988; pp. 71–80. [Google Scholar]
  11. Van der Meer, J.W. Design of concrete armor layers. In Proceedings Coastal Structures ’99; Balkema: Rotterdam, The Netherlands, 2000; pp. 213–221. [Google Scholar]
  12. Battjes, J.A.; Groenendijk, H.W. Wave height distributions on shallow fore-shores. Coast. Eng. 2000, 40, 161–182. [Google Scholar]
  13. Klopman, G.; Stive, M.J.F. Extreme waves and wave loading in shallow water. Presented at the E&P Forum Workshop in Paris, Delft Hydraulics, The Netherlands, 25–26 October 1989. [Google Scholar]
  14. Forristall, G.Z. Wave crest distribution: Observations and second-order theory. J. Phys. Oceanogr. 2000, 30, 1931–1943. [Google Scholar] [CrossRef]
  15. Cavanie, A.; Arhan, M.; Ezraty, R. A statistical relationship between individual heights and periods of storm waves. Proc. Conf. Behav. Offshore Struct. 1976, 2, 354–360. [Google Scholar]
  16. Longuet-Higgins, M.S. On the Joint Distribution of Wave Periods and Amplitudes in a Random Wave Field. Proc. Roy. Soc. Lond. 1983, 389, 241–258. [Google Scholar]
  17. Park, S.H.; Cho, Y.J. Joint distribution of wave crest and its associated period in nonlinear random waves. J. Korean Soc. Coast. Ocean Eng. 2019, 31, 278–293. [Google Scholar] [CrossRef] [Green Version]
  18. PIANC. Analysis of Rubble Mound Breakwaters; Report of working group 12 of PTC II; Supplement to Bulletin No. 78/79; PIANC General Secretariat: Brussels, Belgium, 1992; ISBN 2-87223-047-5. [Google Scholar]
  19. Papoulis, A. Probability, Random Variables and Stochastic Processes; McGraw-Hill book Co.: New York, NY, USA, 1965. [Google Scholar]
  20. Thompson, D.M.; Shuttler, R.M. Riprap Design for Wind-Wave Attack-a Laboratory Study in Random Waves; Report 61; Report EX 707 Hydraulics Research: Wallingford, UK, 1975. [Google Scholar]
  21. Burcharth, H.F.; Sorensen, J.D. The PIANC safety factor system for breakwaters. In Proceedings of the International Conference Coastal Structures ’99, Santander, Spain, 7–10 June 1999; pp. 1125–1144. [Google Scholar]
  22. Longuet-Higgins, M.S. On the statistical distributions of heights of sea waves. J. Mar. Res. 1952, 11, 245–266. [Google Scholar]
  23. Glukhovskiy, B.K. Investigation of sea wind waves. In Proceedings of the Sea Climatology Conference, Leningrad, Russia, 15–16 February 1966; pp. 51–71. [Google Scholar]
  24. Battjes, J.A. Energy Dissipation in Breaking Solitary and Periodic Waves; Rep. No. 1986-5; Delft University of Technology, Communications on Hydraulic and Geotechnical Engineering: Delft, The Netherlands, 1986. [Google Scholar]
  25. Klopman, G. Extreme Wave Heights in Shallow Water; H2486; Delft Hydraulics: Delft, The Netherlands, 1996. [Google Scholar]
  26. van Vledder, G.P.; Ruessink, G.; Rijnsdorp, D.P. Individual wave height distributions in the coastal zone: Measurements and simulations and the effect of directional spreading. In Proceedings of the Coastal Dynamics 2013: 7th International Conference on Coastal Dynamics, Arcachon, France, 24–28 June 2013. [Google Scholar]
  27. Ochi, M.K. Applied Probability & Stochastic Processes in Engineering & Physical Sciences; John Wiley & Sons: Hoboken, NJ, USA, 1992. [Google Scholar]
  28. CUR [Centre for Civil Engineering Research and Codes]. Manual on the Use of Block in Hydraulic Engineering; Ministry of Transport, Public Works and Water Management, Road and Hydraulic Engineering Division: Delft, The Netherlands, 1988. [Google Scholar]
  29. Hasselmann, K. A criterion for nonlinear wave stability. J. Fluid Mech. 1967, 30, 737–739. [Google Scholar] [CrossRef]
  30. Phillips, O.M. The Dynamics of the Upper Ocean; Cambridge Monographs on Mechanics; Cambridge University Press: Cambridge, UK, 1980. [Google Scholar]
  31. Abramowitz, M.; Stegun, I.A. Handbook of Mathematical Functions; Dover: Mineola, NY, USA, 1968. [Google Scholar]
  32. Nayfeh, A.H. Introduction to Perturbation Techniques; John Wiley & Sons: Hoboken, NJ, USA, 1981. [Google Scholar]
Figure 1. Map of the study area.
Jmse 09 00223 g001
Figure 2. Schematic sketch of rubble mound breakwater armored by two layers of tetrapod (TTP).
Jmse 09 00223 g002
Figure 3. Definition sketch of failure probability in Level II method.
Jmse 09 00223 g003
Figure 4. Comparison of wave height probability density functions by Choi and Cho [1] with the hindcasted wave data.
Jmse 09 00223 g004
Figure 5. Comparison of wave height probability distribution functions with the modified Glukhovskiy and the one derived by Choi and Cho [1].
Jmse 09 00223 g005
Figure 6. Probability density function of S o m for varying ν .
Jmse 09 00223 g006
Figure 7. Comparison of S o m with its corresponding Gaussian distribution.
Jmse 09 00223 g007
Figure 8. Joint distribution of wave amplitude and its associated period (reproduced from Park and Cho [17]).
Jmse 09 00223 g008
Figure 9. Schematic sketch of the effect of bandwidth on the statistical distribution of nonlinear random waves (reproduced from Park and Cho [17]).
Jmse 09 00223 g009
Figure 10. Time series of peak period T P , significant wave height H S , and wave slope S o m collected at Mang-Bang from 26 April 2017 to 20 April 2018.
Jmse 09 00223 g010
Figure 11. Comparison of Gaussian distribution of wave slope S o m with the measured one.
Jmse 09 00223 g011
Figure 12. Contour plot of joint of R and S , and the schematic sketch of sample space in [ R , S ] plane representing the un-stability.
Jmse 09 00223 g012
Figure 13. Venn diagram showing the area in sample space on R S plane corresponding to the failure of armor block of rubble mound breakwater.
Jmse 09 00223 g013
Figure 14. Probability density function of R for varying D n [unit, m ].
Jmse 09 00223 g014
Figure 15. Joint probability density function of R and S .
Jmse 09 00223 g015
Figure 16. Failure probability of TTP as D n varies for different wave height distribution (see Table 2).
Jmse 09 00223 g016
Figure 17. Joint probability density function of R and S based on the wave slope distribution proposed in this study [ D n = 2.3 m , ν = 0.4 ].
Jmse 09 00223 g017
Figure 18. Weakened hydraulic stability strength of armor block as sea wave conditions are becoming harsh.
Jmse 09 00223 g018
Figure 19. Comparison of probability density function of R based on the wave slope distribution presented in this study with the one based on the Gaussian distribution [ D n = 2.3 m , ν = 0.6 ].
Jmse 09 00223 g019
Figure 20. Comparison of failure probability of TTP based on the wave slope distribution derived in this study as D n varies with its corresponding Gaussian distribution [ ν = 0.4 ].
Jmse 09 00223 g020
Table 1. List of probabilistic properties of random variables in the Van der Meer’s formula.
Variables μ σ
N o d 0.20.05
N z 10000
Δ 1.2820.03
D n 2.30.0396
S o m 0.02670.0016
F H S 00.25
H S 6.00.00
A * 3.385
* A = ( 3.75 N o d 0.5 N z 0.25 + 0.85 ) Δ D n .
Table 2. List of values of two parameters of Weibull distribution suggested by PIANC [18].
E [ H S T ] E [ H S T 2 ] H W κ W
RUN 12.70.252.96.30
RUN 23.40.253.608.07
RUN 34.50.254.7110.87
RUN 45.10.255.31512.40
RUN 56.60.256.8116.24
Table 3. List of most probable armor block strength for varying bandwidth of wave spectrum.
ν 0.20.40.60.8
R p 3.263.203.153.1
Publisher’s Note: MDPI stays neutral with regard to jurisdictional claims in published maps and institutional affiliations.

