Article

Study on Vibration Characteristics of Marine Centrifugal Pump Unit Excited by Different Excitation Sources

1
School of Energy and Power Engineering, Jiangsu University, Zhenjiang 212013, China
2
Research Center of Fluid Machinery Engineering and Technology, Jiangsu University, Zhenjiang 212013, China
*
Author to whom correspondence should be addressed.
J. Mar. Sci. Eng. 2021, 9(3), 274; https://0-doi-org.brum.beds.ac.uk/10.3390/jmse9030274
Submission received: 20 January 2021 / Revised: 7 February 2021 / Accepted: 22 February 2021 / Published: 3 March 2021
(This article belongs to the Special Issue Fluid/Structure Interactions)

Abstract

:
In order to study the vibration mechanism of a marine centrifugal pump unit and explore the contribution of vibration caused by different vibration excitation sources, a marine centrifugal pump with a specific speed of 66.7 was used for research. A numerical calculation model of the flow field and electromagnetic field of the pump unit was established to analyze the frequency spectrum characteristics and contribution of pump unit vibration caused by different excitation sources. Using the modal superposition method, the vibration characteristics of the pump unit caused by fluid excitation and electromagnetic excitation were analyzed. The results show that the main frequency of pump unit vibration caused by fluid excitation was at the 1× blade passing frequency. The main frequency of pump unit vibration caused by electromagnetic excitation was at the 2× utility frequency. The contribution of different excitation sources to the vibration of marine centrifugal pump unit was in the following order: fluid excitation on the inner surface of the pump > electromagnetic excitation > fluid excitation in the impeller.

1. Introduction

The marine centrifugal pump is one of the important auxiliary devices on a ship, which plays an important role in its operation. On the one hand, the self-excited vibration of fluid during the operation of the marine pump will affect the stable operation of other equipment. On the other hand, the vibration generated by other mechanical equipment or the marine main engine during operation also affects the marine pump. Excessive vibration will not only affect the measurement accuracy of some precision equipment, but also cause harm to people’s physical and mental health.
The marine centrifugal pump in the process of operation will show obvious nonstationary properties. Vibration analysis is widely used in centrifugal pump condition monitoring, fault diagnosis, and other fields [1]. Compared with the pressure pulsation sensor, the vibration sensor does not need to contact the fluid and does not destroy the flow characteristics in the centrifugal pump. In addition, the vibration sensor can be placed on the surface of the pump body, which can better reflect the high-frequency characteristics of the centrifugal pump during operation [2,3]. The vibration excitation sources of the marine pump unit can be divided into three types according to the generation mechanism, namely, shafting excitation, fluid excitation, and electromagnetic excitation. Shafting excitation is mainly caused by a rotor fault or rolling bearing fault [4]. Fluid excitation is mainly caused by unsteady fluid excitation in the marine pump. Electromagnetic excitation is mainly caused by the radial electromagnetic force generated by the rotating magnetic field inside the motor. The vibrations caused by the above three excitation sources will be coupled with each other, which will affect the pump unit.
Usually, in non-fault cases, the shaft excitation is generally small and can be controlled by active control technology. Compared with shaft excitation, the occurrence mechanism of fluid excitation is more complex. In recent years, with the development of CFD (computational fluid dynamics) technology, more and more scholars have realized that the deep-seated reason for pump vibration caused by fluid excitation is the unsteady flow of fluid in the pump, and they began using numerical calculation methods to analyze the internal flow of the pump [5,6,7]. At first, most scholars’ research on fluid excitation was mainly focused on the analysis of pressure pulsation on the inner wall of the pump [8,9,10]. They hoped to explore the law of vibration caused by fluid excitation through the analysis of pressure pulsation. With the deepening of research, the calculation methods of vibration caused by fluid excitation have made great progress. Unidirectional coupling and bidirectional coupling are two commonly used methods at present [11]. In the unidirectional coupling method, the pulsating force of the fluid is calculated using the CFD method, and the pulsating force is loaded on the inner wall of the finite element structure. Subsequently, the vibration response of the structure is obtained. Many scholars have conducted in-depth research on the unidirectional coupling method. Ye [12] used the Reynolds-averaged method to calculate the internal flow field of a centrifugal pump. He calculated the vibration response of the pump body through the radial force acting on the inner wall of the volute. However, he ignored the influence of motor structure on the vibration of the pump unit when establishing the structural model. Moreover, pump vibration calculated using the radial force inside the volute as excitation is unreasonable, and there is a big difference between calculation and the actual results. Jiang [13] et al. matched the fluid–solid boundary grid and mapped the pressure pulsation data obtained from fluid numerical calculations to the structural grid, which corresponded to the fluid grid. Jiang’s method was more accurate in calculating the structural vibration caused by fluid excitation. Wang [14] calculated the pressure pulsation of the pump chamber, guide vane, impeller, and volute of a centrifugal pump via numerical calculations and compared the results with an experiment. He [15] established a finite element model of a pump unit including a motor. By writing the UDF (user-defined function), he calculated pressure pulsations on the impeller surface at each time step. He integrated these pulse forces as the force of the rotor subjected to the impeller. The force on the rotor was regarded as the excitation source that caused the vibration of the pump unit, and the vibration response of the pump unit was obtained on the basis of the modal analysis results. Following He, Jiang [16] studied the vibration of the bracket through the fluid in the volute and the impeller. The research results showed that the bracket vibration caused by fluid excitation through the impeller was greater than that caused by the volute. Although He and Jiang considered that the vibration of the pump unit would be affected by the motor structure, they did not consider the impact of the vibration generated by the motor on the pump unit. In summary, structural vibration caused by fluid can be quickly calculated using the unidirectional coupling method. However, the unidirectional coupling method only considers the effect of the fluid on the structure, while it ignores the reaction of the structure to the fluid. Therefore, it is widely used in the case of large stiffness of the structure and large volume of the flow field [17,18].
Compared with the unidirectional coupling method, the bidirectional coupling method considers the reaction of the structure to the fluid, which can more truly reflect the real situation and accurately capture the changes in the force and motion laws of the geometry. Pei [19] took a single-stage centrifugal pump as the research object. He calculated the structural response of the pump unit by using the bidirectional fluid–solid coupling method. Zhang [20] used the bidirectional fluid–solid coupling method to calculate the volute vibration of a thick-blade centrifugal pump. Guo [21] calculated the radial force on the impeller by using the bidirectional fluid–solid coupling method and used it as the fluid excitation force to calculate the vibration response on the impeller. Although the bidirectional coupling method considers the interaction between the fluid and the structure more comprehensively, it should be noted that the bidirectional fluid–solid coupling method is more suitable for occasions where the structure has a greater impact on the fluid. Due to the complex structure of the centrifugal pump, a high computational cost is required when using the two-way fluid–solid coupling method, and the calculation is difficult to converge. In addition, the calculation results can be obtained more conveniently by using the unidirectional coupling method because of the high rigidity of the centrifugal pump structure.
In summary, many scholars conducted extensive research on the vibration of pump unit caused by fluid excitation in the study of pump unit vibration, but few scholars considered the influence of motor vibration on the pump unit [22,23]. The vibration generated by the motor can be transmitted to the pump body through the bracket or connecting plate according to different types of pump. Many scholars established numerical calculation models to study the vibration generated by the motor during operation, but they only analyzed the impact of motor vibration on itself, whereas they did not study the impact of motor vibration on the structure of the pump [24,25,26]. Motors can generate electromagnetic fields through coils, the electromagnetic force inside the electromagnetic field can be calculated by finite element analysis, and then the electromagnetic force can be mapped to the inner wall of the structure to calculate the vibration response of the motor.
Since the transfer vibration between the motor and the pump in a marine centrifugal pump unit has higher coupling than that of a horizontal pump, the vibration of the motor must be taken into account in the study of the vibration characteristics of a marine pump unit.

2. Numerical Calculation Model and Strategy

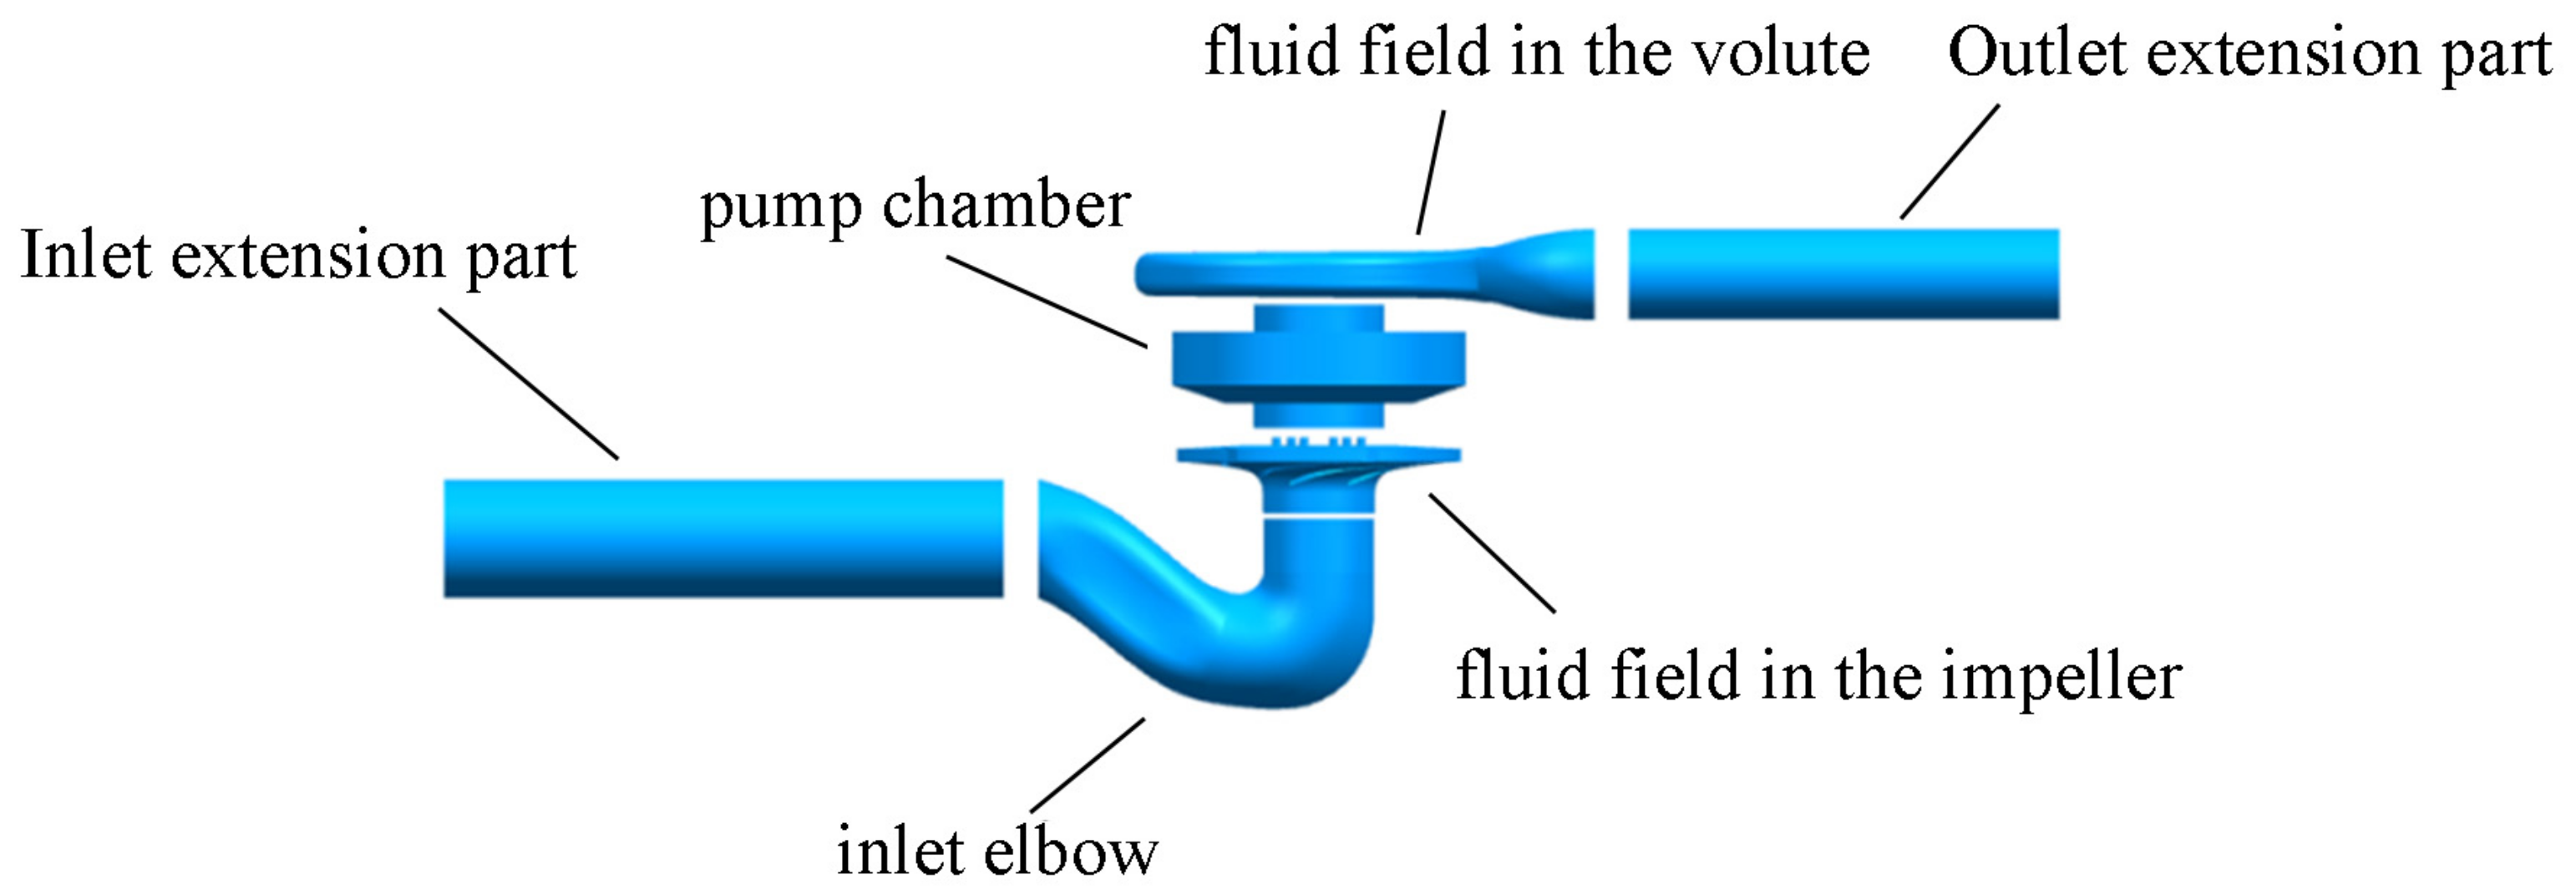
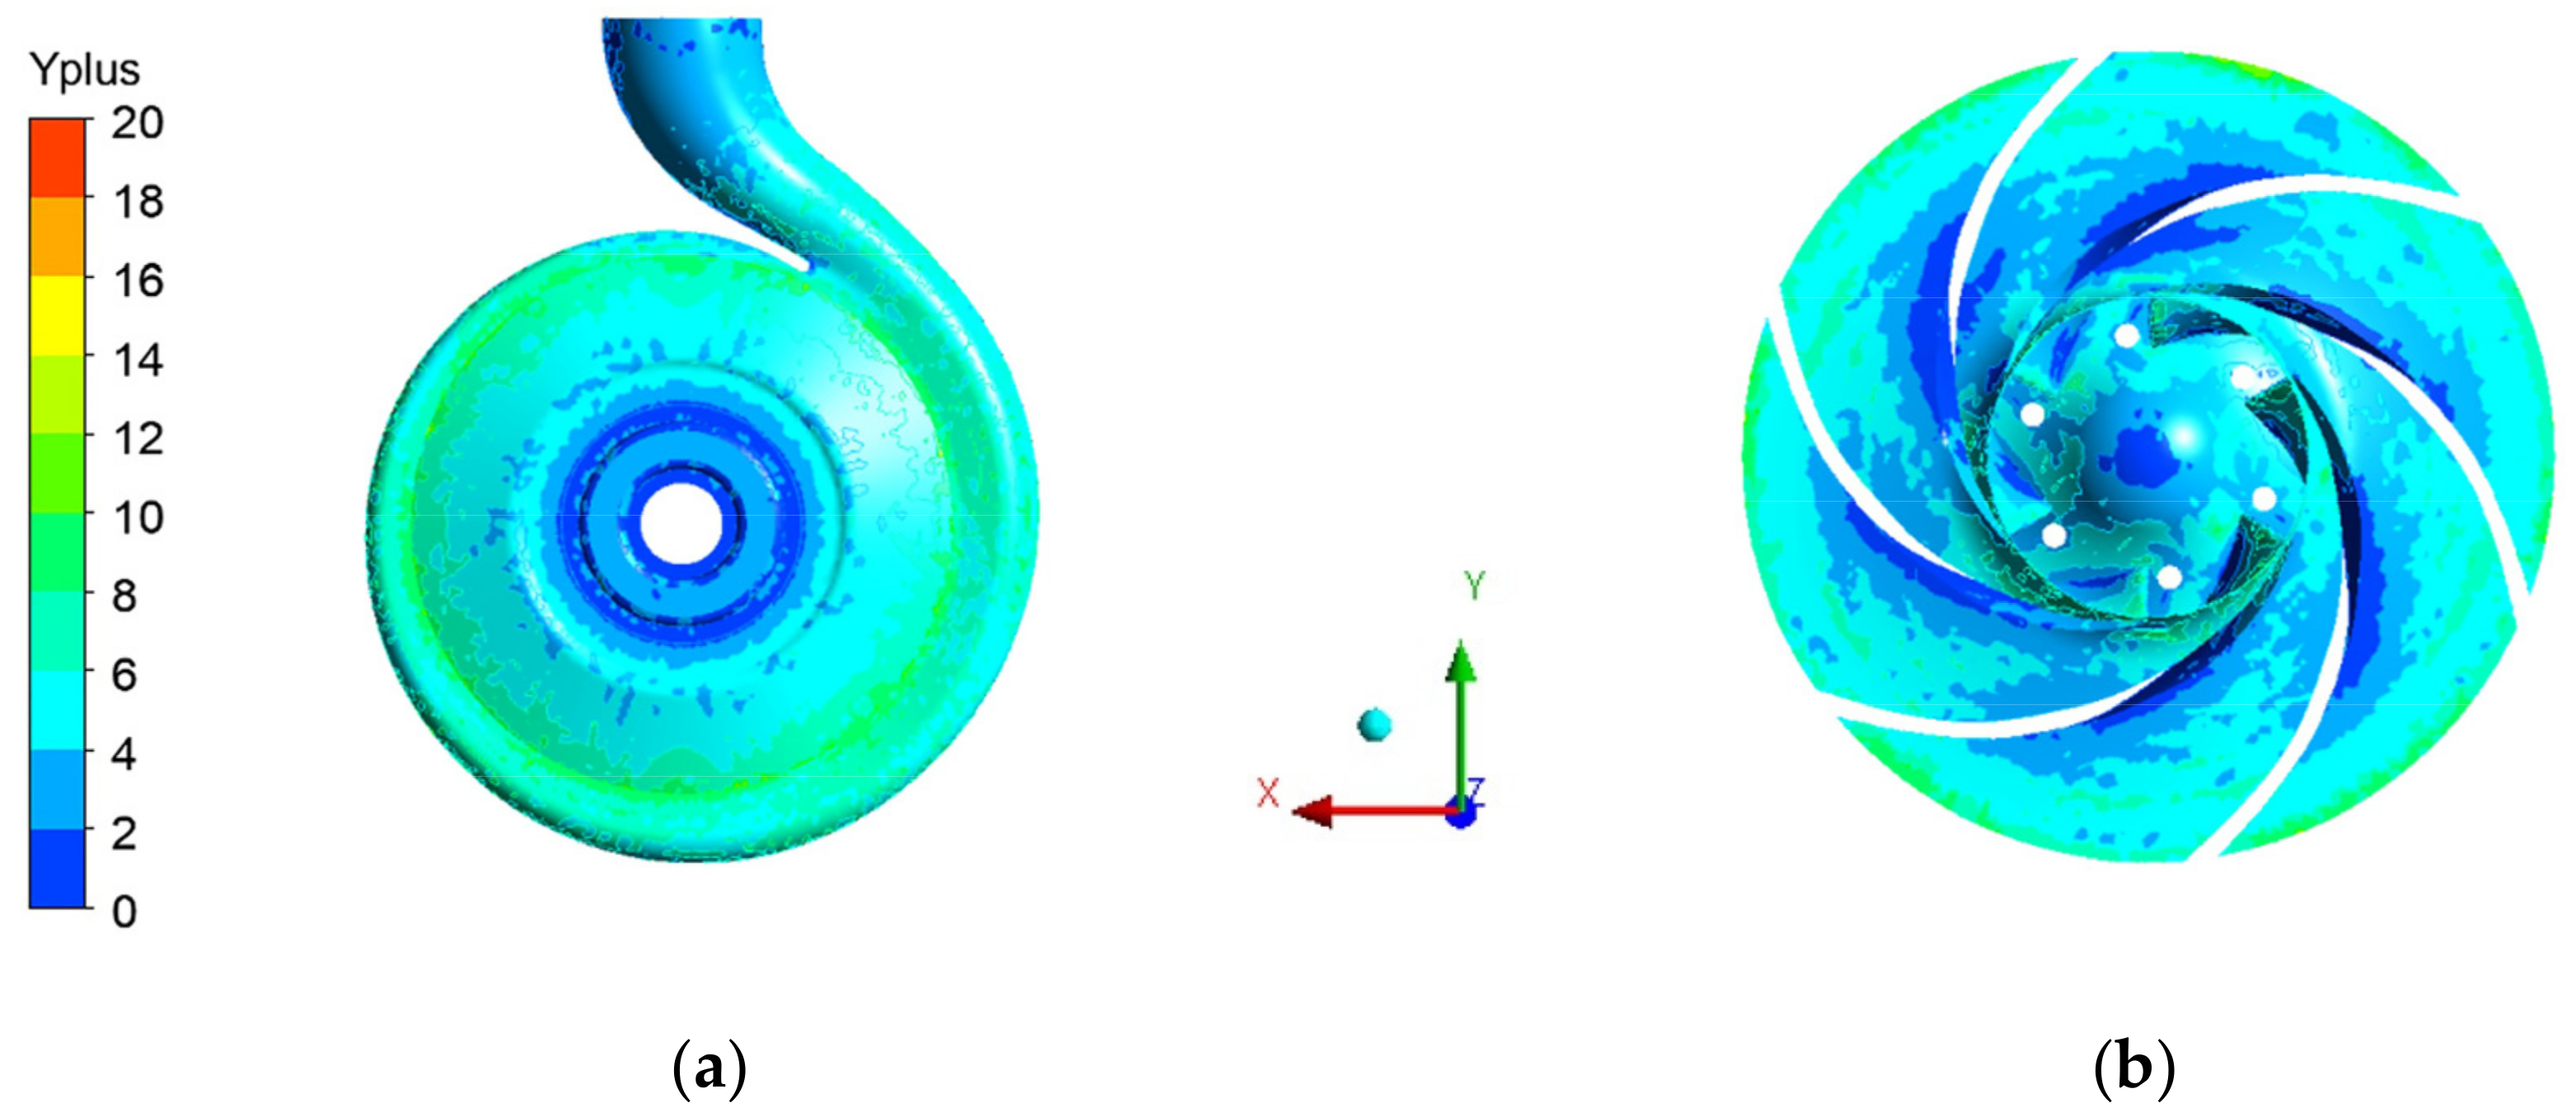
2.1. Flow Field Calculation Model and Calculation Method

A marine centrifugal pump with a specific speed of 66.7 was used in this paper for research. The main design parameters were as follows: flow rate, Qd = 25 m3/h; rated head, H = 35 m; rated speed, n = 2950 r/min. The structural parameters of the marine pump are shown in Table 1.
The whole flow field computational domain includes the inlet elbow, fluid field in the impeller, pump chamber, fluid field in the volute, and outlet extended section. In order to achieve a stable state, the inlet extended section with a length of four times the diameter of the pipe is set before the inlet elbow, which is also conducive to the stability of the internal flow field of the marine pump. The whole model is shown in Figure 1.
In this paper, ICEM-CFD (The Integrated Computer Engineering and Manufacturing code for Computational Fluid Dynamics) was used to mesh the fluid domain. In order to ensure the accuracy of the calculated pressure pulsations, the boundary layer grid in the fluid domain was refined. In order to avoid the influence of grid density on the calculation results of the flow field, five sets of meshes with different numbers were used for the mesh-dependence test in this paper. The results are shown in Table 2. Considering the difference between the head from the numerical calculation and the design value, and considering the time required for numerical calculation, Scheme 3 was finally determined for subsequent numerical calculations.
The y+ values of the stationary domain surface and the moving domain surface are shown in Figure 2. Figure 2a shows the y+ values of the inner wall of the volute and the pump chamber. Figure 2b shows the y+ values of the inner surface of the impeller. It can be seen from Figure 2 that the y+ values of all walls are less than 12. Most of the y+ values of the inner wall of the volute and pump chamber are less than 6, and most of the y+ values of the inner wall of the impeller are below 8, which can better ensure the accuracy of the wall flow information calculation
In this paper, the standard k–ε turbulence model was adopted, and the pressure boundary inlet condition and mass flow outlet boundary condition were adopted. In order to ensure that the calculated fluid excitation had high time resolution, the time step was set to ΔT = 0.565 × 10⁻⁴ s, which is the time required for the impeller to rotate 1°. When the flow field is stable, the time-domain information of pressure pulsation on the surface of the stationary domain and moving domain can be derived. The pressure pulsation data for 10 stable cycles of impeller rotation were used as the fluid excitation source, and the total duration was set to 0.25s.

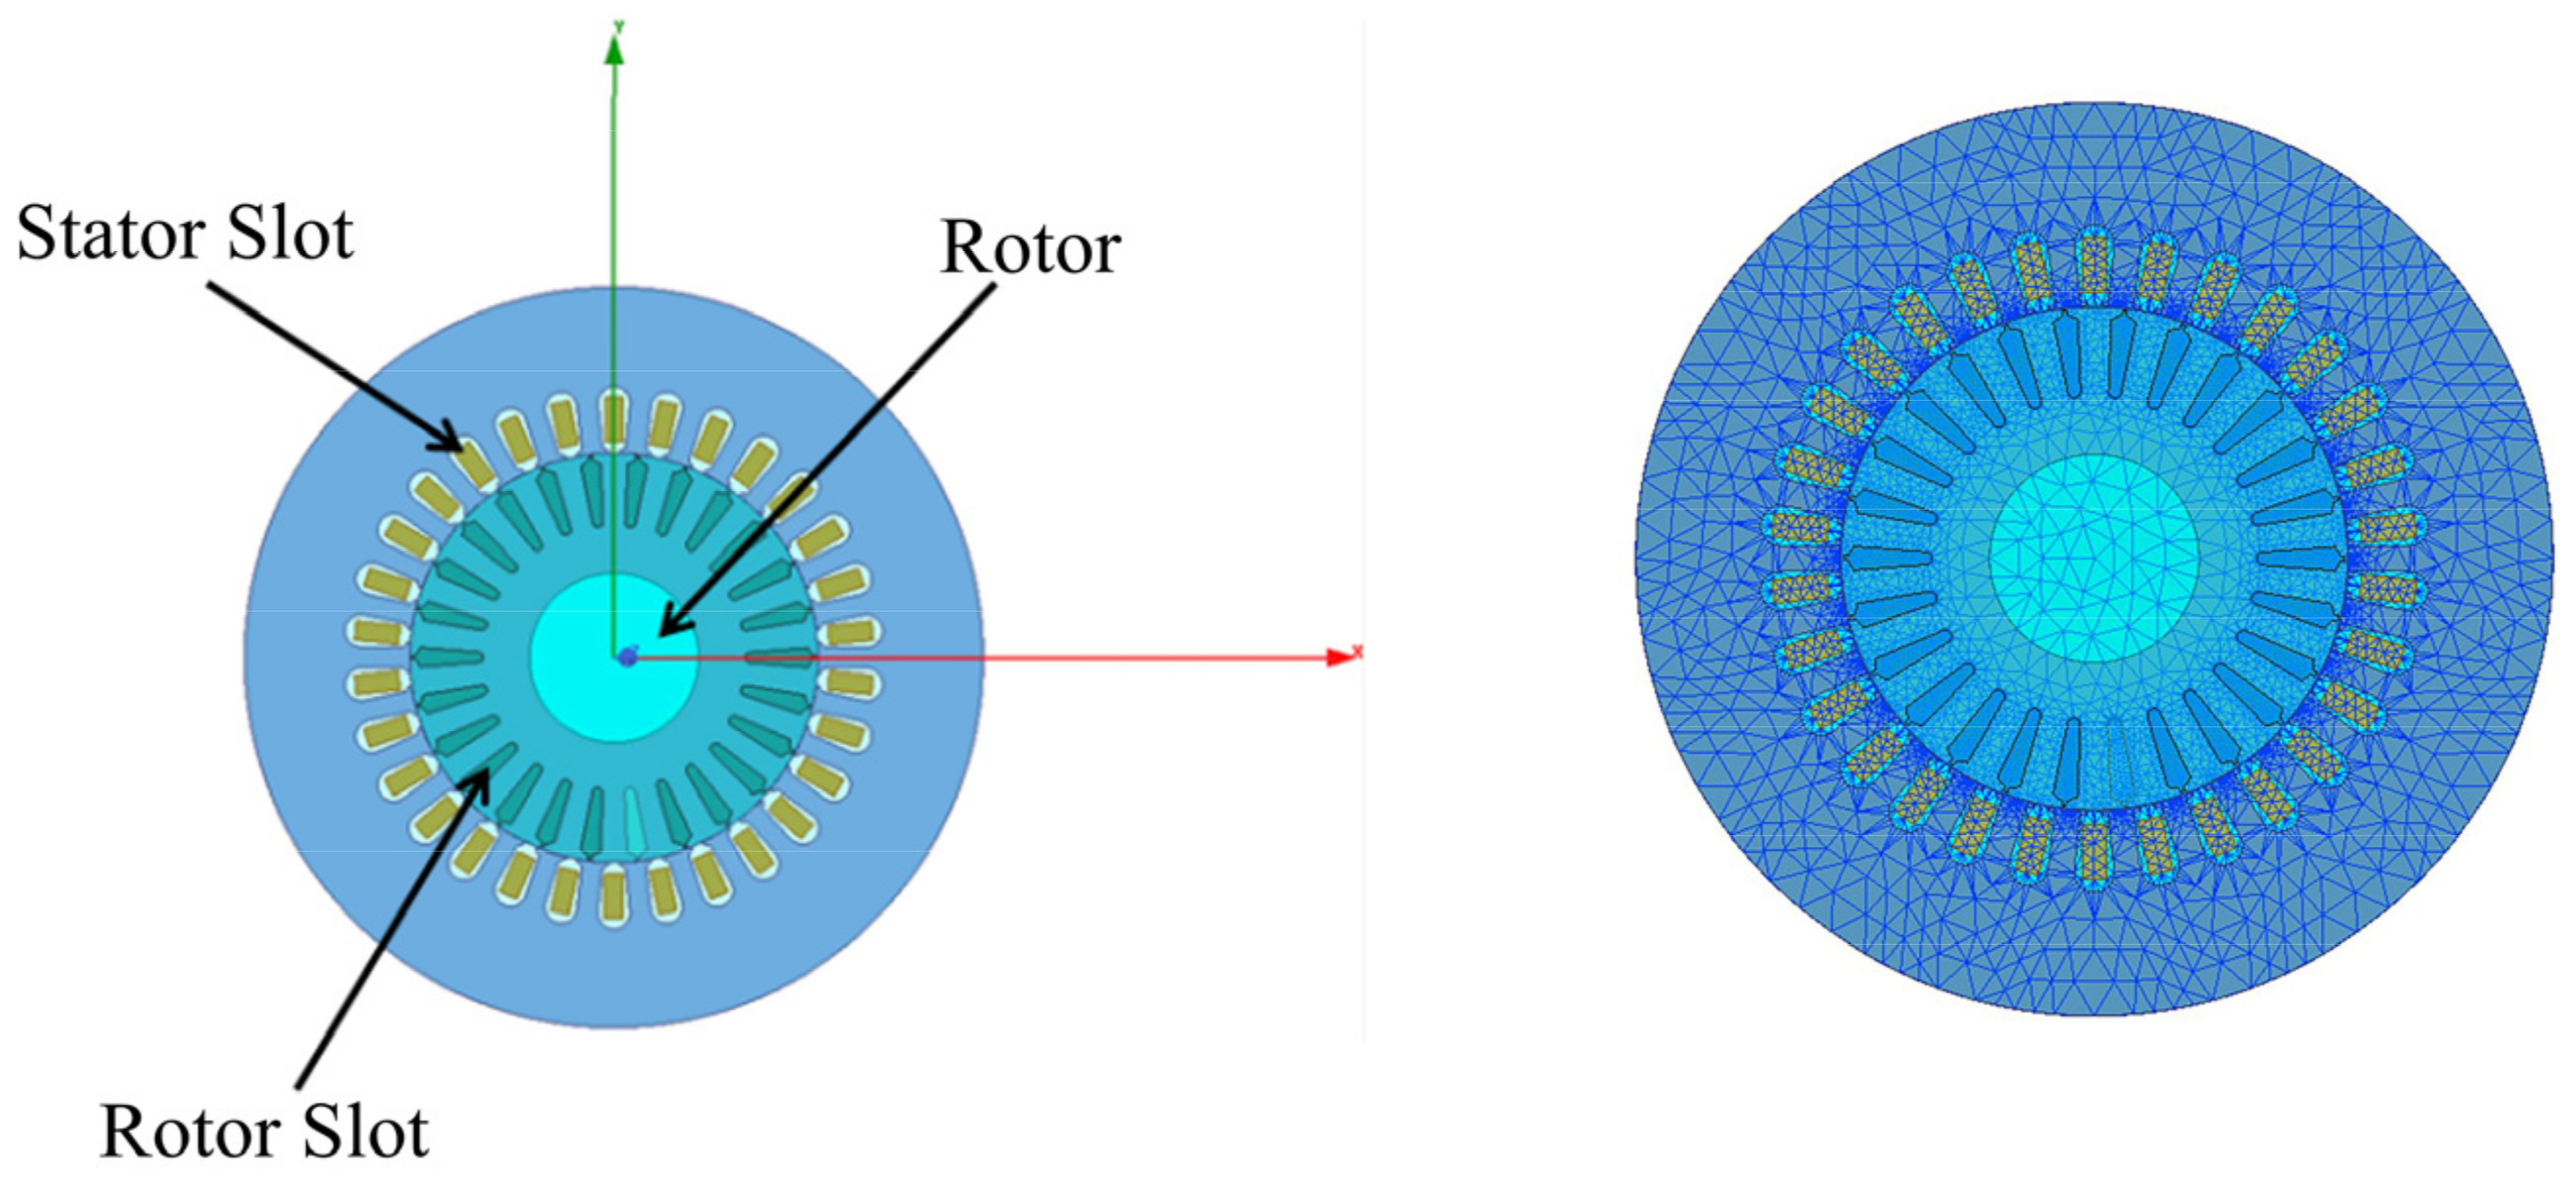
2.2. Electromagnetic Field Calculation Model and Calculation Method

The three-phase asynchronous motor model Y132S1-2 was selected in this paper. The parameters of the motor are shown in Table 3. Due to the imprecise shortcomings in the calculation of the three-dimensional motor model and the symmetrical structure of the motor, many scholars used the two-dimensional model to analyze the internal electromagnetic field of the motor.
Altair Flux was used for parametric modeling of the above motors in this paper. This model uses element PLANE53 for meshing. The electromagnetic field calculation domain included the stator iron core, rotor iron core, stator tooth, rotor tooth, and motor shaft. The electromagnetic field calculation model is shown in Figure 3.

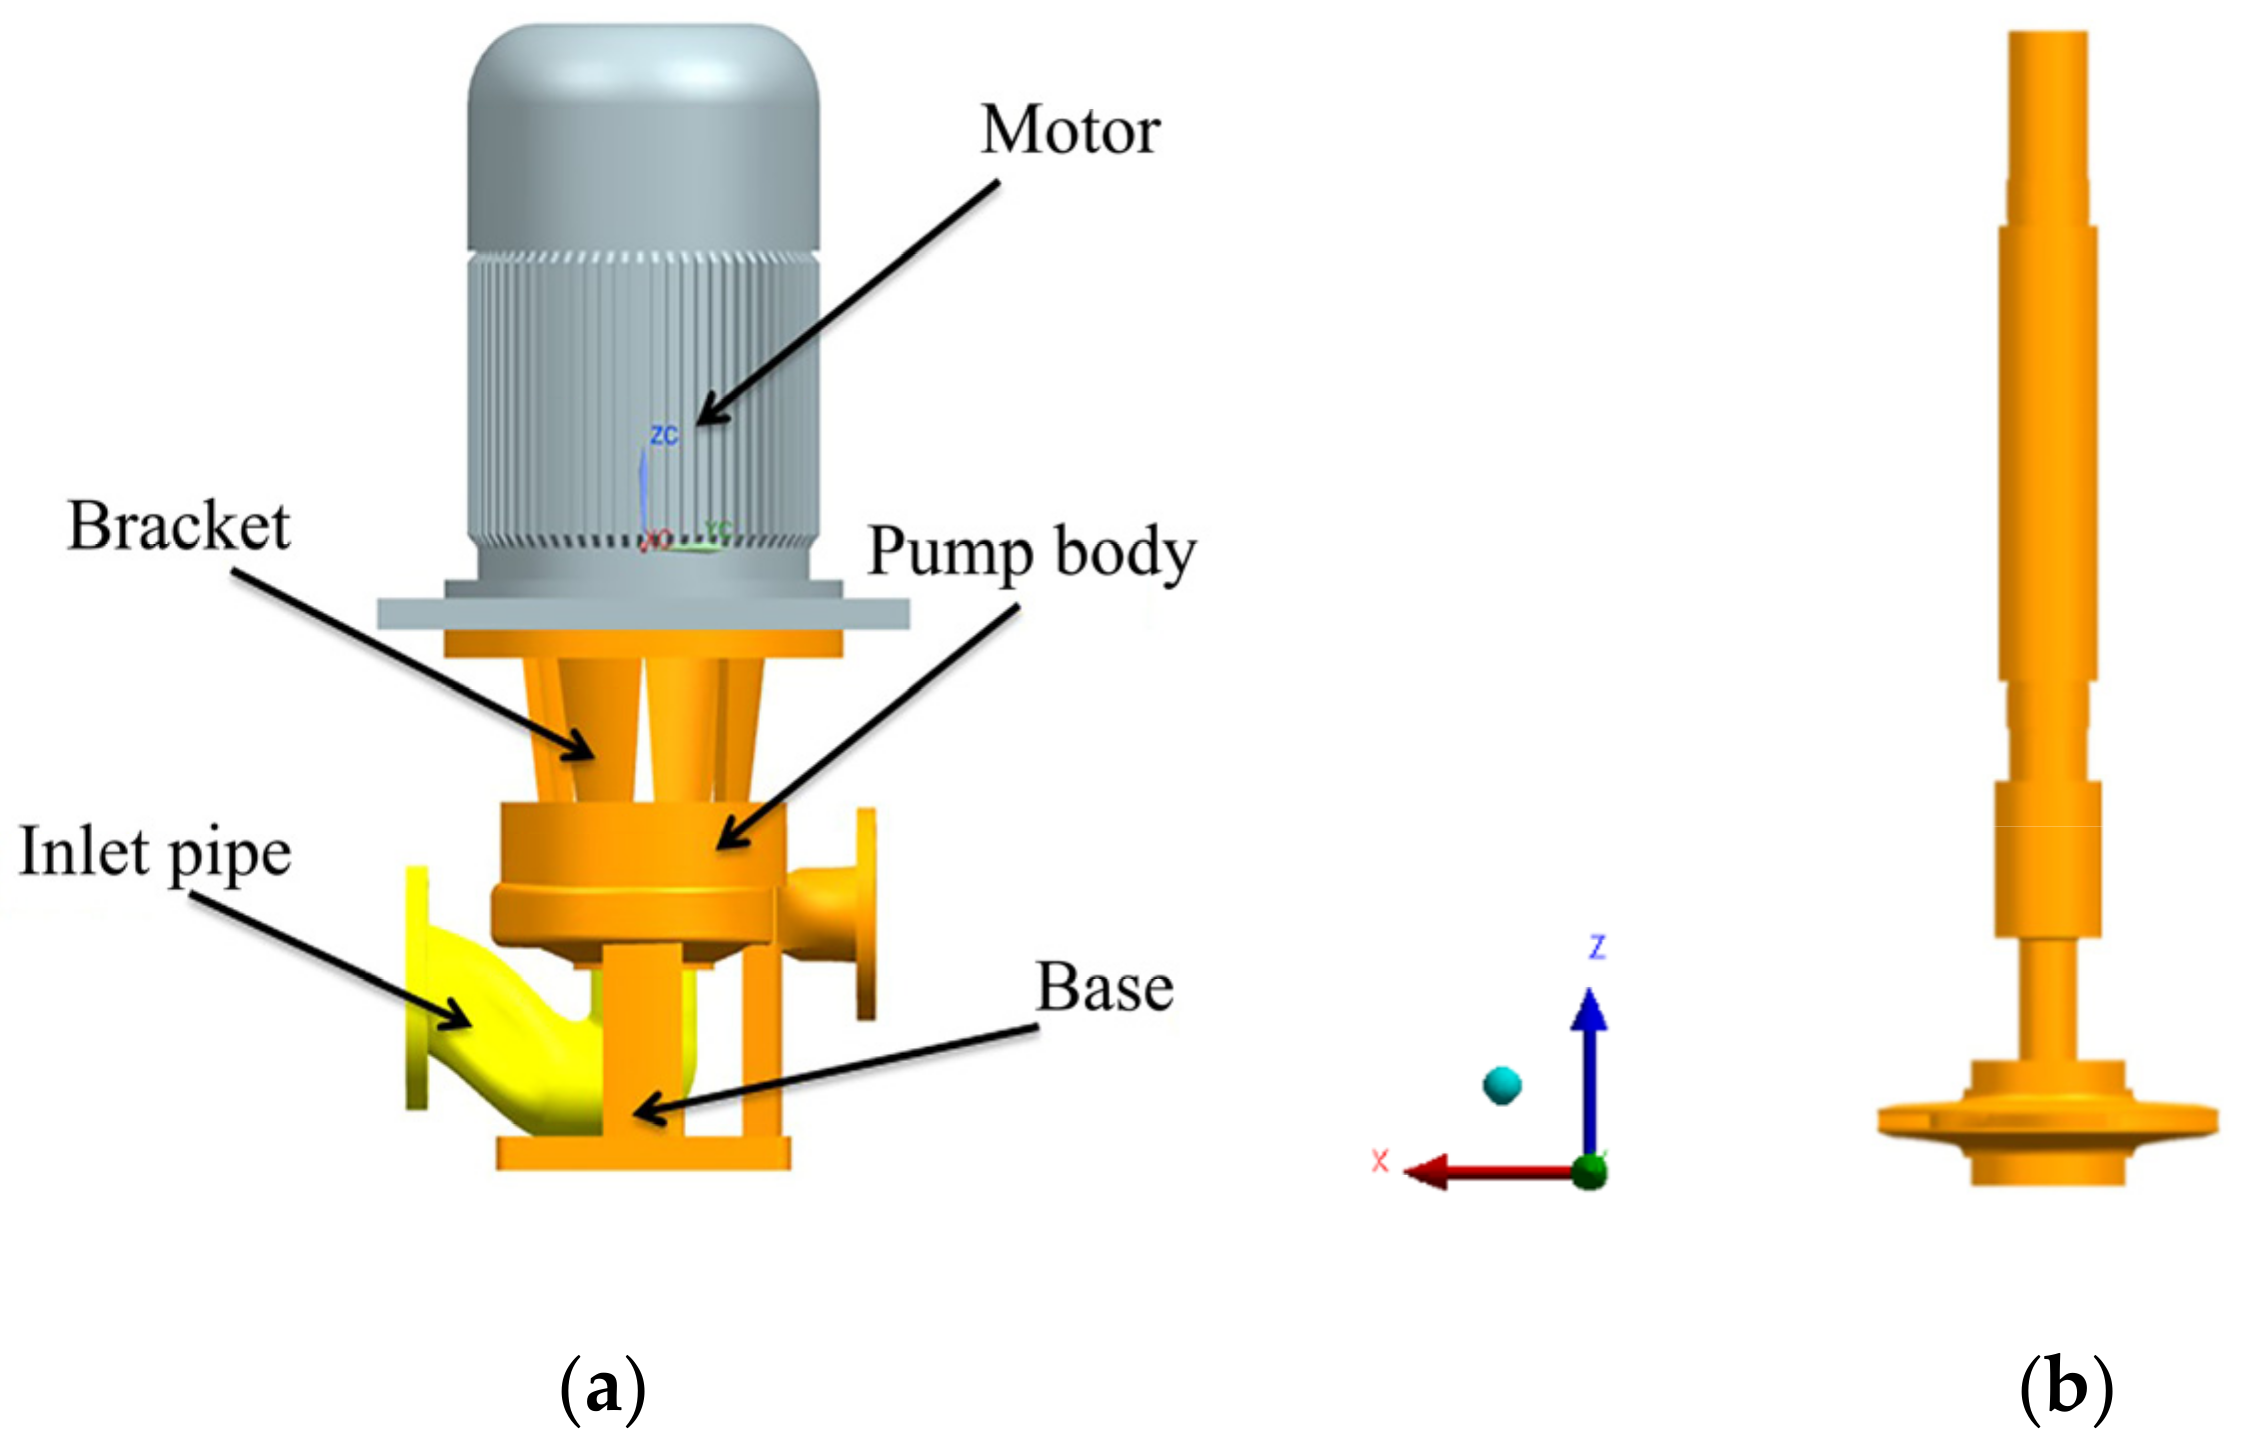
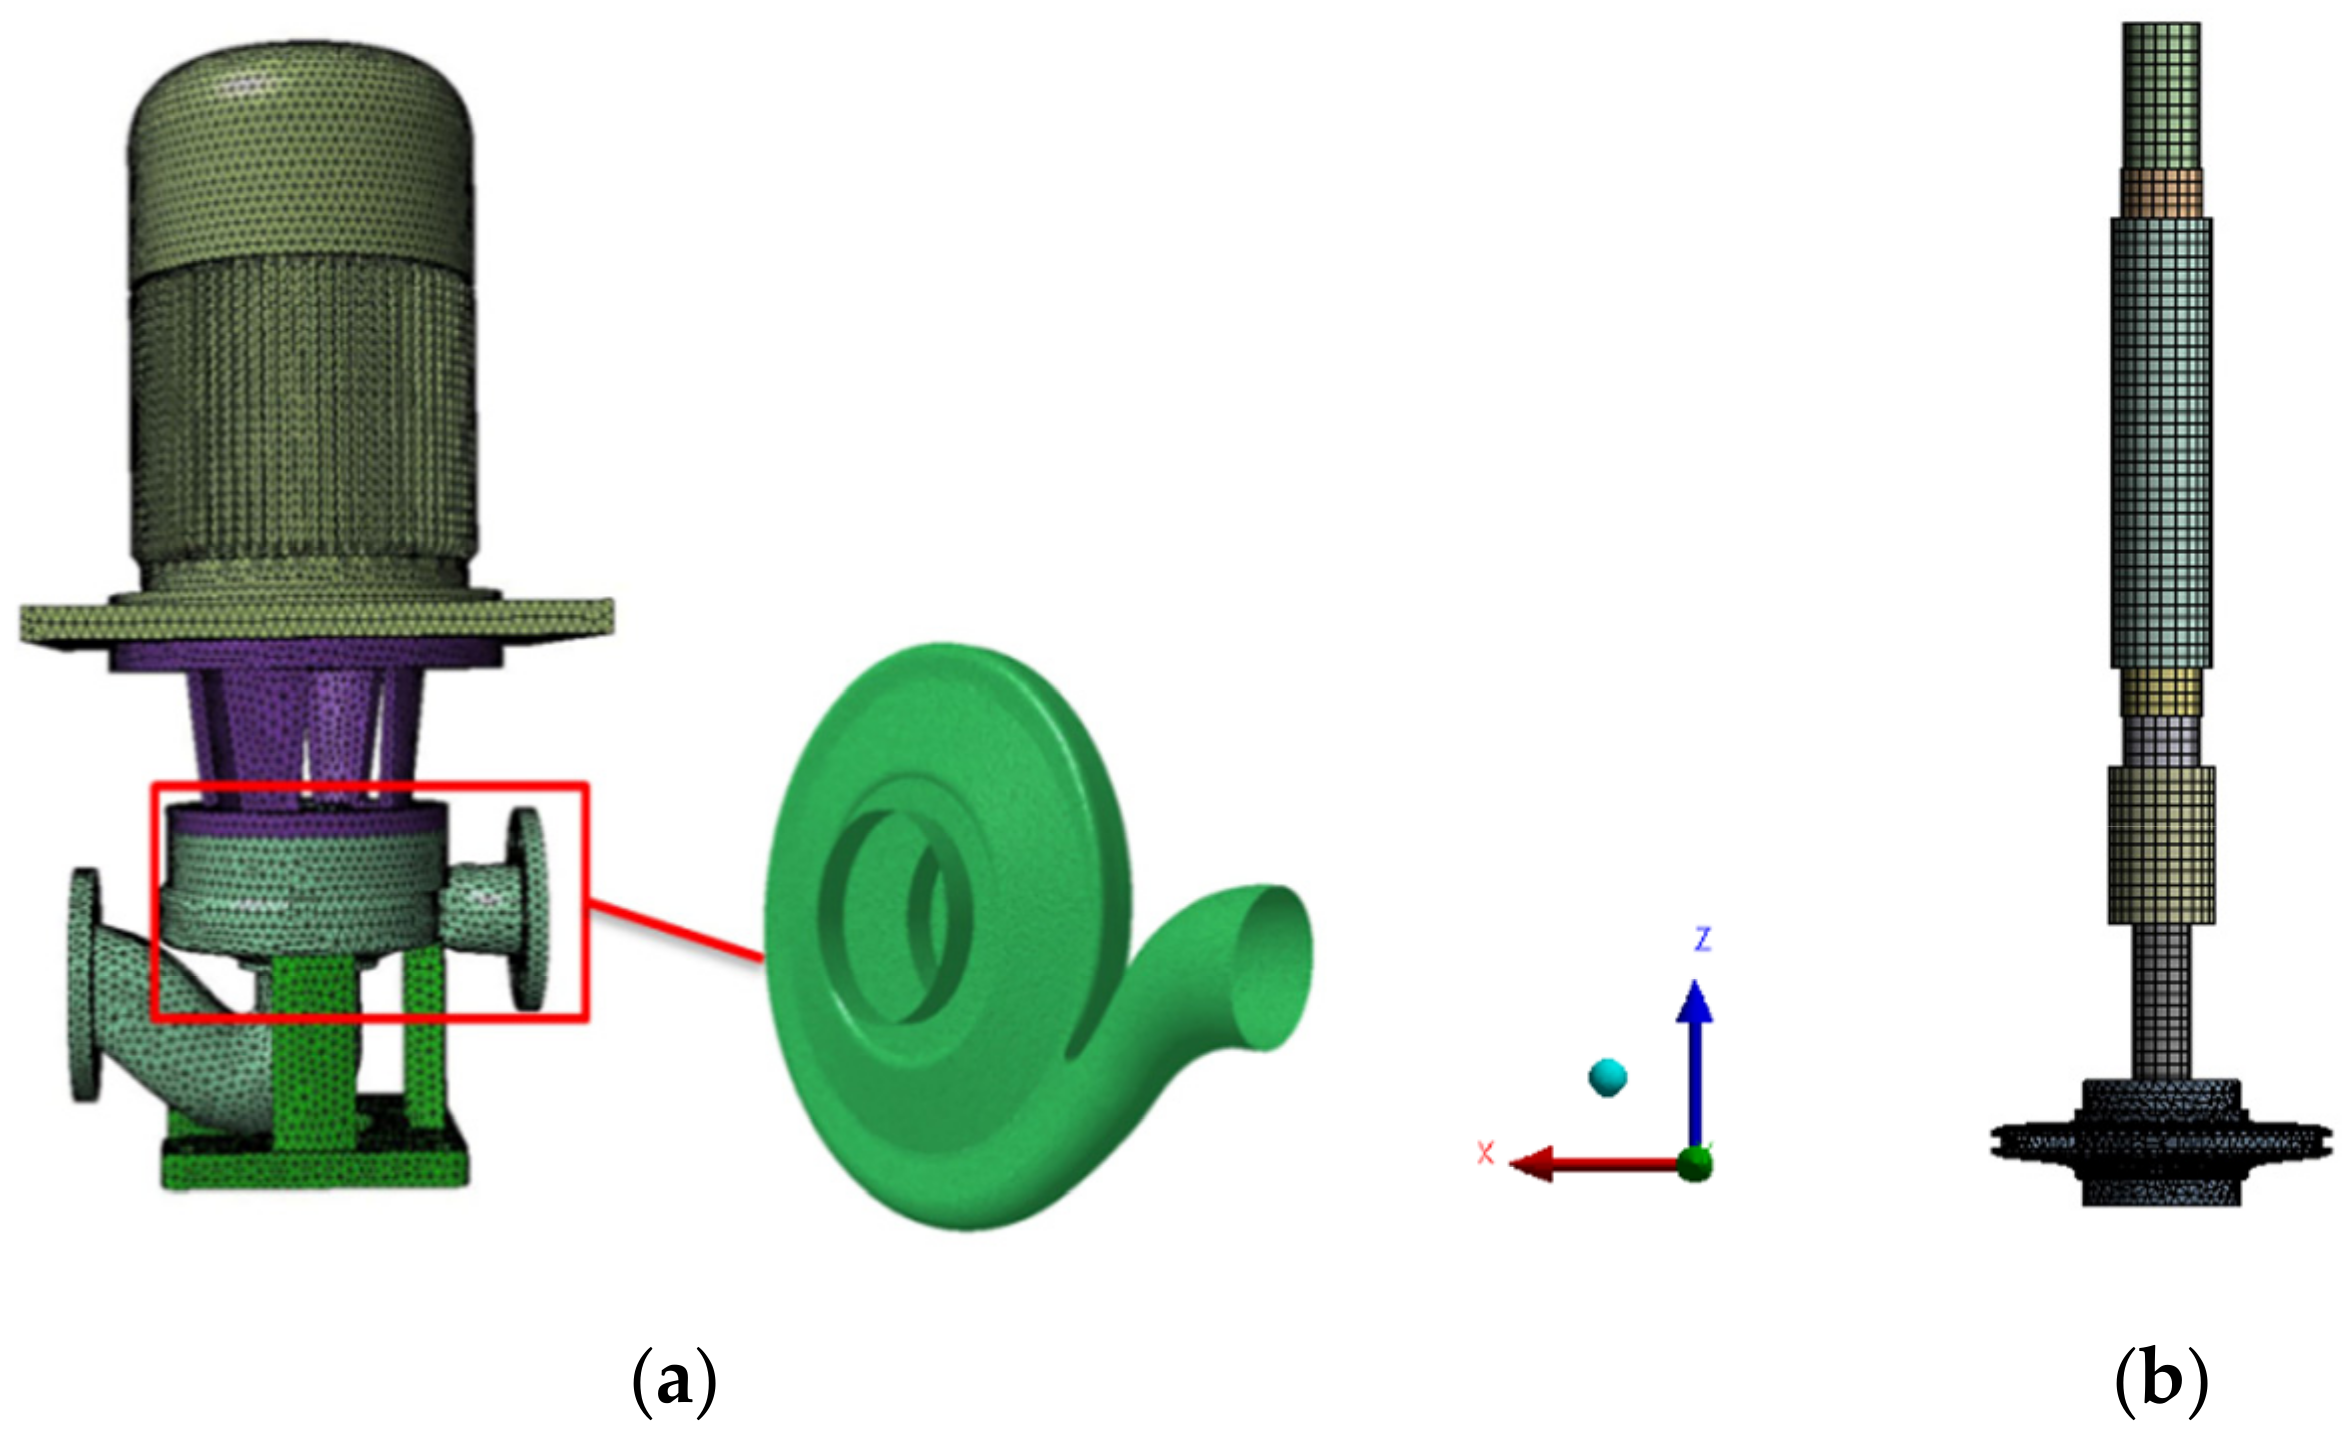
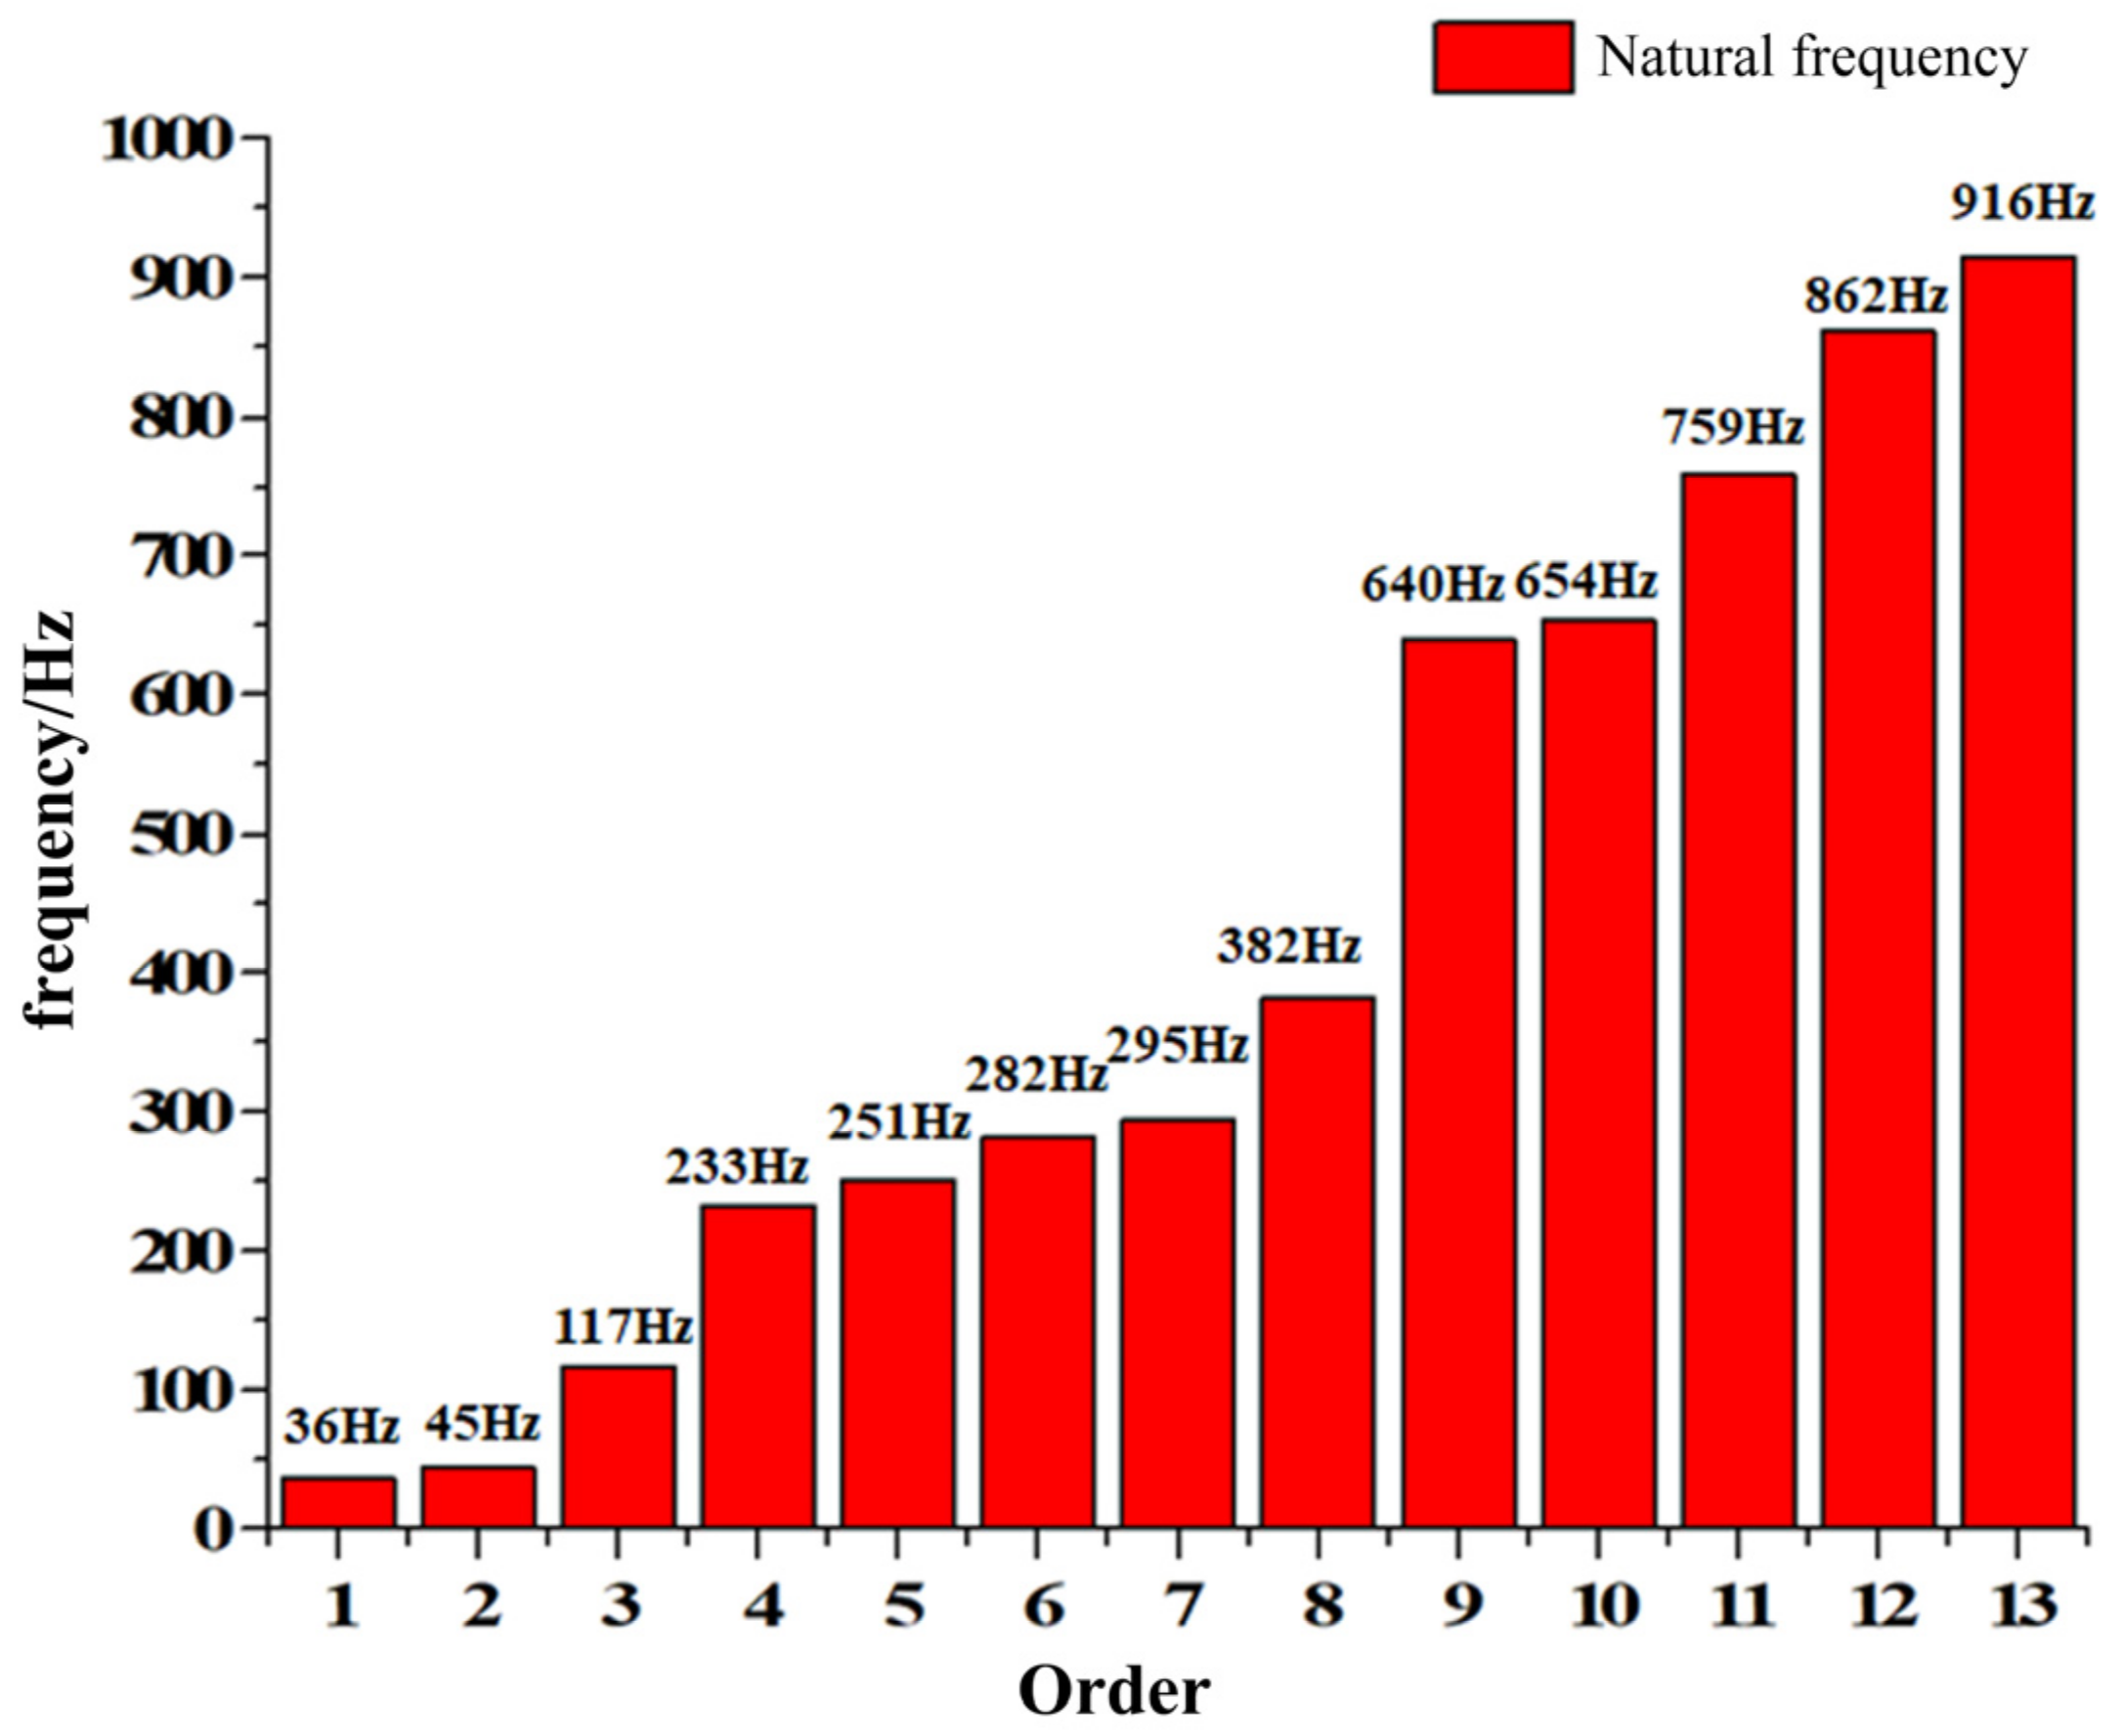
2.3. Structure Calculation Model and Calculation Method

The structure model of the marine pump unit in this paper included the motor, bracket, pump body, inlet pipe, base, and rotor system.
ANSYS Workbench was used to establish a finite element analysis model of the pump unit in this paper. The three-dimensional (3D) model of the pump unit is shown in Figure 4. The rotor and pump body adopted element SOLID187, and the surface of the structure in contact with the flow field and electromagnetic field adopted element SURF154. The finite element analysis model is shown in Figure 5. In order to reduce the computation time, the details which had less influence on the structure were simplified when building the structure model. In addition, since the bearing position was the focus of this study, the rotor was simplified when the model was established. The grids of the rotor system were hexahedral grids, and the meshes were refined.
Before vibration calculation, a modal analysis of the marine pump was needed. The LMS Virtual Lab software was used in this paper to analyze the modal response of the centrifugal pump unit. In the modal analysis, the bolt holes of the pump unit base were set as rigid surface constraints, and the constraints of the inlet and outlet flanges were released. Figure 6 shows the natural frequency of the centrifugal pump unit less than 1000 Hz obtained through modal analysis.
According to the results of modal analysis, the calculated pressure pulsation on the fluid grid was mapped to the structural grid to calculate the vibration.

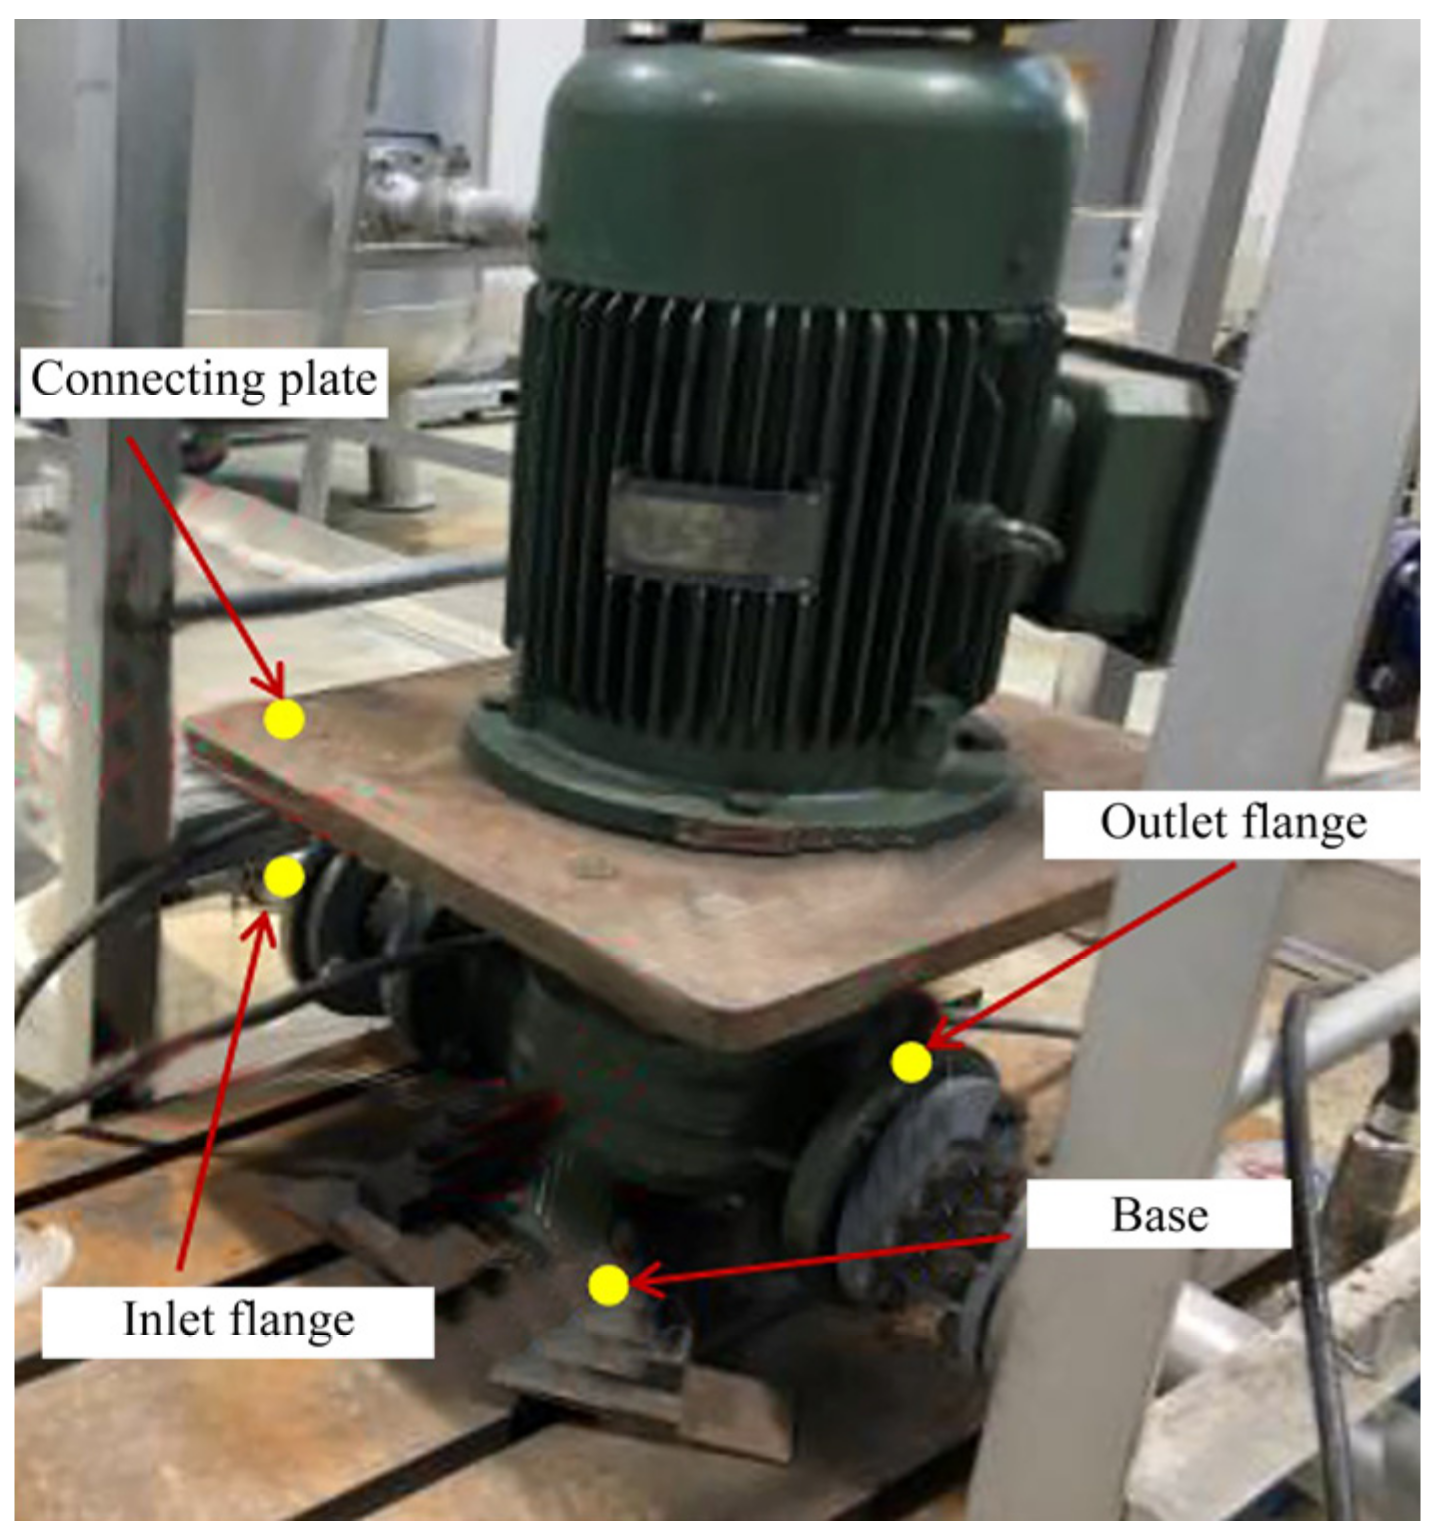
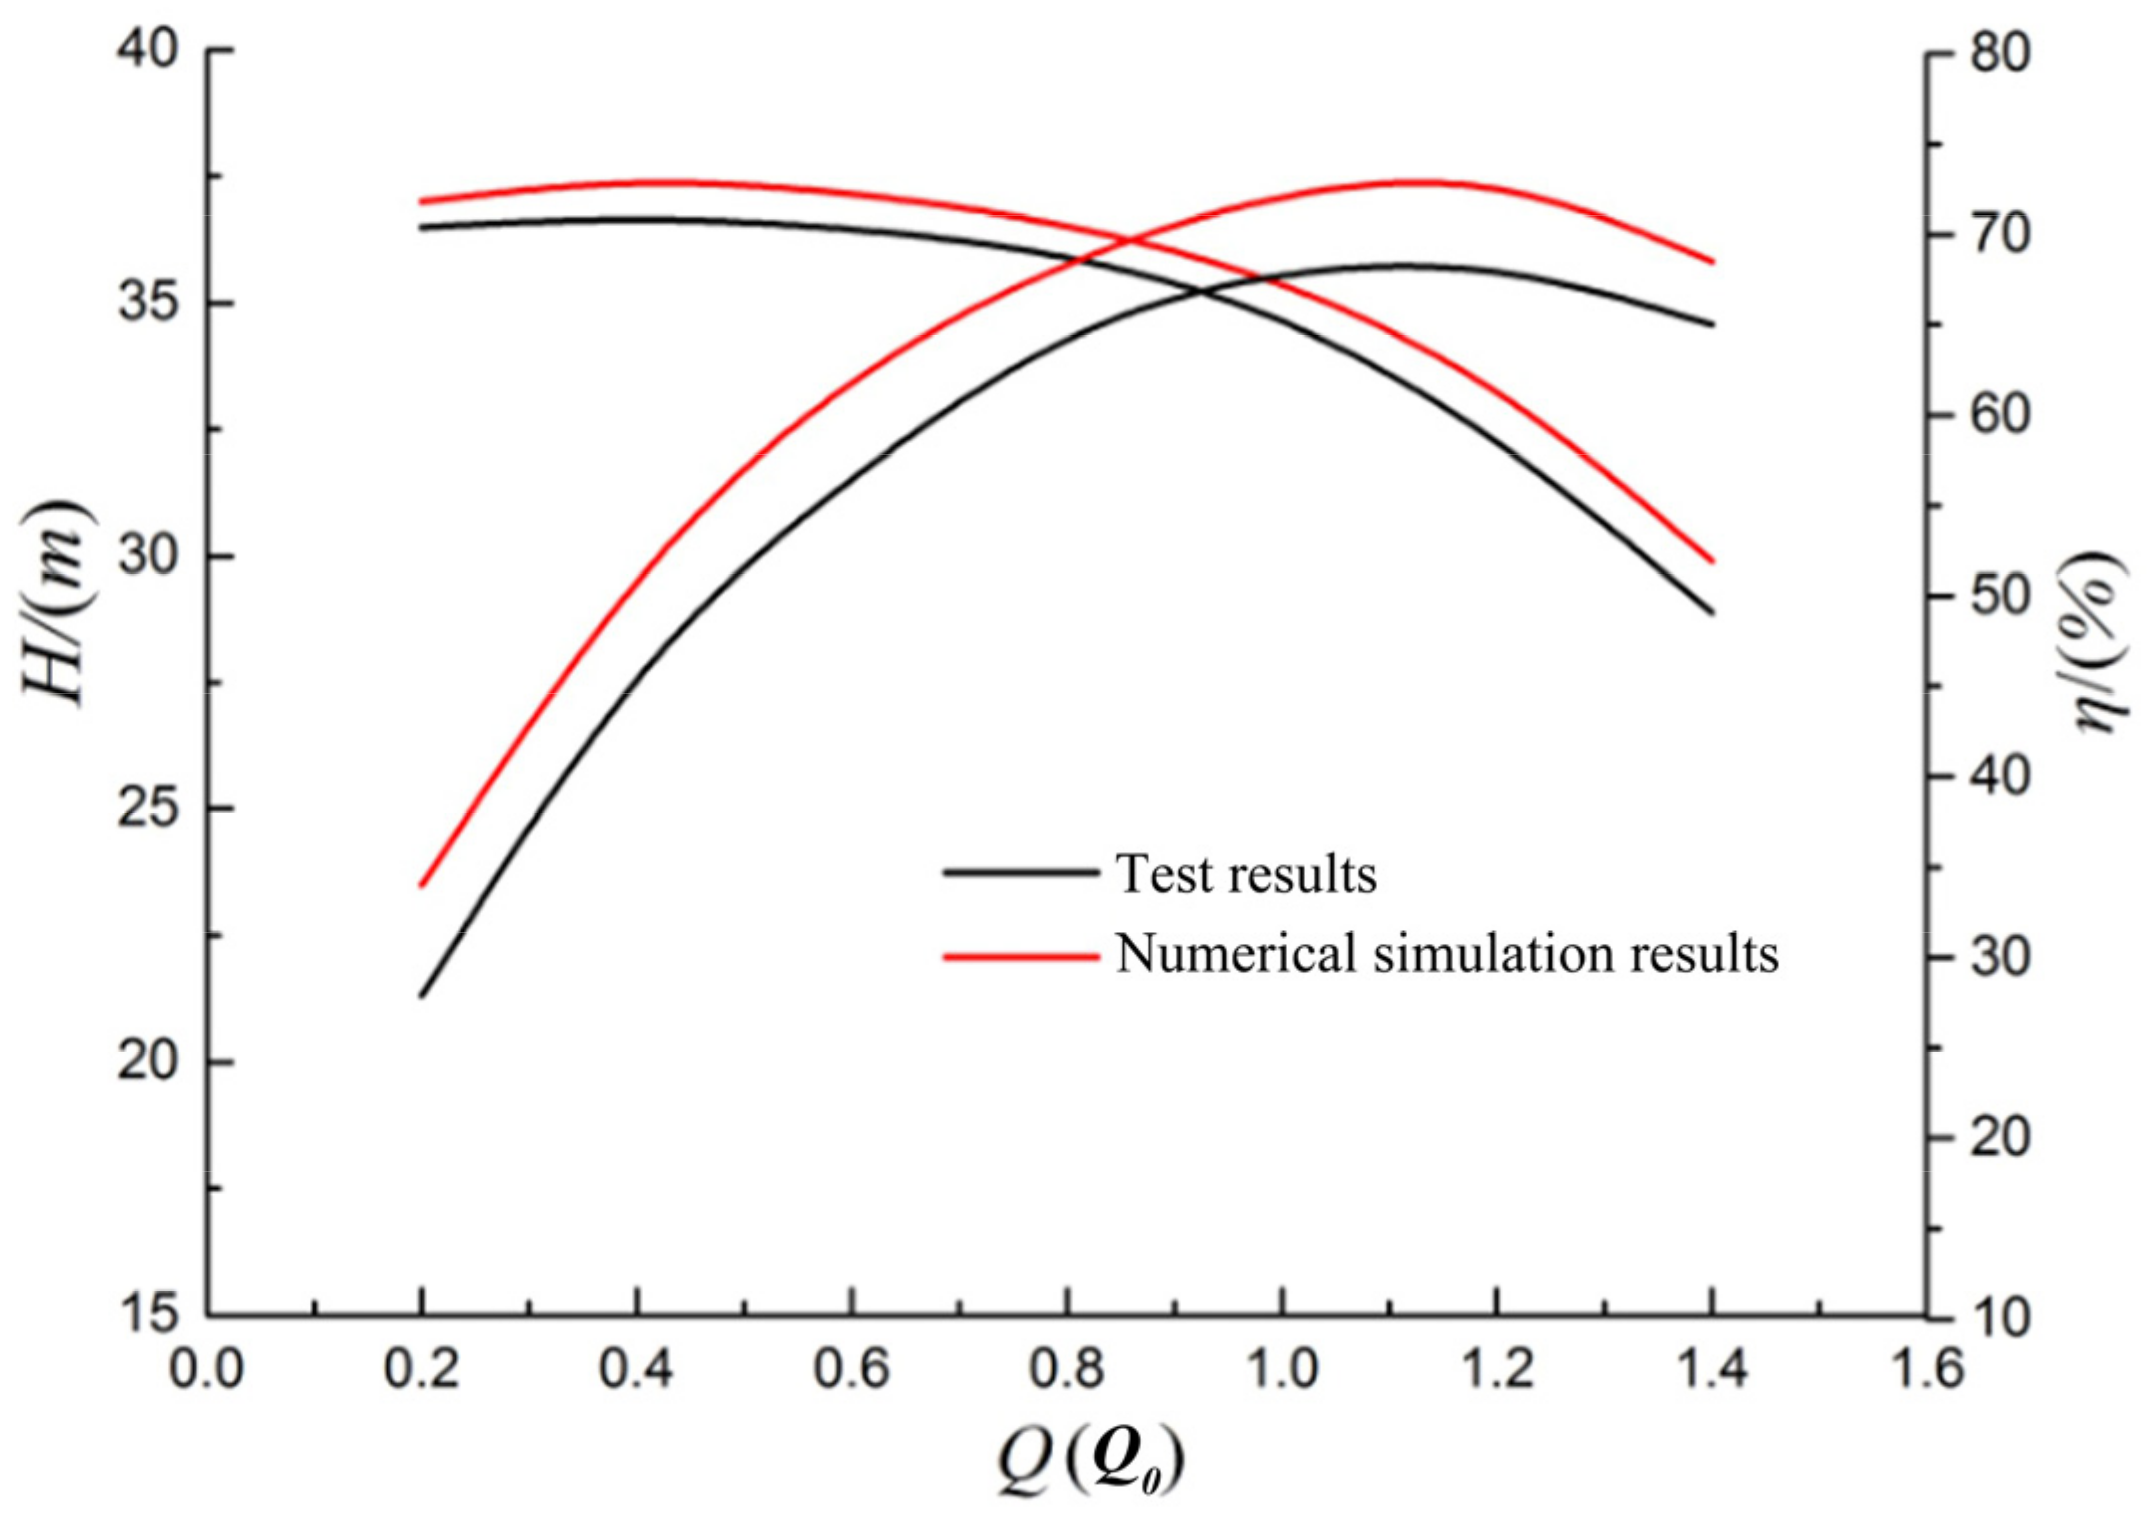
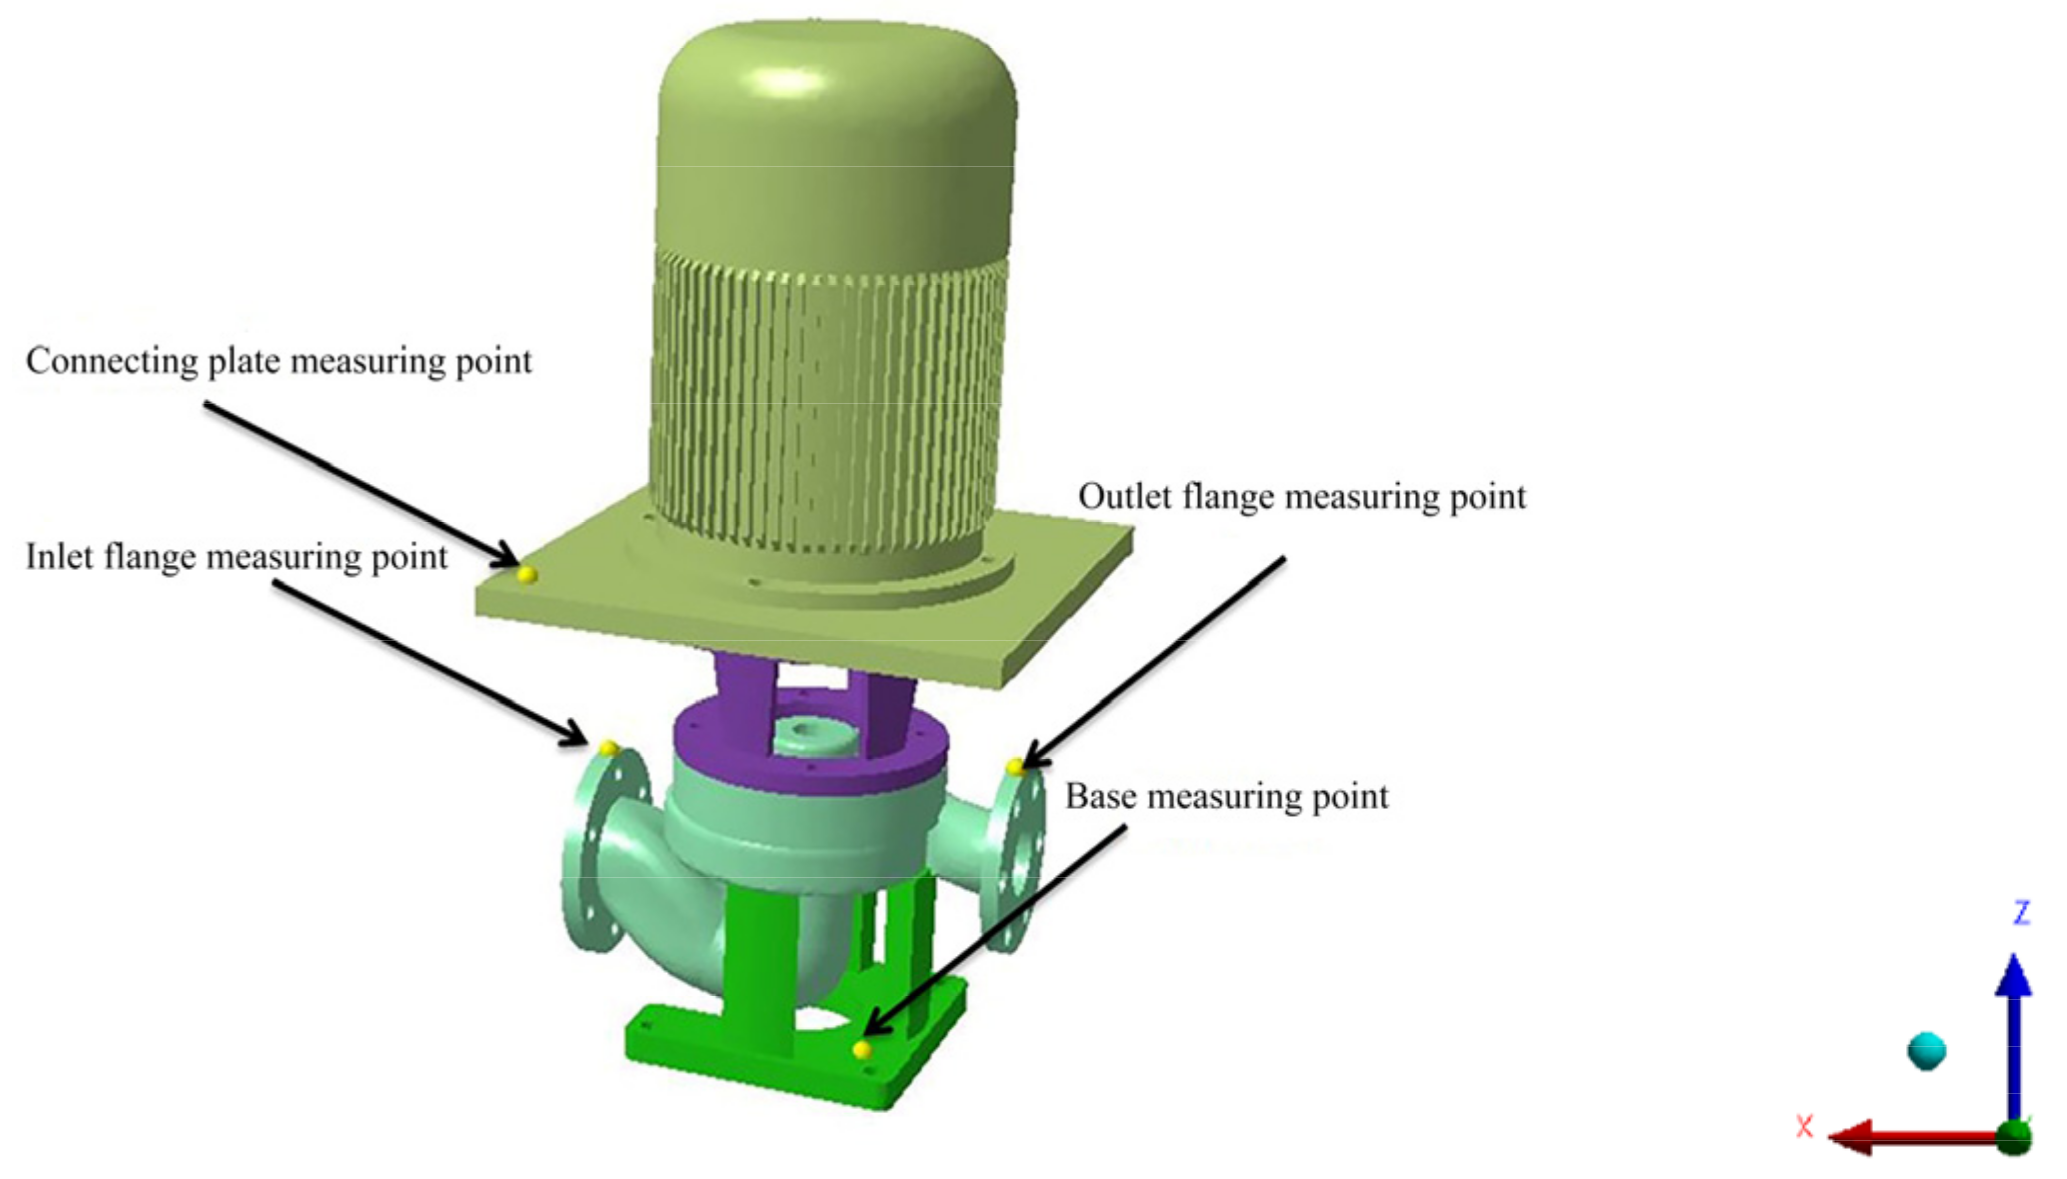
2.4. Test Object and External Characteristic Experiment

The vibration test was carried out on the closed test bench of the marine pump of Jiangsu University. This test used a three-axis vibration acceleration sensor model INV9832. The sampling frequency was 6.4 kHz and the sampling time was 30 s. The arrangement of vibration measuring points is shown in Figure 7.
In order to verify the reliability of the numerical simulation results, the external characteristic curve of marine pump was compared with that of the numerical simulation. The comparison result of the external characteristic curve is shown in Figure 8. Under the rated flow, the numerical simulation result of the head differed by 4.43% from the test value, and the efficiency differed from the test value by 1.90%, which shows that the adopted numerical simulation calculation method was reliable.

3. Analysis of Numerical Simulation Results

3.1. Analysis of Fluid Excitation Calculation Results

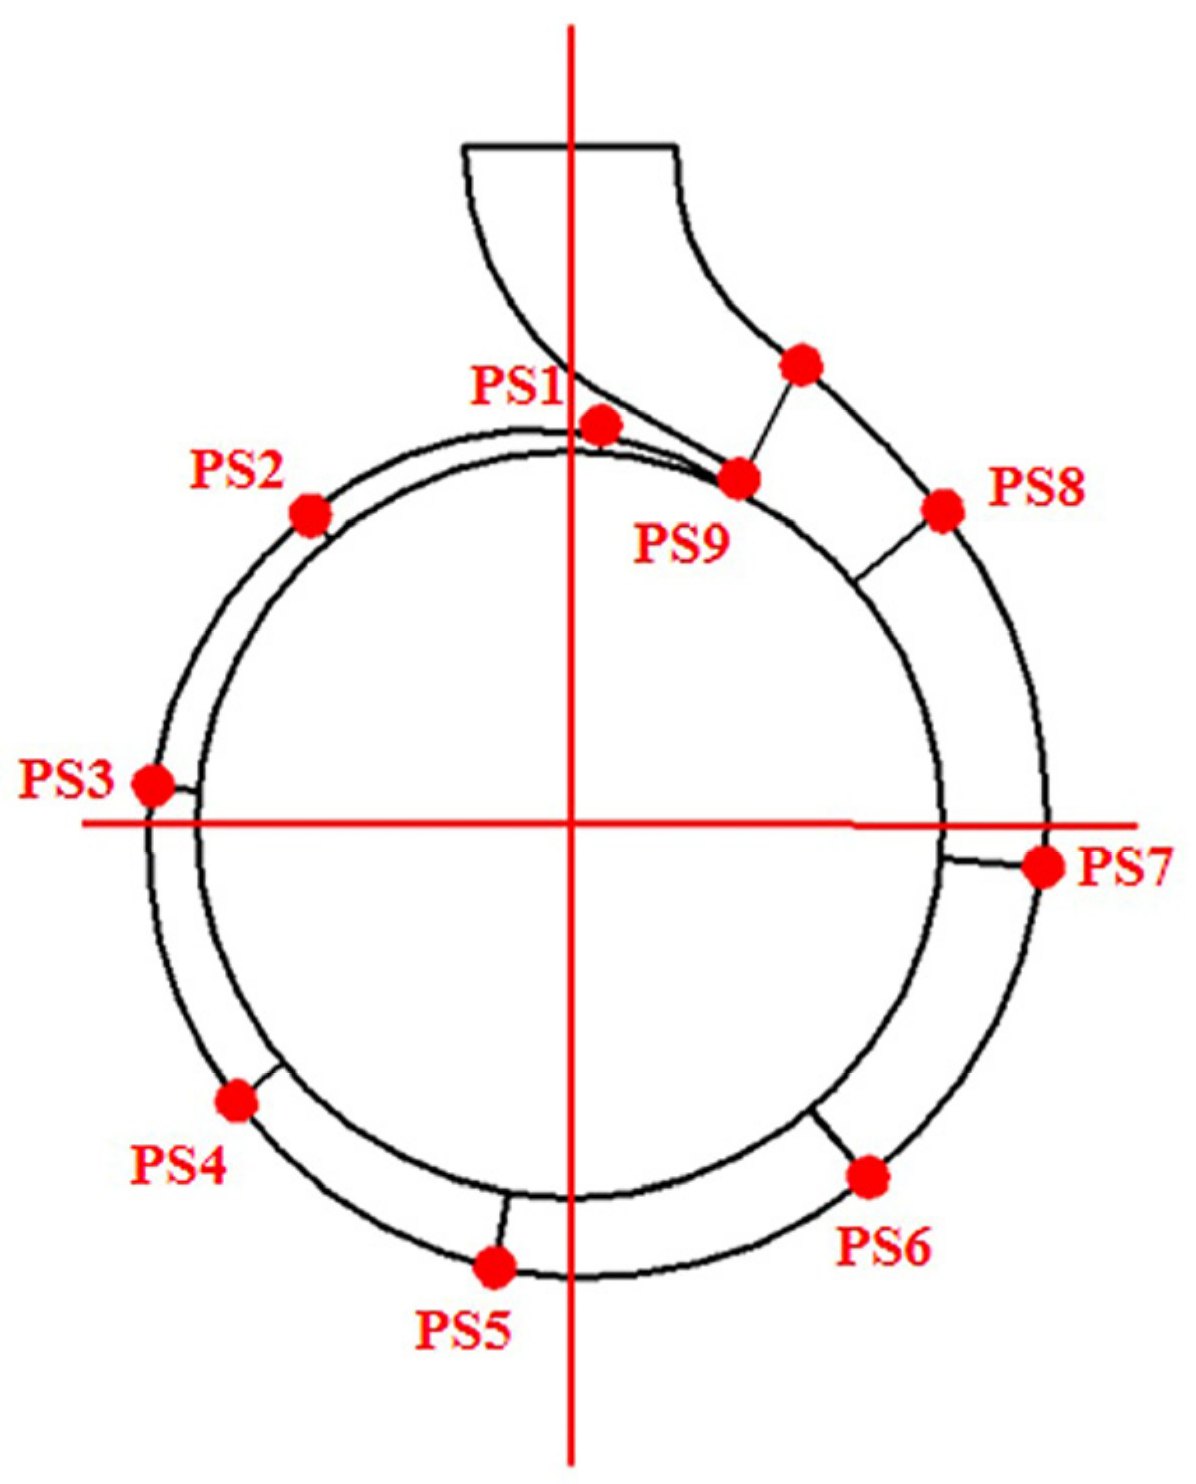
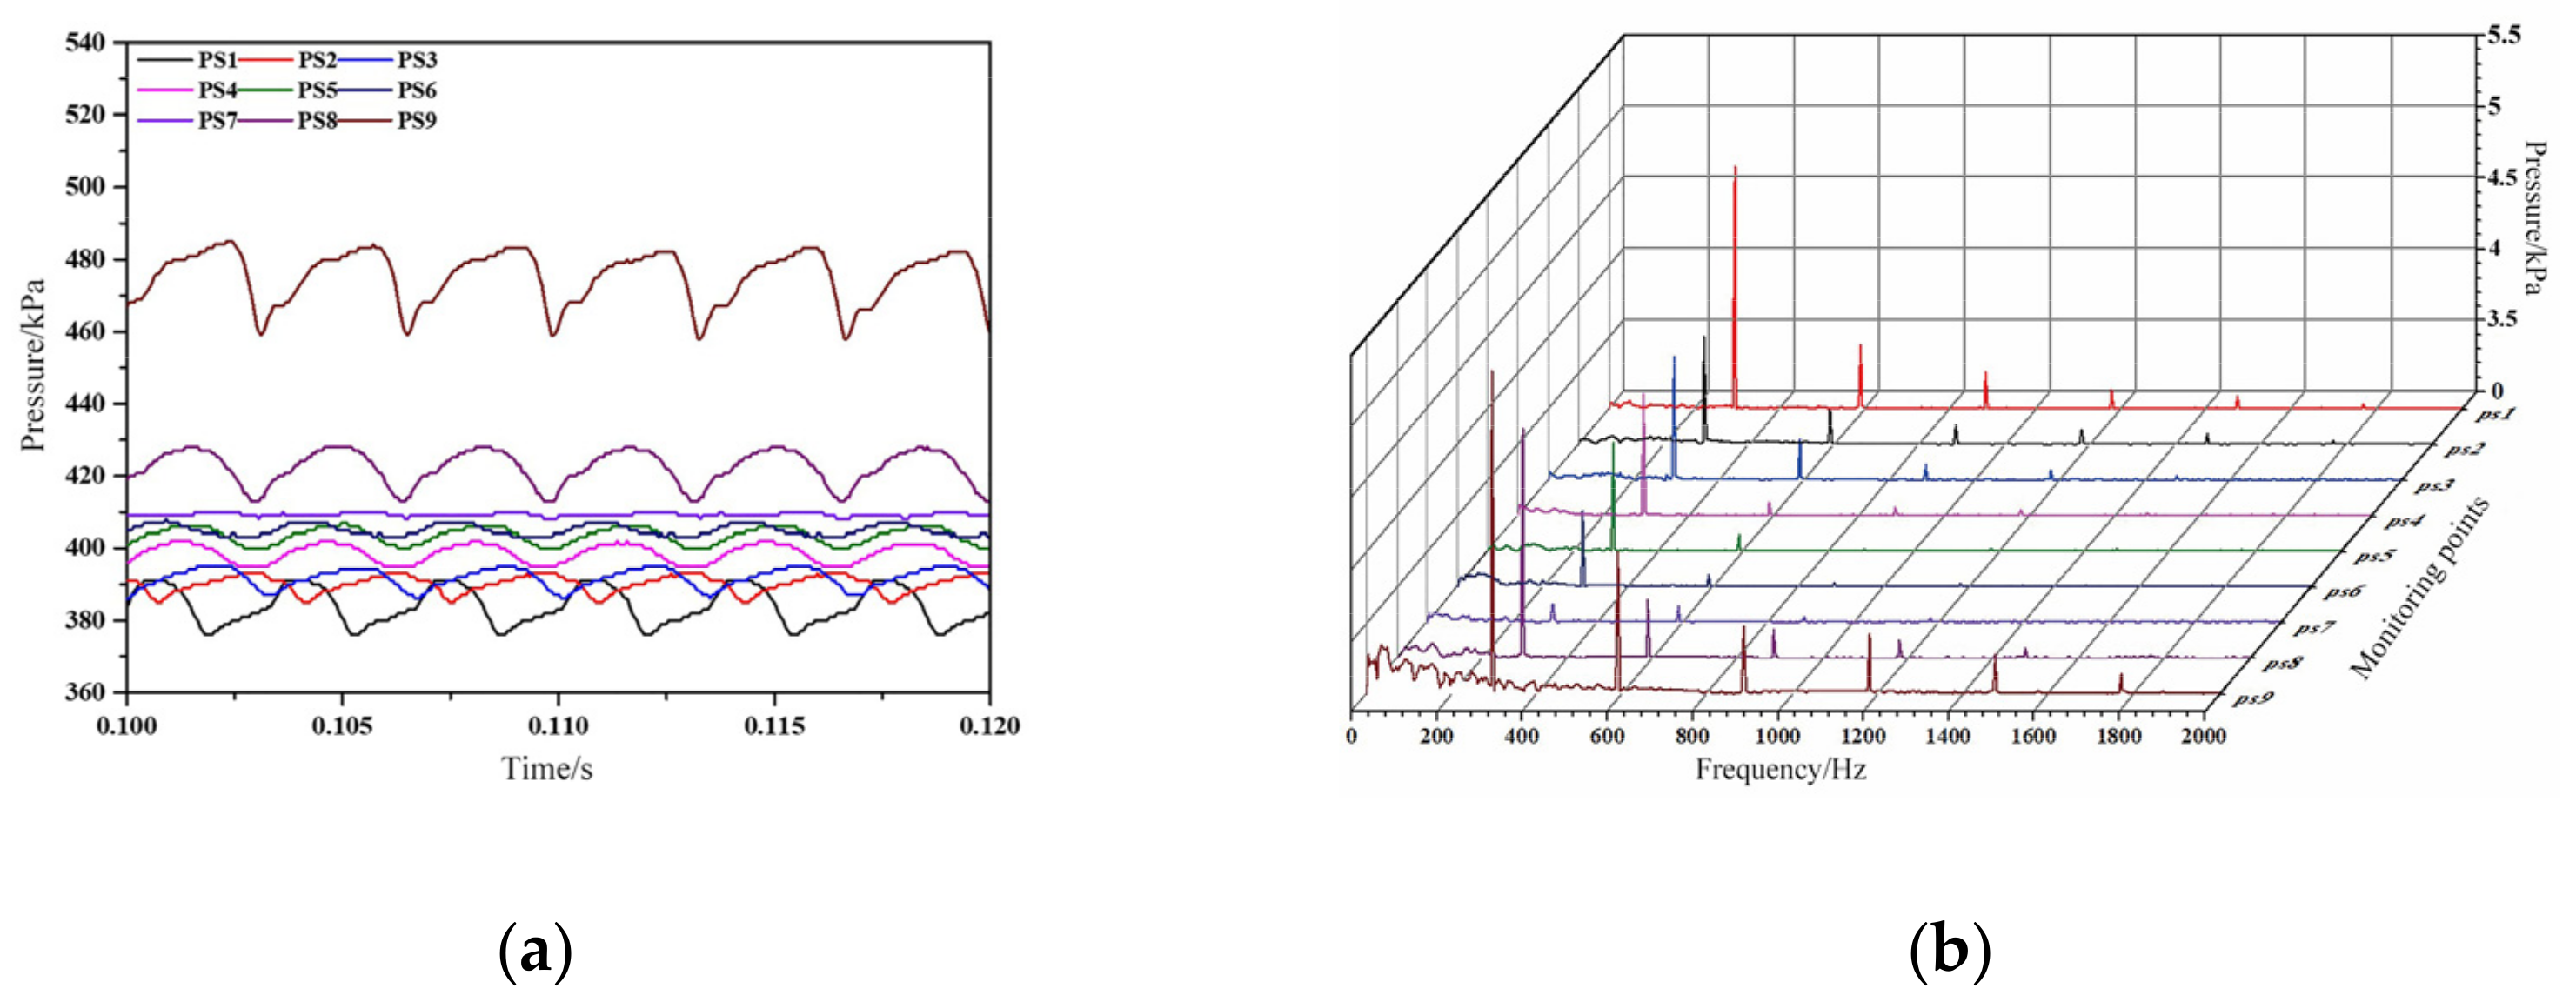
3.1.1. Force Analysis of the Volute Wall

The reason for the vibration of the marine centrifugal pump caused by the fluid excitation is the result of the pulsation force of the fluid acting on the structure. Setting up monitoring points at different locations to monitor changes in pressure pulsation in real time can more clearly reflect the characteristics of fluid excitation. In this paper, the pressure pulsation monitoring points were set at each volute cross-section and the position of the tongue. A schematic diagram of the monitoring points is shown in Figure 9.
Figure 10 shows the time-domain and frequency-domain amplitude changes of the pressure pulsation in one cycle at each monitoring point of the volute after the pressure pulsation has stabilized. It can be seen from Figure 10a that the pressure pulsation of each measuring point had obvious periodicity, and there were six peaks in one cycle. The number of peaks corresponded to the number of blades. Comparing the amplitude of pressure pulsation at each measuring point, it can be seen that the amplitude of the pressure pulsation gradually increased from the first cross-section to the eighth cross-section. At the volute tongue position, the pulsation amplitude increased sharply from 450 kPa at the eighth cross-section to 470 kPa. Figure 10a clearly reflects the variation law of internal pressure pulsation with time.
It can be seen from Figure 10b that the pressure pulsation at each monitoring point had a clear peak at the 1× blade passing frequency (295Hz). Obvious peaks also appeared in multiples of the 1× blade passing frequency, indicating that the main reason for the pressure pulsation is the interaction between the impeller and the diaphragm. It can be seen from the variation of the main frequency amplitude at each monitoring point that the pressure pulsation amplitude at the tongue position was the highest. The main frequency amplitude of the pressure pulsation from the first to the seventh cross-section gradually decreased, and the main frequency amplitude suddenly increased at the eighth cross-section. In conclusion, because the fluid was greatly affected by the tongue, the pressure pulsation near the tongue had a large amplitude. With the increase in distance from the tongue, the main frequency amplitude of the pressure pulsation at each measuring point showed a downward trend.

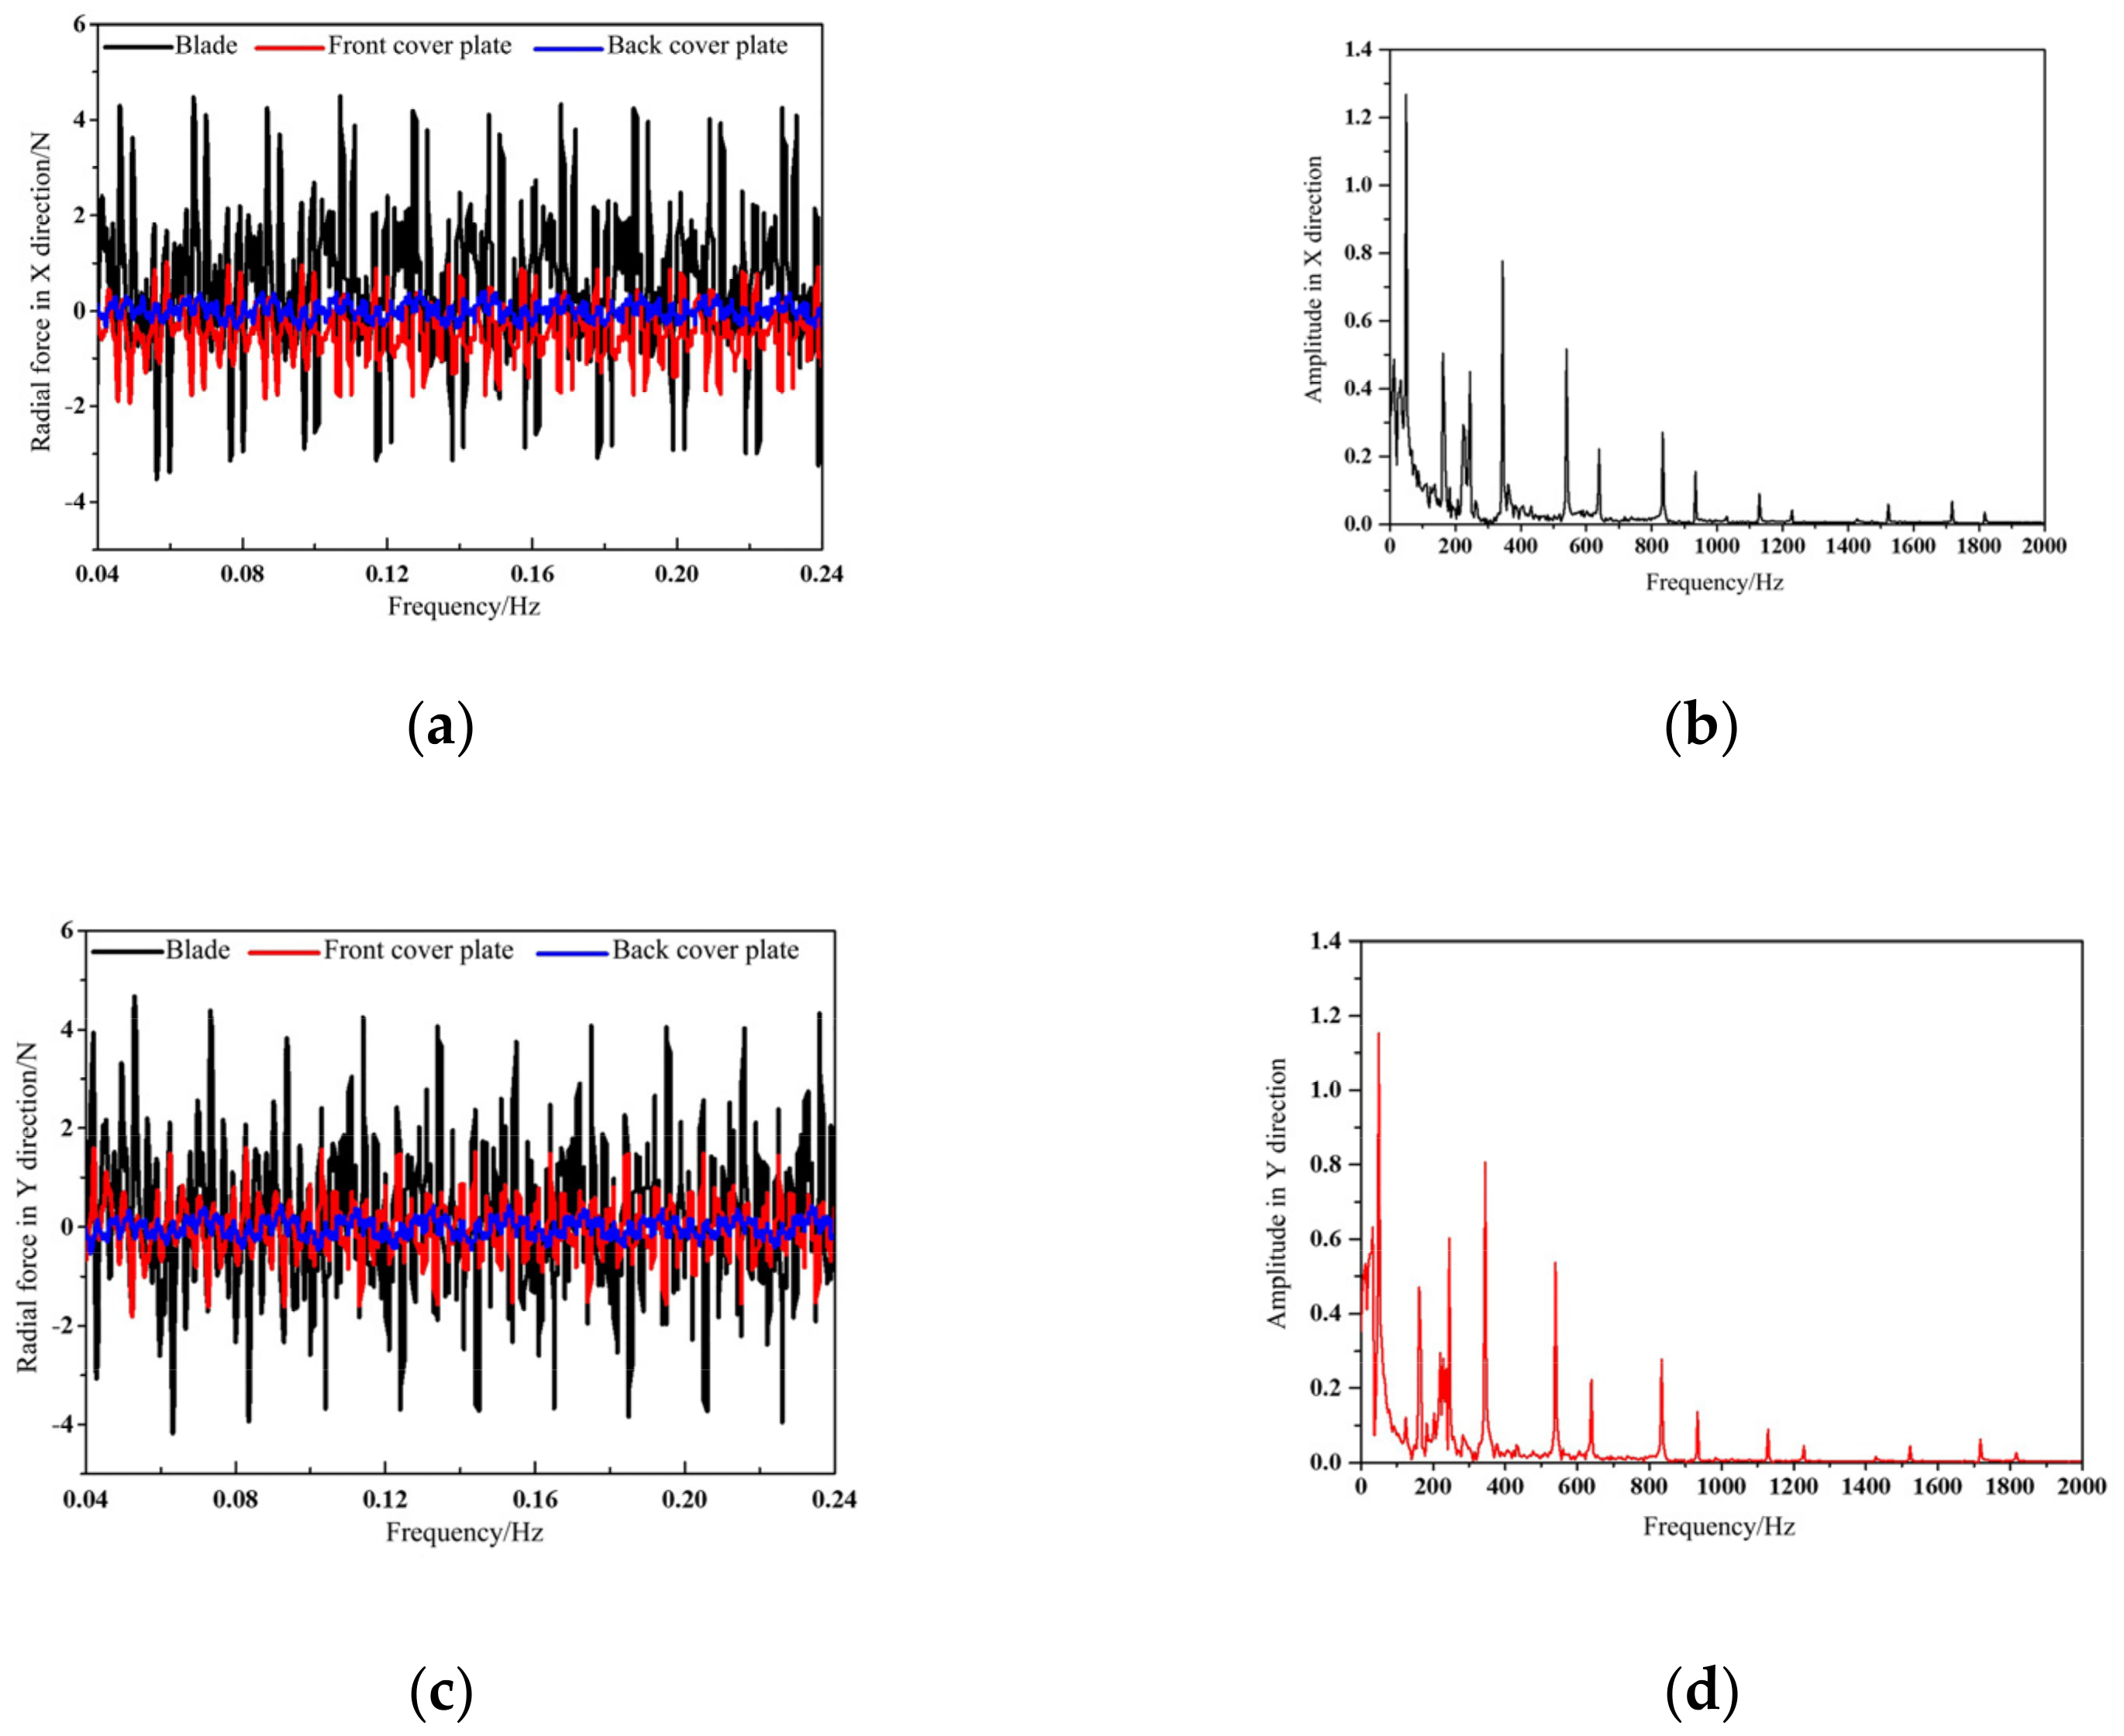
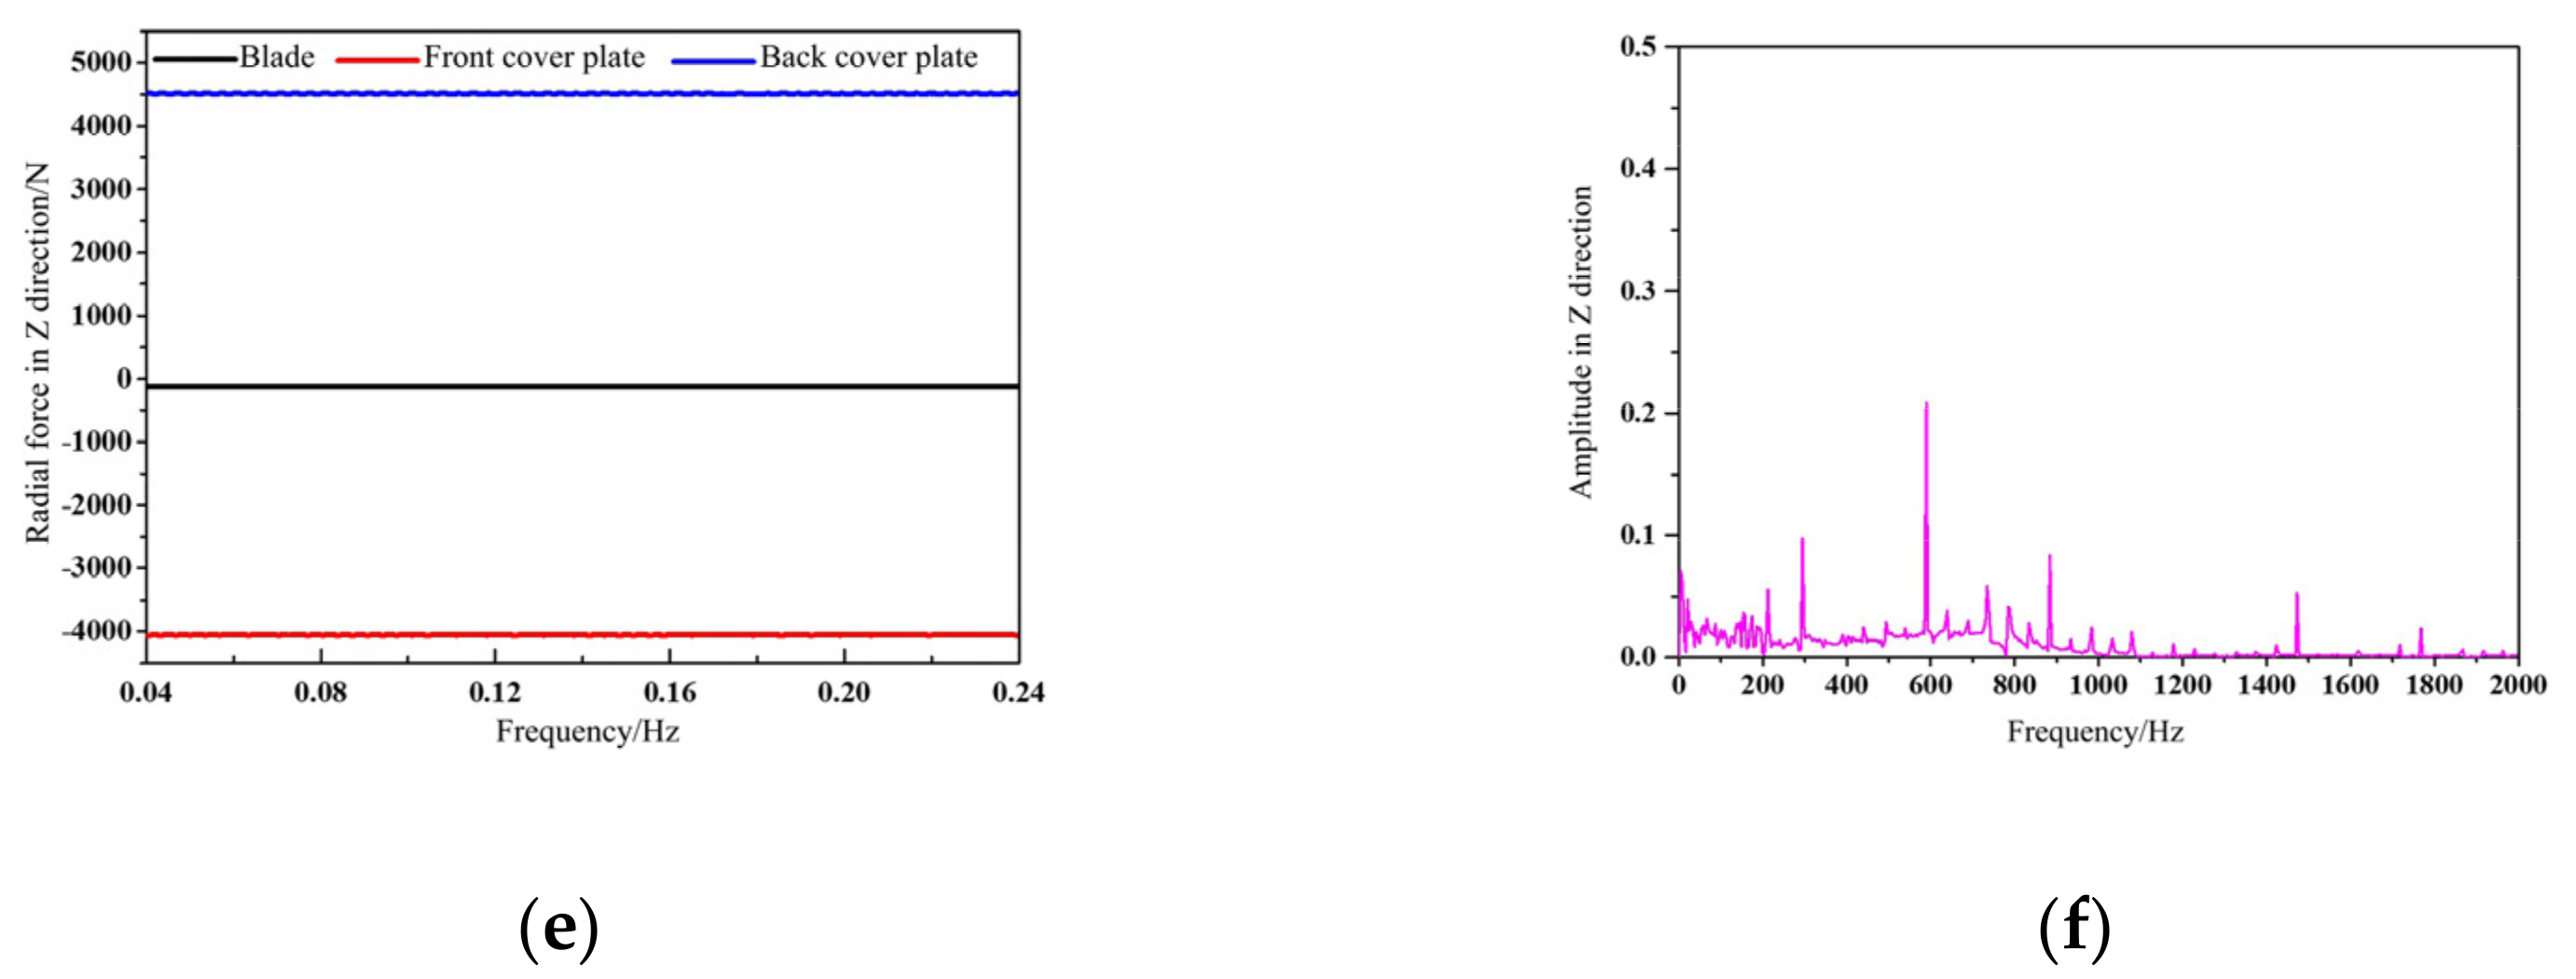
3.1.2. Force Analysis of the Impeller

The fluid excitation force acting on the impeller surface causes rotor vibration and transfer to the pump body, which is one of the main factors leading to vibration of the marine pump unit. In order to explore the law of pump vibration caused by fluid excitation, the characteristics of fluid excitation force on the impeller were analyzed. Figure 11 shows the time-domain and frequency-domain amplitude changes of the horizontal radial X, horizontal radial Y, and vertical axial Z of the impeller under the rated condition, and these three directions were perpendicular to each other. It can be seen from the time-domain diagram of the three directions in Figure 11a,c,e that the force of the impeller had obvious periodicity, and the length of each period was equal to the time required for the impeller to rotate once. In addition, because the motor and the marine pump used the same rotor, eccentricity failure would not occur, and the radial forces on the impeller in the X and Y directions were very similar. Radial force is one of the main causes of vibration of the impeller. It can be seen from Figure 11a, and Figure 10c that the blades were most affected by the radial force in each part of the impeller, followed by the front cover plate, whereas the back cover plate was the least affected. Although the force of each part of the impeller was large, the force in the Z direction of the impeller was small due to the superposition of radial forces.
Fourier transform was performed on the forces in the three directions, and the frequency-domain characteristics of the forces in the three directions of the impeller were obtained as shown in Figure 11b,d,f. It can be seen from Figure 11b,d that the main frequency of the radial force of the impeller was at the 1× shaft frequency, and other characteristic frequencies were distributed at multiples of the 1× shaft frequency. The main frequency of the axial force of the impeller was at the 2× blade passing frequency, and there were higher peaks at the 1× and 3× blade passing frequencies.

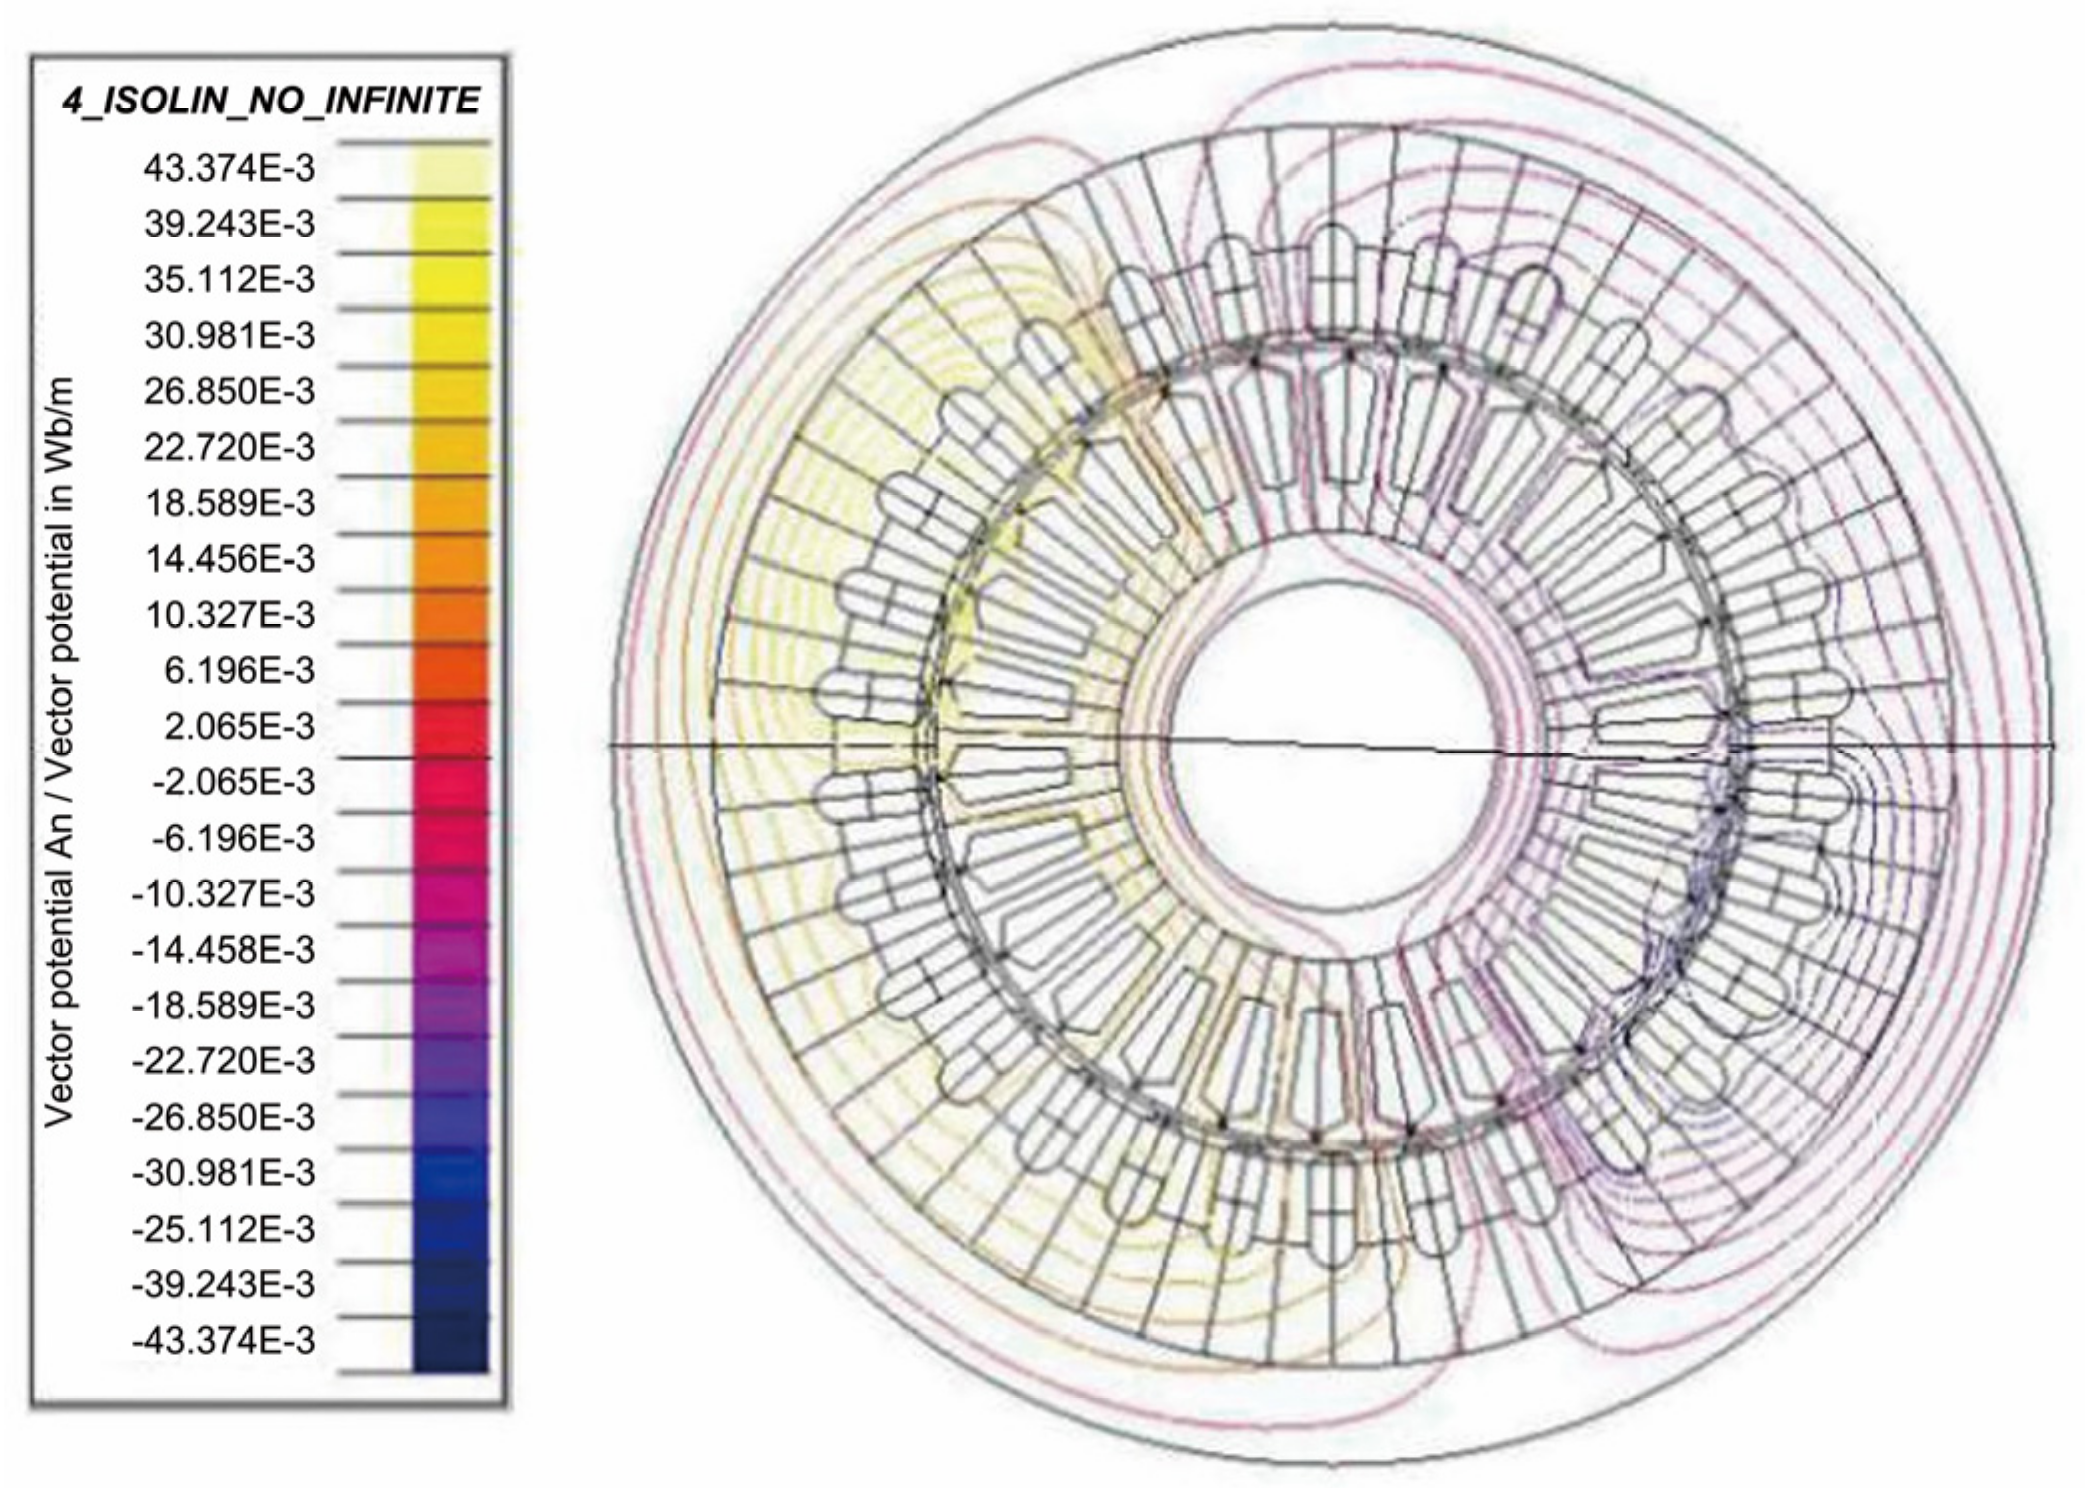
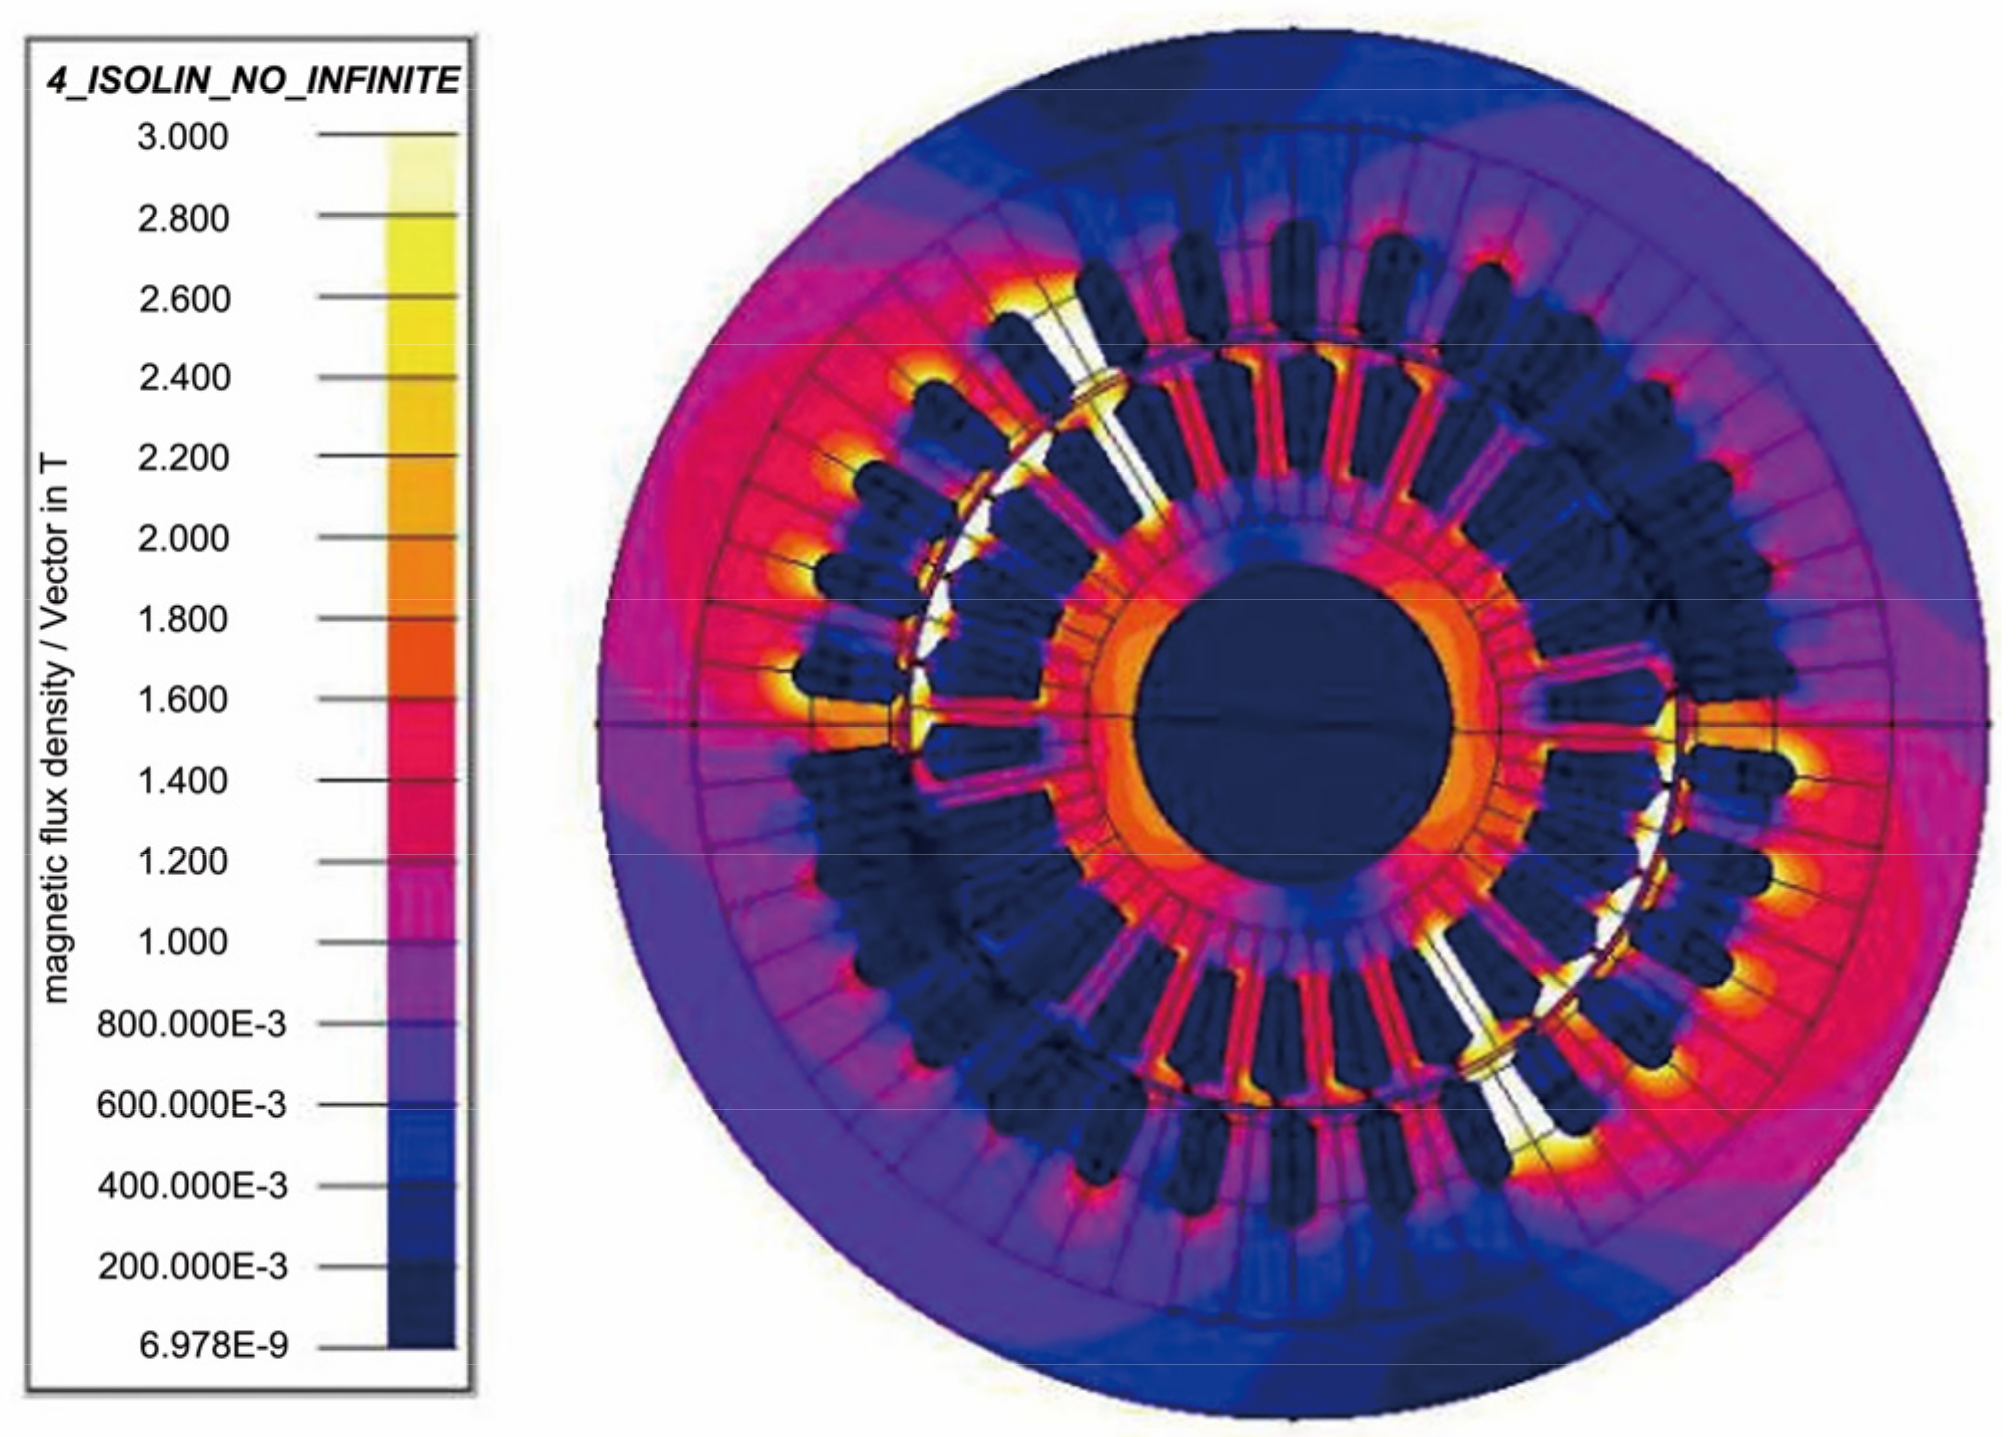
3.2. Analysis of Electromagnetic Excitation Calculation Results

Because the air gap magnetic field of the motor is affected by many factors, the distribution of the internal magnetic field is complex. The finite element method can reflect the distribution of the internal magnetic field more comprehensively and clearly. Figure 12 and Figure 13 show the magnetic line distribution and magnetic flux density distribution at a certain moment after the motor was stable.
It can be seen from Figure 12 that the high-energy region was distributed on the surface of the stator and rotor and the stator slot. It can be seen from Figure 13 that the high flux density was concentrated in the stator slot, the rotor slot, and the gap. The maximum value of the flux density was located in the stator and rotor slot, up to 2.6 T. When the stator is subjected to radial electromagnetic force, it vibrates and causes the motor to vibrate. In order to better explore the influence of radial electromagnetic force on the motor, the electromagnetic radial force on the surface of the stator slot was extracted for further analysis in this paper. Figure 14 shows the distribution nephogram of the electromagnetic force on the surface of the stator slot at different rotation angles. It can be seen from Figure 14 that the electromagnetic excitation force was distributed in the air gap of the fixed rotor and at the contact between the stator and the winding. The region excited by electromagnetic force was symmetrical and varied with the rotation angle of the rotor. In addition, the maximum electromagnetic excitation force did not exceed 3 N.

3.3. Analysis of Vibration Calculation Results

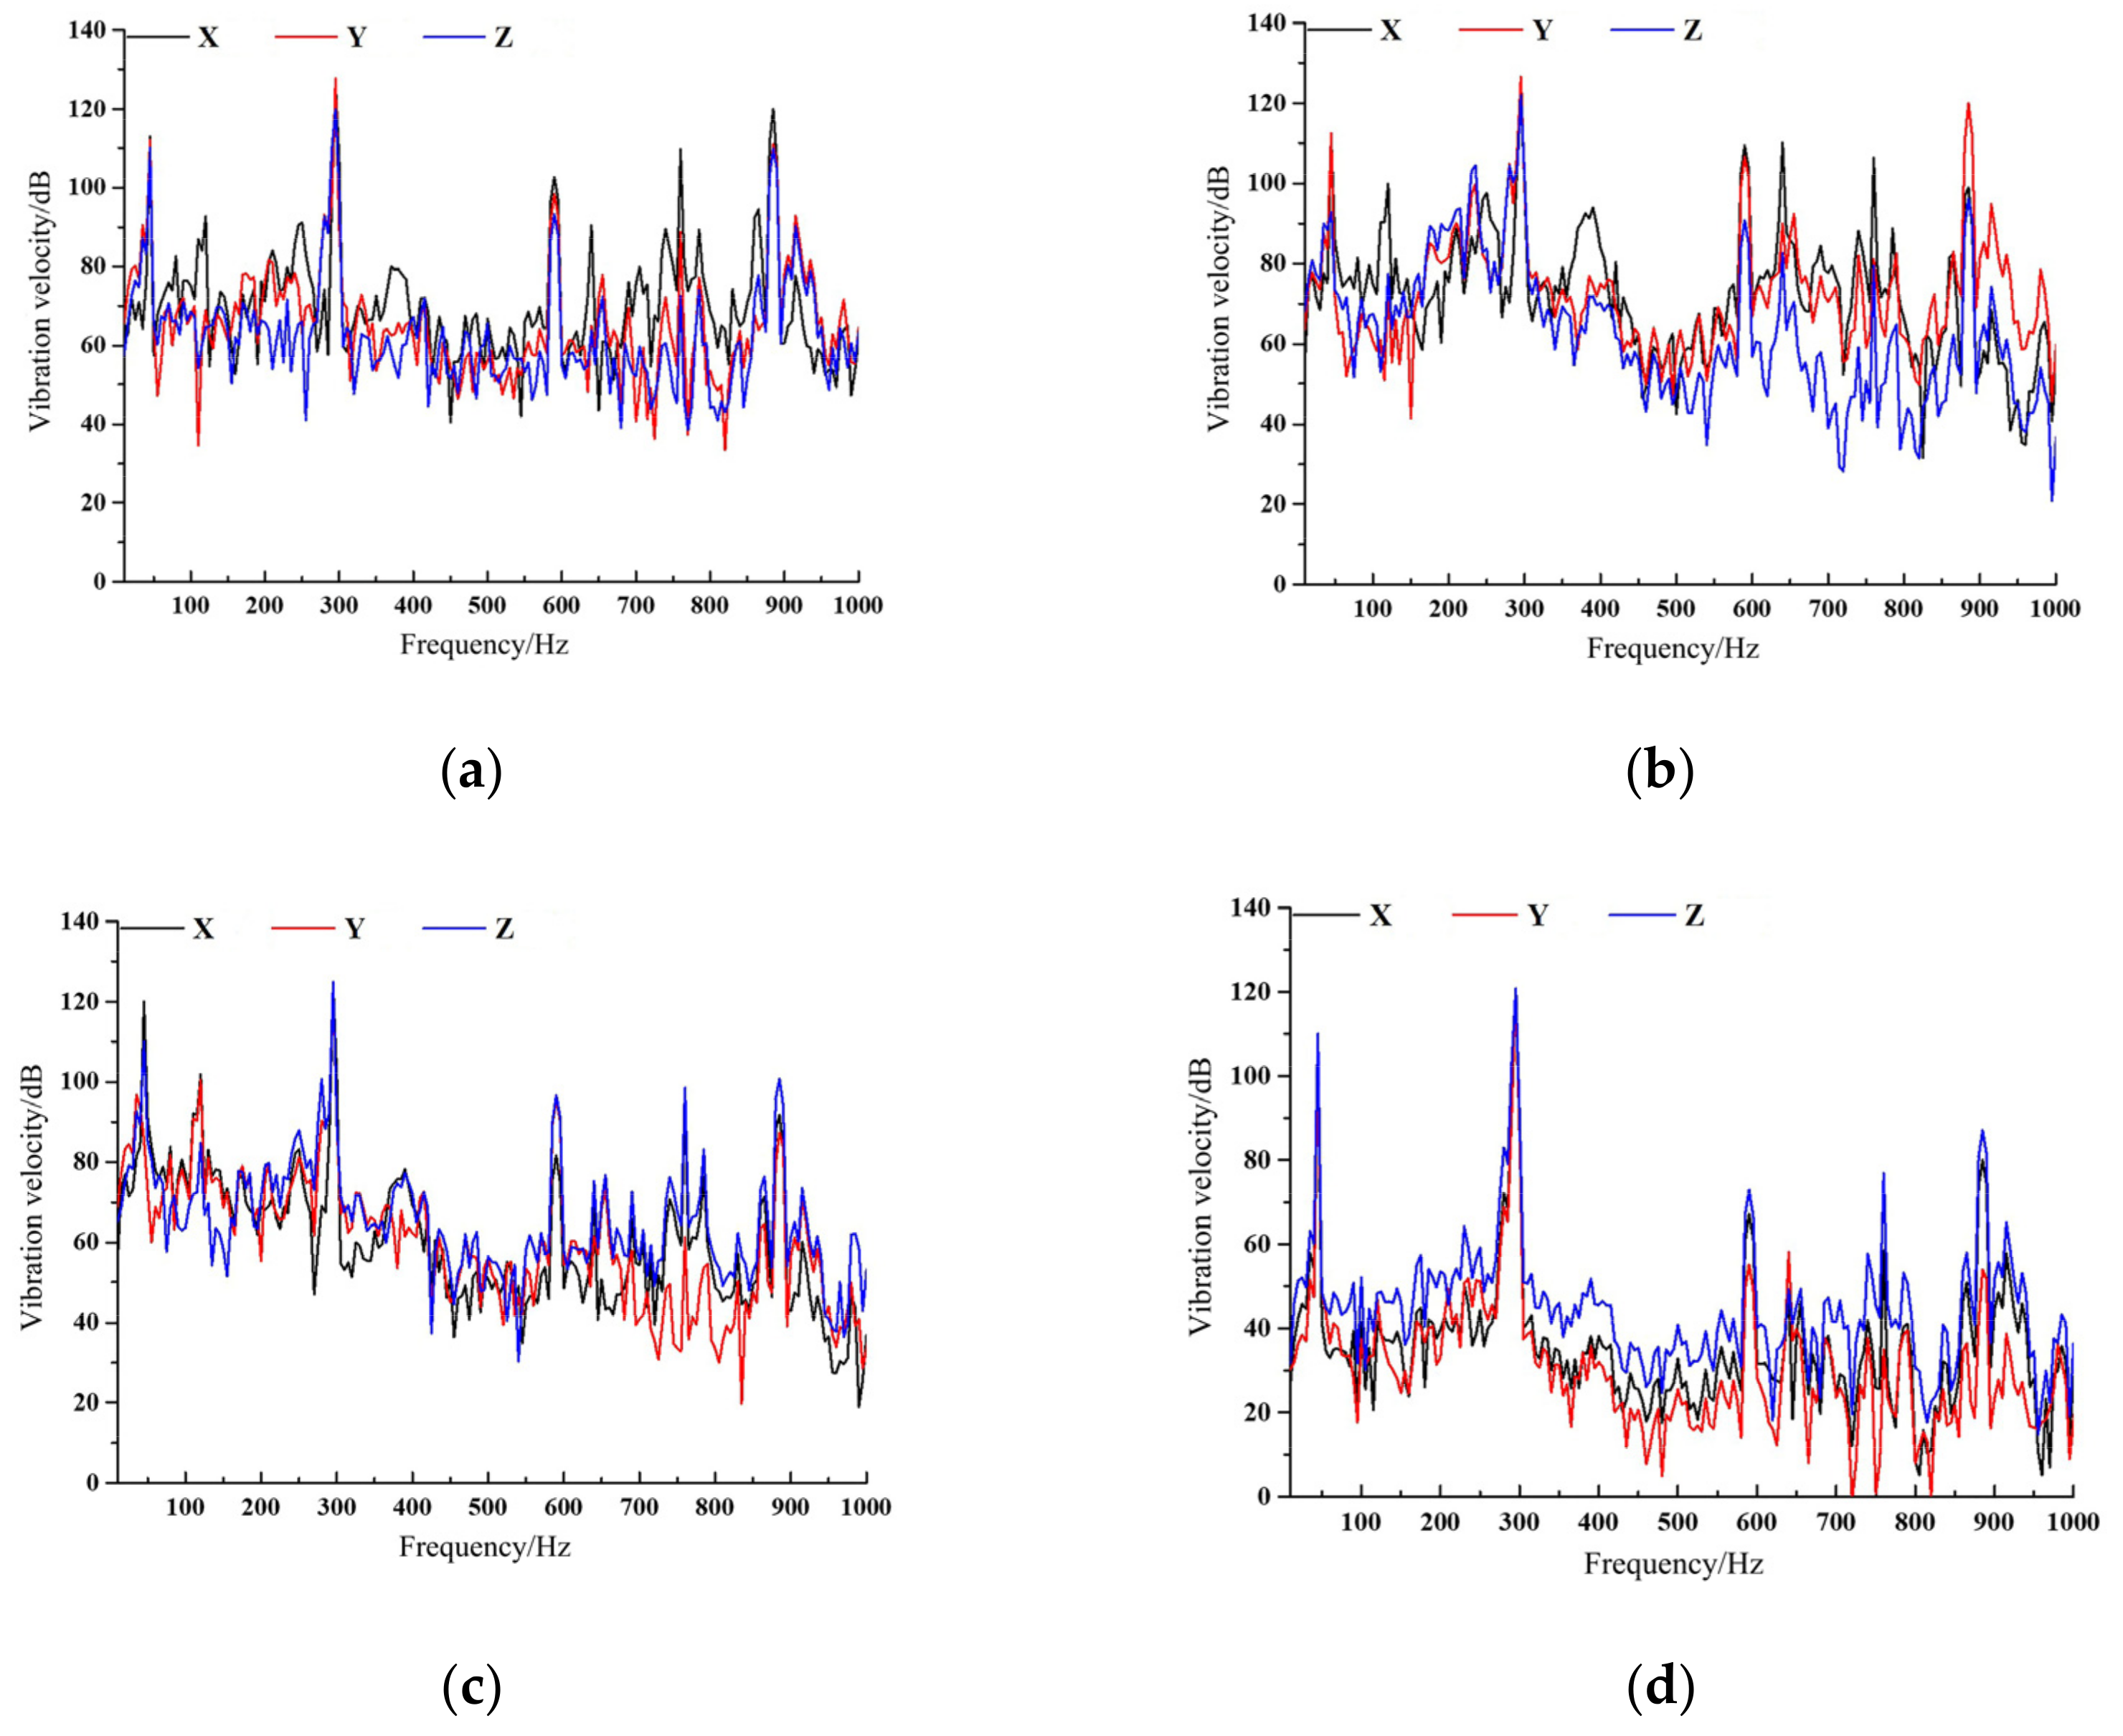
3.3.1. Fluid Excitation on the Inner Surface of the Pump-Induced Vibration Analysis

The fluid can gain a lot of kinetic energy when the impeller works on the fluid. The fluid acting on the volute and the pump chamber produces high pulse force on the wall, which is the fundamental reason for the pump unit vibration caused by the fluid excitation on the inner surface of the pump. Figure 15 shows the location of the vibration measuring point of the pump unit. The vibration measuring points were located at the connecting plate, inlet flange, outlet flange, and base.
The frequency characteristics of vibration velocity at each measuring point were obtained by calculating the vibration of pump unit caused by fluid excitation on the inner wall of volute and pump cavity, as shown in Figure 16. It can be seen from Figure 16a–d that the distribution of the characteristic frequency of vibration at each measuring point was similar. The main frequency of vibration at each measuring point was at the 1× blade passing frequency (295 Hz), and obvious peaks also appeared in multiples of the 1× blade passing frequency. In addition, it can be seen from Figure 16d that there were also obvious peaks in the low-frequency region such as the 1× shaft frequency (49 Hz). Since the pump unit may have been resonated when passing through the natural frequency, peaks also appeared at multiple natural frequencies, for example, at 36 Hz in Figure 16a–d and at 117 Hz in Figure 16b,c. In addition, the vibration velocity levels of the radial direction at the measuring points of import and export flanges were the highest in the whole frequency domain, indicating that the import and export flanges were mainly affected by the radial force. At the measuring points of the connecting plate and the base, the axial vibration velocity level was the highest, which indicates that the main vibration directions of the measuring points were different.

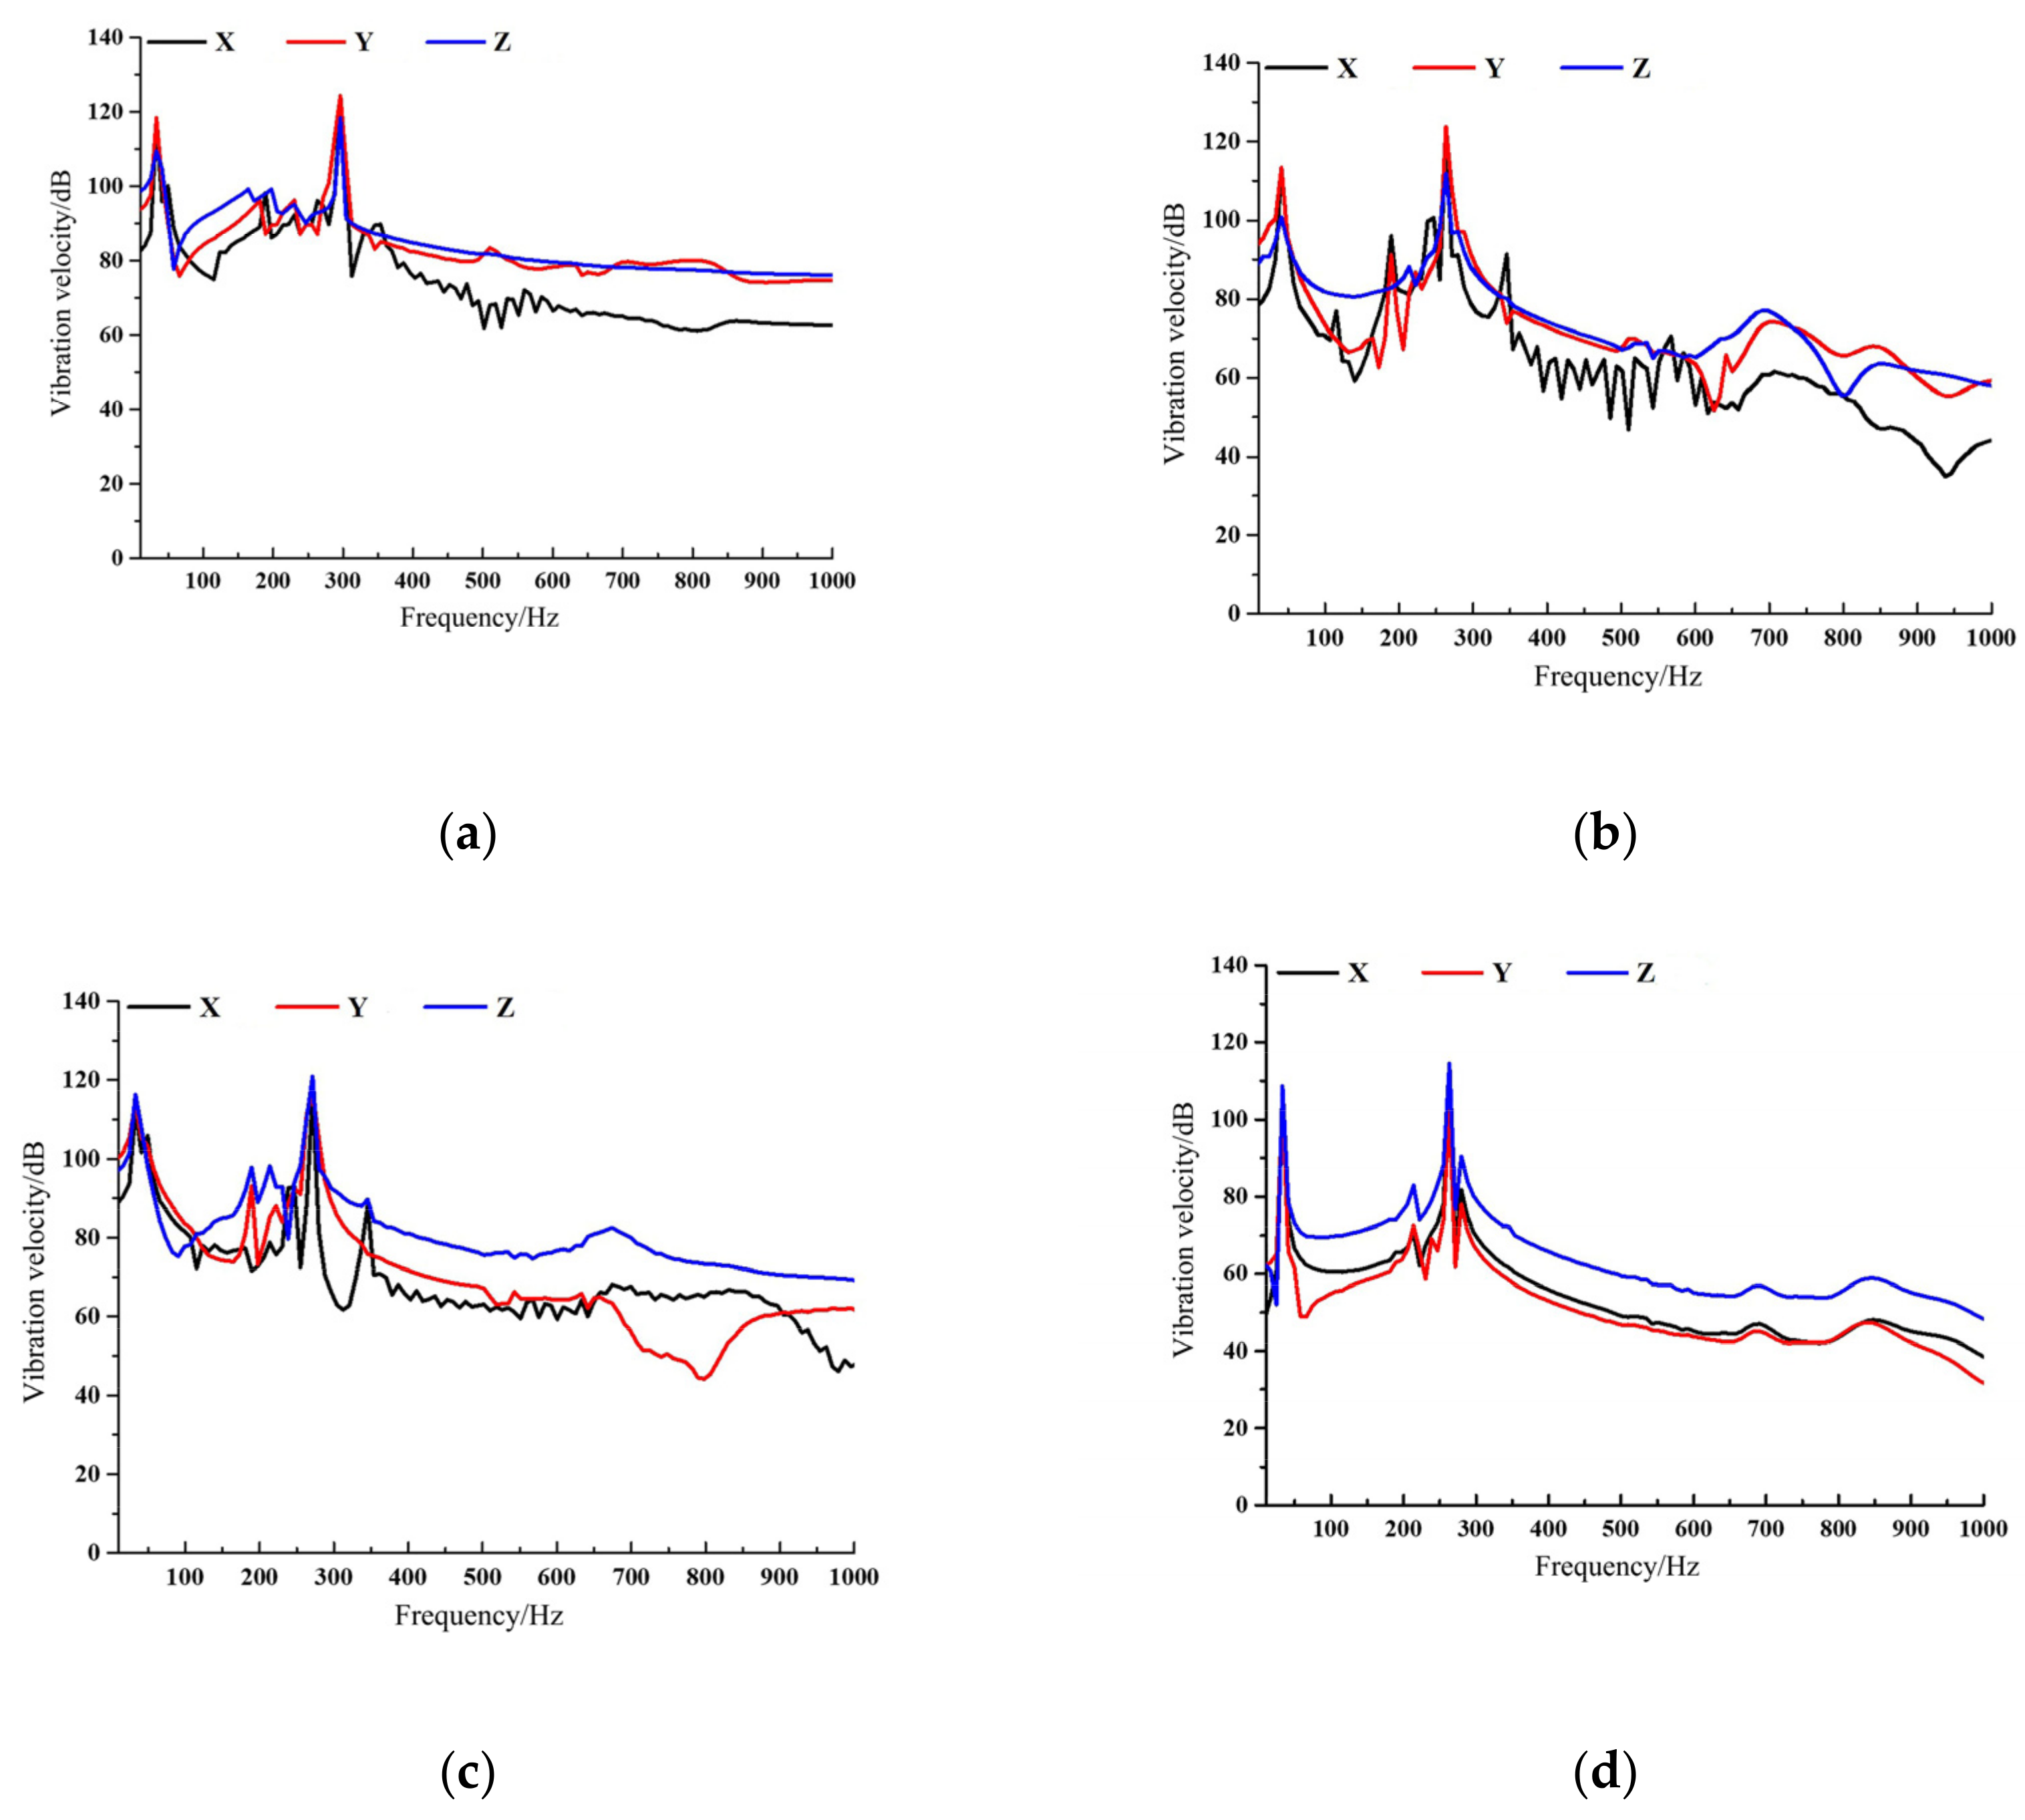
3.3.2. Fluid Excitation in Impeller-Induced Vibration Analysis

When the impeller works on the fluid, it is also subjected to the reaction force of the fluid on it, which causes the vibration of the rotor, and the vibration of the rotor is transmitted to the pump unit through the bearing housing. Figure 17 shows the frequency spectrum of the pump unit vibration caused by the fluid excitation at each measuring point through the rotor when the fluid passed through the impeller. It can be seen from Figure 17 that the vibration peak of the marine pump unit caused by fluid excitation in the impeller was near the 1× blade passing frequency at different measuring points, It can be seen from Figure 17a–d that the vibration peak of the marine pump unit caused by fluid excitation in the impeller was near the 1× blade passing frequency at different measuring points, which indicates that the 1× blade passing frequency was the main frequency of the vibration of the marine pump unit induced by the fluid. In addition, due to the influence of the rotor itself, an obvious peak appeared at the 1× shaft frequency. Compared with the vibration velocity level in different directions of each measuring point, the vibration velocity level of horizontal radial Y at the inlet and outlet flange was the highest, and the vibration velocity level of axial Z at the motor base and the base was the highest. The characteristic frequency of the pump unit vibration at each measuring point caused by the fluid excitation in the impeller was basically consistent with the fluid excitation on the inner surface of the pump. However, the vibration of the pump unit shown in Figure 17 was relatively stable in the whole frequency domain, and the vibration velocity level showed a downward trend with the frequency increasing. In the whole frequency domain, the variation law of the vibration of the pump unit caused by the fluid excitation in the impeller was quite different from the fluid excitation on the inner surface of the pump.

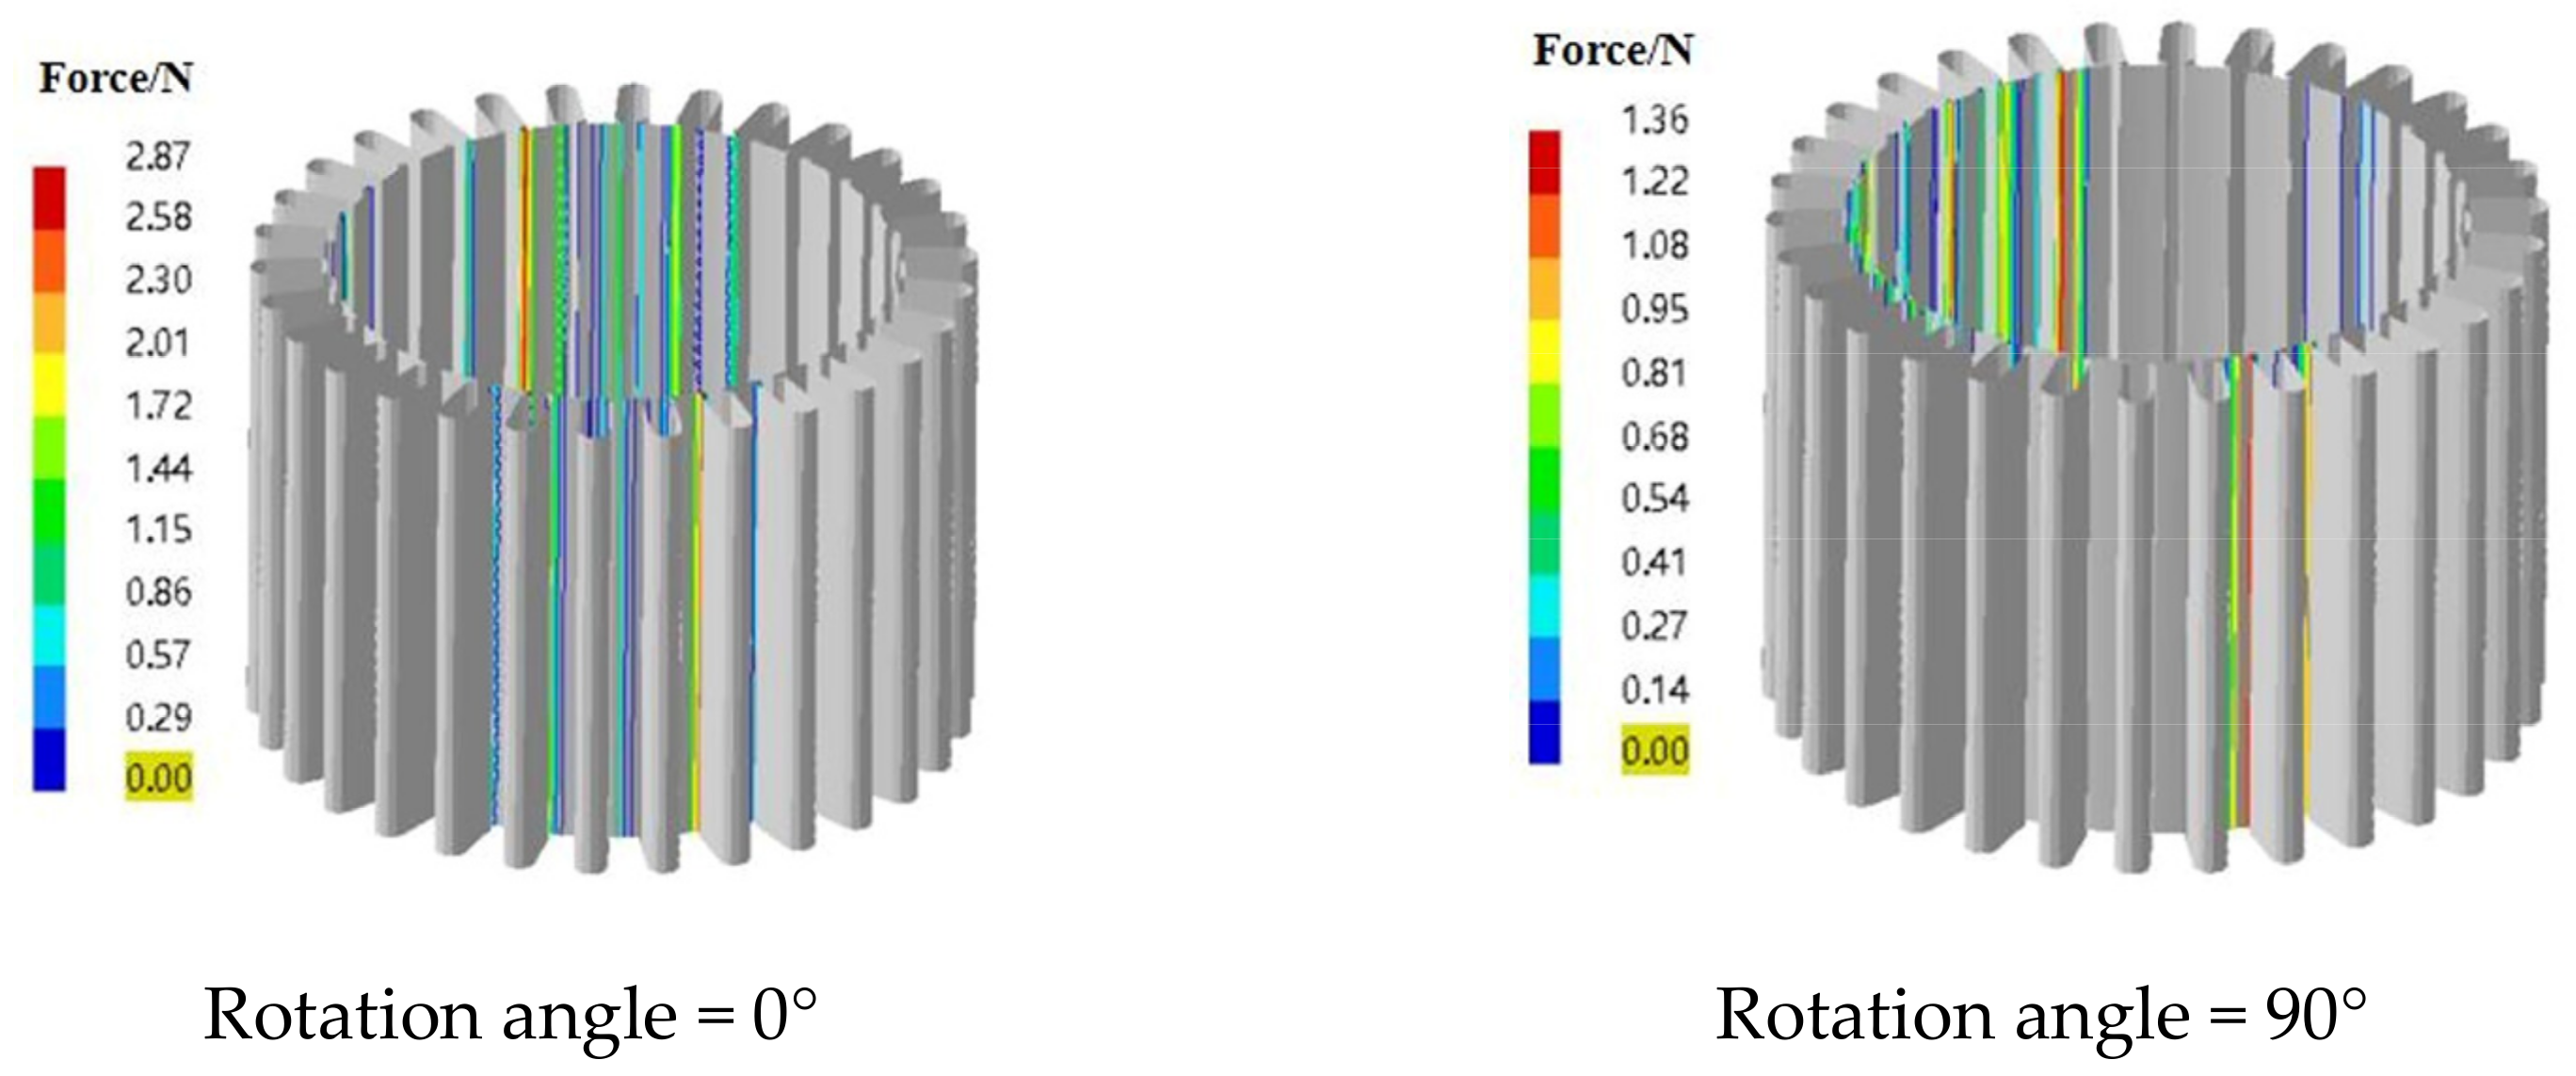
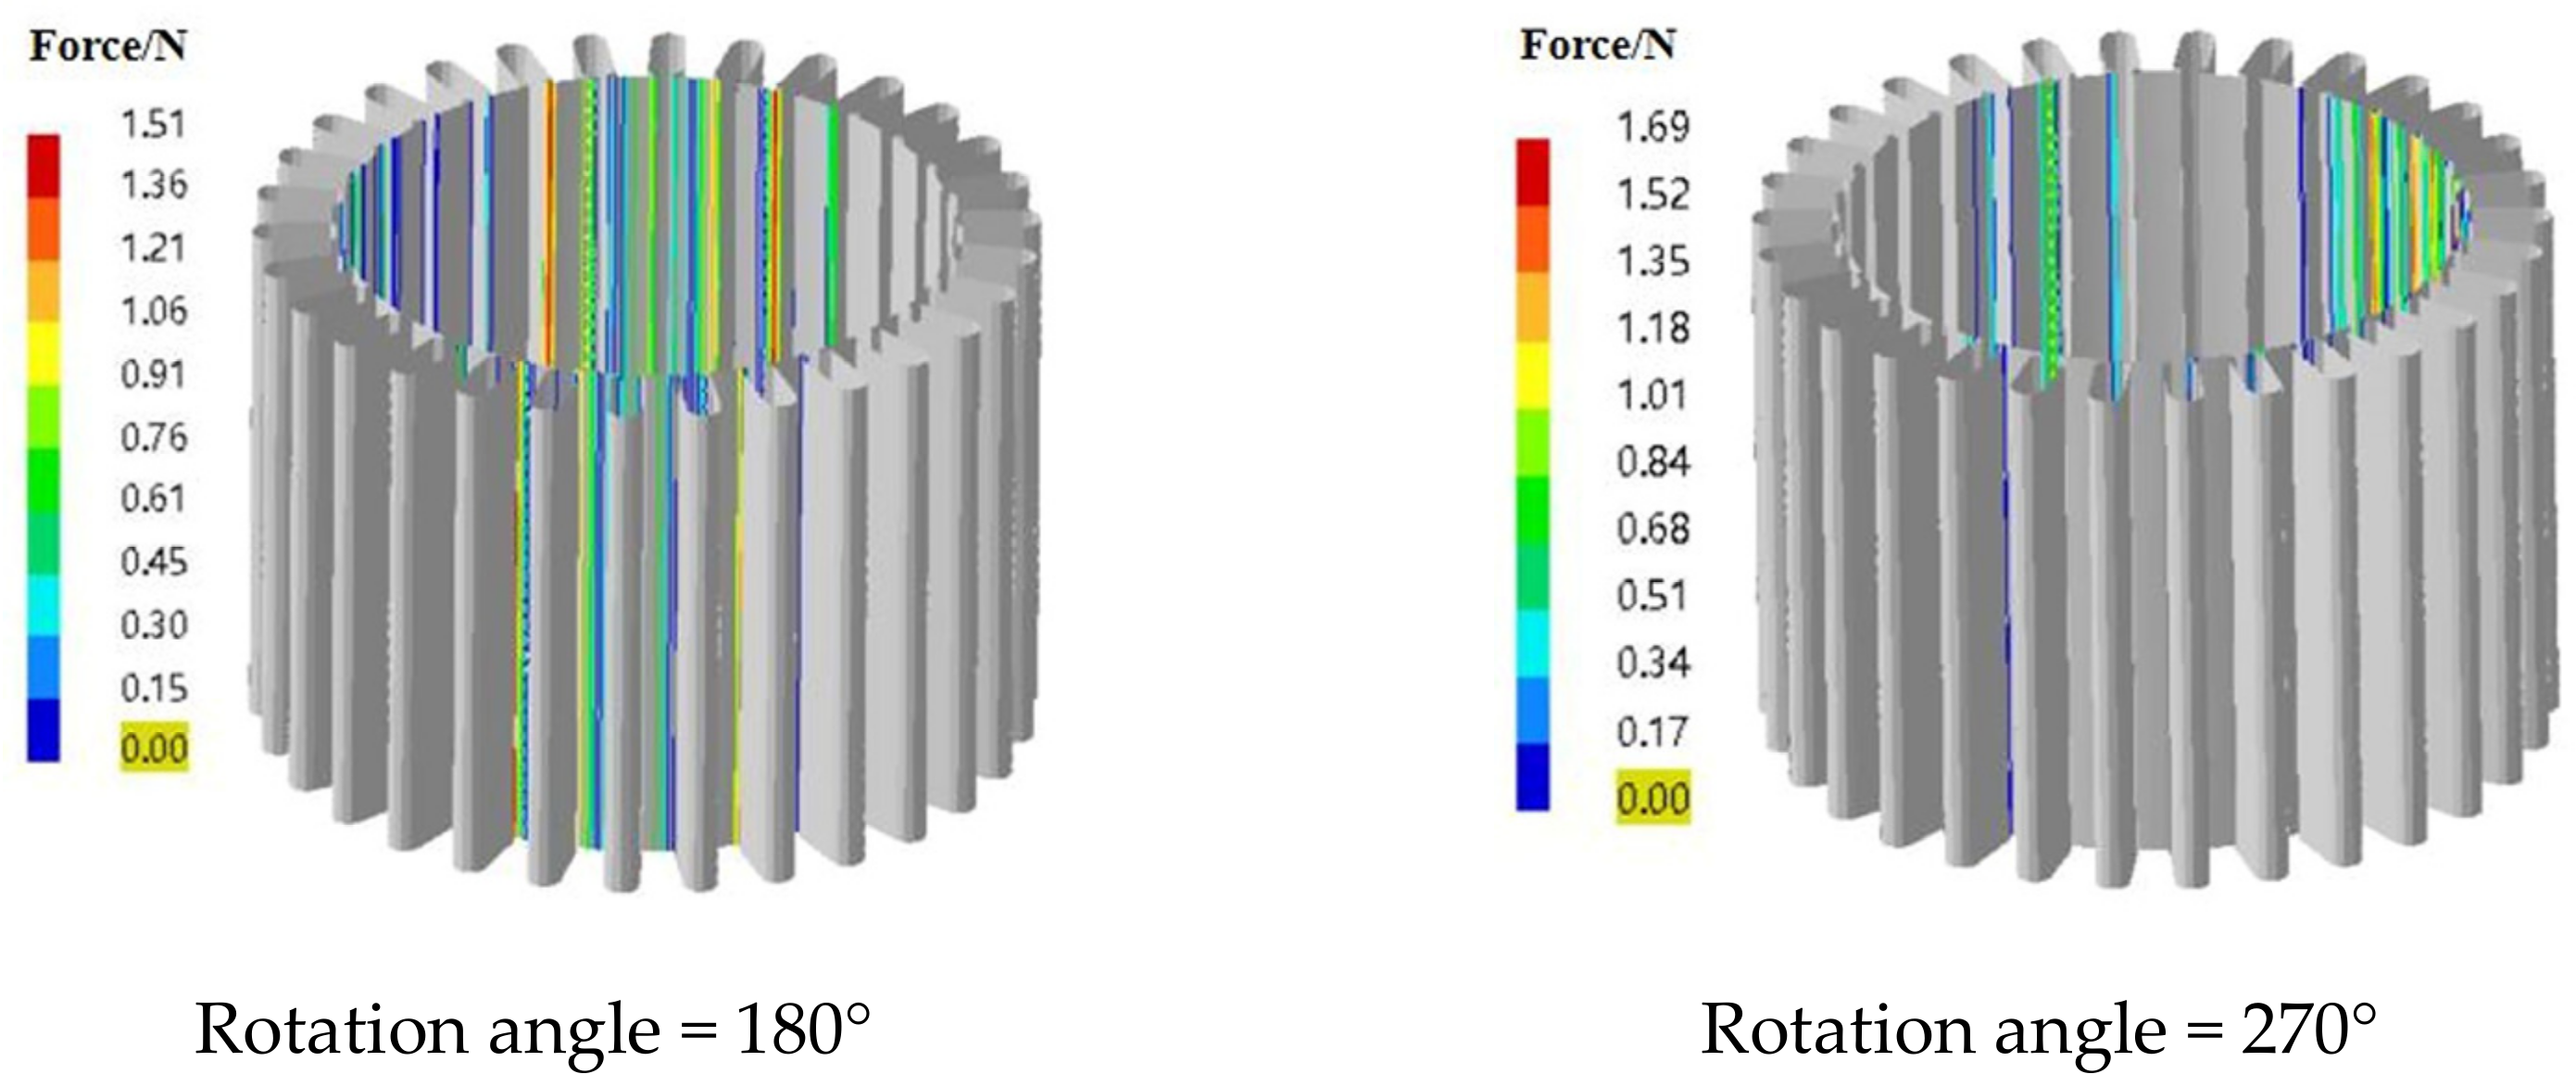
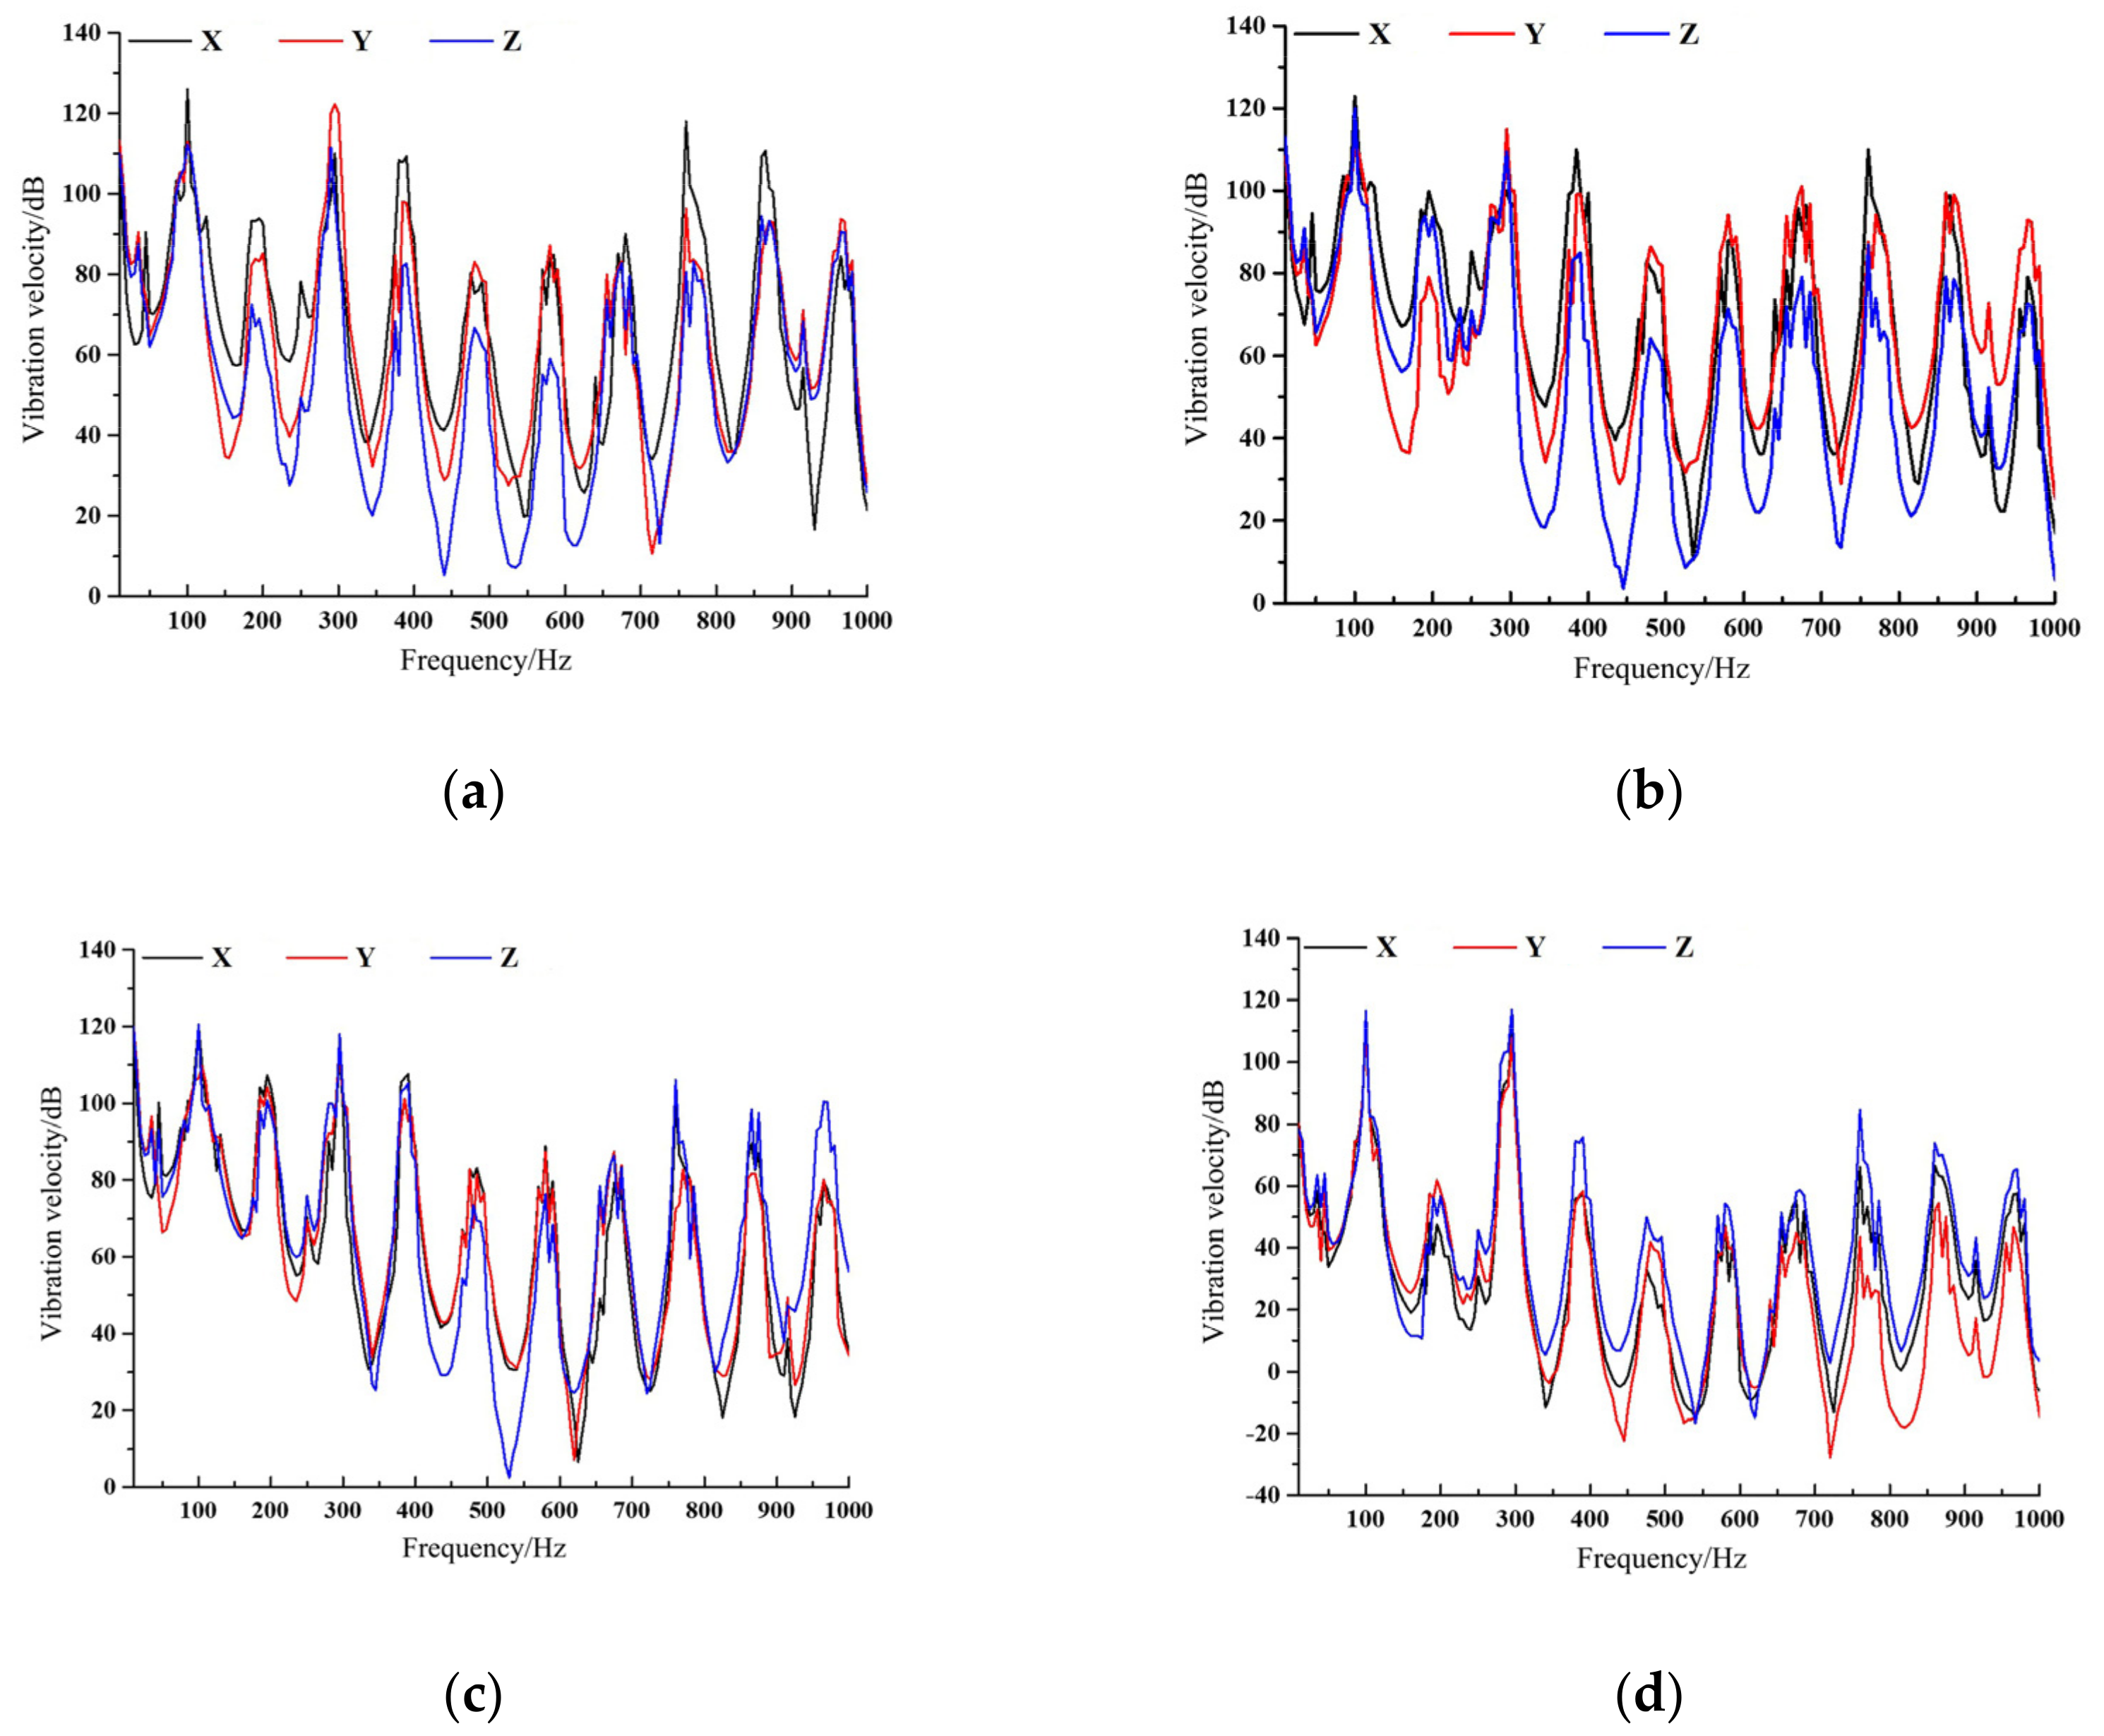
3.3.3. Electromagnetic Excitation-Induced Vibration Analysis

Radial electromagnetic force produced by the interaction between the stator and rotor in a motor can cause vibration of the marine pump unit. Figure 18 shows the vibration spectrum of each measuring point of the pump unit under radial electromagnetic force. It can be seen from Figure 18a–d that the vibration law of the pump unit caused by electromagnetic excitation was completely different from that caused by fluid excitation. Under the action of electromagnetic force, the main frequency of the vibration of each measuring point was at the 2× utility frequency (100 Hz), which conformed to the law of rotor vibration caused by electromagnetic force in general. There were many obvious peaks in the frequency domain of the vibration of the pump unit caused by electromagnetic excitation. The frequencies corresponding to these peaks were the natural frequencies of the marine pump structure, indicating that the structure of the marine pump unit was greatly affected by electromagnetic excitation, and there would be obvious peaks under multiple natural frequencies. It can be seen from Figure 18 that the vibration velocity level at the seventh natural frequency (295 Hz) had the largest amplitude compared with the other natural frequencies. Furthermore, the amplitude of the vibration at the seventh natural frequency is the largest at the base position, which is basically the same as the vibration amplitude at the 2× utility frequency.
In addition, it can be seen from Figure 18 that the vibration of the pump unit caused by electromagnetic excitation inside the motor showed obvious periodicity. Moreover, the amplitude change was very large; the minimum vibration velocity level at the base position was about −30 dB, which is already lower than the reference vibration level, and the maximum was about 117 dB.

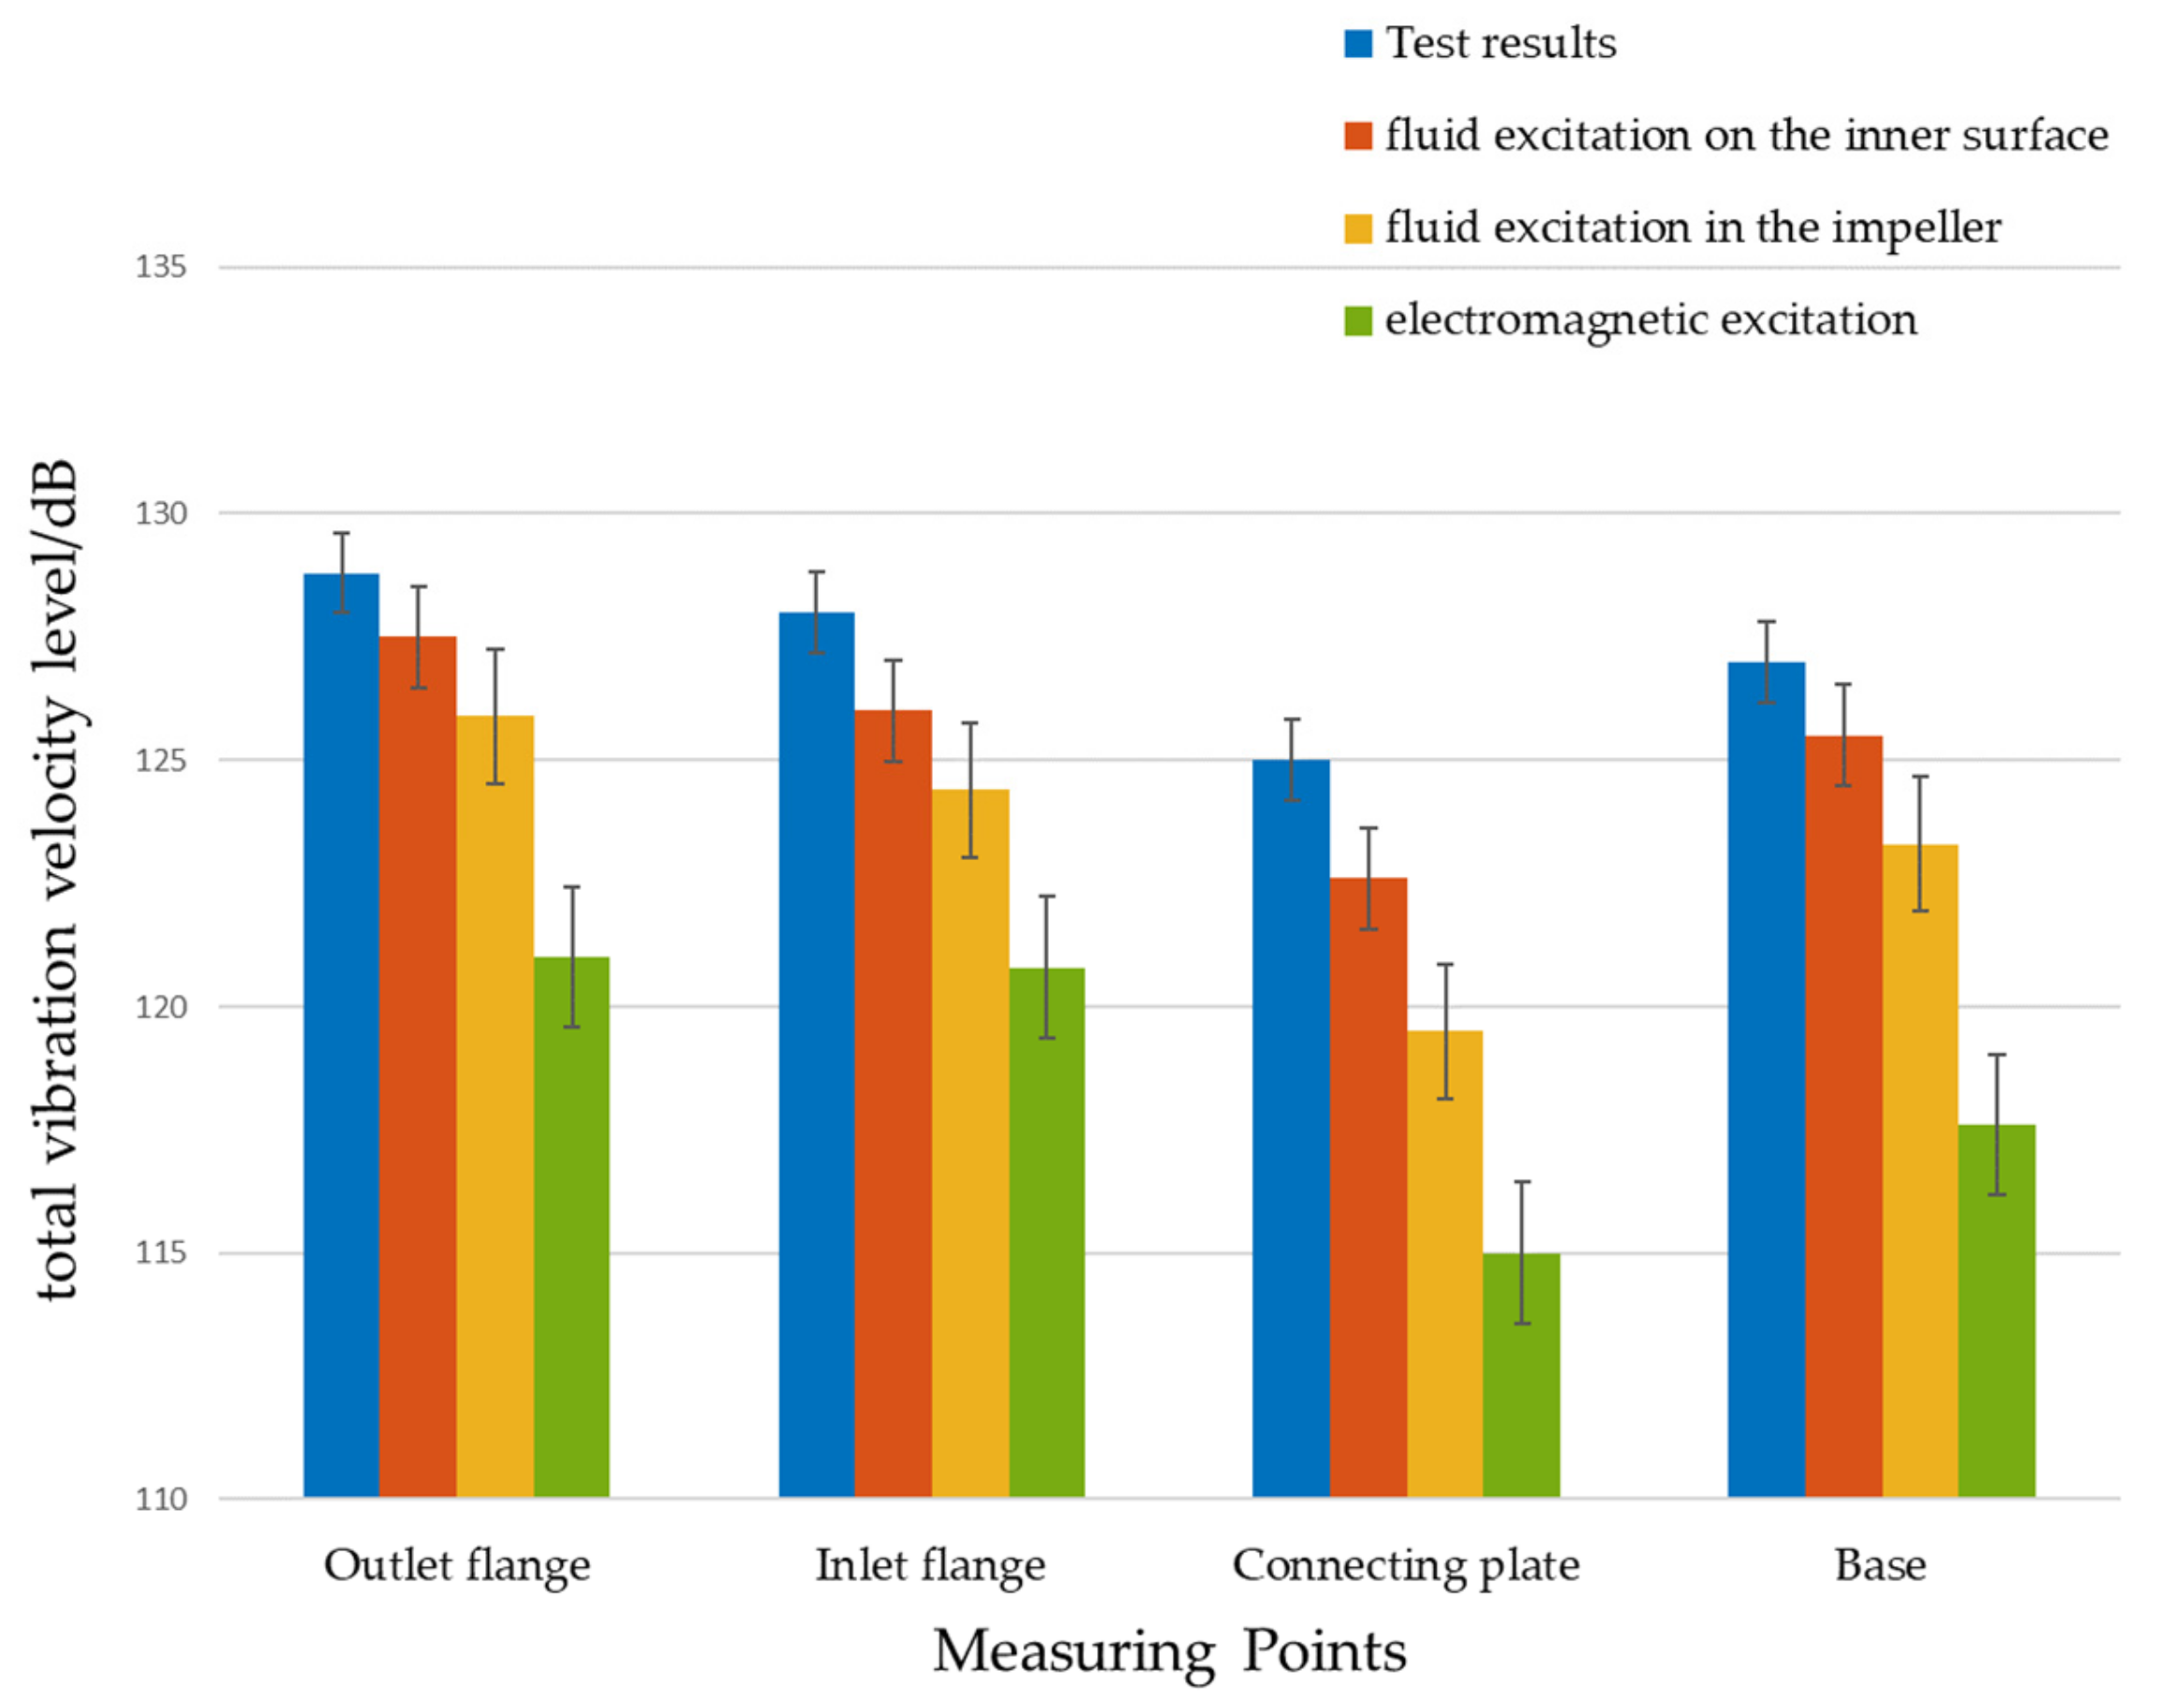
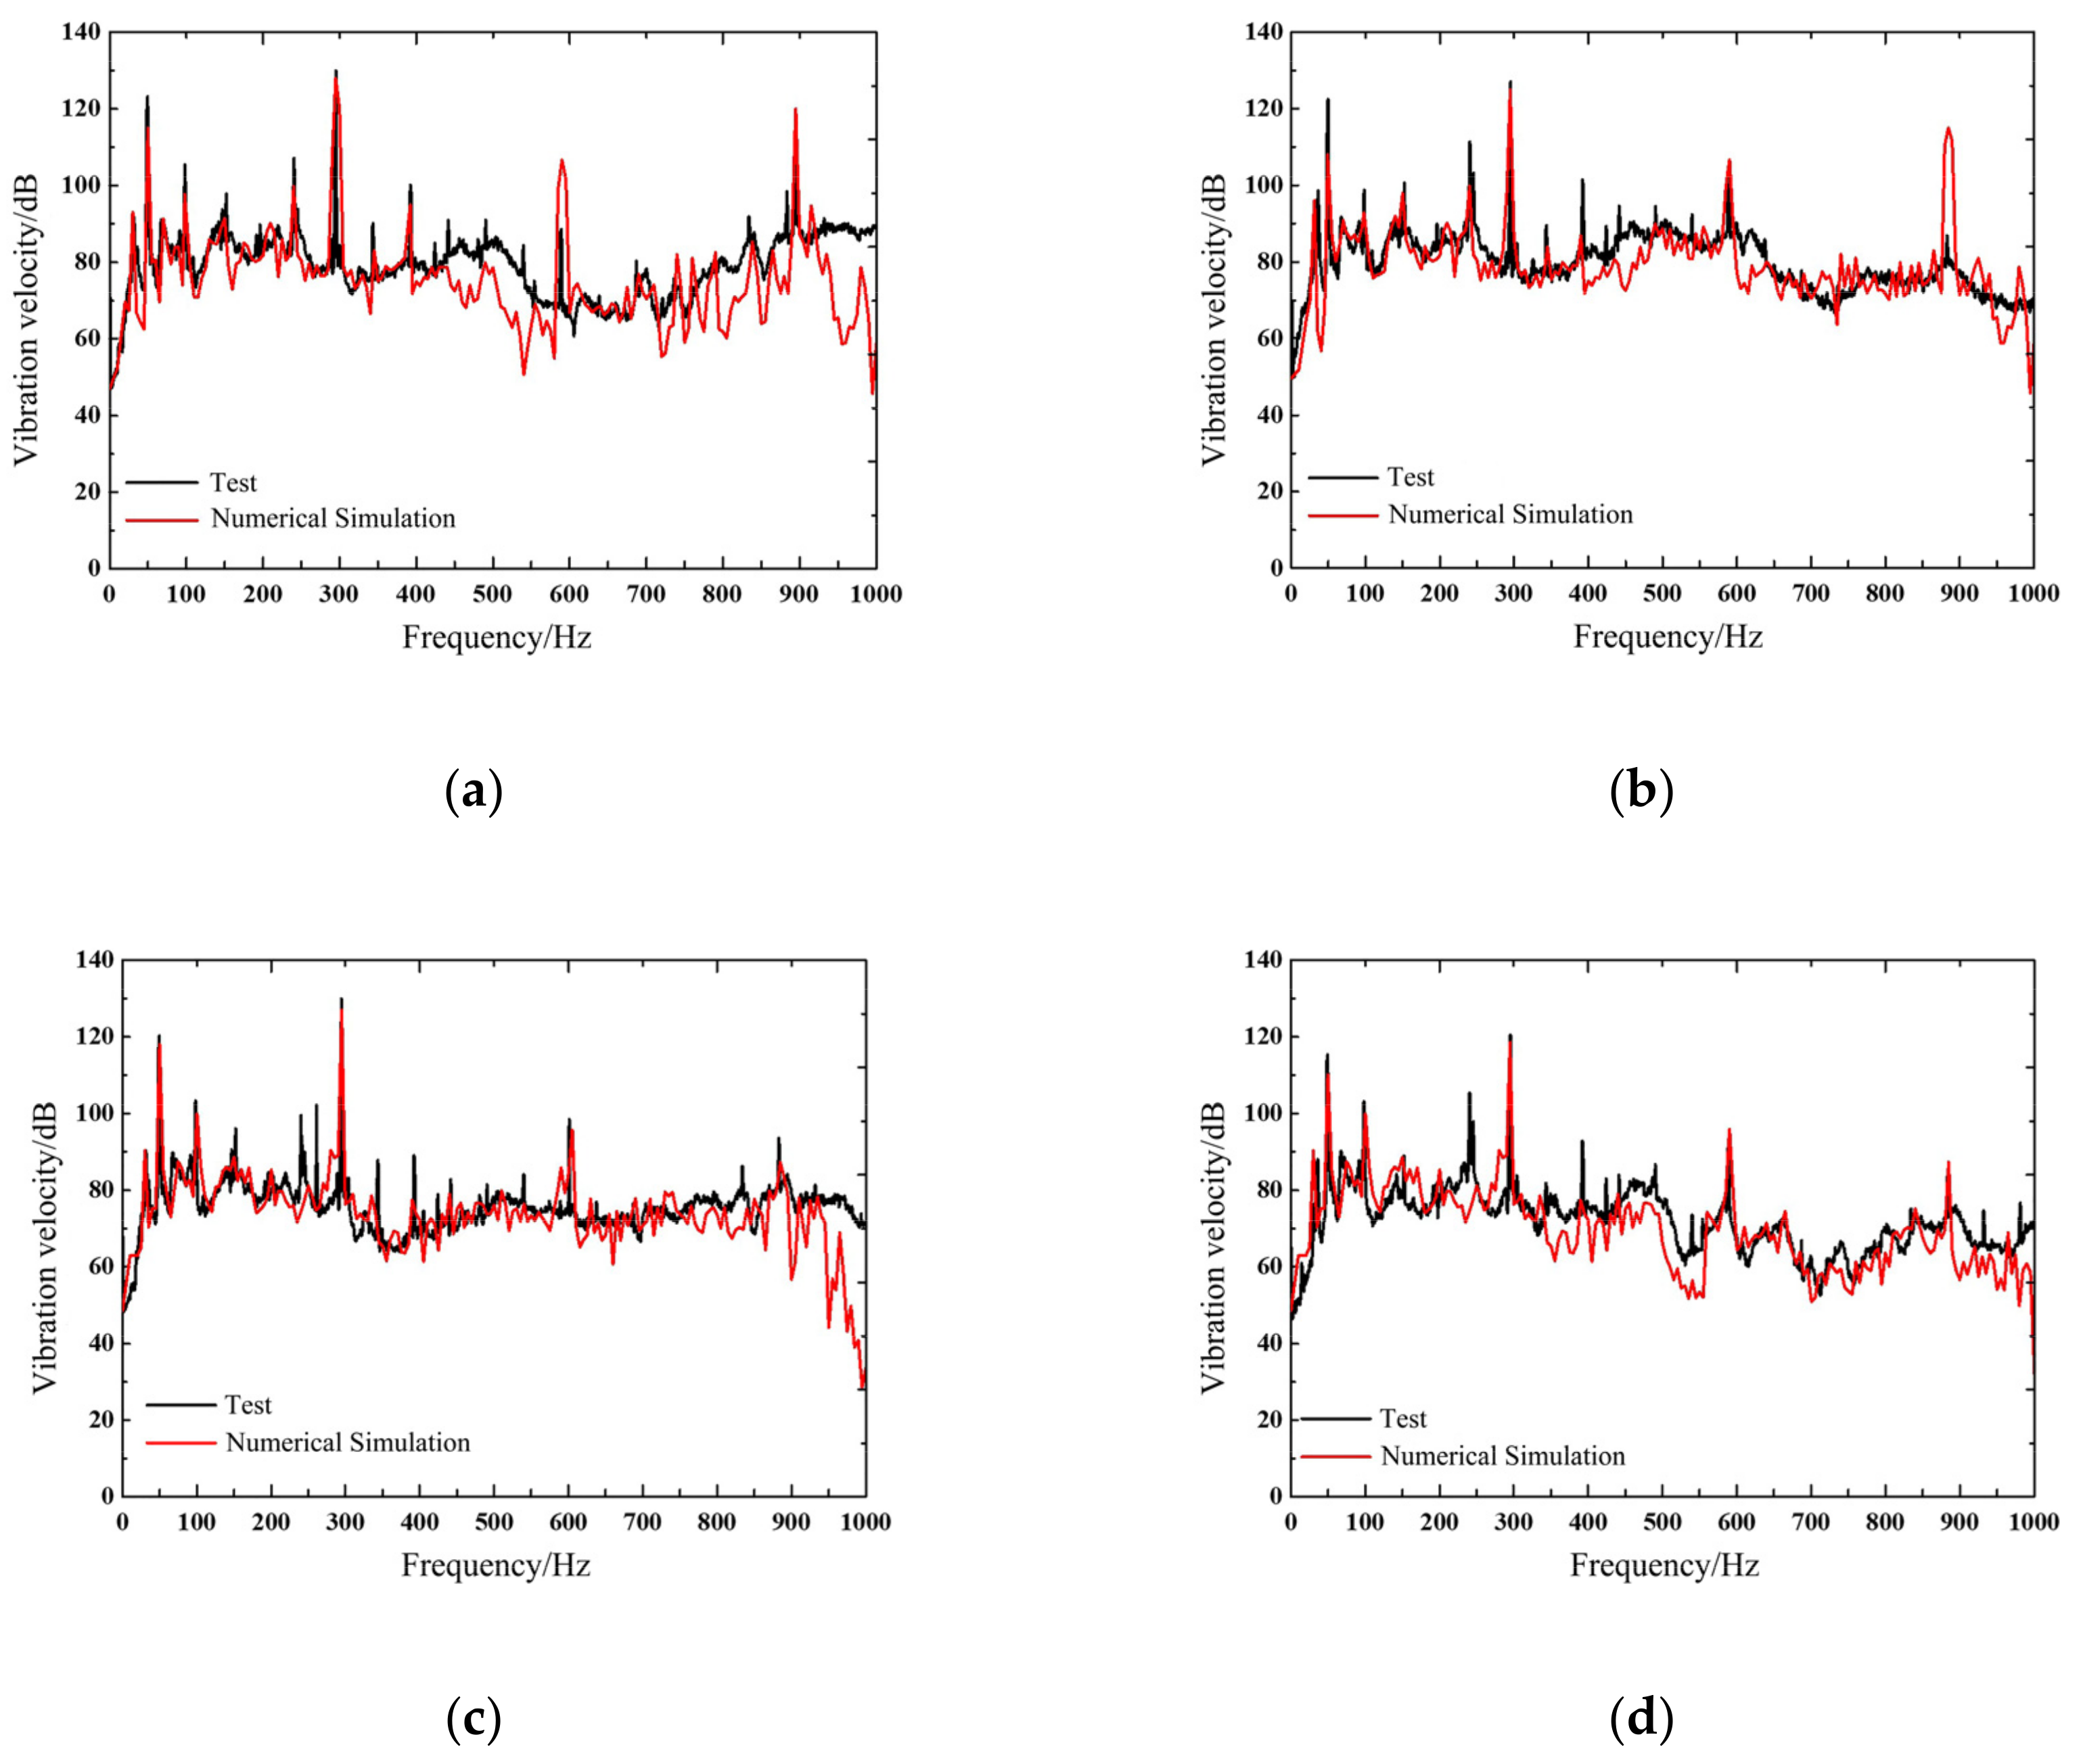
3.4. Comparison of Numerical Simulation and Test Results

In order to intuitively compare the contribution of pump unit vibration caused by different excitation sources, the total vibration velocity level was used to evaluate it in this paper. Chen [27] used the total vibration level evaluation method to analyze the vibration of ships with different structures through experiments and simulations, and he effectively obtained the optimal hull structure model. Liu [28] studied the vibration characteristics of a centrifugal pump. The vibration of centrifugal pump unit caused by the change of speed and flow rate was evaluated by the total vibration level evaluation method. The results showed that the total vibration level evaluation method can better reflect the vibration variation law of centrifugal pump unit.
The vibration acceleration level (Lva) is widely used in the vibration analysis of cars, tracks, bridges, etc. According to the principle of energy superposition, Jiang [29] carried out a superposition calculation of vibration acceleration and obtained the calculation method of total vibration acceleration level (Lvat). By referring to Jiang’s method, the vibration velocity was calculated by superposition in this paper. The total vibration velocity level evaluation method can evaluate the overall impact of multiple vibration sources on a measuring point. The vibration caused by different excitation sources may affect the marine centrifugal pump in different directions or in different frequency bands. The total vibration velocity level evaluation method was used to superposition the measured vibration energy in three directions of each vibration measuring point of the marine centrifugal pump unit in this paper. The overall vibration of the marine centrifugal pump unit was evaluated effectively. The total vibration velocity level in decibels (dB) was calculated as follows:
VaL total   = 10 log 10 ( 10 V a L 1 10 + + 10 V a L 2 10 + 10 V a L 3 10 ) ,
where VaL1, VaL2, and VaL3 are the vibration levels in three directions perpendicular to each other at the monitoring point.
Figure 19 shows the changes at each measuring point of the marine pump unit vibration caused by different excitation sources. In addition, Table 4 shows the total vibration velocity level results obtained by simulation and test for each measuring point.
By comparing the total vibration velocity level of different excitation sources at each measuring point, it can be seen that the vibration of the fluid excitation on the inner surface of the pump was the highest at each measuring point, followed by the electromagnetic excitation, and the lowest contributor was the fluid excitation in the impeller. This shows that the fluid excitation on the inner surface of the marine pump is the most important factor leading to the vibration of the pump unit. The numerical simulation result of the fluid excitation on the inner surface of the pump was closest to the test value at the measuring point of the pump base, where the difference was only 0.2 dB. This shows that the fluid excitation on the inner surface of the pump has a greater contribution to the vibration of the base position, which can more accurately reflect the real vibration of the base position of the marine pump unit. Since the impeller vibration caused by fluid excitation is first transmitted to the bearing through the rotor, and then to the pump body through the bearing seat, the contribution of fluid excitation in the impeller to the vibration of the marine pump unit is small. The vibration generated by electromagnetic excitation is also transmitted to the pump body through the rotor and bearing seat. Because the energy of electromagnetic excitation is consumed in the process of transmission, the contribution of electromagnetic excitation to the vibration of the marine pump unit is small.
The fluid excitation force on the inner surface of the pump is greater than the electromagnetic excitation and the fluid excitation in the impeller. In addition, the fluid excitation on the inner surface directly acts on the pump body; thus, the pump unit is most affected by the pump inner surface fluid excitation. This shows that fluid excitation on the inner surface of the pump can describe the vibration of the pump unit more accurately than electromagnetic excitation and impeller fluid excitation.
In addition, it can be seen from Figure 19 that the vibration level of the base position was the lowest because the base measuring point was far away from the three excitation sources and the base was rigidly constrained by bolts. Since the import and export flanges were closest to the incentive source, they were most affected by the incentive source. The influence of all excitation sources on different measuring points was in the following order: outlet flange > import flange > connecting plate > base.
Through the above analysis, it can be seen that the fluid excitation on the inner surface of the pump was the main reason for the vibration of the marine pump unit. The vibration generated by fluid excitation on the inner surface of the pump was compared with the test value, as shown in Figure 20.
It can be seen from Figure 20 that the numerical simulation results of different measuring points were relatively close to the test results. The numerical simulation results could reflect the real operation state of the equipment in the low-frequency band and at each characteristic frequency. Both the numerical simulation results and the test results showed that the main frequency of the vibration of the marine pump unit was the 1× blade passing frequency. In the numerical simulation results, the vibration spectrum at the inlet and outlet flanges showed a high peak at the 3× blade passing frequency. However, the test results were quite different from the numerical simulation results for frequencies greater than 900 Hz, which shows that fluid excitation in the pump mainly affects the low-frequency vibration of the marine pump unit. In addition, since the finite element method has a better ability to express the characteristics of the low-frequency band, the numerical simulation values of vibration in the high-frequency band were different from the test values.

4. Conclusions

In order to explore the contribution of different excitation sources to the vibration of the marine centrifugal pump unit, a marine centrifugal pump with a specific speed of 66.7 was studied in this paper. The numerical calculation method was used to analyze the vibration characteristics of the marine centrifugal pump caused by fluid excitation and electromagnetic excitation, and the numerical calculation results were compared with the test results. The conclusions were as follows:
(1) The pressure pulsation in the volute of marine centrifugal pump showed obvious periodicity. The main frequency of pump unit vibration caused by pressure pulsation was at the 1× blade passing frequency, and obvious peaks also appeared in multiples of the 1× blade passing frequency. As the distance between the monitoring point and the tongue increased, the main frequency amplitude of the pressure pulsation at each measuring point showed a downward trend. In addition, the force of the fluid acting on the impeller also showed obvious periodicity. The main frequency of the radial vibration of the impeller was at the 1× shaft frequency, and other characteristic frequencies were distributed at multiples of the 1× shaft frequency. The main frequency of axial vibration was at the 2× shaft frequency.
(2) The main frequency of vibration caused by fluid excitation on the inner surface of the pump was at the 1× blade passing frequency. Moreover, other characteristic frequencies appeared at the 1× shaft frequency and at multiples of the 1× blade frequency. The main frequency of vibration caused by electromagnetic excitation was at the 2× utility frequency. In addition, because the marine pump unit was greatly affected by the structural natural frequency, there were obvious peaks at each natural frequency.
(3) The numerical calculation results were compared with the test results in this paper. The contribution of pump unit vibration caused by different excitation sources to the total vibration of the marine centrifugal pump unit was in the following order: fluid excitation on the inner surface of the pump > electromagnetic excitation > fluid excitation in the impeller. The maximum difference between the total vibration velocity level caused by the fluid excitation on the inner surface of the pump at each measuring point and the test value was less than 1.5%. The maximum difference between the test and the electromagnetic excitation was about 2.5%, and the maximum difference between the test and the fluid excitation in the impeller was greater than 4.5%. The fluid excitation on the inner surface of the pump could more accurately describe the actual operating characteristics of the marine centrifugal pump, especially at the base position. In addition, the fluid excitation on the inner surface of the pump had a better ability to express the low-frequency vibration characteristics of the marine pump unit. The impact of all excitation sources on different positions of the pump unit was in the following order: outlet flange > import flange > connecting plate > base.
Due to the huge amount of calculation and the lack of calculation methods, it is difficult to calculate the overall vibration of the pump unit combined with fluid excitation and electromagnetic excitation. How to reduce the computational complexity and how to establish a more accurate calculation method will be the future research direction of vibration analysis of marine centrifugal pumps.

Author Contributions

Conceptualization, C.D. and H.L.; writing—original draft preparation, Y.Z.; writing—review and editing, C.D. and L.D.; numerical calculation and experiment, C.D. and Q.P. All authors have read and agreed to the published version of the manuscript.

Funding

This research was funded by the National Natural Science Foundation of China (51879122, 51579117, 51779106), the National Key Research and Development Program of China (2016YFB0200901, 2017YFC0804107), the Zhenjiang Key Research and Development Plan (GY2017001, GY2018025), the Open Research Subject of Key Laboratory of Fluid and Power Machinery, Ministry of Education, Xihua University (szjj2017-094, szjj2016-068), the Sichuan Provincial Key Lab of Process Equipment and Control (GK201614, GK201816), the Jiangsu University Young Talent Training Program—Outstanding Young Backbone Teacher, Program Development of Jiangsu Higher Education Institutions (PAPD), and the Jiangsu Top Six Talent Summit Project (GDZB-017).

Conflicts of Interest

The authors declare no conflict of interest.

References

  1. Liu, H.-M.; Liu, Y. Research Status and Developing Tendency of Malfunction Diagnosis in Centrifugal Pumps. Agric. Sci. Technol. Equip. 2019, 1, 70–74, 77. [Google Scholar]
  2. Zhao, Y.-Q. Research on Cavitation Diagnosis and Its Characteristics of Flow Field and Acoustic Field in Centrifugal Pump. Master’s Thesis, Jiangsu University, Zhen Jiang, China, 2018. [Google Scholar]
  3. Duan, X.-H.; Tang, F.-P.; Duan, W.-Y.; Zhou, W.; Shi, L.-J. Experimental investigation on the correlation of pressure pulsation and vibration of axial flow pump. Adv. Mech. Eng. 2019, 11, 168781401988947. [Google Scholar] [CrossRef] [Green Version]
  4. Zhao, W.-Y.; Bai, S.-B.; Ma, P.-F. Vibration of Rotor in Centrifugal Pump Status and Prospects. Fluid Mach. 2011, 3, 37–39. [Google Scholar]
  5. Ren, Y.-X.; Chen, H.-X. Introduction. In Fundamentals of Computational Fluid Dynamics; Liu, J.-L., Song, Y.-Q., Eds.; Tsinghua University Press: Beijing, China, 2006; pp. 5–6. [Google Scholar]
  6. Zhou, Y.-L. Analysis on Pressure Fluctuation and Vibration of a Centrifugal Pump for Off-design Conditions. Fluid Mach. 2015, 2, 52–55. [Google Scholar]
  7. Lucius, A.; Brenner, G. Unsteady CFD simulations of a pump in part load conditions using scale-adaptive simulation. Int. J. Heat Fluid Flow 2010, 31, 1113–1118. [Google Scholar] [CrossRef]
  8. Park, S.H.; Morrison, G.L. Centrifugal pump pressure pulsation prediction accuracy dependence upon CFD models and boundary conditions. In Proceedings of the ASME 2009 Fluids Engineering Division Summer Meeting, Vail, CO, USA, 2–6 August 2009; pp. 207–220. [Google Scholar]
  9. Wang, Y. Research on Cavitation and Its Induced Vibration and Noise in Centrifugal Pimps. Ph.D. Thesis, Jiangsu University, Zhen Jiang, China, 2011. [Google Scholar]
  10. Wang, Y.; Dai, C. Analysis on Pressure Fluctuation of Unsteady Flow in a Centrifugal Pump. Trans. Chin. Soc. Agric. Mach. 2010, 41, 91–95. [Google Scholar]
  11. Jin, Y.-B.; Dong, K.-Y.; Yu, J.; Wu, X.-R. Research progress of centrifugal pump fluid-induced vibration. Pump Technol. 2015, 3, 1–5. [Google Scholar]
  12. Ye, J.-P. Research on Optimization of Vibration and Structural Noise of Centrifugal Pump. Master’s Thesis, Wuhan University of Technology, Wuhan, China, 2006. [Google Scholar]
  13. Jiang, Y.-Y.; Yoshimura, S.; Imai, R.; Katsura, H.; Yoshida, T.; Kato, C. Quantitative evaluation of flow-induced structural vibration and noise in turbomachinery by full-scale weakly coupled simulation. J. Fluids Struct. 2007, 23, 531–544. [Google Scholar] [CrossRef]
  14. Wang, Y.; Luo, K.-K.; Wang, K.; Liu, H.-L.; Li, Y.; He, X.-H. Research on pressure fluctuation characteristics of a centrifugal pump with guide vane. J. Vibroeng. 2017, 19, 5482–5497. [Google Scholar] [CrossRef]
  15. He, T.; Yi, Z.-Y.; Sun, Y.-D. Numerical analysis for flow induced vibration of a centrifugal pump. J. Vib. Shock. 2012, 31, 96–102. [Google Scholar]
  16. Jiang, A.-H.; Li, G.-P.; Zhou, P.; Zhang, Y. Vibration incited by fluid forces on centrifugal pump from volute path and impeller path. J. Vib. Shock. 2014, 33, 1–7. [Google Scholar]
  17. Luo, B.; Wang, C.-L.; Xia, Y.; Ye, J.; Yang, X.-Y. Numerical simulation of flow-induced vibration of double-suction centrifugal pump as turbine. J. Drain. Irrig. Mach. Eng. 2019, 37, 313–318. [Google Scholar]
  18. Yao, T.-T.; Zheng, Y. Finite element analysis of stress, deformation and modal of head cover in axial-flow hydro-turbine. J. Drain. Irrig. Mach. Eng. 2020, 38, 39–44. [Google Scholar]
  19. Pei, J. Investigations on Fluid-Structure Interaction of Unsteady Flow-Induced Vibration and Flow Unsteadiness Intensity of Centrifugal Pumps. Ph.D. Thesis, Jiangsu University, Zhen Jiang, China, 2013. [Google Scholar]
  20. Zhang, D.-S.; Zhang, L.; Shi, W.-D.; Chen, B.; Zhang, H. Optimization of Vibration Characteristics for Centrifugal Pump Volute Based on Fluid-structure Interaction. Trans. Chin. Soc. Agric. Mach. 2013, 44, 40–45. [Google Scholar]
  21. Guo, W.-J. Analysis of Unsteady Flow and Vibration Characteristics of Low Specific Speed Centrifugal Pump Based on Two-way Fluid-Structure Interaction. Master’s Thesis, Zhejiang Sci-Tech University, Hang Zhou, China, 2017. [Google Scholar]
  22. El-Gazzar, D.M. Finite element analysis for structural modification and control resonance of a vertical pump. Alex. Eng. J. 2017, 56, 695–707. [Google Scholar] [CrossRef]
  23. Bae, D.-M.; QI, D.L.; Cao, B.; Cuo, W. A study on the method vibration analysis of marine pump. J. Korean Soc. Fish. Ocean. Technol. 2015, 51, 279–284. [Google Scholar] [CrossRef]
  24. Wu, J.-H.; He, T.; Yi, Z.-Y. FEM/BEM analysis for flow induced noise and vibration of a centrifugal pump. Ship Sci. Technol. 2016, 38, 49–55. [Google Scholar]
  25. Jiang, Y.; Zhao, J.-T. Reduce vibration measures for ship centrifugal pump based on modal analysis and CFD simulation. Ship Sci. Technol. 2012, 34, 109–114. [Google Scholar]
  26. Choi, B.K. Abnormal Vibration Diagnosis of High Pressure LNG Pump. J. Power Syst. Eng. 2005, 2, 45–49. [Google Scholar]
  27. Chen, W. Numerical Simulation an Experimental Study on Damping Vibration of Ships. Master’s Thesis, Shanghai Jiao Tong University, Shanghai, China, 2019. [Google Scholar]
  28. Liu, Z.; Li, B.; Ma, Q.-N.; Zhu, D.-P. Experiment on vibration characteristics of centrifugal pump with high head. J. Drain. Irrig. Mach. Eng. 2013, 31, 938–942. [Google Scholar]
  29. Jiang, T. Vibration Level Evaluation of the Environmental Vibration Affected by Multi-vibration Sources. Urban Mass Transit 2010, 13, 26–29. [Google Scholar]
Figure 1. Numerical calculation model of fluid in a marine centrifugal pump.
Jmse 09 00274 g001
Figure 2. y+ distribution of the volute, pump chamber, and impeller: (a) static domain; (b) moving domain.
Jmse 09 00274 g002
Figure 3. Electromagnetic field calculation model.
Jmse 09 00274 g003
Figure 4. The three-dimensional (3D) model of the pump unit: (a) pump unit structure; (b) rotor system.
Jmse 09 00274 g004
Figure 5. Finite element model of pump unit: (a) pump unit structure; (b) rotor system.
Jmse 09 00274 g005
Figure 6. The natural frequency of the pump unit.
Jmse 09 00274 g006
Figure 7. Vibration measuring point location.
Jmse 09 00274 g007
Figure 8. External characteristic curve of numerical simulation and test.
Jmse 09 00274 g008
Figure 9. Location of pressure pulsation monitoring point on the volute wall.
Jmse 09 00274 g009
Figure 10. Time-domain and frequency-domain changes of pressure pulsation at each monitoring point: (a) time-domain characteristics; (b) frequency-domain characteristics.
Jmse 09 00274 g010
Figure 11. The radial force on each part of the impeller in the time domain and frequency domain: (a) time domain (X); (b) frequency domain (X); (c) time domain (Y); (d) frequency domain (Y); (e) time domain (Z); (f) frequency domain (Z).
Jmse 09 00274 g011aJmse 09 00274 g011b
Figure 12. The distribution nephogram of magnetic lines during normal operation of the motor.
Jmse 09 00274 g012
Figure 13. The distribution nephogram of flux density during normal operation of the motor.
Jmse 09 00274 g013
Figure 14. The distribution nephogram of electromagnetic force on the surface of the stator slot at different rotation angles.
Jmse 09 00274 g014aJmse 09 00274 g014b
Figure 15. The position of each vibration measuring point of the pump unit.
Jmse 09 00274 g015
Figure 16. The frequency spectrum of the vibration of the pump unit caused by fluid excitation on the inner surface of the pump: (a) export flange; (b) import flange; (c) connecting plate; (d) base.
Jmse 09 00274 g016
Figure 17. The frequency spectrum of the vibration of the pump unit caused by fluid excitation in impeller: (a) export flange; (b) import flange; (c) connecting plate; (d) base.
Jmse 09 00274 g017
Figure 18. The frequency spectrum of the vibration of the pump unit caused by electromagnetic excitation: (a) export flange; (b) import flange; (c) connecting plate; (d) base.
Jmse 09 00274 g018
Figure 19. The total vibration velocity level caused by different excitation sources at each measuring point.
Jmse 09 00274 g019
Figure 20. Comparison of the vibration generated by the fluid on the inner surface of the pump and the vibration obtained in the test: (a) export flange; (b) import flange; (c) connecting plate; (d) base.
Jmse 09 00274 g020
Table 1. Main structural parameters of marine pump.
ComponentsGeometric ParametersSymbolValue
ImpellerInlet diameter (mm)D165
Exit diameter (mm)D2165
Exit width (mm)b27
Blade wrap angle (°)φ110
Blade numbersz6
VoluteBasic circle diameter (mm)D3170
Inlet width (mm)b320
Exit diameter (mm)Dd50
Table 2. Scheme of mesh-dependence test.
SchemeNumber of GridsNumber of NodesHead (m)
11,647,1571,474,14834.5
22,457,8492,287,41435.2
32,914,9792,741,94335.5
43,278,4583,024,78535.5
53,715,7563,546,85435.6
Table 3. Geometric parameters of the motor.
Voltage (V)380Pole Number2
Rated speed (rpm)2950Phase number3
Frequency (Hz)50Connection methodDelta connection
Stator outer diameter (mm)210Stator inner diameter (mm)116
Rotor outer diameter (mm)114Rotor inner diameter
(mm)
74
Stator slot number30Rotor slot number26
Table 4. The value of total vibration velocity level of different measuring points obtained by simulation and test.
Measuring PointTest Results (dB)Fluid Excitation on the Inner Surface (dB)Fluid Excitation in the Impeller (dB)Electromagnetic Excitation (dB)
Outlet flange128.8128125127
Inlet flange127.5126122.6125.5
Connecting plate125.9124.4119.5123.3
Base121120.8115117.6
Publisher’s Note: MDPI stays neutral with regard to jurisdictional claims in published maps and institutional affiliations.

