
Using Drones to Measure Jellyfish Density in Shallow Estuaries


1
Department of Biology, University of Southern Denmark, Hindsholmvej 11, 5300 Kerteminde, Denmark
2
Peuplements Végétaux et Bioagresseurs en Milieu Tropical, Université de La Réunion-Cirad, 15 Avenue René Cassin—CS 92003, CEDEX 9, 97744 Saint Denis, France
*
Author to whom correspondence should be addressed.
J. Mar. Sci. Eng. 2021, 9(6), 659; https://0-doi-org.brum.beds.ac.uk/10.3390/jmse9060659
Submission received: 25 May 2021
/
Revised: 10 June 2021
/
Accepted: 12 June 2021
/
Published: 14 June 2021
(This article belongs to the Section Marine Environmental Science)
Abstract
:Understanding jellyfish ecology and roles in coastal ecosystems is challenging due to their patchy distribution. While standard net sampling or manned aircraft surveys are inefficient, Unmanned Aerial Vehicles (UAVs) or drones represent a promising alternative for data collection. In this technical report, we used pictures taken from a small drone to estimate the density of Aurelia sp. in a shallow fjord with a narrow entrance, where the population dynamic is well-known. We investigated the ability of an image processing software to count small and translucent jellyfish from the drone pictures at three locations with different environmental conditions (sun glare, waves or seagrass). Densities of Aurelia sp. estimated from semiautomated and manual counts from drone images were similar to densities estimated by netting. The semiautomated program was able to highlight the medusae from the background in order to discard false detections of items unlikely to be jellyfish. In spite of this, some objects (e.g., seagrass) were hardly distinguishable from jellyfish and resulted in a small number of false positives. This report presents a preview of the possible applications of drones to observe small and fragile jellyfishes, for which in situ sampling remains delicate. Drones may represent a noninvasive approach to monitoring jellyfish abundance over time, enabling the collection of a large amount of data in a short time. Software development may be useful for automatically measuring jellyfish size and even population biomass.
1. Introduction
Jellyfish (JF) blooms are reported more frequently and are often linked to human-induced environmental changes ([1,2], but see [3]). The blooms are considered to be destructive to ocean ecosystems, leading to complaints ranging from interfering with recreationists in coastal areas to outcompeting commercially important fish stock [4]. Jellyfish have been studied for years for their important ecological role and impact on marine ecosystem processes [5,6], as populations can rapidly grow to large aggregations and form seasonal blooms [7]. Jellyfish blooms can have a significant impact on zooplankton abundance and thereby influence the entire ecosystem of a region [8,9,10]. To understand the dynamics of jellyfish populations, it is crucial to describe their spatiotemporal variability, as well as to measure the biomass and density of different species. Besides observation from boats or from the shore (e.g., [11,12]), nets have been conventionally used in long-term studies to obtain consistent estimations of jellyfish biomass and abundance (e.g., [13,14]).
In spite of these aspects, nets remain invasive for the animals and are not giving reliable data for species with a low abundance or extended and patchy distributions. Recent studies use acoustics to estimate the abundance and spatial distribution of jellyfish (e.g., [15,16,17,18]). Acoustics can be coupled with video recordings using remotely operated vehicles [16] or advanced cameras [19,20] that provide high-quality underwater images of pelagic organisms. These approaches appear complementary to conventional nets, enabling observations of jellyfish distribution in all spatial dimensions. Furthermore, a few studies experimented with aerial surveys by small aircrafts to estimate the relative abundance of jellyfish [21] or locate and count aggregations [22,23,24]. Although manned aircraft or fixed-wing unmanned aerial systems (UASs) are more operable for surveying large areas, they remain expensive and constraining to deploy, thus limiting the accessibility for research.
Unmanned Aerial Vehicles (UAVs) or drones are devices remotely controlled by the pilot. The use of drones in research is increasing, with many applications in marine science and conservation. Drones can help to study the behavior of marine vertebrates, estimate population parameters or assess habitat perturbation for conservation purposes. All in all, drones can rapidly collect high-resolution data for a large range of species and ecosystems. To this date, however, only few studies have used drones to study jellyfish. The purpose of these studies was to test an alternative method for estimating population parameters during jellyfish blooms. The capabilities of drones to remain stationary while flying enabled high-resolution photogrammetry in order to measure the spatial extent of aggregations or estimate densities and size-frequency distributions of jellyfish [25,26] that could be used for the monitoring of fisheries [27]. The biomass of jellyfish can also be assessed from drone images with species that have a known size-weight relationship [27]. In addition, drones can overcome the limitations of traditional methods when studying cryptic and dangerous species [28] and could be a cost-effective alternative for observing large species [29].
Here, we investigate the potential of using UAVs to estimate the density of Aurelia sp. in a restricted area that is known for regular surveys of its jellyfish populations [30,31,32,33]. We developed a semiautomated program to count jellyfish in drone pictures, enabling one to estimate their local densities in the fjord. We first present the different steps of image processing performed by the program and explain how the drone images can be enhanced to improve jellyfish detection. To illustrate this technique, we took drone pictures at three different locations in a Danish fjord, each location having different environmental conditions (i.e., sun glare, cloud cover, waves and type of sea bottom). We compared our results to manual counting from the same drone pictures. In addition, we compared the drone population density measurements to the ones obtained by net sampling conducted at the same time and locations, as well as to earlier studies from the same area. Finally, we discuss the benefits of using drones and the practicality of this new approach as compared to other methods for assessing jellyfish distribution and abundance.
2. Materials and Methods
2.1. Study Site and Species
The fieldwork was conducted in Kertinge Nor, the western part of the Kerteminde Fjord (Funen, Denmark, 55°25′39.5′′ N, 10°34′51.6′′ E; Figure 1a), on 15 September 2020. The Kerteminde Fjord is a shallow water system connected to the Great Belt [34], which hosts a local common jellyfish population of Aurelia aurita and a limited population of Cyanea capillata [30,33]. We focused on the Aurelia sp. due to their wide distribution and abundance in the fjord, as well as the color and shape of the medusae that make them easily recognizable from above with the drone. We did not make the distinction of the different species in the field and we refer to the genus Aurelia sp. in this report. The drone and net were deployed from the research boat at the same time at three different locations in Kertinge Nor (Figure 1a), where the water has an average depth of 2 m [35].
2.2. Protocol for Net Sampling
Medusae of Aurelia sp. were collected in situ at the three sampling stations with a 500-μm-meshed plankton net (square mouth area A = 0.25 m2; volume filtered V = 0.05 m3) from the research vessel (Figure 1b), at 0.5 m below the surface. The boat was drifting at a maximum speed of 1 knot during 5 min over a distance of about 60 m. The transect length was measured from the GPS positions at the start and end of the net deployment. The jellyfish were counted on board and released back into the water at the respective sampling locations. Aurelia sp. densities were calculated as ind.m−3, knowing the number of individuals caught inside the water volume filtered by the net.
Aurelia sp. densities from the net were calculated as below:
where N is the number of individuals caught with the net, and V is the volume of water filtered by the net at the stations, obtained by multiplying the square mouth area of the net with the length of the transect.
D (ind. m−3) = N/V.
2.3. Protocol for Drone Sampling
At every sampling location, a drone was deployed from the research vessel at the same time as the net to provide pictures from the same locations. The drone was a DJI PHANTOM 4 Pro V2.0TM (SZ DJI Technology Co., Ltd., Shenzhen, China; 350-mm-long diagonally), a quadcopter equipped with a camera with gimbal stabilization (1-inch 20MP CMOS sensor, f/2.8 wide-angle lens). During flights, the livestream video from the drone camera was displayed through the DJI GO 4.0 App. (Android V4.3.16) on a DJI CRYSTALSKYTM monitor (system version V3.0.2.0, screen resolution 2048 × 1536, ultra-brightness 2000 cd/m2) mounted on the remote controller. Pictures were taken with the drone at a height of 10 m above sea level to provide high-resolution images of jellyfish (photo resolution of 3840 × 2160). The camera was looking at a 90° downward angle, with the drone hovering for every shot to avoid drifting jellyfish in pictures. The sampling was conducted at the end of the day with a partial cloud cover and under very low wind (<2.5 ms−1) to minimize wave turbulence at the surface. The camera lens was equipped with a polarizing filter (POLARPRO® ND8-PL, Polar Pro Filters, Inc., Costa Mesa, CA, USA) to reduce sun reflection on images. Information about weather, overall flights and locations was available through the AirData app. (Airdata UAVTM Inc., El Dorado Hills, CA, USA).
2.4. Analyses of Drone Images
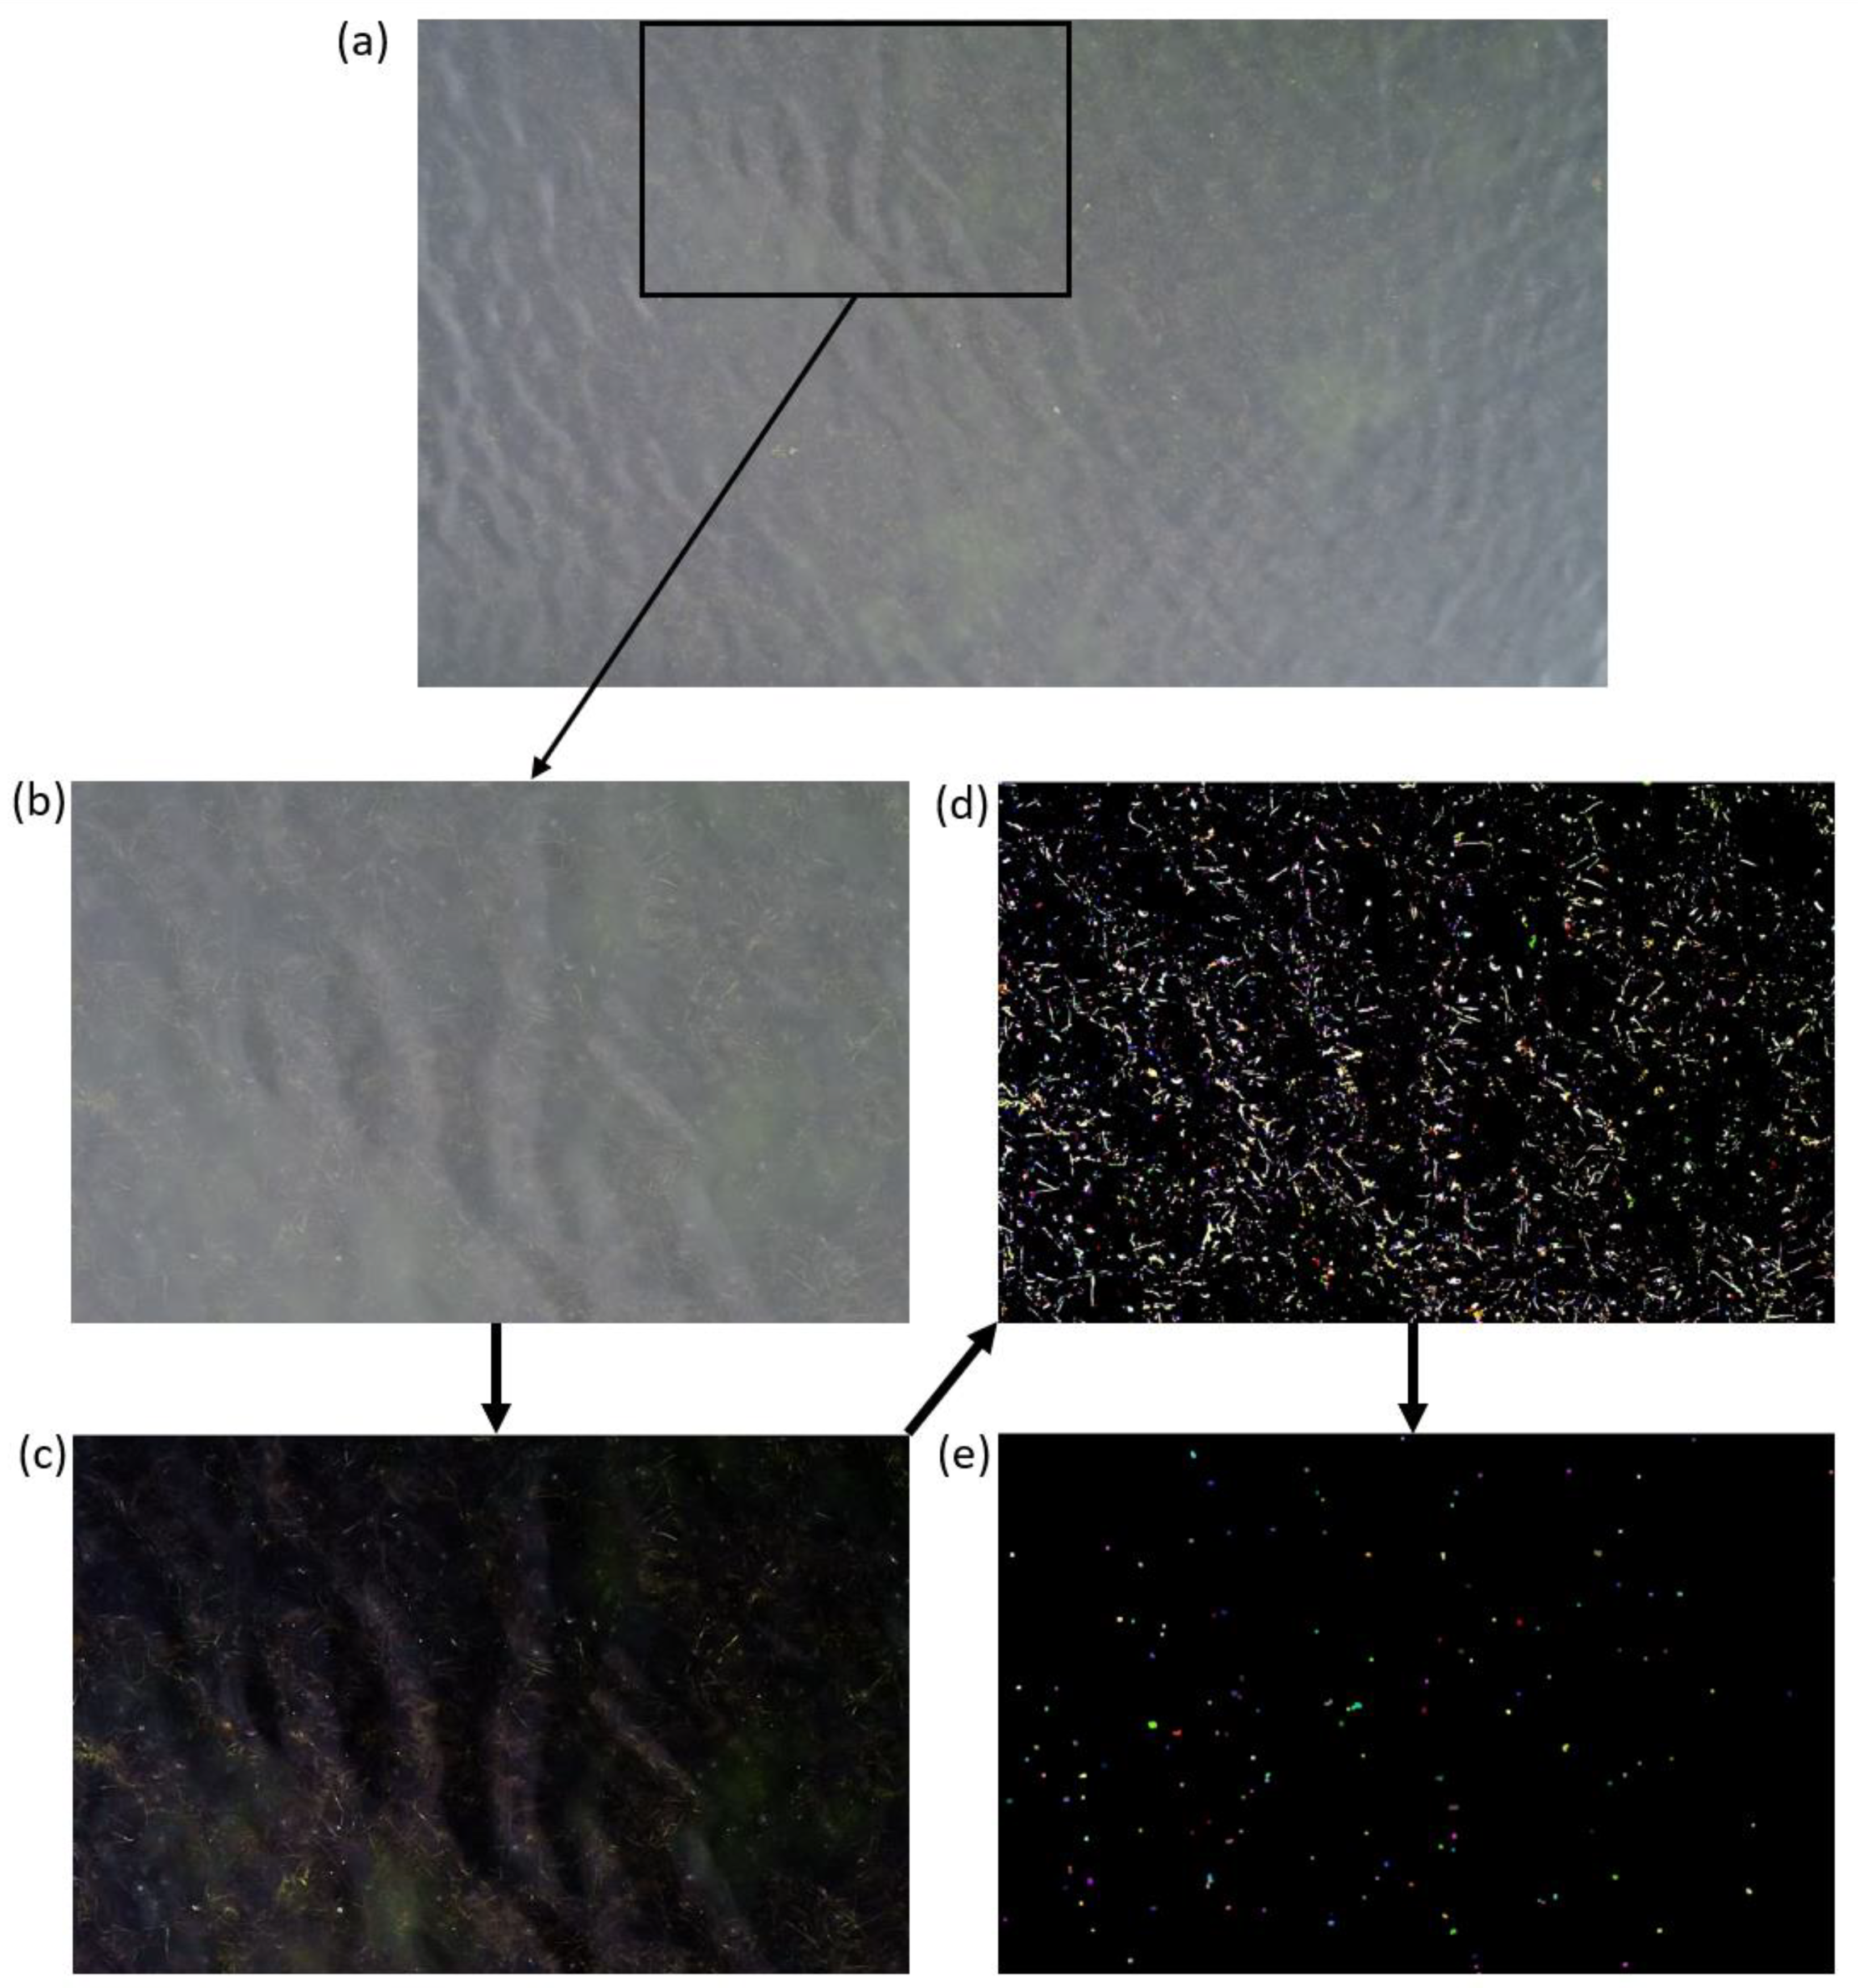
We performed a semiautomated counting of the Aurelia sp. on drone pictures using the EBImage package [38] in RStudio [39]. All steps of the image processing with RStudio are illustrated in Figure 2. The drone pictures were first manually cropped in an area with reduced clutter (e.g., sun reflection, floating debris) to perform the jellyfish detection over a homogeneous background (Figure 2a,b). The medusae were highlighted by their gonads in the center of a round-elliptic umbrella. The cropped images were then automatically enhanced by increasing the contrast between the jellyfish and the background after the automatic selection of the best-fitting gamma correction (Figure 2c). The determination of the enhancement parameters is described in the R script available through the Pangea data depository. All elements that stand out from the background were segmented using an adaptive threshold for the different regions of the pictures that corrected for local changes in brightness (Figure 2d). The picture was then cleaned by discarding all elements with a size below 5 pixels and a nonround shape that were unlikely to be jellyfish (Figure 2e). The algorithm treated the greyscale images as a topographic relief to differentiate individuals very close to each other, comparing the intensity of pixels with their neighbors and applying a unique color to each individual. All image transformations enabled the software to automatically count the total number of jellyfish in each picture. The mean number of jellyfish, with a 95% confidence interval, was calculated for each picture after 100 iterations of the image processing with different enhancement parameters.
At last, we manually counted the numbers of Aurelia sp. on the same cropped images as the semiautomated method using the multipoint tool in ImageJ V. 1.53a [40], an open-access image processing software.
The surface areas of the cropped images were based on the following formula determining the pixel resolution:
where H is the camera height at which the picture was taken (in m, available through the AirData app.), P is the pixel size on the camera sensor (2.41 microns; based on a sensor size of 13.2 mm ∗ 8.8 mm) and F is the focal length of the camera (24 mm).
Resolution (mm) = H∗(P/F),
Aurelia sp. densities from drone pictures were calculated using the same formula as with the net, considering N as the number of individuals counted on the pictures. The water volume V was obtained by multiplying the surface area with the average water depth of 2 m in the sampling area [35]. Information on how we treated image data and JF counting are given in the Supplementary material.
2.5. Statistical Tests
We performed a One-Way ANOVA in RStudio to compare the mean density of Aurelia sp. in the shallow enclosure between the semiautomated detection on drone images, the manual detection and the net sampling. Mean densities were computed from the measurements obtained at the three sampling stations for each method. A statistical significance was considered for P < 0.05.
3. Results and Discussion
The mean densities of Aurelia sp. calculated from the drone images were not statistically different from the mean density measured with the net (Figure 3; One-Way ANOVA, F(2,6) = 0.3, P = 0.7), estimating on average 6 (±1) ind.m−3 in Kertinge Nor with the semiautomated and manual methods on the drone images and 5 (±2) ind.m−3 with the net sampling (Table 1).
The estimated densities of Aurelia sp. match well with earlier estimates of A. aurita in the same area and during the same season, estimated to be 7 (±4) ind.m−3 [32]. Seasonal patterns regarding the abundance and individual size of local jellyfish in this area seem to have a dynamic pattern since 1991 [31]. After summertime sexual maturation, Aurelia aurita degrow following the seasonal dynamics of zooplankton prey, before disappearing completely in wintertime [30,31,32].
The jellyfish detection method shows how to overcome most visual “noise” through image enhancement and discrimination of objects by shape and size in order to increase the detection rate of jellyfish in the water column (Figure 2). The limited sun reflection and homogeneous water clarity in the cropped pictures of stations 1 and 2 resulted in very close approximations of jellyfish numbers by the program as compared to the manual detection (Table 1). However, unrelated objects that have a high occurrence in the picture such as seagrass in station 3 (Figure 2) may be incorrectly detected as jellyfish by the program, increasing the number of false positives (semi-auto mean (95% CI) higher than manual count for station 3; Table 1), as the small size and translucent color of the Aurelia sp. make them particularly difficult to distinguish from their environment. In areas with visible pollution, floating debris such as plastic bags may also be mistaken for jellyfish if their size, shape and color are similar.
Drone sampling should be conducted in good weather and only over calm water to reduce sun reflections and wave turbulence at the surface that may interfere with the detection of jellyfish [28]. Unrelated clutter is likely to either overestimate the density of jellyfish (when light spots are mistaken as jellyfish by the software) or underestimate it when a high brightness make the jellyfish barely visible from above. Polarizing filters can be applied to the UAV camera lens, and the angle of the camera can be adjusted to avoid facing the sun. These adjustments are especially needed when the sun is close to the horizon.
The altitude for taking drone pictures can be adjusted depending on the size of the jellyfish, with larger species being visible from higher heights and thus drones being able to survey larger areas with fewer images [29]. However, depending on the water clarity and turbidity as well as the type of sea bottom, drones may not be able to detect jellyfish far below the surface, and therefore the drone approach risks an underestimation of the total density and abundance of jellyfish. Therefore, an accurate estimation of jellyfish densities may require knowledge about their depth distribution [25] or the sampling to be only conducted in very shallow waters [27]. To overcome such issues, drone sampling can work together with net hauls to obtain both horizontal and vertical estimations and to help measure the total aggregation biomass [25]. Underwater drones or ROVs can also help study species that spend more time at the sea bottom or in deep waters [16]. Along with surface observation, aerial and underwater drones have complementary approaches that can be used together to observe jellyfish in a more comprehensive view [41]. Moreover, automated classification methods recently used to count fish [42] or to distinguish jellyfish species using Convolution Neural Networks [43] may be applied to drone images.
As stated by the European Environmental Agency (State of Nature Report 2013–2018), there is a lack of data on the distribution and abundance of marine species, including gelatinous zooplanktons. There is a need to determine the applicability of drone imaging to improve the monitoring and detection of, e.g., invasive jellyfish, or to improve our capacity to predict jellyfish blooming events as an integral component of any marine ecosystem’s exploration and assessment. Recently, a large group of marine scientists called upon global leaders to protect offshore biodiversity [44]. To accomplish all these goals in a cost-efficient manner, drone imaging may become an important tool for enhancing assessments of marine macroplanktonic biodiversity in many areas, not least those beyond national jurisdiction.
4. Conclusions
We used drones to test an alternative method for observing a small and patchy species of jellyfish. Using a simple algorithm for automatic image enhancement and item detection, we obtained a good approximation of jellyfish numbers and densities from drone pictures as compared to results from manual detection as well as from net sampling. The accuracy of using the drone technique for jellyfish detection may however vary with environmental conditions. Sun glare, water turbidity or seagrass can increase the number of false positives for small and translucent species that are difficult to distinguish such as Aurelia sp.
Drones have a very affordable cost compared to manned aircrafts and are easy to handle due to their small size, requiring minimal training for flying. Drones enable the collection of larger datasets in a shorter time, and they can easily overcome the limitations of boat-based surveys, especially for species that are delicate to sample, such as Aurelia sp. The jellyfish detection program presented here may require in-depth sampling during different seasons in a larger number of sites to validate its reliability. In spite of the limitations of this first small but promising dataset, drones offer promising perspectives for measuring the spatial and temporal dynamics of jellyfish populations.
Supplementary Materials
The following are available online at https://0-www-mdpi-com.brum.beds.ac.uk/article/10.3390/jmse9060659/s1.
Author Contributions
H.H. and J.J. designed the study; H.H. and M.W. collected the data. H.H. and S.L. developed the jellyfish detection program and performed the data analysis. All authors provided comments to improve the manuscript and agreed to the published version.
Funding
H.H. and J.J. were financed through the GoJelly (A Gelatinous Solution to Microplastic Pollution) project, which receives funding from the European Union’s Horizon 2020 research and innovation programme under Grant agreement No. 774499.
Institutional Review Board Statement
Not applicable as no human or animals were used in this study.
Informed Consent Statement
Not applicable.
Data Availability Statement
All codes are supplemented to this article and thus free to be accessed.
Acknowledgments
We thank Fjord&Bælt for lending a boat to one of the sampling trips.
Conflicts of Interest
The authors declare no conflict of interest.
References
- Lynam, C.P.; Lilley, M.K.S.; Bastian, T.; Doyle, T.K.; Beggs, S.E.; Hays, G.C. Have jellyfish in the Irish Sea benefited from climate change and overfishing? Glob. Chang. Biol. 2011, 17, 767–782. [Google Scholar] [CrossRef]
- Condon, R.H.; Graham, W.M.; Duarte, C.M.; Pitt, K.A.; Lucas, C.H.; Haddock, S.H.D.; Sutherland, K.R.; Robinson, K.L.; Dawson, M.N.; Decker, M.B.; et al. Questioning the Rise of Gelatinous Zooplankton in the World’s Oceans. BioScience 2012, 62, 160–169. [Google Scholar] [CrossRef] [Green Version]
- Sanz-Martín, M.; Pitt, K.A.; Condon, R.H.; Lucas, C.H.; Novaes de Santana, C.; Duarte, C.M. Flawed citation practices facilitate the unsubstantiated perception of a global trend toward increased jellyfish blooms. Glob. Ecol. Biogeogr. 2016, 25, 1039–1049. [Google Scholar] [CrossRef] [Green Version]
- Bosch-Belmar, M.; Milisenda, G.; Basso, L.; Doyle, T.K.; Leone, A.; Piraino, S. Jellyfish Impacts on Marine Aquaculture and Fisheries. Rev. Fish. Sci. Aquac. 2021, 29, 242–259. [Google Scholar] [CrossRef]
- Houghton, J.D.R.; Doyle, T.K.; Wilson, M.W.; Davenport, J.; Hays, G.C. Jellyfish aggregations and leatherback turtle foraging patterns in a temperate coastal environment. Ecology 2006, 87, 1967–1972. [Google Scholar] [CrossRef]
- Fleming, N.E.C.; Harrod, C.; Newton, J.; Houghton, J.D.R. Not All Jellyfish Are Equal: Isotopic Evidence for Inter- and Intraspecific Variation in Jellyfish Trophic Ecology. PeerJ 2015, 3, e1110. [Google Scholar] [CrossRef] [PubMed] [Green Version]
- Graham, W.M.; Pagès, F.; Hamner, W.M. A Physical Context for Gelatinous Zooplankton Aggregations: A review. Hydrobiologia 2001, 451, 199–212. [Google Scholar] [CrossRef]
- Olesen, N. Clearance Potential of Jellyfish Aurelia Aurita, and Predation Impact on Zooplankton in a Shallow Cove. Mar. Ecol. Prog. Ser. 1995, 124, 63–72. [Google Scholar] [CrossRef] [Green Version]
- Omori, M.; Ishii, H.; Fujinaga, A. Life History Strategy of Aurelia Aurita (Cnidaria, Scyphomedusae) and Its Impact on the Zooplankton Community of Tokyo Bay. ICES J. Mar. Sci. 1995, 52, 597–603. [Google Scholar] [CrossRef]
- Hansson, L.J.; Moeslund, O.; Kiørboe, T.; Riisgård, H.U. Clearance Rates of Jellyfish and Their Potential Predation Impact on Zooplankton and Fish Larvae in a Neritic Ecosystem (Limfjorden, Denmark). Mar. Ecol. Prog. Ser. 2005, 304, 117–131. [Google Scholar] [CrossRef] [Green Version]
- Doyle, T.K.; Houghton, J.D.R.; Buckley, S.M.; Hays, G.C.; Davenport, J. The Broad-Scale Distribution of Five Jellyfish Species across a Temperate Coastal Environment. Hydrobiologia 2007, 579, 29–39. [Google Scholar] [CrossRef]
- Bastian, T.; Haberlin, D.; Purcell, J.E.; Hays, G.C.; Davenport, J.; McAllen, R.; Doyle, T.K. Large-Scale Sampling Reveals the Spatio-Temporal Distributions of the Jellyfish Aurelia Aurita and Cyanea Capillata in the Irish Sea. Mar. Biol. 2011, 158, 2639–2652. [Google Scholar] [CrossRef]
- Purcell, J.E. Extension of Methods for Jellyfish and Ctenophore Trophic Ecology to Large-Scale Research. Hydrobiologia 2009, 616, 23–50. [Google Scholar] [CrossRef] [Green Version]
- Hosia, A.; Falkenhaug, T.; Baxter, E.J.; Pagès, F. Abundance, Distribution and Diversity of Gelatinous Predators along the Northern Mid-Atlantic Ridge: A Comparison of Different Sampling Methodologies. PLoS ONE 2017, 12, e0187491. [Google Scholar] [CrossRef] [Green Version]
- Brierley, A.S.; Axelsen, B.E.; Buecher, E.; Sparks, C.A.J.; Boyer, H.; Gibbons, M.J. Acoustic Observations of Jellyfish in the Namibian Benguela. Mar. Ecol. Prog. Ser. 2001, 210, 55–66. [Google Scholar] [CrossRef] [Green Version]
- Båmstedt, U.; Kaartvedt, S.; Youngbluth, M. An Evaluation of Acoustic and Video Methods to Estimate the Abundance and Vertical Distribution of Jellyfish. J. Plankton Res. 2003, 25, 1307–1318. [Google Scholar] [CrossRef] [Green Version]
- Brierley, A.S.; Boyer, D.C.; Axelsen, B.E.; Lynam, C.P.; Sparks, C.A.J.; Boyer, H.J.; Gibbons, M.J. Towards the Acoustic Estimation of Jellyfish Abundance. Mar. Ecol. Prog. Ser. 2005, 295, 105–111. [Google Scholar] [CrossRef]
- Han, C.-H.; Uye, S.-I. Quantification of the Abundance and Distribution of the Common Jellyfish Aurelia Aurita s.l. with a Dual-Frequency IDentification SONar (DIDSON). J. Plankton Res. 2009, 31, 805–814. [Google Scholar] [CrossRef] [Green Version]
- Graham, W.; Martin, D.; Martin, J. In Situ Quantification and Analysis of Large Jellyfish Using a Novel Video Profiler. Mar. Ecol. Prog. Ser. 2003, 254, 129–140. [Google Scholar] [CrossRef]
- Hoving, H.-J.; Christiansen, S.; Fabrizius, E.; Hauss, H.; Kiko, R.; Linke, P.; Neitzel, P.; Piatkowski, U.; Körtzinger, A. The Pelagic In Situ Observation System (PELAGIOS) to Reveal Biodiversity, Behavior, and Ecology of Elusive Oceanic Fauna. Ocean Sci. 2019, 15, 1327–1340. [Google Scholar] [CrossRef] [Green Version]
- Houghton, J.; Doyle, T.; Davenport, J.; Hays, G. Developing a Simple, Rapid Method for Identifying and Monitoring Jellyfish Aggregations from the Air. Mar. Ecol. Prog. Ser. 2006, 314, 159–170. [Google Scholar] [CrossRef] [Green Version]
- Purcell, J.E.; Brown, E.D.; Stokesbury, K.D.E.; Haldorson, L.H.; Shirley, T.C. Aggregations of the Jellyfish Aurelia Labiata: Abundance, Distribution, Association with Age-0 Walleye Pollock, and Behaviors Promoting Aggregation in Prince William Sound, Alaska, USA. Mar. Ecol. Prog. Ser. 2000, 195, 145–158. [Google Scholar] [CrossRef] [Green Version]
- Magome, S.; Yamashita, T.; Kohama, T.; Kaneda, A.; Hayami, Y.; Takahashi, S.; Takeoka, H. Jellyfish Patch Formation Investigated by Aerial Photography and Drifter Experiment. J. Oceanogr. 2007, 63, 761–773. [Google Scholar] [CrossRef]
- Fossette, S.; Gleiss, A.C.; Chalumeau, J.; Bastian, T.; Armstrong, C.D.; Vandenabeele, S.; Karpytchev, M.; Hays, G.C. Current-Oriented Swimming by Jellyfish and Its Role in Bloom Maintenance. Curr. Biol. 2015, 25, 342–347. [Google Scholar] [CrossRef] [Green Version]
- Schaub, J.; Hunt, B.; Pakhomov, E.; Holmes, K.; Lu, Y.; Quayle, L. Using Unmanned Aerial Vehicles (UAVs) to Measure Jellyfish Aggregations. Mar. Ecol. Prog. Ser. 2018, 591, 29–36. [Google Scholar] [CrossRef]
- Raoult, V.; Colefax, A.P.; Allan, B.M.; Cagnazzi, D.; Castelblanco-Martínez, N.; Ierodiaconou, D.; Johnston, D.W.; Landeo-Yauri, S.; Lyons, M.; Pirotta, V.; et al. Operational Protocols for the Use of Drones in Marine Animal Research. Drones 2020, 4, 64. [Google Scholar] [CrossRef]
- Raoult, V.; Gaston, T.F. Rapid Biomass and Size-Frequency Estimates of Edible Jellyfish Populations Using Drones. Fish. Res. 2018, 207, 160–164. [Google Scholar] [CrossRef]
- Rowley, O.C.; Courtney, R.L.; Browning, S.A.; Seymour, J.E. Bay Watch: Using Unmanned Aerial Vehicles (UAV’s) to Survey the Box Jellyfish Chironex Fleckeri. PLoS ONE 2020, 15, e0241410. [Google Scholar] [CrossRef]
- Choi, S.Y.; Kim, H.J.; Seo, M.H.; Soh, H.Y. Density Estimation of Nemopilema Nomurai (Scyphozoa, Rhizostomeae) Using a Drone. J. Indian Soc. Remote Sens. 2021, 1–6. [Google Scholar] [CrossRef]
- Olesen, N.J.; Frandsen, K.; Riisgård, H.U. Population Dynamics, Growth and Energetics of Jellyfish Aurelia Aurita in a Shallow Fjord. Mar. Ecol. Prog. Ser. 1994, 105, 9–18. [Google Scholar] [CrossRef]
- Riisgård, H.U.; Barth-Jensen, C.; Madsen, C. High Abundance of the Jellyfish Aurelia Aurita Excludes the Invasive Ctenophore Mnemiopsis Leidyi to Establish in a Shallow Cove (Kertinge Nor, Denmark). Aquat. Invasions 2010, 5. [Google Scholar] [CrossRef]
- Goldstein, J.; Riisgård, H.U. Population Dynamics and Factors Controlling Somatic Degrowth of the Common Jellyfish, Aurelia Aurita, in a Temperate Semi-Enclosed Cove (Kertinge Nor, Denmark). Mar. Biol. 2016, 163, 33. [Google Scholar] [CrossRef]
- Lüskow, F. Importance of Environmental Monitoring: Long-Term Record of Jellyfish (Aurelia Aurita) Biomass in a Shallow Semi-Enclosed Cove (Kertinge Nor, Denmark). Reg. Stud. Mar. Sci. 2020, 34, 100998. [Google Scholar] [CrossRef]
- Riisgård, H.U.; Jensen, M.H.; Rask, N.; Caldwell, M.M.; Heldmaier, G.; Jackson, R.B.; Lange, O.L.; Mooney, H.A.; Schulze, E.D.; Sommer, U. Odense Fjord and Kerteminde Fjord/Kertinge Nor. In Ecology of Baltic Coastal Waters; Schiewer, U., Ed.; Springer: Berlin/Heidelberg, Germany, 2008; Volume 197, pp. 361–394. [Google Scholar]
- Nielsen, A.S.; Pedersen, A.W.; Riisgård, H.U. Implications of Density Driven Currents for Interaction between Jellyfish (Aurelia Aurita) and Zooplankton in a Danish Fjord. Sarsia 1997, 82, 297–305. [Google Scholar] [CrossRef]
- OpenStreetMap Contributors. 2020. Available online: https://www.openstreetmap.org (accessed on 1 May 2021).
- QGIS Development Team. QGIS Geographic Information System. Open Source Geospatial Foundation Project. 2020. Available online: http://qgis.osgeo.org (accessed on 1 May 2021).
- Pau, G.; Fuchs, F.; Sklyar, O.; Boutros, M.; Huber, W. EBImage—An R Package for Image Processing with Applications to Cellular Phenotypes. Bioinformatics 2010, 26, 979–981. [Google Scholar] [CrossRef]
- RStudio Team. RStudio: Integrated Development Environment for R; RStudio, PBC: Boston, MA, USA, 2021; Available online: http://www.rstudio.com/ (accessed on 1 May 2021).
- Abramoff, M.D.; Magalhães, P.J.; Ram, S.J. Image Processing with ImageJ. Available online: http://localhost/handle/1874/204900 (accessed on 1 May 2021).
- Shkurti, F.; Xu, A.; Meghjani, M.; Gamboa Higuera, J.C.; Girdhar, Y.; Giguère, P.; Dey, B.B.; Li, J.; Kalmbach, A.; Prahacs, C.; et al. Multi-Domain Monitoring of Marine Environments Using a Heterogeneous Robot Team. In Proceedings of the 2012 IEEE/RSJ International Conference on Intelligent Robots and Systems, Algarve, Portugal, 7–12 October 2012; pp. 1747–1753. [Google Scholar] [CrossRef] [Green Version]
- Zhang, S.; Yang, X.; Wang, Y.; Zhao, Z.; Liu, J.; Liu, Y.; Sun, C.; Zhou, C. Automatic Fish Population Counting by Machine Vision and a Hybrid Deep Neural Network Model. Animals 2020, 10, 364. [Google Scholar] [CrossRef] [PubMed] [Green Version]
- Gauci, A.; Deidun, A.; Abela, J. Automating Jellyfish Species Recognition through Faster Region-Based Convolution Neural Networks. Appl. Sci. 2020, 10, 8257. [Google Scholar] [CrossRef]
- Helm, R.R.; Clark, N.; Harden-Davies, H.; Amon, D.; Girguis, P.; Bordehore, C.; Earle, S.; Gibbons, M.J.; Golbuu, Y.; Haddock, S.H.D.; et al. Protect high seas biodiversity. Science 2021, 372, 1048–1049. [Google Scholar]
Figure 1.
(a) Locations of sampling stations in Kertinge Nor. (S1) 55°26′56′′ N, 10°33′50′′ E; (S2) 55°26′15′′ N, 10°33′55′′ E; (S3) 55°25′58′′ N, 10°34′12′′ E. (Map projection: EPSG: 32632—WGS 84/UTM Zone 32N. © OpenStreetMap contributors [36]). The map was produced with QGIS V. 3.10.3 (QGIS Development Team [37]); core data is available under the Open Database License (https://www.openstreetmap.org/copyright accessed on 1 May 2021). (b) Drone view of jellyfish sampling with the net, conducted from the research vessel. The transect was following a straight line at a regular boat speed during 5 min.

Figure 2.
Image processing steps for semiautomated counting in RStudio, using data from sampling station 3. (a) Original drone picture with selection of area to crop; (b) Cropped image selected to have reduced clutter and homogeneous background (jellyfish in white); (c) Image obtained after automatic enhancement, with increased contrast and best gamma correction; (d) Elements segmented from the background using an adaptive threshold; (e) Image cleaned after size and shape discrimination; all jellyfish are visualized with a unique color for each individual.

Figure 3.
Mean densities of Aurelia sp. estimated from the net sampling (dark grey bar) and from the drone images (medium and light gray bars; respectively, the manual and semiautomated methods). The mean and standard deviation were computed from the three sampling stations for each method.
Figure 3.
Mean densities of Aurelia sp. estimated from the net sampling (dark grey bar) and from the drone images (medium and light gray bars; respectively, the manual and semiautomated methods). The mean and standard deviation were computed from the three sampling stations for each method.


Table 1.
Numbers of Aurelia sp. counted on drone pictures for the three sampling stations, including the manual counts with ImageJ (“Manual”) and the mean (95% CI, n = 100 iterations) from the counts with the RStudio detection program (“Semi-auto”).
Table 1.
Numbers of Aurelia sp. counted on drone pictures for the three sampling stations, including the manual counts with ImageJ (“Manual”) and the mean (95% CI, n = 100 iterations) from the counts with the RStudio detection program (“Semi-auto”).
| Station | Manual | Semi-Auto Mean (95% CI) |
|---|---|---|
| 1 | 209 | 206 (190–221) |
| 2 | 212 | 211 (201–220) |
| 3 | 142 | 160 (142–178) |
Publisher’s Note: MDPI stays neutral with regard to jurisdictional claims in published maps and institutional affiliations. |
© 2021 by the authors. Licensee MDPI, Basel, Switzerland. This article is an open access article distributed under the terms and conditions of the Creative Commons Attribution (CC BY) license (https://creativecommons.org/licenses/by/4.0/).
Share and Cite
MDPI and ACS Style
Hamel, H.; Lhoumeau, S.; Wahlberg, M.; Javidpour, J. Using Drones to Measure Jellyfish Density in Shallow Estuaries. J. Mar. Sci. Eng. 2021, 9, 659. https://0-doi-org.brum.beds.ac.uk/10.3390/jmse9060659
AMA Style
Hamel H, Lhoumeau S, Wahlberg M, Javidpour J. Using Drones to Measure Jellyfish Density in Shallow Estuaries. Journal of Marine Science and Engineering. 2021; 9(6):659. https://0-doi-org.brum.beds.ac.uk/10.3390/jmse9060659
Chicago/Turabian StyleHamel, Héloïse, Sébastien Lhoumeau, Magnus Wahlberg, and Jamileh Javidpour. 2021. "Using Drones to Measure Jellyfish Density in Shallow Estuaries" Journal of Marine Science and Engineering 9, no. 6: 659. https://0-doi-org.brum.beds.ac.uk/10.3390/jmse9060659
Note that from the first issue of 2016, this journal uses article numbers instead of page numbers. See further details here.