
Energy Management Using a Rule-Based Control Strategy of Marine Current Power System with Energy Storage System


Institute of Electric Drives and Control Systems, Shanghai Maritime University, Shanghai 201306, China
*
Author to whom correspondence should be addressed.
J. Mar. Sci. Eng. 2021, 9(6), 669; https://0-doi-org.brum.beds.ac.uk/10.3390/jmse9060669
Submission received: 18 May 2021
/
Revised: 8 June 2021
/
Accepted: 9 June 2021
/
Published: 17 June 2021
(This article belongs to the Topic Marine Renewable Energy)
Abstract
:With the rapid development of renewable energy technology, marine current energy is treated as the most desirable form of ocean energies. Due to the nature of marine current energy, simple structure, high reliability, and good control performance are the primary consideration for the energy management strategy. This paper proposes an energy management control strategy based on rules to compensate for the fluctuating power caused by tidal motion. The hybrid energy storage system composed of vanadium redox flow battery (VRB) is applied to reallocate power. Supercapacitor banks (SCBs) are applied as the auxiliary power source to absorb or release the required power according to energy management strategy based on control rules in the marine current power system. SCB makes the grid-connected power track the grid command power and also improves the operational efficiency of the vanadium redox flow battery (VRB). VRB compensates for the low-frequency fluctuating power caused by tidal motion and plays an important role in compensating for the difference in power between the grid-connected power and the grid command power to ensure the reliability of the marine current power system. A simulation model of a 3 MW marine current power system is built to verify the effectiveness of the energy management strategy based on the real marine current velocity data.
1. Introduction
With the rapid development of renewable energy technology, marine current energy is treated as the most desirable form of ocean energy due to its strong regularity, predictability, and sustainability. Under the same power level, the volume of system equipment is smaller than wind energy, and the corresponding manufacturing cost is lower. Additionally, the utilization of marine current energy has become a hot research field all over the world [1]. The change of marine current velocity will cause the fluctuation of marine current power, which will have a negative impact on the grid and users. In order to smooth the fluctuating power and improve the reliability of grid-connected power, using an energy storage system to smooth the fluctuating power is considered a more effective way [2,3,4]. Furthermore, the marine current fluctuating power could be smoothed by controlling the pitch angle of the marine current turbine [5,6]. Sliding mode control of nonlinear controller was used to manage marine current power and improve the efficiency of the marine current turbine (MCT) in [7,8]. In addition, energy management strategies involving wind power, solar power, and electric vehicle can also be analyzed and studied due to similar characteristics. The model predictive control (MPC) strategy was used to improve the efficiency of the electric vehicles [9,10,11], but the computational complexity may decrease the reliability of the system. Using other wind turbines to replace the energy storage system was studied in [12]. A fuzzy logic control algorithm was applied to achieve a reasonable allocation of power and improve the utilization of a photovoltaic power system [13]. The energy management strategy based on a multiagent system could make energy distribution become much more intelligent [14,15,16]. Particle swarm optimization (PSO) had the advantages of easy hardware implementation, strong global search capability, fast convergence speed, and less computational complexity, and therefore, it has become a research hotspot in the optimization field [17,18,19]. In order to improve the accuracy of model state estimation in power systems, the Kalman filter algorithm was applied [20,21,22].
Due to the specific characteristics of the marine current power system, such as the fact that the system is underwater and its maintenance is difficult, simple structure, high reliability, and better performance are the main considerations of the energy management strategy. In this paper, an energy management strategy based on rules is proposed to compensate for the predictable fluctuating power caused by tidal motion. This energy management strategy can make the grid-connected power track the grid command well while improving the operational efficiency of the vanadium redox flow battery (VRB).
2. Description and Modeling of System
2.1. System Structure
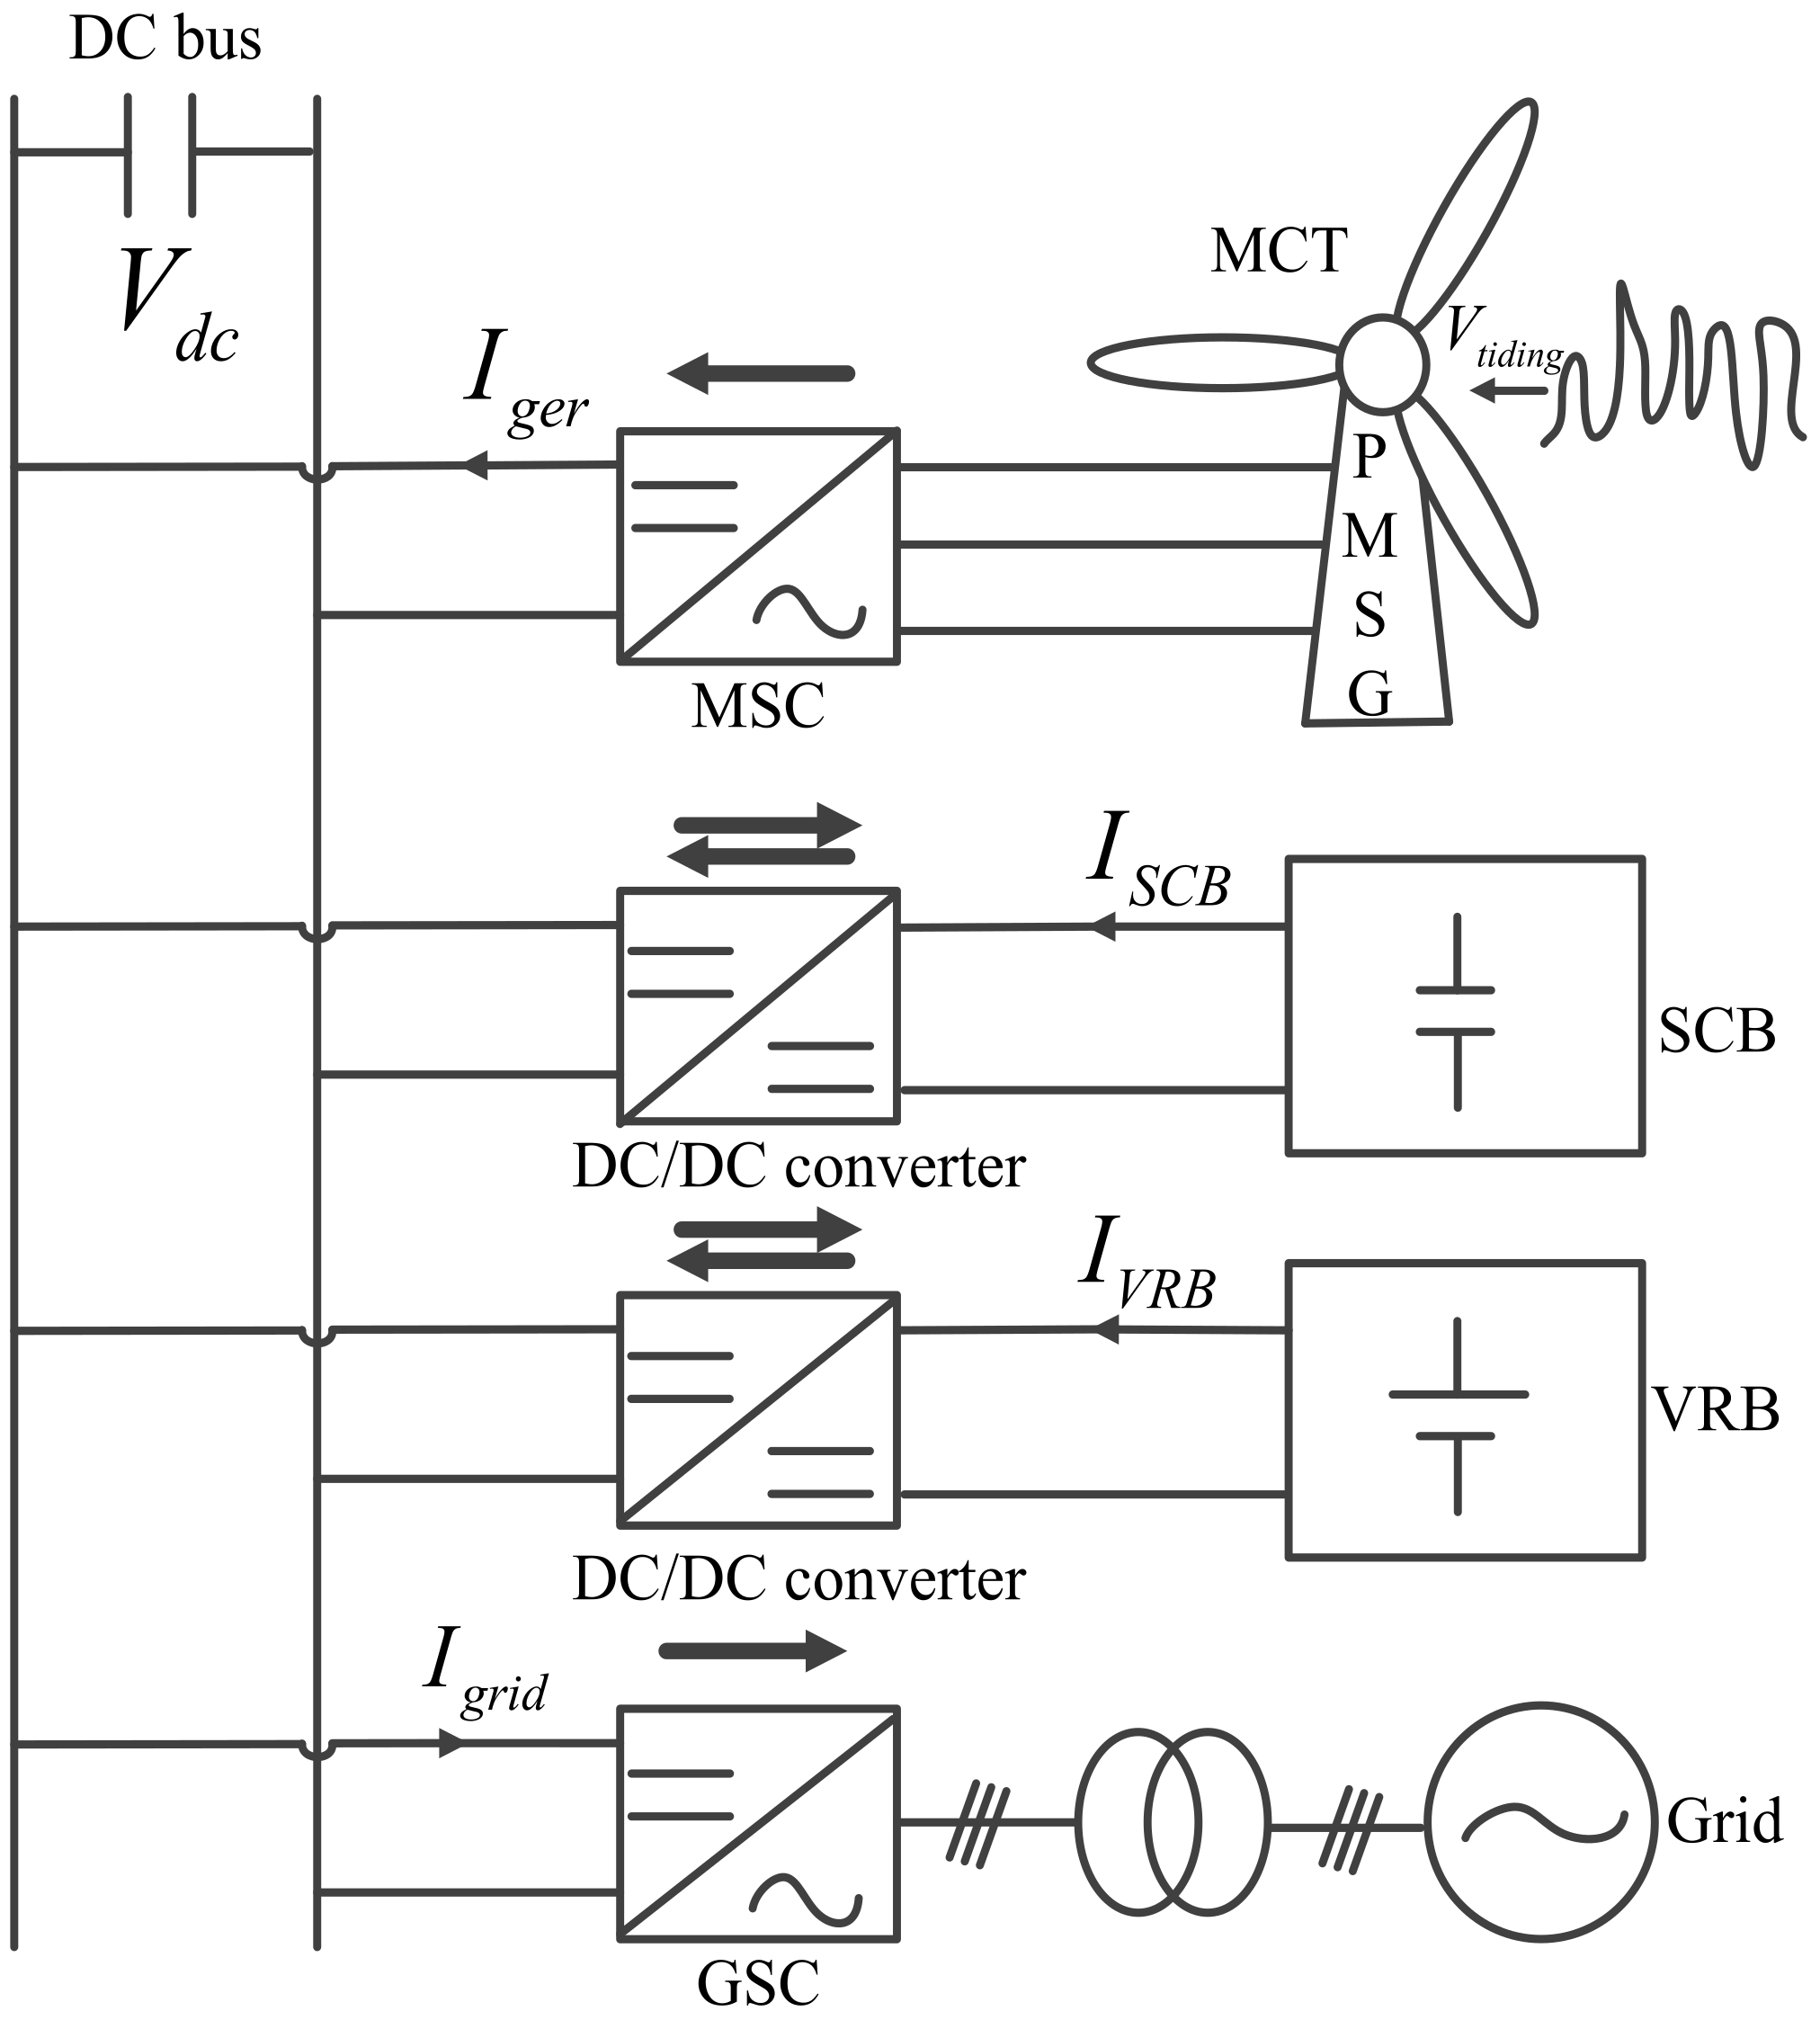
As shown in Figure 1, the MCT converts the kinetic energy of marine current into electric energy by a permanent magnet synchronous generator (PMSG). SCB is used as the auxiliary power source to absorb or release power according to the energy management algorithm based on rules proposed in this paper. VRB enables the grid-connected power to follow the grid demand according to the control rules. SCB and VRB are connected to the DC bus through a bidirectional DC/DC converter (energy can flow in two directions). The maximum power tracking of marine current power is realized by controlling a machine-side converter (MSC). Grid-connected active power and reactive power are regulated by controlling a grid-side converter (GSC).
2.2. Modeling and Control of MCT and PMSG
Marine current power captured by horizontal axis MCT [6] can be calculated by (1).
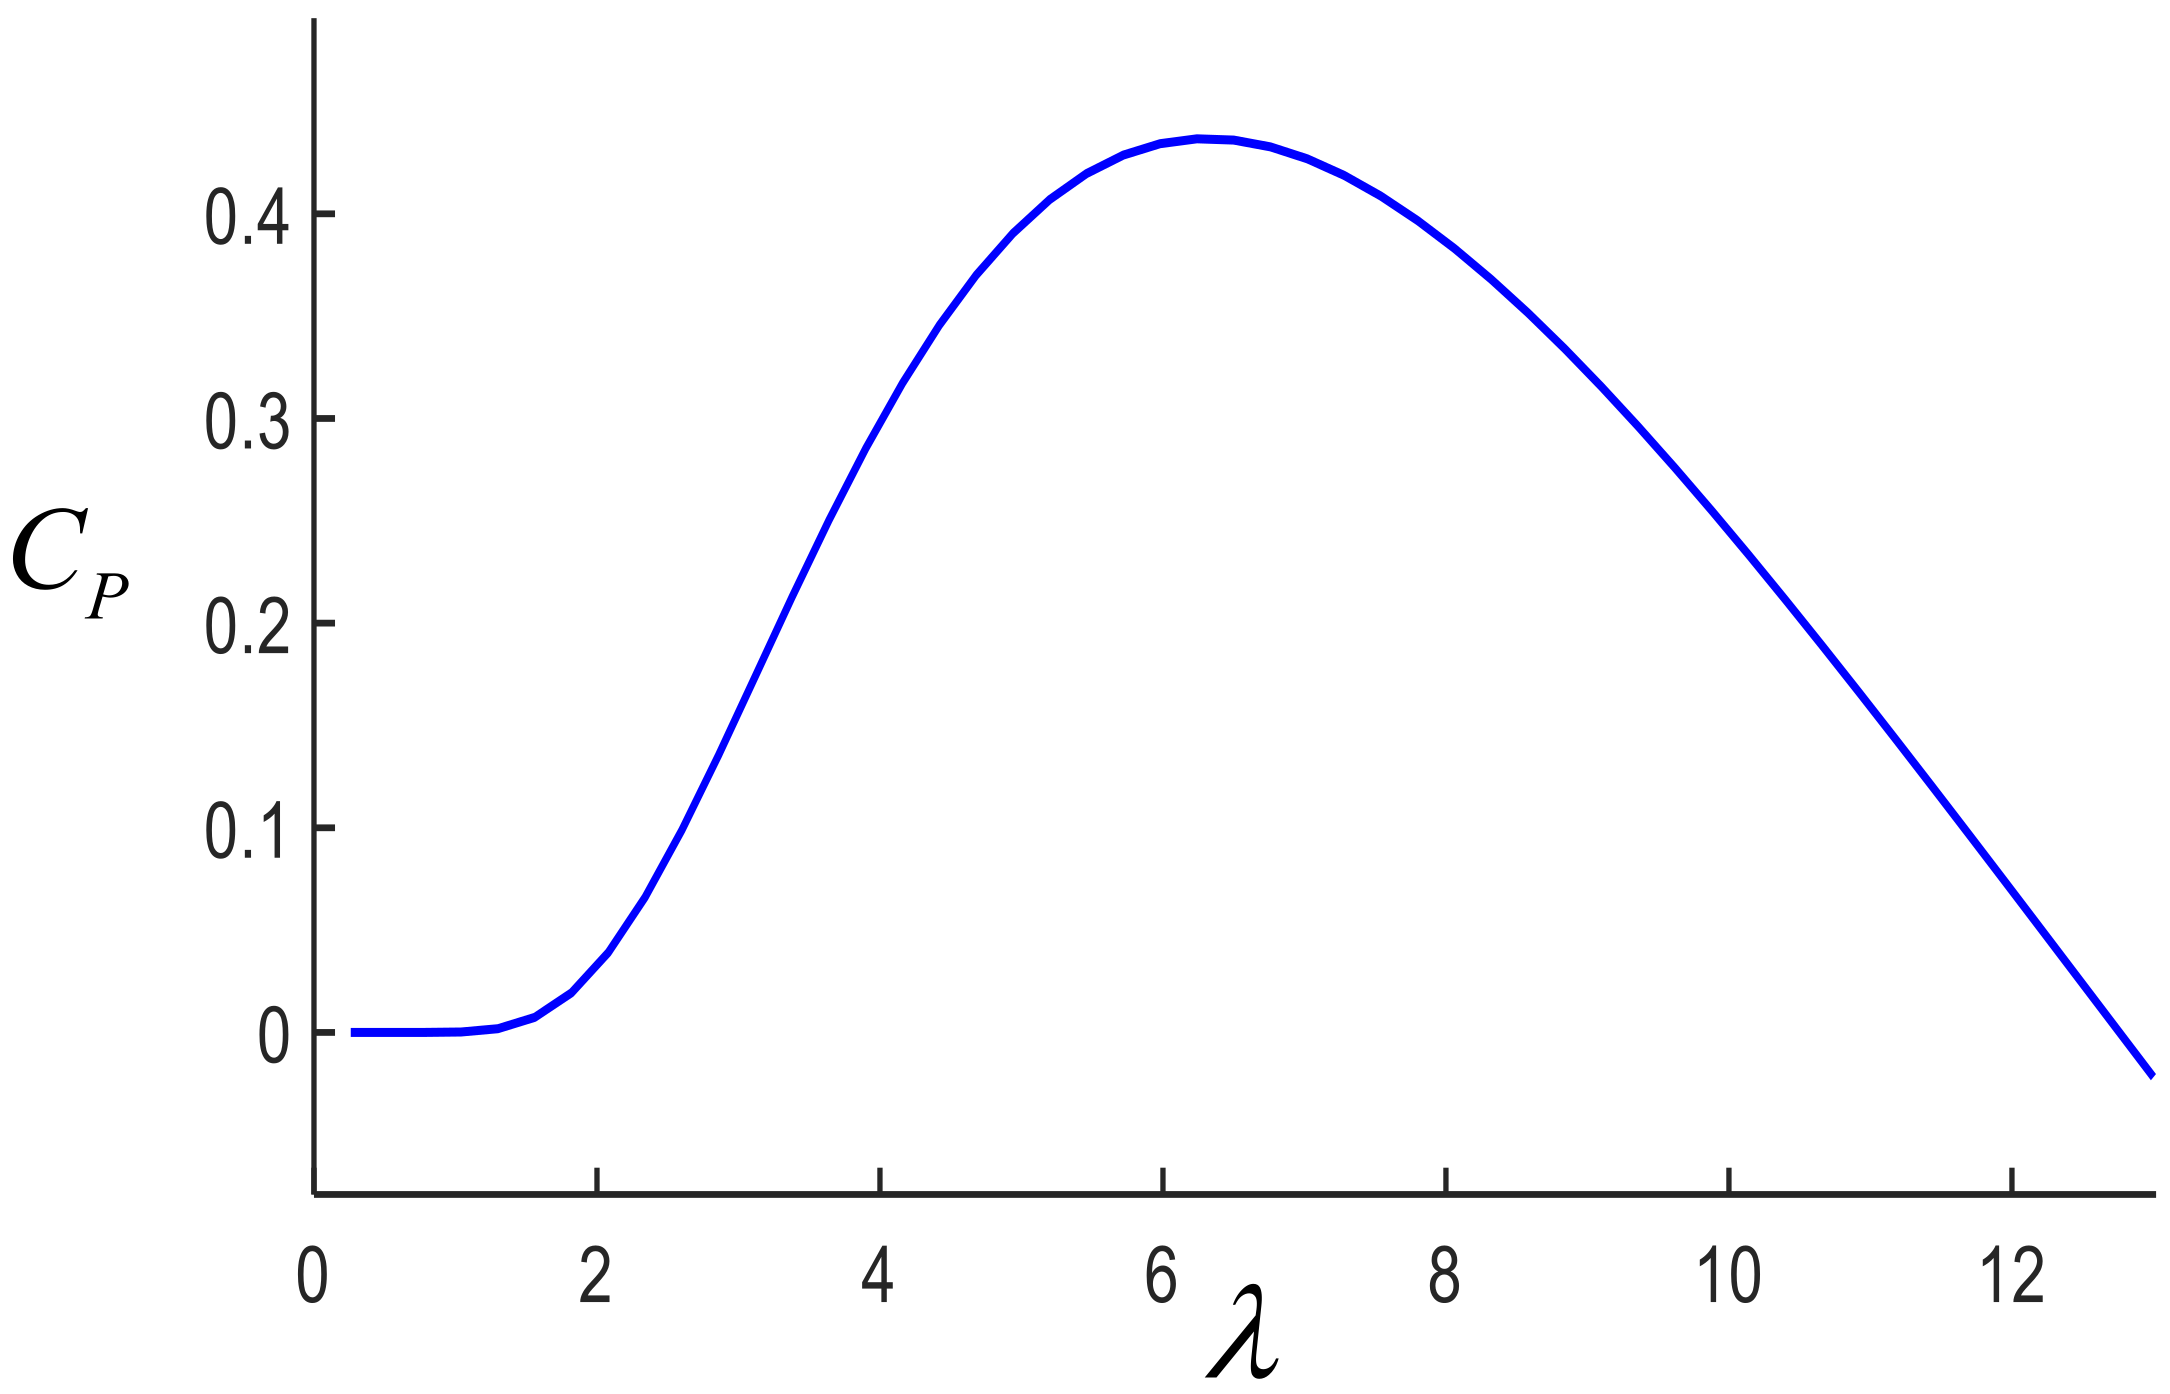
where ρ represents the water mass density, which is considered as 1025 kg/m3 in this paper, R means the length of blade radius of the MCT, and the specific value is 9 m, which can be found in Appendix A: Table A1. Additionally, Vtiding represents the marine current velocity near the blades of MCT. CP is the energy captured coefficient of MCT, and its value range is 0.35–0.5 for typical MCTs [2]. CP is a binary function of tip speed ratio (λ) and pitch angle (β) based on (2).
In this paper, β = 0 degrees is defined and according to (2), and the relational curve of CP-λ can be expressed in Figure 2.
The maximum coefficient (CP = 0.44) is reached when the optimum tip speed ratio λopt is 6.3. For the direct gearless system, according to (3), the λopt can be obtained when the change of generator rotor speed (ωref) keeps pace with the change of marine current velocity (Vtiding). This method is called the maximum power point tracking strategy based on the optimal tip speed ratio (TSR-MPPT) [23].
Higher reliability, high efficiency, and lower maintenance cost are the main characteristics of PMSG, compared with squirrel cage induction generator (SCIG); therefore, PMSG is gaining popularity [24]. In the three-phase coordinate system, it is difficult to design the controller due to the strong coupling and nonlinearity of PMSG. Therefore, coordinate conversion is introduced [25]. The voltage equation of PMSG in the d–q coordinate system is expressed by (4).
where Rs, p, ωeΨf represent stator resistance, differential operator, and rotating back EMF, respectively, while id, iq, ud, uq, Ld, Lq are the components of current, voltage, and inductance, respectively.
In this paper, the d-axis inductance Ld is equal to the q-axis inductance Lq. Therefore, for the direct gearless system, the electromagnetic torque expression of PMSG is based on (5).
where pn, J, Tm, Te, and ωm, respectively, represent pole pairs of PMSG, system inertia, mechanical torque, electromagnetic torque, and rotor speed.
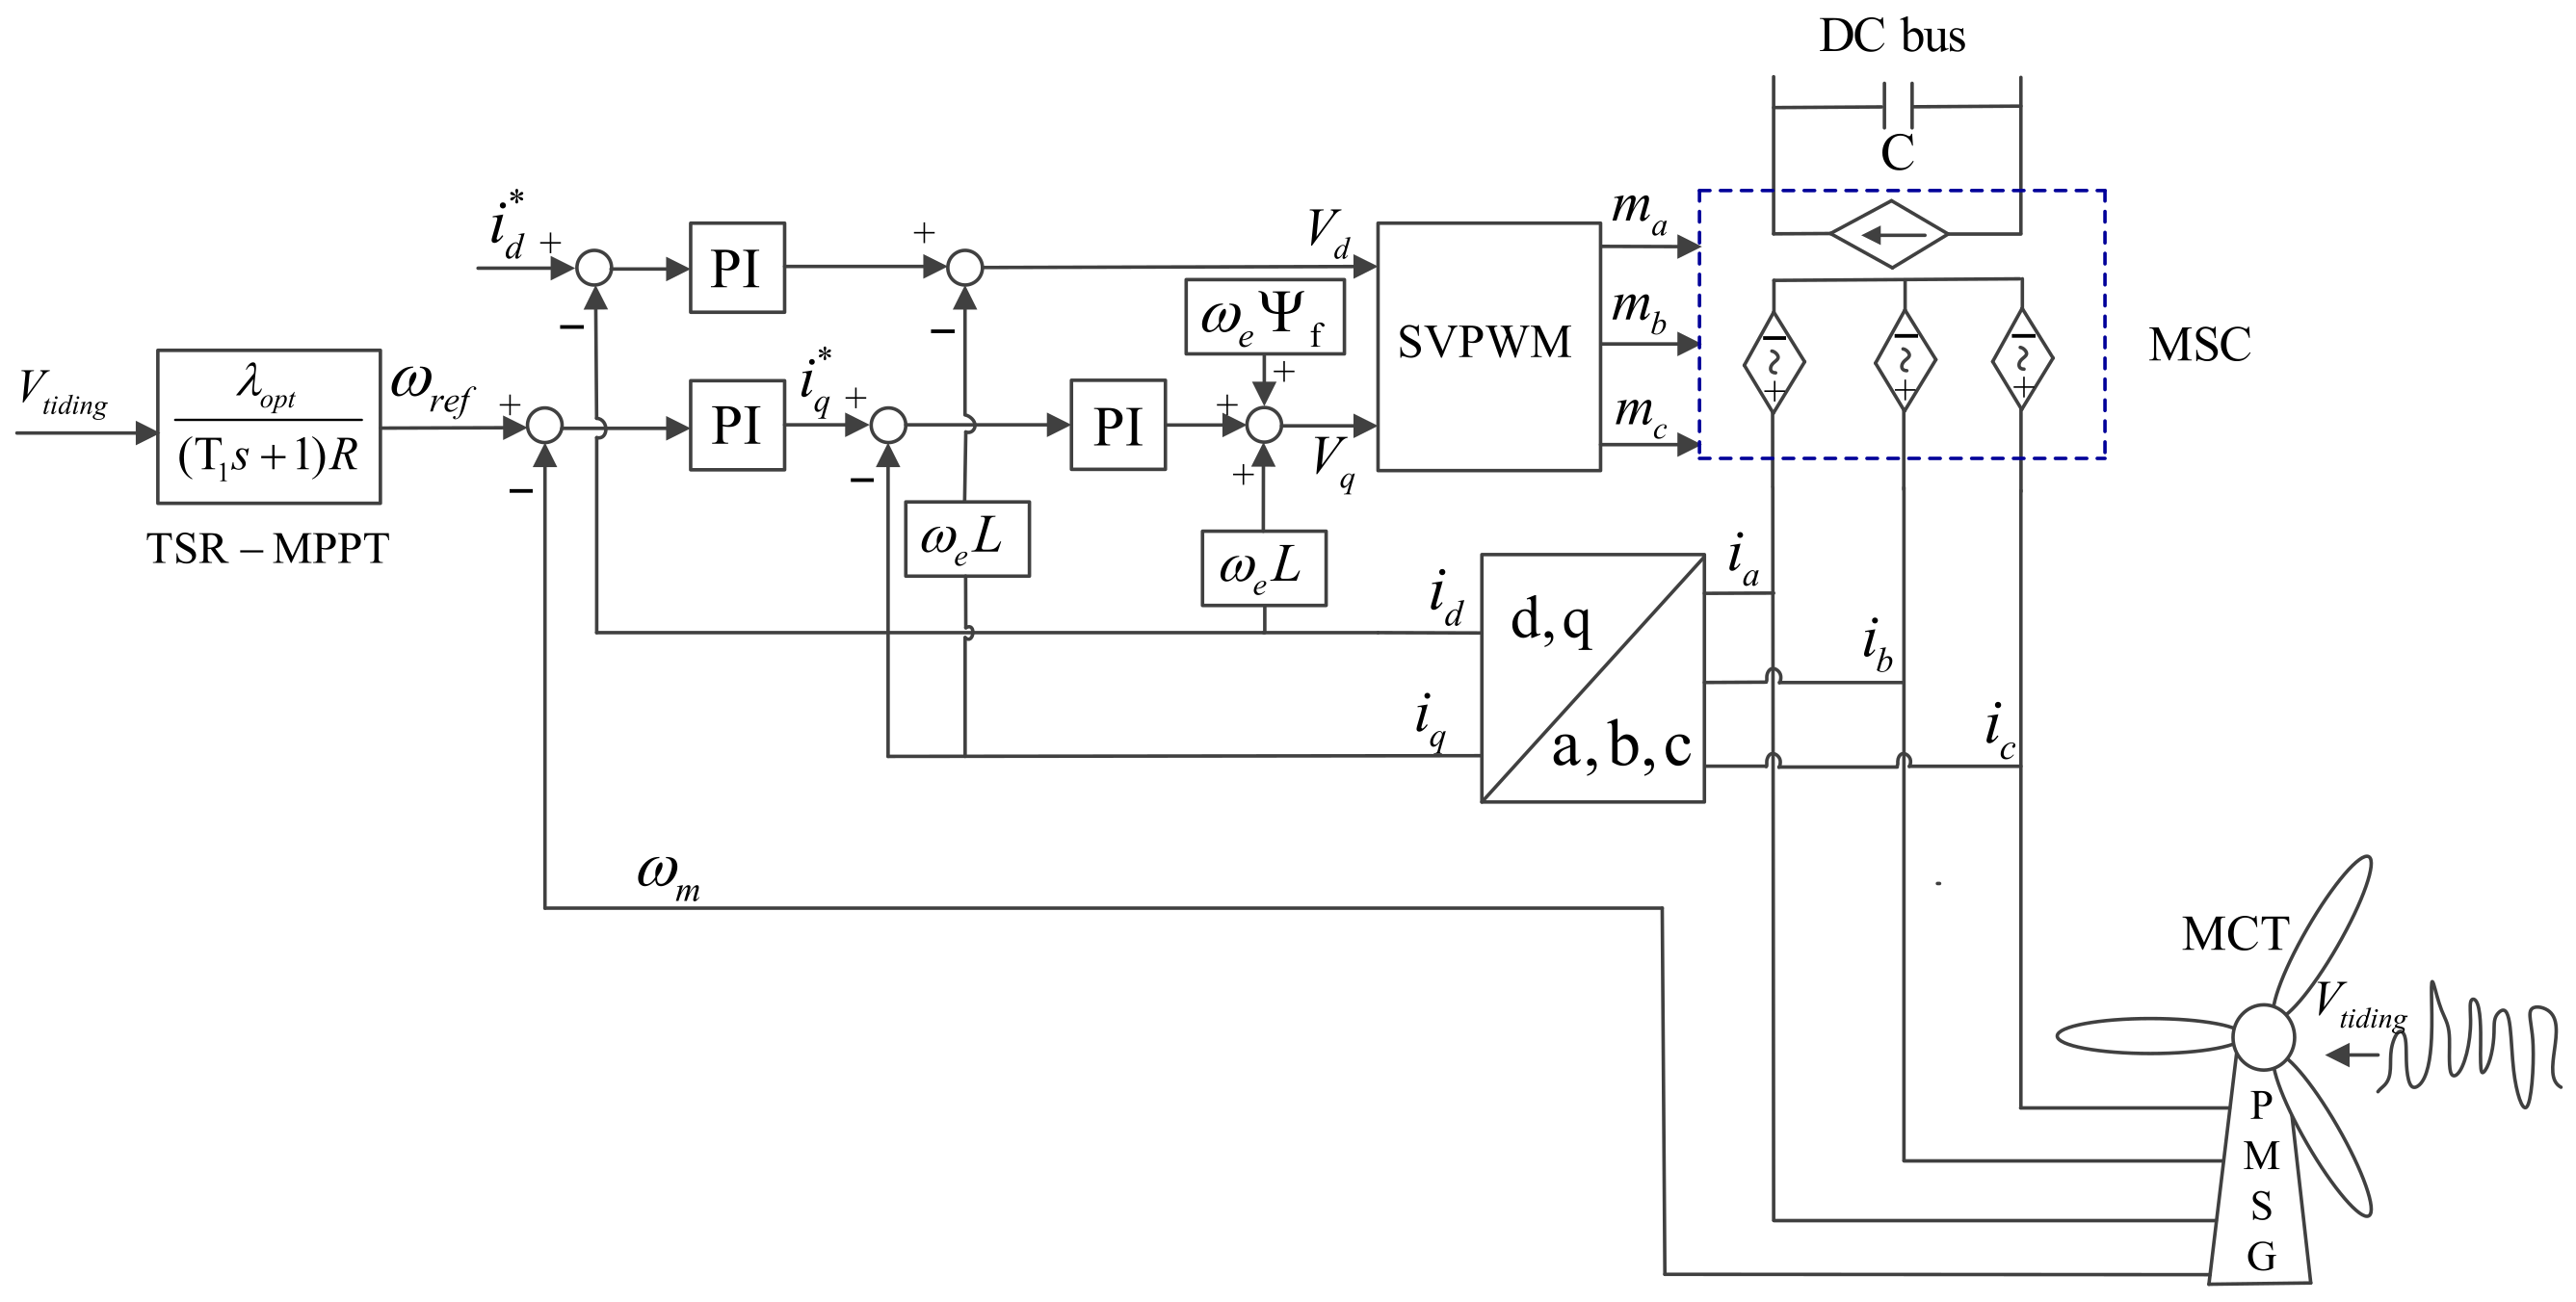
As shown in Figure 3, in the machine-side converter, a low-pass filter [2] is added to the TSR-MPPT strategy to preliminarily smooth the marine current power. Feedforward decoupling and field-oriented vector strategy are applied. The power generated by PMSG is delivered to the DC bus by MSC [26].
In the d–q axis, the torque of PMSG is controlled by the q-axis current. In order to make PMSG generate maximum active power, the current reference value of the d-axis ( )is set to zero, and the current reference value of the q-axis ( ) is decided by the speed loop. The simulation result is as shown in Figure 4.
2.3. Mathematical Model of VRB and SCB
Supercapacitor banks (SCBs) and vanadium redox flow batteries (VRBs) [27] are used to absorb or release required power according to control rules in this paper. SCB has the characteristics of high power density and low energy density, while VRB is famous for high energy density, independent design of power and capacity, long service life, and high efficiency [28].
As shown in Figure 5a, Vsta, Ista, Vbat, Ibat, Rfixed, Cele, respectively, represent battery electromotive force, internal stack current, terminal voltage, terminal current, parasitic resistance, and internal electrode capacitance. Rrea and Rres are the equivalent resistance illustrated in [29,30]. The losses of VRB are mainly distributed in four aspects, namely, δ1, δ2, δ3, and δ4. They represent the internal resistive parasitic loss, external pump loss, internal reaction equivalent impedance loss, and equivalent resistance loss, respectively. The calculation formula of each loss factor [30] is expressed in Equation (6).
where k is a constant; Vbat_min represents the minimum operating voltage of VRB; PstaN is the rated stack power of VRB. As the change of δ1, δ3 and δ4 is very small, they are set as constant values as δ1 = 2%, δ3 = 9%, δ4 = 6% [30] in this paper. The variation of pump loss (δ2) is relevant to the operation power of VRB. Charge efficiency (η1) and discharge efficiency (η2) of VRB are defined as Equations (7) and (8).
where Pbat, Psta, respectively, represent the terminal power and stack power of VRB; Req and CSCB, respectively, represent equivalent resistance and equivalent total capacity [31], as shown in Figure 5b.
2.4. Modeling and Control of the Grid-Side Converter
In the d–q coordinate system, the mathematical model of the grid part can be written as Equation (9).
The control structure of the grid-side converter is shown in Figure 6, where Rg, Lg, ωg represent the equivalent resistance of the grid side, the equivalent inductance of the grid side, and angular frequency of the grid, respectively, while idg, iqg, Vdg, Vqg are the components of grid current and grid voltage in the d–q axis. In this paper, the GSC plays a role in making DC bus voltage constant and reallocates grid-connected power [26].
Active power in the grid-side converter is only related to the current component of the d-axis, while reactive power is only related to the current component of the q-axis. In this paper, the current reference value of the q-axis is set to zero to deliver the maximum active power into the grid. Additionally, in the d-axis, it is a double closed-loop structure of voltage and current. The DC bus voltage is stable by adjusting the grid-connected active power. The simulation result is shown in Figure 7.
2.5. Mathematical Model of Marine Current Velocity
A detailed analysis of the marine current velocity model is made by Ref. [2] and Ref. [23]. The marine current velocity contains two parts, as shown in the formula presented in Equation (10). The first part C is decided by tidal speed (predictable speed), and C is considered as a constant within several minutes. The second part is induced by the swell effect [2], which is mainly caused by wind, waves, and other unknown factors.
It is noticed that the frequency ωi is around 0.05–0.2 Hz, Ai is velocity amplitude under swell effect, and φi is the initial phase angle.
The marine current velocity (as shown in Figure 8) in this paper is the real marine current data between Zhai Ruo Shan island and Xiao Zhai Ruo Shan island of Zhou Shan archipelago, Zhe Jiang Province [32]. In the simulation of this paper, the time scale is very large, and the core problem is to solve the operational efficiency of VRB over 24 h. Therefore, the power disturbance caused by the swell effect is not considered.
3. Energy Management Strategy
3.1. Efficiency Analysis of VRB under Constant Current Charge–Discharge Test
As shown in Figure 9, with the increase of charge and discharge current, the efficiency of VRB initially increases, and after reaching the maximum efficiency, the efficiency of VRB gradually decreases, which indicates that there is an extreme value of efficiency when charge and discharge currents are changed.
The charging efficiency and discharge efficiency of VRB both have maximum values according to Figure 9. However, the maximum values of charging efficiency and discharge efficiency are not at the same point. Under the charging mode, when the current reaches 470 A, the efficiency of VRB reaches the maximum value of 85.96%. Under the discharge state, when the discharge current reaches 388 A, the efficiency of VRB reaches the maximum value of 85.61%. Therefore, controlling the charge and discharge current value of VRB can improve the operational efficiency of VRB.
In order to solve the problem that the efficiency of VRB is low when the charge current value and discharge current value of VRB is lower than the current threshold, an energy management strategy based on rules is proposed in this paper. The goal of the energy management strategy is to improve the efficiency of VRB in the marine current power system by controlling the auxiliary power source (SCB).
3.2. Energy Management Based on Rules Control Strategy
As shown in Figure 10, Pgrid represents the power injected into the grid, and ISCB and IVRB represent the current of the SCB and the VRB, respectively. The dynamic average model is applied to replace the detailed power devices in the bidirectional DC/DC converter [26] in this paper. It is defined that the current flowing into the SCB or VRB is positive, and the current flowing out from the SCB or VRB is negative. The internal control structure of the rule-based control strategy is shown in Figure 11.
As shown in Figure 11, Iger is the current output by PWM rectifier on the PMSG side; Iref represents the reference current of the grid. IHESS represents the reference current of the hybrid energy storage system (HESS). Their relationship is defined as in Equation (11).
when “IHESS > 0”, it means that the output current Iger is greater than the grid reference value Iref. At this moment, the HESS should absorb the excess energy according to (11). Instead, if “IHESS < 0”, which means the HESS should release the required energy based on (11). If “IHESS = 0”, the HESS is in standby mode. According to the energy management strategy in Figure 11, “rule (1)” is applied if the charging current exceeds the threshold value under the charging state (“IHESS > ΔI1”), and “rule (2)” applies in the situation that the charging current does not reach the threshold value under the charging state(“0 < IHESS < ΔI1”). In addition, “rule (3)” is applied when the discharging current does not reach the threshold value under the discharging state(“ΔI2 < IHESS < 0”). If the discharge current has exceeded the discharge threshold (“IHESS < ΔI2”), then “rule (4)” is running. Through the above four rules, the operational efficiency of VRB is improved.
Rule (1): when the current (IHESS) is greater than the current threshold ΔI1 under the charging mode, it means that the charging current is larger. VRB is operated in a high-efficiency state at this stage. Therefore, the current distribution of the hybrid energy storage system is shown in the formula presented in Equation (12).
That is to say, the VRB takes on the task of absorbing all the surplus electric energy, and the SCB is in a standby state.
Rule (2): if the total current (IHESS) is greater than zero but less than the current threshold ΔI1 under the charging mode, it means that the system current is small at this stage, so the reference current distribution principle of VRB and SCB can be determined according to the formula presented in Equation (13).
when the current of the hybrid energy storage system is small, the VRB is charged with the current threshold of ΔI1; meanwhile, the SCB is in a discharged state, and the current of SCB flows into the VRB to maintain the current stability of VRB so as to keep the VRB running in a high-efficiency state.
Rule (3): when the current of the hybrid energy storage system (IHESS) is less than zero but greater than the current threshold ΔI2, the reference current of VRB and SCB can be determined by the formula in Equation (14).
In this state, in order to make VRB keep in a high-efficiency state, the SCB is in a charge mode, which means part of the current from the VRB flows into the DC bus side and another part flows into the SCB. The algebraic sum of the current flowing into the DC bus side and the current flowing into the SCB is the current threshold ΔI2.
Rule (4): if the current of the hybrid energy storage system (IHESS) is less than the current threshold ΔI2, this rule applies. Under this condition, the reference current of VRB and SCB is shown in the formula in Equation (15).
According to (15), the current required is all provided by VRB, and SCB is in the standby state. At this moment, the VRB can still be kept in the high-efficiency range.
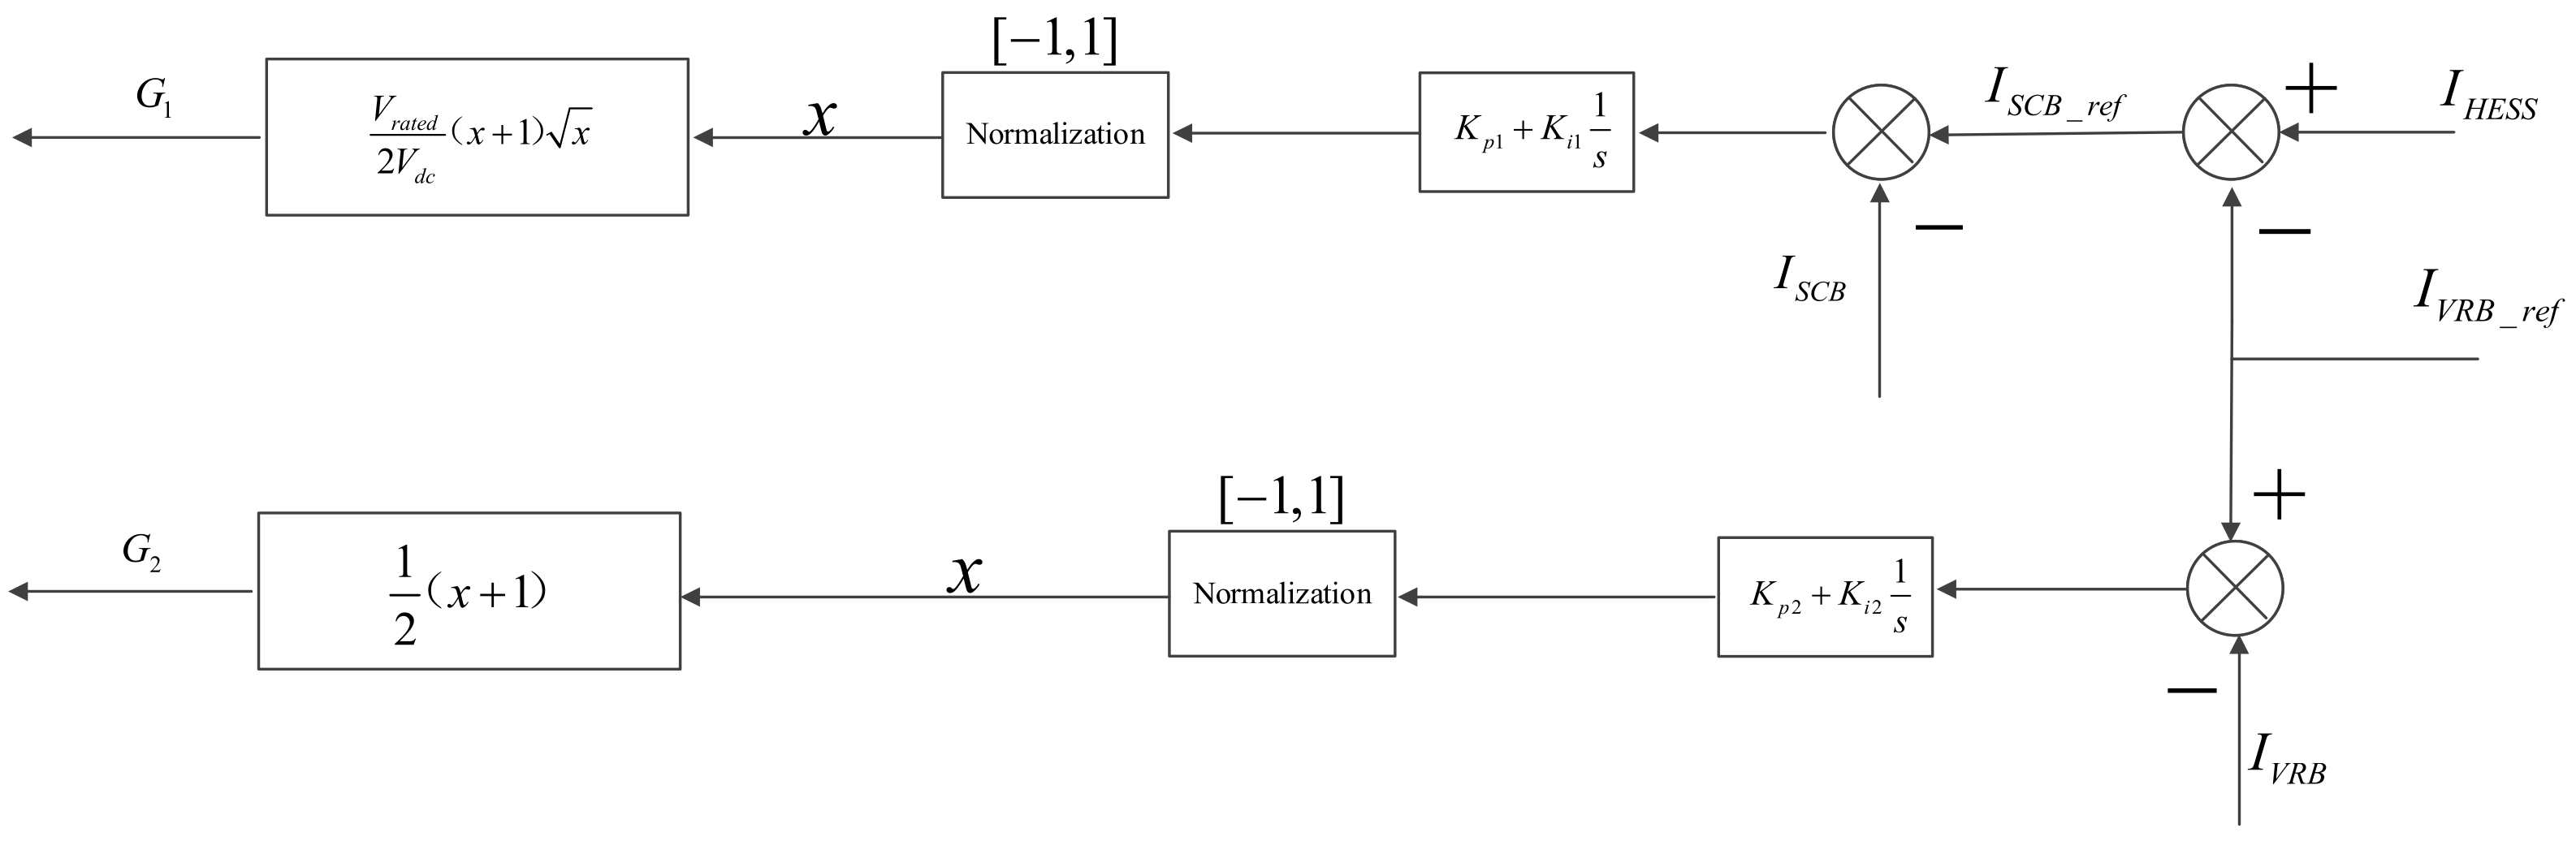
The control structure is shown in Figure 12. The current reference values of SCB and VRB are determined by control rules. Kp1 and Ki1 are parameters of PI controller in the SCB control loop, and their specific values can be found in Appendix A: Table A1. The output value of the PI controller is proportional to the charge or discharge power of SCB. The value of normalization is “0.2 (Vrated)2”. In the same way, Kp2 and Ki2 are parameters of PI controller in the VRB control loop, and their specific values can be found in Appendix A: Table A1. The value of normalization is “20 (Vrated)2”. Additionally, the control signal gain G1 and control signal gain G2 are output values.
In addition, some constraints of SCB and VRB should be required as follows (16):
SOCVRB_min is set as 0.1 and SOCVRB_max is 1, while the value of SOCSCB_min is 0.2, and SOCSCB_max is 1.
4. Simulation Results and Analysis
4.1. Simulation Results Based on Conventional Control Strategy
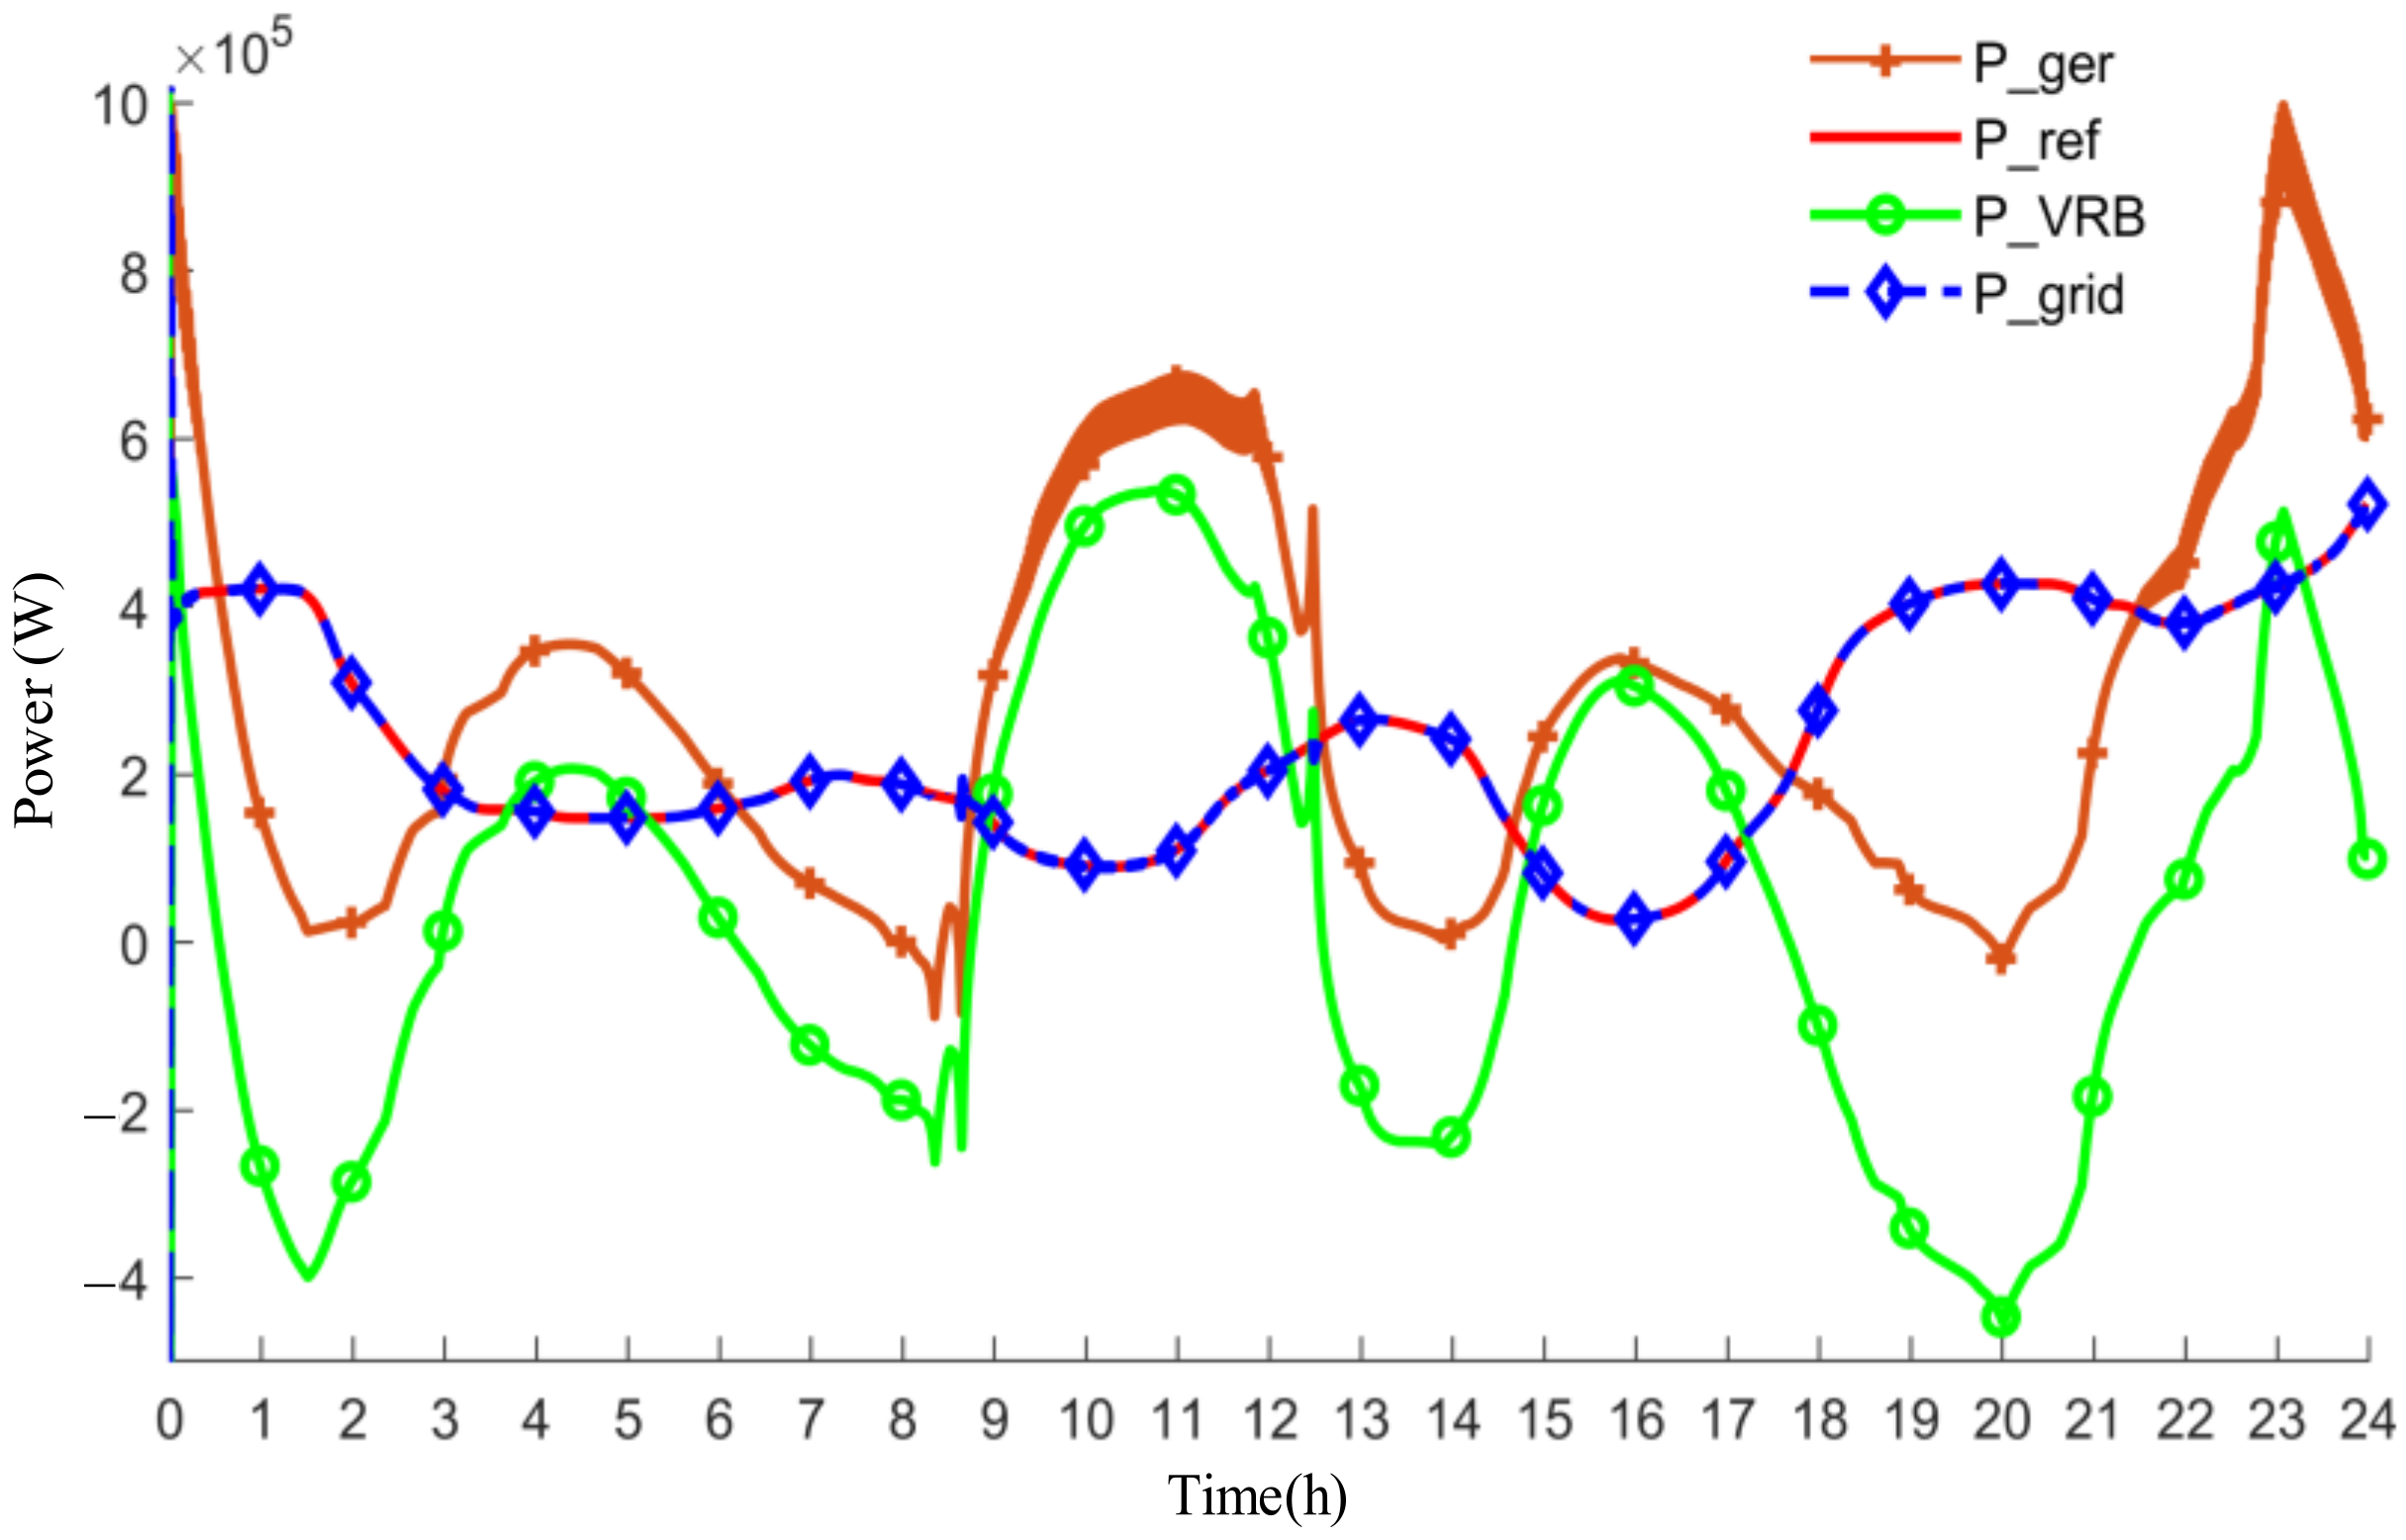
As shown in Figure 13, the conventional control strategy is applied as a comparison [29]. The power of VRB (P_VRB) flows to compensate for the power difference between marine current power (P_ger) and the grid command power (P_ref). However, when the charge current value and discharge current value of VRB are lower than the current threshold as the red dotted line mark in Figure 14, low operational efficiency appears (see Figure 14). Therefore, in order to improve the operational efficiency of VRB, the energy management strategy based on rules’ control is proposed in this paper; detailed rules are illustrated in Section 3.
The charging current threshold “ΔI1” and discharge current threshold “ΔI2” are set as shown in Figure 14.
As shown in Figure 14, the operational efficiency of VRB is in a high-efficiency operation state for most of the time over 24 h. There is a transient low-efficiency state when the charge current value and discharge current value of VRB are lower than the current threshold (“ΔI1” and “ΔI2”). The average efficiency of VRB over 24 h is defined according to the Equation (17).
where η represents the average efficiency of VRB; η1 represents the charge efficiency of VRB; η2 is the discharge efficiency of VRB; Tcharege is the total charging time over 24 h, and Tdischarge is the total discharging time over 24 h. It can be seen that the average efficiency of VRB reaches 70.83% over 24 h.
4.2. Simulation Results Based on Rule-based Control Strategy
Compared with the conventional control strategy, under the control of the rule-based strategy proposed in this paper, the current flows of VRB and SCB over 24 h are shown in Figure 15, respectively. It can be seen that in the rule-based control strategy, the current becomes constant value (see marker “a” of Figure 15) and in order to maintain the current of VRB at a constant state, the SCB is discharged, which is corresponding to the “rule (2)”. As VRB is discharged by constant value “ΔI2” (shown in marker “a” of Figure 15), the SCB is charged, which indicates that “rule (3)” is running at this stage. As shown in marker “b” of Figure 15, if the current of VRB is higher than the threshold value “ΔI1”, the current of VRB remains the same as the current of the hybrid energy storage system (IHESS), and the SCB is in a standby state, which is corresponding to the “rule (1)”. When the VRB is in discharge state and the discharge current is less than the threshold value “ΔI2”, the current of VRB is equal to the current of the hybrid energy storage system (IHESS), as shown in marker “c” of Figure 15, and the SCB is still in a standby mode according to the “rule (4)”. Simulation results verify the effectiveness of the energy management strategy based on rules. Due to the constant current control near the zero-crossing point, the charging and discharging efficiency of VRB is significantly improved, which can be maintained in the range of 70–88% (shown in Figure 15). According to (17), the average efficiency of VRB reaches 80.01% over 24 h.
It is worth noting that in this paper, the time scale is over 24 h, and the core problem is to solve the operational efficiency of VRB over 24 h; therefore, the power disturbance caused by the swell effect is not considered.
BMOD0094 P075 B02 Maxwell module (CSC = 94 F, VSC = 75 V, RSC = 13 mΩ) is modelled in this paper, the rated voltage is set to 750 V, which means 10 SC cells are needed in series (Ns = 10). The SOCSCB range is set from 0.2 to 1. According to (18), Vmin and Vmax can be calculated.
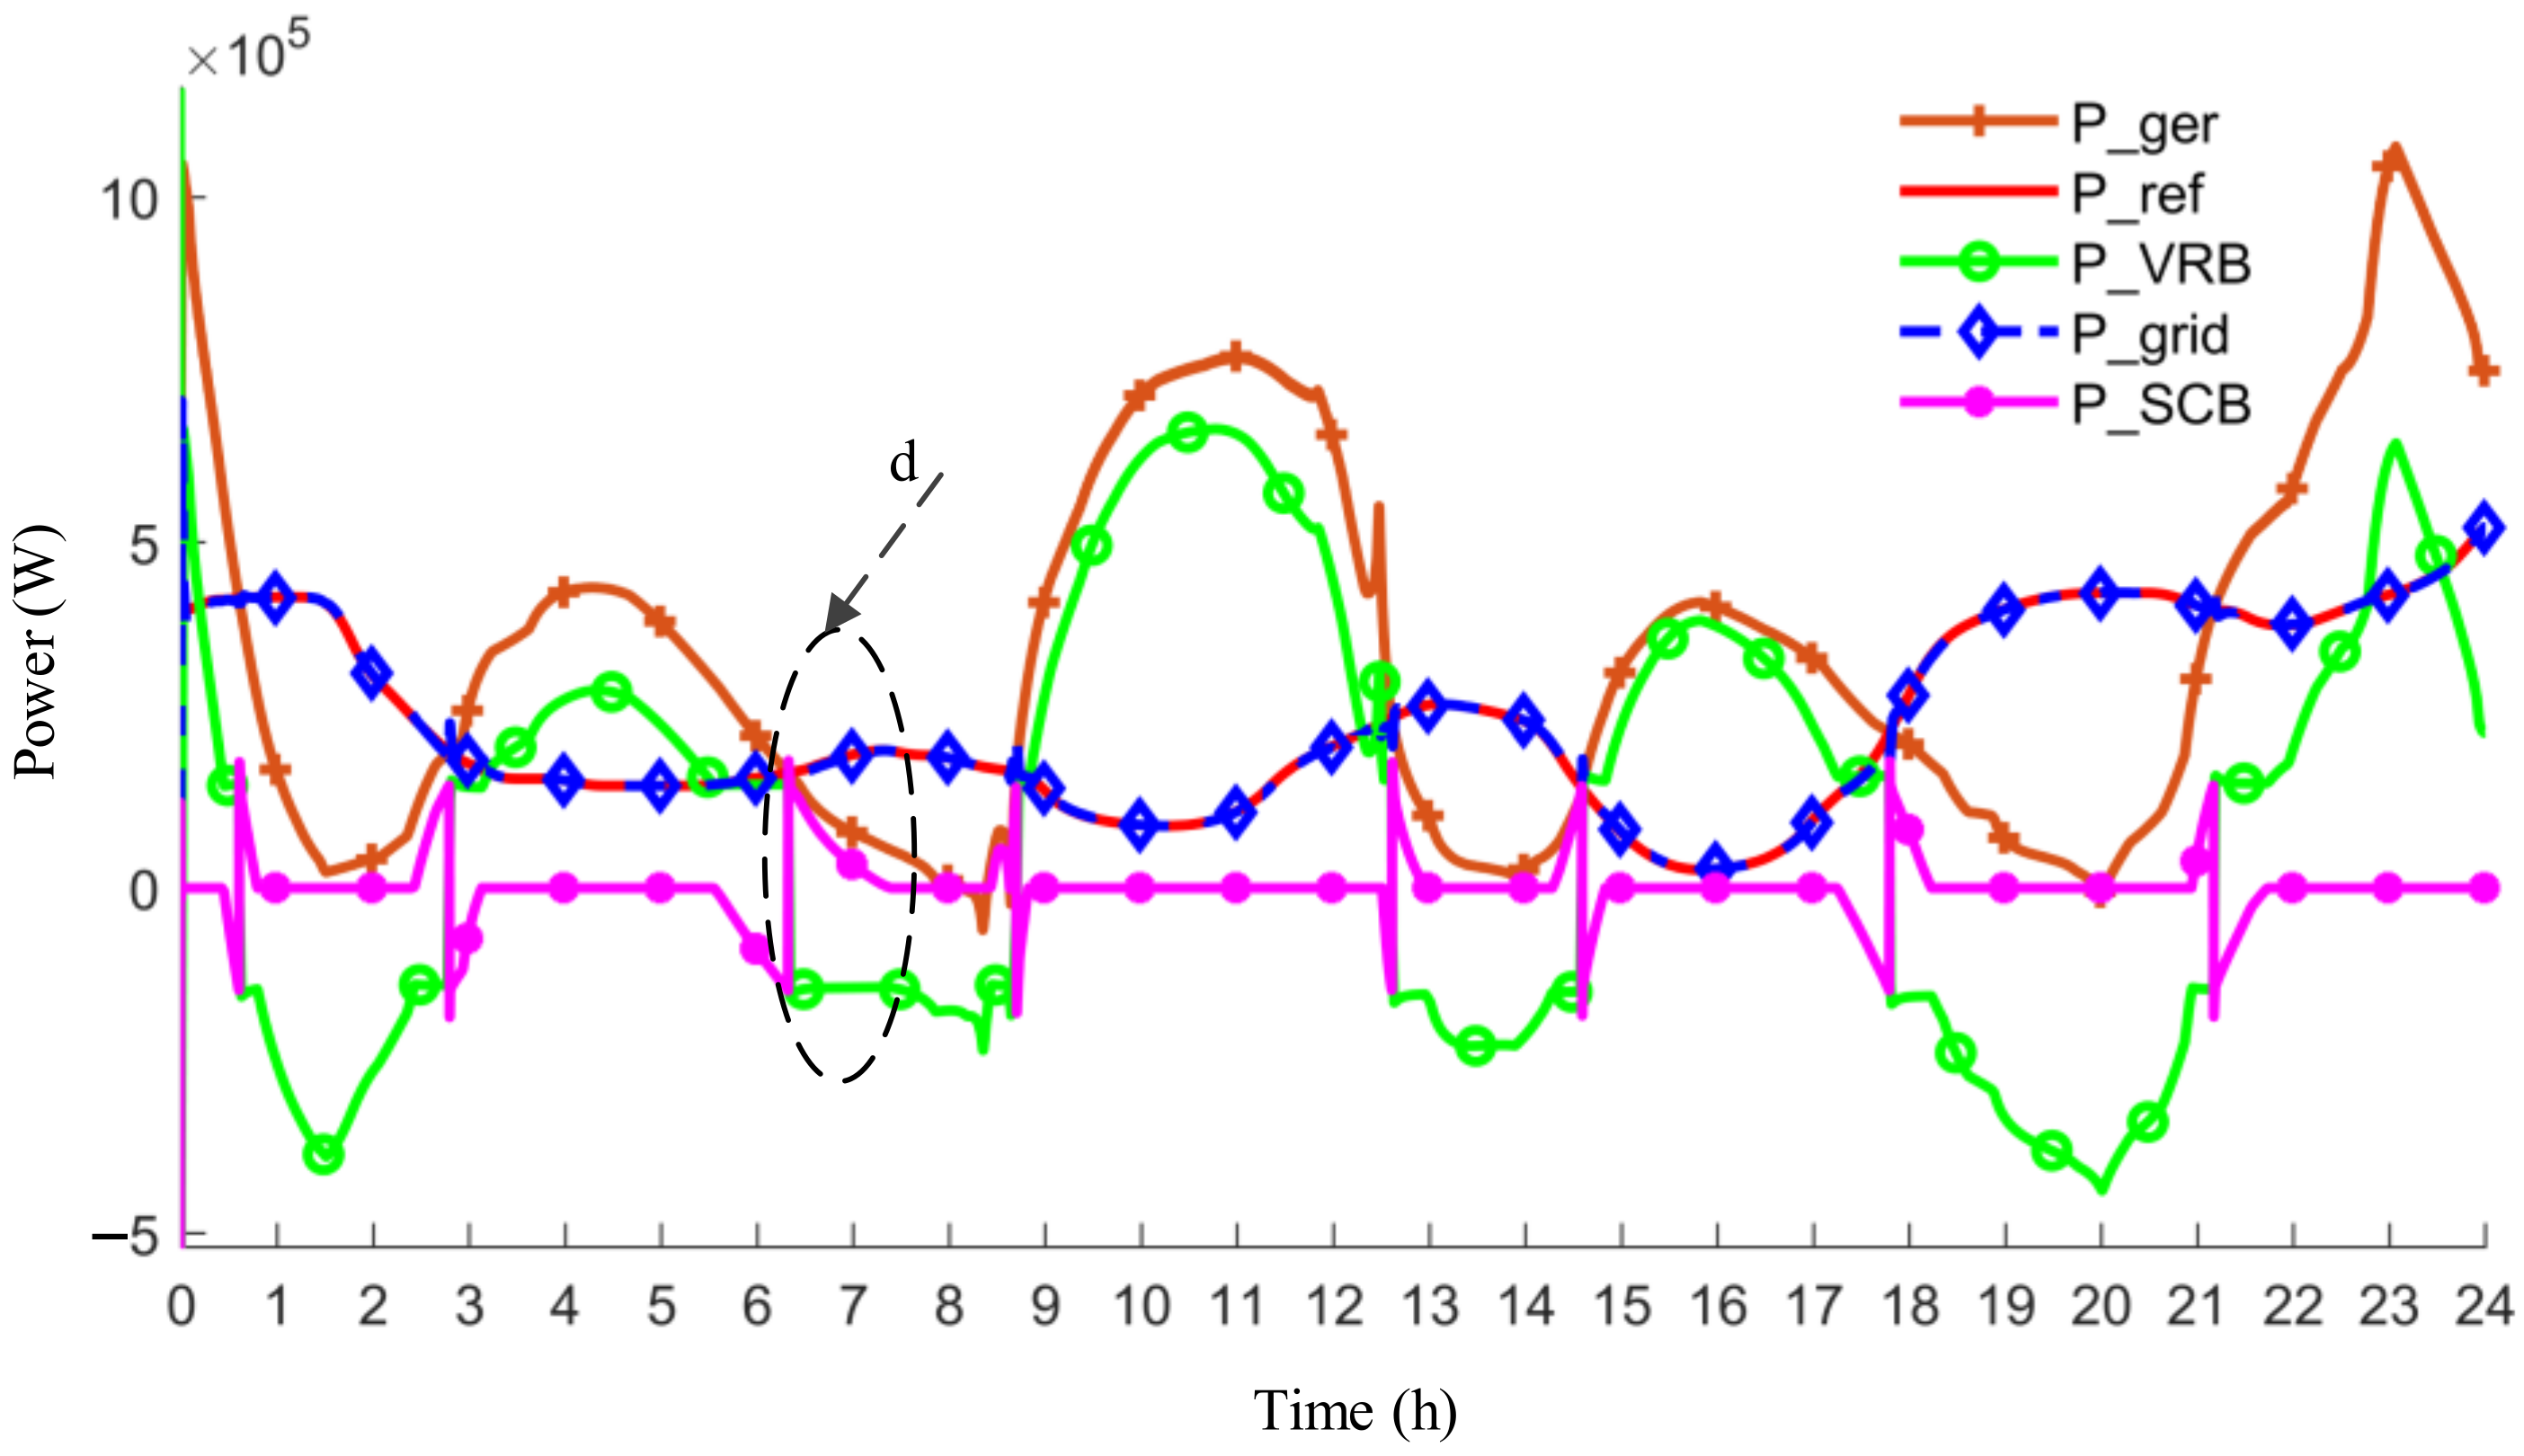
The available capacity Er is 0.56 kWh. The rated power and capacity of the SCB are determined according to the mark “d” in Figure 16. As the charging time of the SCB is the longest over 24 h, it is reasonable to select this time period to determine the rated capacity. The maximum charging power of SCB in Figure 16 is 150 kW. The safety margin is considered in the primary estimation; therefore, the rated power of SCB is 200 kW. The time period under a rated-capacity power is half an hour, so the rated capacity of SCB is 100 kWh. The above series capacitor banks are regarded as a group, and then 500 groups (NP = 500) are paralleled to meet the requirements of rated capacity. Therefore, the equivalent model of the SCB system is shown in Equation (19).
VRB plays an essential role in compensating the difference between marine current power and grid command power so that the final grid-connected power follows the grid reference power. The rated power of VRB is decided based on Equation (20).
Considering battery efficiency and safety margin, the rated power PVRB_rated is set as 1 MW, and the rated capacity is 3 MWh. This size makes it possible for VRB to compensate for power differences under extreme marine conditions.
As shown in Figure 16, the mark “d” is used to determine the rated power and capacity of the SCB; P_ger is the marine current power captured by PMSG; P_ref is the grid-connected power command; P_grid represents the final real = 0 time grid-connected power; P_VRB is the real-time power of VRB. If P_VRB is positive, VRB is in charge mode; otherwise, it is in discharge mode. P_SCB is the real-time power of the SCB and its power is positive in the charging state and negative in discharging state. Under the energy management strategy based on a rule-based control strategy, the final actual grid-connected power (P_grid) can track the grid power command (P_ref) very well.
The operational state of the four control rules over 24 h is shown in Figure 17. It can be seen that “rule (1)” and “rule (4)” are running for a long time over 24 h, which validates SCB as an auxiliary power source because it is at a standby state for most of the time during the whole day.
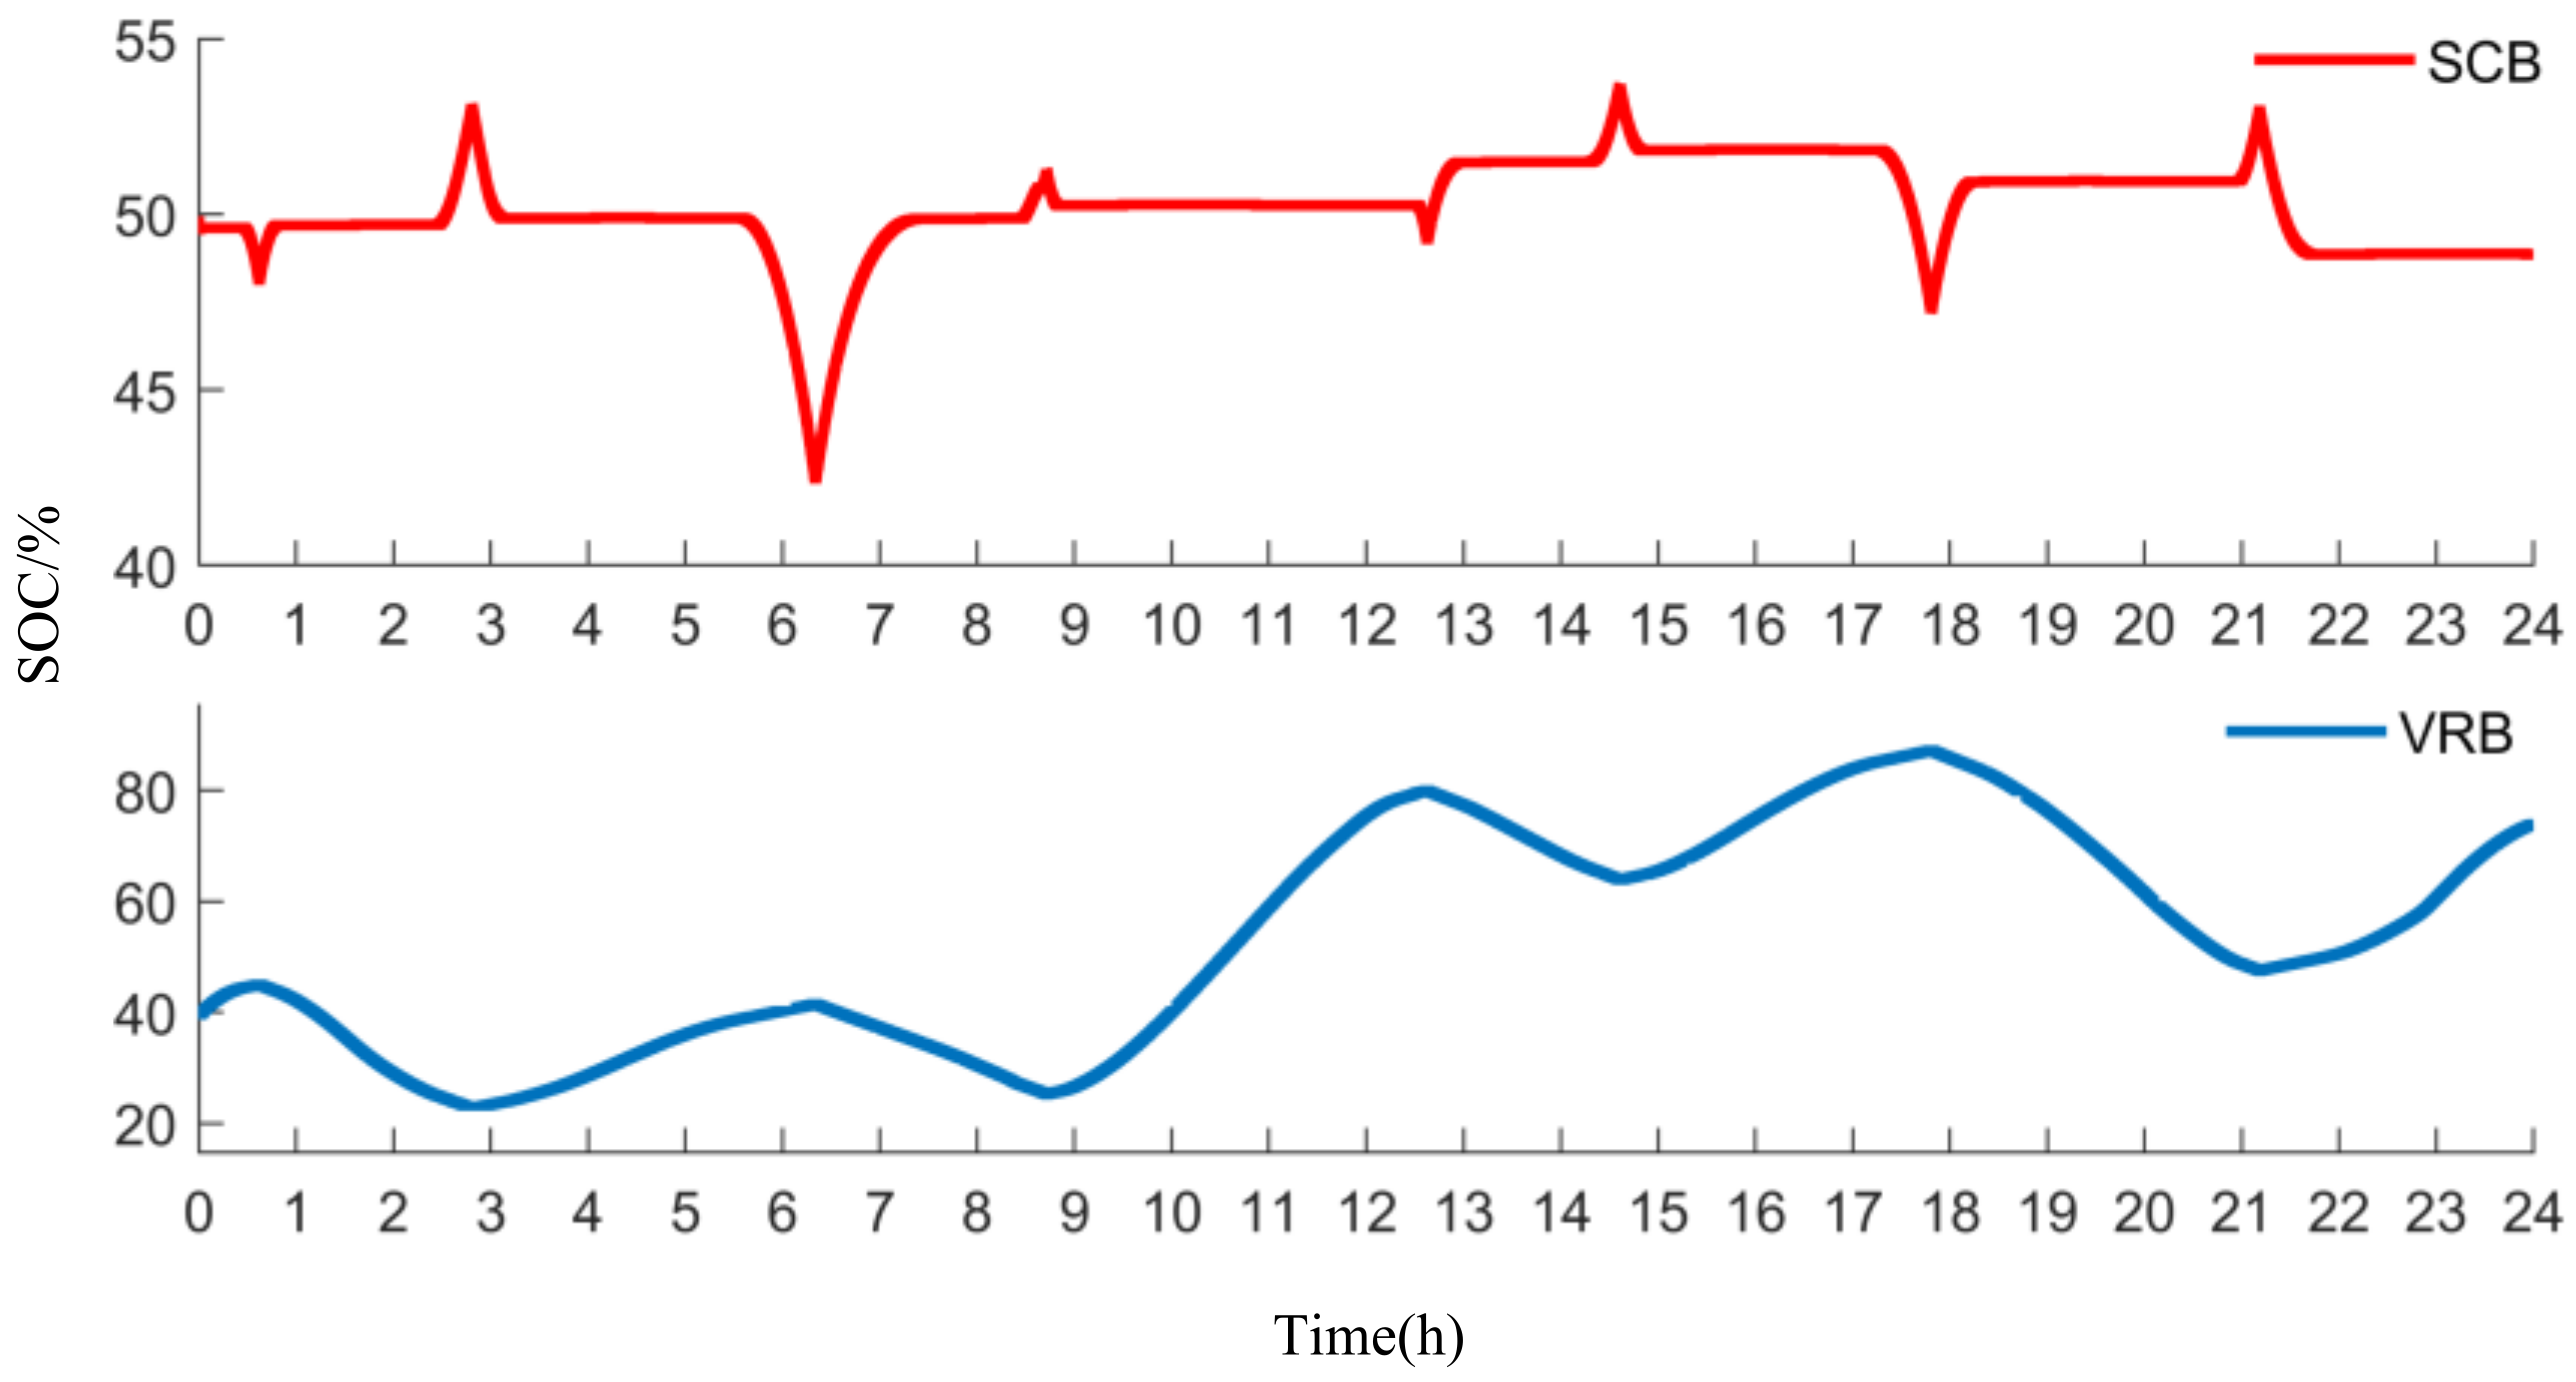
The SOC of VRB and SCB over 24 h is shown in Figure 18. It can be seen that under the control of the rule-based control energy management strategy, the SOC of VRB and SCB are both in a reasonable range. The initial SOC of VRB is set for 0.4, while the initial SOC of SCB is 0.5.
5. Conclusions
This paper proposes an energy management strategy based on rules to compensate for the fluctuating power caused by tidal motion while improving the operational efficiency of VRB. The marine current power system is underwater and its maintenance is not convenient. Therefore, a simple structure, higher reliability, and better control performance are the main considerations of the energy management algorithm. The simulation results indicate that VRB can make the grid-connected power track the grid command power based on both the conventional control strategy and the rule-based control strategy proposed in this paper. However, in this paper, SCB is applied as the auxiliary power source to absorb or release power according to control rules. Therefore, the operational efficiency of VRB is significantly improved, which can be maintained in the range of 70–88%. The average efficiency is 80.01%, while the average efficiency is 70.93% based on the conventional control strategy. Therefore, the energy management based on the rule-based control strategy has better control performance than the conventional control strategy. The feasibility and effectiveness of the energy management strategy are verified based on a 3 MW marine current power system established in MATLAB/SIMULINK.
Author Contributions
Conceptualization, methodology, J.H.; software, validation, formal analysis, X.L.; data curation, writing—original draft preparation, X.L.; writing—review and editing, J.H. and T.T. All authors have read and agreed to the published version of the manuscript.
Funding
This research received no external funding.
Institutional Review Board Statement
This study does not involve humans or animals.
Informed Consent Statement
Not applicable.
Data Availability Statement
The data that support the findings of this study are available from the corresponding author upon reasonable request.
Conflicts of Interest
The authors declare no conflict of interest.
Appendix A

Table A1.
Main simulation parameters of the system.
| Order Number | Parameters | Values |
|---|---|---|
| 1 | R | 9 m (space) |
| 2 | Rs | 0.008 Ω |
| 3 | Ld = Lq | 1.2 mH |
| 4 | 2.46 Wb | |
| 5 | Pole pair number (Pn) | 125 |
| 6 | J | 1.3 × 10⁶ kg.m2 |
| 7 | Rated phase voltage of PMSG | 690 V (RMS) |
| 8 | Rated phase current of PMSG | 1600 A (RMS) |
| 9 | Rated voltage of MSC and GSC | 690 V (RMS) |
| 10 | Rated current of MSC and GSC | 3320 A (RMS) |
| 11 | Rfixed | 54 Ω |
| 12 | Rrea | 0.14 Ω |
| 13 | Rres | 0.09 Ω |
| 14 | Cele | 5.6 mF |
| 15 | Rg | 0.1 mΩ |
| 16 | Lg | 1.5 mH |
| 17 | ωg | 100π Hz |
| 18 | Kp1 | 7.6 |
| 19 | Ki1 | 883 |
| 20 | Kp2 | 0.6 |
| 21 | Ki2 | 0.8 |
| 22 | ΔI1 | 100 A |
| 23 | ΔI2 | −100 A |
References
- Chen, H.; Tang, T.; Aït-Ahmed, N.; Benbouzid, M.E.H.; Machmoum, M.; Zaïm, M.E. Attraction, Challenge and Current Status of Marine Current Energy. IEEE Access. 2018, 6, 12665–12685. [Google Scholar] [CrossRef]
- Zhou, Z.; Scuiller, F.; Charpentier, J.F.; Benbouzid, M.E.H.; Tang, T. Power Smoothing Control in a Grid-Connected Marine Current Turbine System for Compensating Swell Effect. IEEE Trans. Sustain. Energy 2013, 4, 816–826. [Google Scholar] [CrossRef] [Green Version]
- Aznavi, S.; Fajri, P.; Asrari, A.; Sabzehgar, R. Energy Management of Multi-Energy Storage Systems Using Energy Path Decomposition. In Proceedings of the 2019 IEEE Energy Conversion Congress and Exposition, Baltimore, MD, USA, 29 September–3 October 2019; pp. 5747–5752. [Google Scholar]
- Barchi, G.; Miori, G.; Moser, D.; Papantoniou, S. A Small-Scale Prototype for the Optimization of PV Generation and Battery Storage through the Use of a Building Energy Management System. In Proceedings of the 2018 IEEE International Conference on Environment and Electrical Engineering and 2018 IEEE Industrial and Commercial Power Systems Europe, Palermo, Italy, 12–15 June 2018; pp. 1–5. [Google Scholar]
- Gu, Y.J.; Lin, Y.G.; Xu, Q.K. Blade-pitch system for tidal current turbines with reduced variation pitch control strategy based on tidal current velocity preview. Renew. Energy 2018, 115, 149–158. [Google Scholar] [CrossRef]
- Whitby, B.; Ugalde-Loo, C.E. Performance of Pitch and Stall Regulated Tidal Stream Turbines. IEEE Trans. Sustain. Energy 2014, 5, 64–72. [Google Scholar] [CrossRef]
- Gu, Y.J.; Yin, X.X.; Liu, H.W. Fuzzy terminal sliding mode control for extracting maximum marine current energy. Energy 2015, 90, 258–265. [Google Scholar] [CrossRef]
- Benelghali, S.; Benbouzid, M.E.H.; Charpentier, J.F.; Ahmed-Ali, T.; Munteanu, I. Experimental Validation of a Marine Current Turbine Simulator: Application to a Permanent Magnet Synchronous Generator-Based System Second-Order Sliding Mode Control. IEEE Trans. Ind. Electron. 2011, 58, 118–126. [Google Scholar] [CrossRef] [Green Version]
- Borhan, H.; Vahidi, A.; Phillips, A.M.; Kuang, M.L.; Kolmanovsky, I.V.; di Cairano, S. MPC-Based Energy Management of a Power-Split Hybrid Electric Vehicle. IEEE Trans. Control Syst. Technol. 2012, 20, 593–603. [Google Scholar] [CrossRef]
- Xie, Y.; Wang, C.; Hu, X.; Lin, X.; Zhang, Y.; Li, W. An MPC-Based Control Strategy for Electric Vehicle Battery Cooling Considering Energy Saving and Battery Lifespan. IEEE Trans. Veh. Technol. 2020, 69, 14657–14673. [Google Scholar] [CrossRef]
- Bonab, S.A.; Emadi, A. MPC-Based Energy Management Strategy for an Autonomous Hybrid Electric Vehicle. IEEE Trans. Ind. Appl. 2020, 1, 171–180. [Google Scholar] [CrossRef]
- Zhu, Y.; Zhao, R.; Zhao, J. Output power smoothing control for the PMSG based wind farm by using the allocation of the wind turbines. In Proceedings of the 2017 20th International Conference on Electrical Machines and Systems, Sydney, NSW, Australia, 11–14 August 2017; pp. 1–6. [Google Scholar]
- Feng, Z. Energy Management Strategy of Microgrid Based on Fuzzy Control. In Proceedings of the 2018 2nd IEEE Advanced Information Management Communicates Electronic and Automation Control Conference, Xi’an, China, 25–27 May 2018; pp. 1667–1670. [Google Scholar]
- Dou, C.; Yue, D.; Li, X.; Xue, Y. MAS-Based Management and Control Strategies for Integrated Hybrid Energy System. IEEE Trans. Ind. Inform. 2016, 12, 1332–1349. [Google Scholar] [CrossRef]
- Chang, J.; Jia, S. Modeling and application of wind-solar energy hybrid power generation system based on multi-agent technology. In Proceedings of the 2009 International Conference on Machine Learning and Cybernetics, Baoding, China, 12–15 July 2009; pp. 1754–1758. [Google Scholar]
- Liu, Z.; Høidalen, H.K. A simple multi agent system based adaptive relay setting strategy for distribution system with wind generation integration. In Proceedings of the 13th International Conference on Development in Power System Protection, Edinburgh, UK, 7–10 March 2016; pp. 1–6. [Google Scholar]
- Llerena-Pizarro, O.; Proenza-Perez, N.; Tuna, C.E.; Silveira, J.L. A PSO-BPSO Technique for Hybrid Power Generation System Sizing. IEEE Lat. Am. Trans. 2020, 18, 1362–1370. [Google Scholar] [CrossRef]
- Priyadarshi, N.; Padmanaban, S.; Holm-Nielsen, J.B.; Blaabjerg, F.; Bhaskar, M.S. An Experimental Estimation of Hybrid ANFIS–PSO-Based MPPT for PV Grid Integration Under Fluctuating Sun Irradiance. IEEE Syst. J. 2020, 14, 1218–1229. [Google Scholar] [CrossRef]
- Cheng, S.; Su, G.; Zhao, L.; Huang, T. Dynamic dispatch optimization of microgrid based on a QS-PSO algorithm. J. Renew. Sustain. Energy 2017, 9, 045505. [Google Scholar] [CrossRef]
- Zang, T.; Wang, Y.; Sun, H.; He, Z. Variable parameter Kalman filter based dynamic harmonic state estimation for power systems with wind energy integration. In Proceedings of the 2017 IEEE Conference on Energy Internet and Energy System Integration, Beijing, China, 26–28 November 2017; pp. 1–5. [Google Scholar]
- Liu, H.; Hu, F.; Su, J.; Wei, X.; Qin, R. Comparisons on Kalman-Filter-Based Dynamic State Estimation Algorithms of Power Systems. IEEE Access. 2020, 8, 51035–51043. [Google Scholar] [CrossRef]
- Anagnostou, G.; Pal, B.C. Derivative-Free Kalman Filtering Based Approaches to Dynamic State Estimation for Power Systems with Unknown Inputs. IEEE Trans. Power Syst. 2018, 33, 116–130. [Google Scholar] [CrossRef]
- Daus, P.; Biskup, F.; Riedelbauch, S. Performance prediction of a tidal in-stream current energy converter and site assessment next to Jindo, South Korea. J. Renew. Sustain. Energy 2015, 7, 061707. [Google Scholar]
- Bensalah, A.; Benhamida, M.A.; Barakat, G.; Amara, Y. Large wind turbine generators: State-of-the-art review. In Proceedings of the 2018 XIII International Conference on Electrical Machines, Alexandroupoli, Greece, 3–6 September 2018; pp. 2205–2211. [Google Scholar]
- Wang, Y.; Yu, M.; Li, Y. Improved multi-objective model predictive control of permanent magnetic synchronous generator wind power system. J. Renew. Sustain. Energy 2015, 7, 053104. [Google Scholar] [CrossRef]
- Chiniforoosh, S. Definitions and Applications of Dynamic Average Models for Analysis of Power Systems. IEEE Trans. Power Deliv. 2010, 25, 2655–2669. [Google Scholar] [CrossRef]
- Sufyan, M.; Rahim, N.A.; Aman, M.M.; Tan, C.K.; Raihan, S.R.S. Sizing and applications of battery energy storage technologies in smart grid system: A review. J. Renew. Sustain. Energy 2019, 11, 014105. [Google Scholar] [CrossRef]
- Li, W.; Joos, G.; Belanger, J. Real-Time Simulation of a Wind Turbine Generator Coupled with a Battery Supercapacitor Energy Storage System. IEEE Trans. Ind. Electron. 2010, 57, 1137–1145. [Google Scholar] [CrossRef]
- Chahwan, J.; Abbey, C.; Joos, G. VRB Modelling for the Study of Output Terminal Voltages, Internal Losses and Performance. In Proceedings of the 2007 IEEE Canada Electrical Power Conference, Montreal, QC, Canada, 25–26 October 2007; pp. 387–392. [Google Scholar]
- Zhou, Z.; Seuiller, F.; Charpentier, J.F.; Benbouzid, M.; Tang, T. Application of flow battery in marine current turbine system for daily power management. In Proceedings of the 2014 First International Conference on Green Energy, Sfax, Tunisia, 25–27 March 2014; pp. 8–13. [Google Scholar]
- Zhou, Z.; Benbouzid, M.; Charpentier, J.F.; Scuiller, F.; Tang, T. Energy storage technologies for smoothing power fluctuations in marine current turbines. In Proceedings of the 2012 IEEE International Symposium on Industrial Electronics, Hangzhou, China, 28–31 May 2012; pp. 1425–1430. [Google Scholar]
- Xu, Q. Research on Load Analysis and Control for Horizontal Axis Marine Current Turbine. Ph.D. Thesis, Zhejiang University, Zhejiang, China, 2018. [Google Scholar]
Figure 1.
System structure.

Figure 2.
The curve of coefficient (CP) and tip speed ratio (λ).

Figure 3.
Control structure of the machine-side converter.

Figure 4.
Rotor speed and d–q axis current in the machine-side converter.

Figure 5.
(a) Equivalent circuit model of VRB; (b) equivalent circuit model of SCB.

Figure 6.
Control structure of the grid-side converter.

Figure 7.
DC bus voltage and d–q axis current of GSC.

Figure 8.
Tidal speed for 24 h.

Figure 9.
Current–efficiency curve of VRB.

Figure 10.
Control structure based on rule-based control strategy.

Figure 11.
Internal control structure of rule-based control strategy.

Figure 12.
Control structure of SCB and VRB.

Figure 13.
Power flow of marine current power system over 24 h based on conventional control strategy.
Figure 13.
Power flow of marine current power system over 24 h based on conventional control strategy.

Figure 14.
Current flow and operational efficiency of VRB over 24 h based on conventional control strategy.
Figure 14.
Current flow and operational efficiency of VRB over 24 h based on conventional control strategy.

Figure 15.
Current flow of HESS and operational efficiency of VRB over 24 h based on rule-based control strategy.
Figure 15.
Current flow of HESS and operational efficiency of VRB over 24 h based on rule-based control strategy.

Figure 16.
Power flow of marine current power system over 24 h in the rule-based control strategy.

Figure 17.
Operational state of rules over 24 h.

Figure 18.
SOC of VRB and SCB over 24 h based on rule-based control strategy.

Publisher’s Note: MDPI stays neutral with regard to jurisdictional claims in published maps and institutional affiliations. |
© 2021 by the authors. Licensee MDPI, Basel, Switzerland. This article is an open access article distributed under the terms and conditions of the Creative Commons Attribution (CC BY) license (https://creativecommons.org/licenses/by/4.0/).
Share and Cite
MDPI and ACS Style
Han, J.; Li, X.; Tang, T. Energy Management Using a Rule-Based Control Strategy of Marine Current Power System with Energy Storage System. J. Mar. Sci. Eng. 2021, 9, 669. https://0-doi-org.brum.beds.ac.uk/10.3390/jmse9060669
AMA Style
Han J, Li X, Tang T. Energy Management Using a Rule-Based Control Strategy of Marine Current Power System with Energy Storage System. Journal of Marine Science and Engineering. 2021; 9(6):669. https://0-doi-org.brum.beds.ac.uk/10.3390/jmse9060669
Chicago/Turabian StyleHan, Jingang, Xu Li, and Tianhao Tang. 2021. "Energy Management Using a Rule-Based Control Strategy of Marine Current Power System with Energy Storage System" Journal of Marine Science and Engineering 9, no. 6: 669. https://0-doi-org.brum.beds.ac.uk/10.3390/jmse9060669
Note that from the first issue of 2016, this journal uses article numbers instead of page numbers. See further details here.