Article

Trends in Vessel Atmospheric Emissions in the Central Mediterranean over the Last 10 Years and during the COVID-19 Outbreak

1
Department of Geosciences, University of Malta, MSD 2080 Msida, Malta
2
Malta Competition and Consumer Affairs Authority, HMR 9010 Blata L-Bajda, Malta
3
Smytec Ltd., Spalding PE12 0XX, UK
4
Finnish Meteorological Institute, 00101 Helsinki, Finland
5
Institute of Earth Systems, University of Malta, MSD 2080 Msida, Malta
*
Author to whom correspondence should be addressed.
J. Mar. Sci. Eng. 2021, 9(7), 762; https://0-doi-org.brum.beds.ac.uk/10.3390/jmse9070762
Submission received: 19 May 2021 / Revised: 15 June 2021 / Accepted: 29 June 2021 / Published: 11 July 2021
(This article belongs to the Section Marine Environmental Science)

Abstract

:
Giordan Lighthouse, located on the island of Gozo in the Malta-Sicily Channel within the central Mediterranean region, is ideally located to study the primary sources of atmospheric pollution. A total of 10 years of data have been accumulated from the reactive gas and greenhouse gas detectors and the aerosol analyzers found at this Global Atmosphere Watch (GAW) regional station. The data has been evaluated, resulting in trends in emissions from shipping recorded within the same region coming to the fore. The other source of emissions that was evident within the recorded data originated from Mt. Etna, located on the island of Sicily and representing the highest active volcano in Europe. The aim of this paper is to investigate the effect of ship emissions on trace gases and aerosol background measurements at Giordan Lighthouse, including the putative influence of COVID-19 on the same emissions. The model used to evaluate ship emissions was the Ship Traffic Emission Assessment Model (STEAM). From trace gas measurements at Giordan Lighthouse, a slowly decreasing trend in sulfur oxide (SOx) and nitrogen oxide (NOx) emissions was noted. To better understand the air quality results obtained, the STEAM model was fed, as an input, an Automatic Identification System (AIS) dataset to describe the vessel activity in the area concerned. This study also investigates the effects of the COVID19 pandemic on marine traffic patterns within the area and any corresponding changes in the air quality. Such an analysis was carried out through the use of SENTINEL 5 data.

1. Introduction

Little was known about the state of the atmosphere in the Malta-Sicily Channel in the central Mediterranean up to the early 1990s. The Atmospheric Pollution Research Group at the University of Malta started investigating atmospheric pollution in 1996 through the deployment of an ozone (O3) monitor and, later, carbon monoxide (CO) and sulfur dioxide (SO2) monitors, which are located at Giordan Lighthouse on the island of Gozo (36°4′24″ N; 14°13′9″ E) [1]. This site was established as a Global Atmosphere Watch (GAW) station in 2001 and, in 2010, was upgraded to a fully-fledged station through the European Regional Development Fund (ERDF) allocated to Malta following accession to the European Union. An operational center with additional instruments was established at the University of Malta Gozo Campus complex.
Two main sources of atmospheric pollution were identified in the Malta-Sicily Channel region, namely Mt. Etna-originating emissions and emissions from ships. Mt. Etna-related atmospheric emissions have been previously reported by Azzopardi et al. [2], and we are currently preoccupied with vessel emissions that constitute a significant part of the atmospheric pollution burden of this part of the Mediterranean [3], considered to be one of the busiest shipping lanes in the world.
In the Mediterranean Sea area, ships have to comply with the European Union Sulphur Directive [4], but the basin is not an Emission Control Area (ECA) like the Northern European sea areas. The political pressure towards an SOx (sulfur oxide) ECA declaration for the Mediterranean is mounting, and all three studies conducted to assess the feasibility of declaring an ECA for the Mediterranean point to larger benefits than costs [5,6,7]. Despite the lack of ECA designation in the Mediterranean Sea (Figure 1), sulfur emissions from ships are decreasing due to regional policy changes. Regardless, the global sulfur cap of 2020 will reduce the maximum sulfur level of marine fuels [8] and improve air quality in non-SECA regions. Originally, 4.5% of sulfur (by weight) was allowed but the limit was decreased to 3.5% in 2012. The global agreement to limit sulfur emissions from ships, which was made in January 1st 2020, was a significant milestone in marine fuel regulations. This change alone was reported to reduce the number of premature deaths by 137,000 each year [9], but shipping is still responsible for a considerable particulate matter (PM) burden despite significant technological and governance advances in the last few years. The largest benefits of these changes were concentrated on densely populated areas, which previously had very lax fuel sulfur-content rules. The Mediterranean Sea is one of those densely populated areas, albeit its population density may not be as high as that in South East Asia. Regardless, the greenhouse gas (GHG) emissions from shipping in the Mediterranean Sea region is about 7% of the global ship GHG emissions [10].
Although 70% of the global shipping sector atmospheric emissions are generated within 400 km of the coast, ship emissions contribute to the degradation of air quality in coastal areas and harbor cities [11]. It has been estimated that global ship emissions have contributed to 60,000 premature annual deaths, with major impacts being registered mainly along European, East Asian, and South Asian coastal areas [12]. A recent study determined that low-sulfur marine fuels still account for up to 250,000 annual deaths in 2020 due to a global increase in maritime traffic volumes [9]. In order to mitigate the impact of ship emissions on the air quality of coastal areas, a number of provisions have been added to the Marine Pollution Convention (MARPOL, which came into force in 2005) Annex VI by the International Maritime Organization (IMO). Additionally, the European Union has established a further legal requirement of a maximum threshold of 0.1% sulfur content in fuel used for ships at berth in harbors, and this has been implemented since 2010, whilst shore-to-ship electrical power provisions systems have increasingly come on stream, thus allowing berthed cruise ships to not rely on their engines for power generation.
Over the last decade, SO2 values have been constantly declining, especially in emissions control areas mainly across the coast of Europe, United States of America, and European North Sea [9]. Without doubt, efforts by the EU and IMO to reduce the sulfur content in marine fuel played an important role in mitigating the ship emissions in major harbors and principal shipping lanes. A review conducted by Sofiev et al. [9] determined that all studies carried out in the European countries reported a decrease in the ambient SO2 levels, in conjunction with the impact of the EU directive 2005/33/EC, which regulated the SO2 ship emissions in EU harbors from 2010 onwards. In fact, the concentration of SO2 decreased significantly from 2009 to 2010 in EU harbors, where the average decrease of the daily mean concentrations in the different harbors was 66% [13]. For example, evidence shows that, at the port city of Calais, northern France, one of the busiest harbors in Europe, the decrease within in-port emissions of SO2, nitric oxide (NO), and nitrogen dioxide (NO2) average concentrations was estimated at 51%, 35%, and 15%, respectively [14]. Other major harbors in Italy also noticed a considerable decrease in SO2 emissions. In the port of Bari, the impact of the EU directive 2005/33/EC contributed to a decrease of up to 80% in SO2 emissions [15], while in the ports of Brindisi, Savona, and Civitavecchia, the SO2 emissions from ships decreased drastically following the implementation of the new EU directive 2005/33/EC [13,16]. A recent review by Progiou et al. [17] shows that, at EU levels, nitrogen oxide (NOx) emissions from international shipping have increased by 9% from 1990 to 2017, whereas the corresponding SOx emissions dropped by 49%, while PM10 and PM2.5 decreased by 33% [18]. Regarding GHGs emissions, carbon dioxide (CO2) and methane (CH4) increased by 19% since 1990 [19]. Without doubt, the international mitigation strategies to curb sulfur dioxide emissions, based on low-sulfur content fuels, have proven useful to improve local air quality.
The requirement to use low-sulfur fuel in EU ports has considerably improved air quality at the local level [12,20], whereas the global sulfur cap will decrease the shipping share of air pollution at large scales [9,21].
The aim of this paper is to concentrate on ship emissions, in particular taking a closer look at the marine area around Malta pursuant to identifying the shipping contribution to local air pollution. A decade of air quality observations from the Giordan Lighthouse is reported, with two major sulfur emission sources, shipping, and volcanic activity of Mt. Etna. Additionally, the putative effects of a recent Covid-19 lockdown on the corresponding emissions from the shipping sector in Malta are assessed and discussed.

2. Materials and Methods

2.1. Ship Emission Modelling

Ship emissions were studied with the Ship Traffic Emission Assessment Model (STEAM) [22,23,24,25]. The model requires as an input an Automatic Identification System (AIS) dataset, which is used to describe vessel activity in study area. Additionally, technical description of vessels is required to provide a realistic prediction of vessel performance and water resistance. Both global AIS data and fleet description are commercial datasets provided by Orbcomm Ltd. and IHS Markit. A local AIS dataset was collected with an antenna installed at the Gozo Campus area. In this study, records from 2015 were used to construct emission inventories for ship emissions around Malta.

2.2. Air Quality Measurements

The instruments at Giordan Lighthouse presently comprise reactive gas detectors (O3, SO2, NOx), GHG (CO, CO2, CH4, Water Vapor (H2O)), and aerosol analyzers (multi-angle absorption photometer (MAAP), aethalometer, optical particle counter (OPC), condensation particle counter (CPC), scanning mobility particle sizer (SMPS)), together with several meteorological instruments measuring wind speed and direction, temperature and relative humidity, and two Leckel low volume samplers (LVSs). On the roof of the office premises at the Gozo Campus, Xewkija, one can find a further three pyranometers, a Campbell present weather sensor, and a Cimel sunphotometer. The latter optical instruments are not located at Giordan Lighthouse due to the sea spray that would adversely affect the optics. At this site, an AIS receiver has also been installed, which is part of the “marinetraffic.com” network, thus enabling us to collate ship movements in the Central Mediterranean. The reactive gas monitors and the GHG monitors are calibrated by means of certified mixtures obtained from Air Liquide, Krefeld, Germany. The O3 monitor is regularly calibrated by means of a long path length cell from Landesanstalt für Umwelt Baden-Württemberg (LUBW), Karlsruhe, Germany.
At Giordan Lighthouse, atmospheric aerosol particles range from 10 nm to 1 micron and are measured using 5 instruments. Two filter-based instruments, which measure black carbon (BC), are the MAAP and the aethalometer. The MAAP from Thermo Scientific Model 5012 measures BC mass concentration at a single nominal wavelength of 637 nm [26,27,28,29,30], while the aethalometer from Magee Scientific Model AE33, which operates on the principle of light attenuation, measures light absorption at seven different wavelengths (370, 470, 520, 590, 660, 880, and 950 nm) [31]. This instrument incorporates the “dual-spot” algorithm, which eliminates nonlinearities and provides the compensated particle light absorption and BC mass concentration [23,32]. At Giordan Lighthouse, there is also an OPC from Grimm Aerosol Technik Model 1.109, which possesses 31 size channels ranging from 0.25 μm to 32 μm [33,34], a CPC from TSI Model 3772, which is widely used for measurement of airborne particles as small as 10 nm in diameter and employs the single-particle-count-mode strategy to measure concentrations up to 104 particles per cubic centimeter [35,36,37], and a SMPS manufactured by TROPOS, Leipzig, Germany. This incorporates the 3772 CPC to optically detect and count individual particles and has been widely used to measure particle number size distributions in the range of 10 nm to 800 nm [37,38].
At Giordan lighthouse, two LVSs were used: Whatman QMA quartz filters for a collection of aerosols with an aerodynamic diameter of less than 2.5 microns (PM2.5) and Pall Teflon Membrane PTFE filters for a collection of aerosols with an aerodynamic diameter of less than 10 microns (PM10). A flow rate of 2.3 m3/h was used. The filters were exposed for 24 h intervals, with the wind speed and direction being recorded using a Lambrecht Model 24512 anemometer.

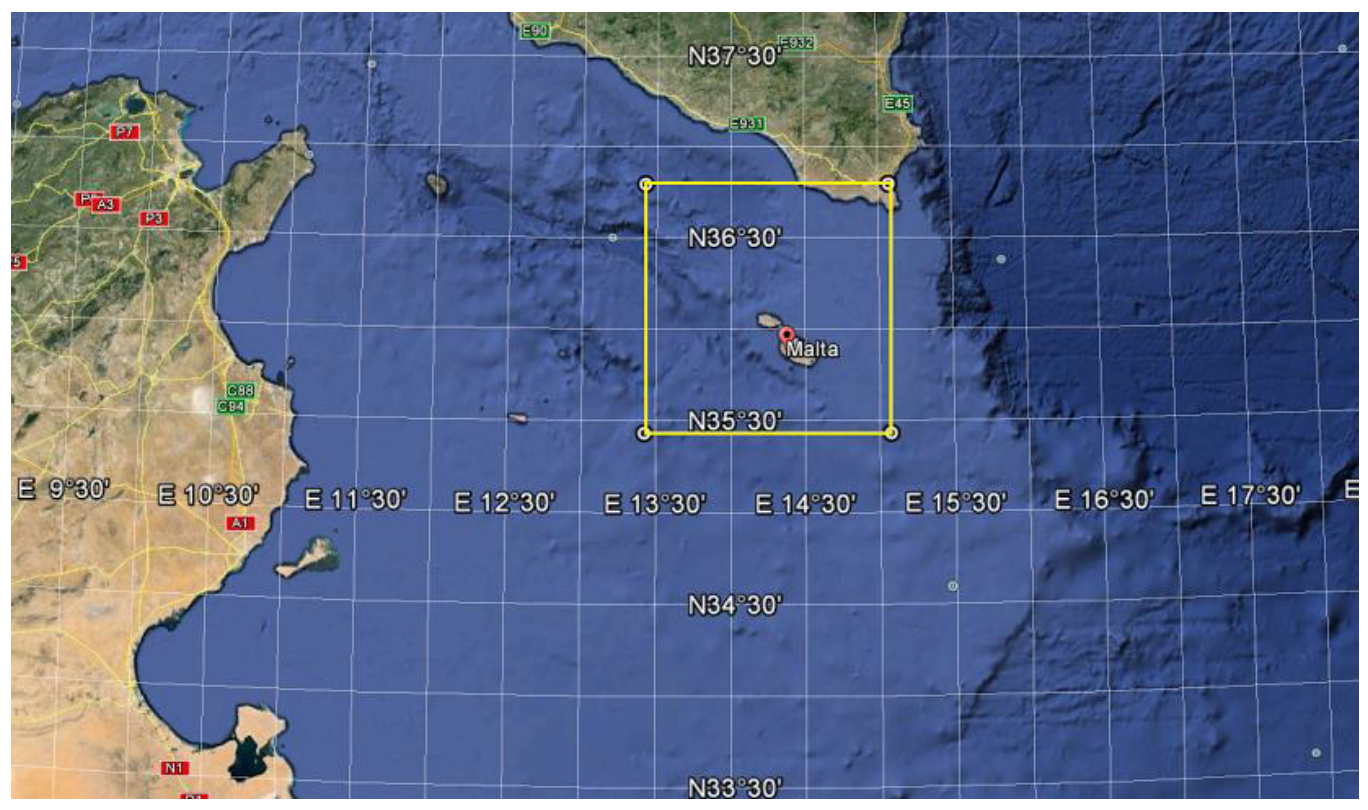
2.3. Geographical Domain and AIS Data Set

The main purpose of this paper is to investigate the influence of ship emissions on trace gases and aerosol background measurements at Giordan Lighthouse GAW regional station. In order to correlate the pollution events with ship emissions, especially when the prevailing wind is from the West–North East sector, it was necessary to acquire the vessels’ activity data in the straits of Sicily and around the Maltese Islands. The group set up a land-based AIS station, which consists of an AIS receiver (Digital Yacht, Bristol, UK; model AIS100) and an 8-foot fiberglass 6 dB VHF antenna. The VHF antenna was installed on the roof of the office premises at the Gozo Campus in June 2012. The VHF antenna had the following geographical coordinates (36.03416 N, 14.26481 E) and an elevation of 106 m above mean sea level. From a preliminary analysis of AIS data, it was discovered that the reception of the VHF antenna is seasonal, dependent on a range maximum in summer and minimum in winter, given that the reception is highly dependent on the atmospheric visibility. Therefore, in order to solve this anomaly, our land-based station was associated with the MarineTraffic network and was assigned ID 400 and named Gozo. MarineTraffic bounces data for a predefined domain via an API key. The selected domain is enclosed by the following coordinates (35N–37N, 13.3E–15.5E), as depicted in Figure 2. The selected domain of study has a perimeter of approximately 200 km by 200 km and encloses the Straits of Sicily, the Maltese territorial waters, and the Hurd bank.
Vessel activity was analyzed for the period between 5 February and 31 December 2015. The daily distinct moving vessels with unique Maritime Mobile Service Identity (MMSI) and speed greater than 4.9 knots were selected and aggregated to monthly so that the seasonal variations could be determined (Figure 3). As observed, there was a clear seasonal variation: a maximum during the summer period, which was enhanced by pleasure and fishing vessels, and a minimum obtained during the winter period. On an annual basis, the daily moving vessels amounted to around 85,000 vessels.

3. Results and Discussion

3.1. Results of Sampling Using LVSs

LVS PM10 filters collected between June and November 2015 were analyzed at the Peltier’s Aerosol Laboratory, University of Massachusetts, USA, by means of Energy Dispersive X-Ray Fluorescence (EDXRF).
For eight of these filters, a Vanadium to Nickel ratio of 4 +/− 1 was found, which is typical of ship emissions [39]. For 60% of these particular samples, the predominant wind direction was between 270–60°, which is the direction of the international shipping lanes going past the Maltese Islands.
BC analysis was also conducted for the period between 4 December 2011 and 16 September 2012 using the PM2.5 LVS filters, which were analyzed with a transmissometer at LSCE, Paris. During this period, the mean concentration of BC was 0.339 µg/m3 compared to MAAP data of 0.437 µg/m3 for the same period. There was a strong relationship between BC and non-sea salt sulphate, indicating that these likely come from ship emissions based on HYSPLIT-4 back trajectory modeling. There were also eight peak events (Figure 4) where concentrations of BC were double the average concentration during the study. Seven of the eight peaks corresponded to winds from the Northerly direction (270–60°), combined with HYSPLIT back trajectories, indicating that shipping emissions combined with additional concentrations of transboundary pollutants from Central and Southern Europe result in these peaks.

3.2. Analysis of Aerosol System Data for the Past Few Years

Ship emissions are a major source of aerosol particles, especially near shipping routes. Giordan Lighthouse is ideally situated to study such phenomena due to its location on a main shipping lane, which extends from the Suez Canal towards the Straits of Gibraltar. Moreover, these routes are considered the most densely trafficked shipping lanes in the Mediterranean Sea [3].
The data obtained from the MAAP and the AE33 (Channel 6–880 nm) was analyzed to identify possible anthropogenic BC peaks from ship traffic exhaust emissions. It is important to mention that, in order to correlate pollution events with ship emissions, the prevailing wind has to be from the West–North East sector. As shown in Figure 5, a significant increase in BC was observed from these two instruments. Moreover, as stated by Corbett et al. ([10] and Lelieveld and Dentener [40], ship emissions are mainly dictated by the engine size and type of fuel. In fact, ships powered by diesel engines running on heavy fuel oil emit gases, such as SO2. Due to this, SO2 concentrations were further plotted for comparison. One can easily notice that, in most cases, smaller peaks, if any, were observed when compared with the peaks obtained from the other two instruments. This could be due to the fact that background peaks of SO2 are usually observed when the prevailing wind is from the Northerly sectors. From these observations, one can conclude that the peaks obtained could possibly be related to ship emissions.
Furthermore, for the BC concentrations, the ships’ plumes are not as straight forward. Overlapping of several plumes, varying wind speed and direction, and intense traffic are among the several reasons that make it difficult to detect which ship is connected to which plume. Moreover, higher and noisier background concentrations dominate over relatively low concentrations in ship plumes, which makes it even more complex to identify such events [41].

3.3. Trends in Trace Gases in the Last 10 Years and Correlation of Trace Gases with Wind Direction

SO2 and NOx concentrations measured over the last 10 years at Giordan Lighthouse have been plotted, as shown in Figure 6. One can easily observe a major decrease in SO2 mixing ratios between 2011 and 2012 and a slow decrease after that to the present day. In the case of NOx emissions, a trend toward lower emissions was also seen, though it was much slower than in the sulfur dioxide case.
Moreover, a statistical analysis of the concentrations of O3, NOx, and SO2 against wind direction was carried out. These are shown in Figure 7. One can notice a high NOx concentration from the South East, which is the direction of the main island of Malta, anticorrelated with O3 concentration, as expected. The SO2 shows a peak from the Northerly direction, with a baseline of around 0.5 ppbv, all of which is attributed to ship emissions.

3.4. Trends in GHGs in the Last 9 Years

CO, CO2, CH4, and H2O concentrations measured over the last 9 years at Giordan Lighthouse have been plotted. From Figure 8, one can easily notice a slow decrease in CO mixing ratios and H2O, while in CH4 and CO2 mixing ratios, a sharp decline can be observed.

3.5. Analysis of AIS Data Using STEAM Model for 2015

Ship emissions for the domain of study were calculated with the STEAM Model [22,23] which was developed by the Finnish Meteorological Institute. The STEAM model was executed on a grid resolution of 0.7 km by 0.7 km to compute the vessel emissions for various chemical species, such as NOx, SOx, CO2, CO, and PM2.5 (Figure 9). From the STEAM model results, it was clear that the Straits of Sicily coincide with the main shipping route in the Central Mediterranean. A similar study by Jalkanen et al. [3,22] showed that, in the year 2011, CO2 emissions from vessel activity in the Mediterranean Sea amounted to 40% of the total CO2 emissions from shipping tracked in all the European sea regions. The study also determined that the sea region on the East of Malta ranked sixteenth as the most polluted sea region in Europe. It was also determined that harbor areas and principal shipping lanes are associated with very high CO2 emissions.
Sulfur emissions in the various sea areas in Europe are depicted in Figure 10, which clearly illustrates the effect of SECAs in the Baltic and the North Sea areas. The tight regulation. which forced ships to use 0.1% sulfur fuel oil, significantly reduced the sulfur emissions in those areas. The EU regional sulfur limits have been in force since 2010 for passenger vessels (EU Sulphur Directive) on regular routes and all vessels visiting EU ports, but passenger traffic is responsible for about 12% of total fuel used in the Mediterranean Sea region, and the overall impact to shipping SOx emissions is about 5%.

3.6. Classification of Emissions by Chemical Species

The total emissions for each chemical species as predicted by STEAM are presented in Figure 11. Although the STEAM output results are in kilograms, the total emissions were converted into tons for easier interpretation and comparison. According to data analysis and model computations, the emissions of NOx, SOx, CO, CO2, PM2.5, organic carbon (OC), elemental carbon (EC), ash, and sulfate ion (SO4) originating from ships in the domain during the full calendar year of 2015 were in total 50.9 kt, 30.3 kt, 3.3 kt, 2080 kt, 4.0 kt, 774 t, 310 t, 227 t, and 2.7 kt, respectively. A similar study for the European sea water was also conducted by [3]. This study showed that the emissions of NOx, SOx, CO, CO2, and PM2.5 in the Mediterranean region for the full calendar year of 2011 were in total 2964 kt, 1208 kt, 197 kt, 120711 kt, and 182 kt, respectively. Comparing these results, the study area represents approximately 1.7 to 2.5% of the Mediterranean ship emissions.
The relative share of chemical species from the total predicted emissions is presented in Table 1. Such an analysis establishes which chemical species is the most abundant in exhaust emission of ships. In fact, it was determined that CO2 constitutes approximately 96% of the total ship emissions, followed by NOx (2.34%) and SOx (1.40%). The other chemical species each have a relative share of less than 0.2%.

4. COVID-19 Analysis and Discussion

4.1. Marine Vessel Traffic and the Covid-19 Pandemic

COVID-19, also known as the coronavirus, is a disease that causes severe and acute respiratory problems. By the end of January 2020, the World Health Organization (WHO) declared the outbreak as a public health emergency of international concern. On 11 May 2020, the threat was considered as a pandemic [42], and by June 2020, more than 7.5 million cases were reported in over 188 countries, resulting in a death toll of more than 430,000 [43]. Most countries went under lockdown, which, in turn, disrupted international and domestic travel.
In Malta, the first positive case was recorded on 7 March 2020. In about 100 days, there were 664 positive cases, 616 recoveries, and 9 deaths [44]. The ban on sea and air travel, except for cargo, came into effect on 11 March 2020, and travelers returning from highly infectious countries had to follow a mandatory 14-day quarantine. More containment measures came into effect on 13 March when schools, universities, and child-care centers were closed. Religious, sports, and group activities were also stopped. Non-essential retail outlets and services were also closed down. Lockdown measures started being gradually lifted on 1 May 2020 [45].
The reduced traffic and industrial activities between March and April 2020 motivated a number of air quality studies that compare pollution levels before and during the lockdown period. Such research was mostly based on data collected from real-time stations positioned at strategic locations around the Maltese Islands. This work shifts the focus to the maritime sector and the activities within the Malta Channel. The aim is to investigate whether the COVID-19 pandemic had any effect on the shipping patterns within the area, observed with local installation of the AIS receiver, and to quantify any corresponding air pollution trends that are normally associated with such traffic.

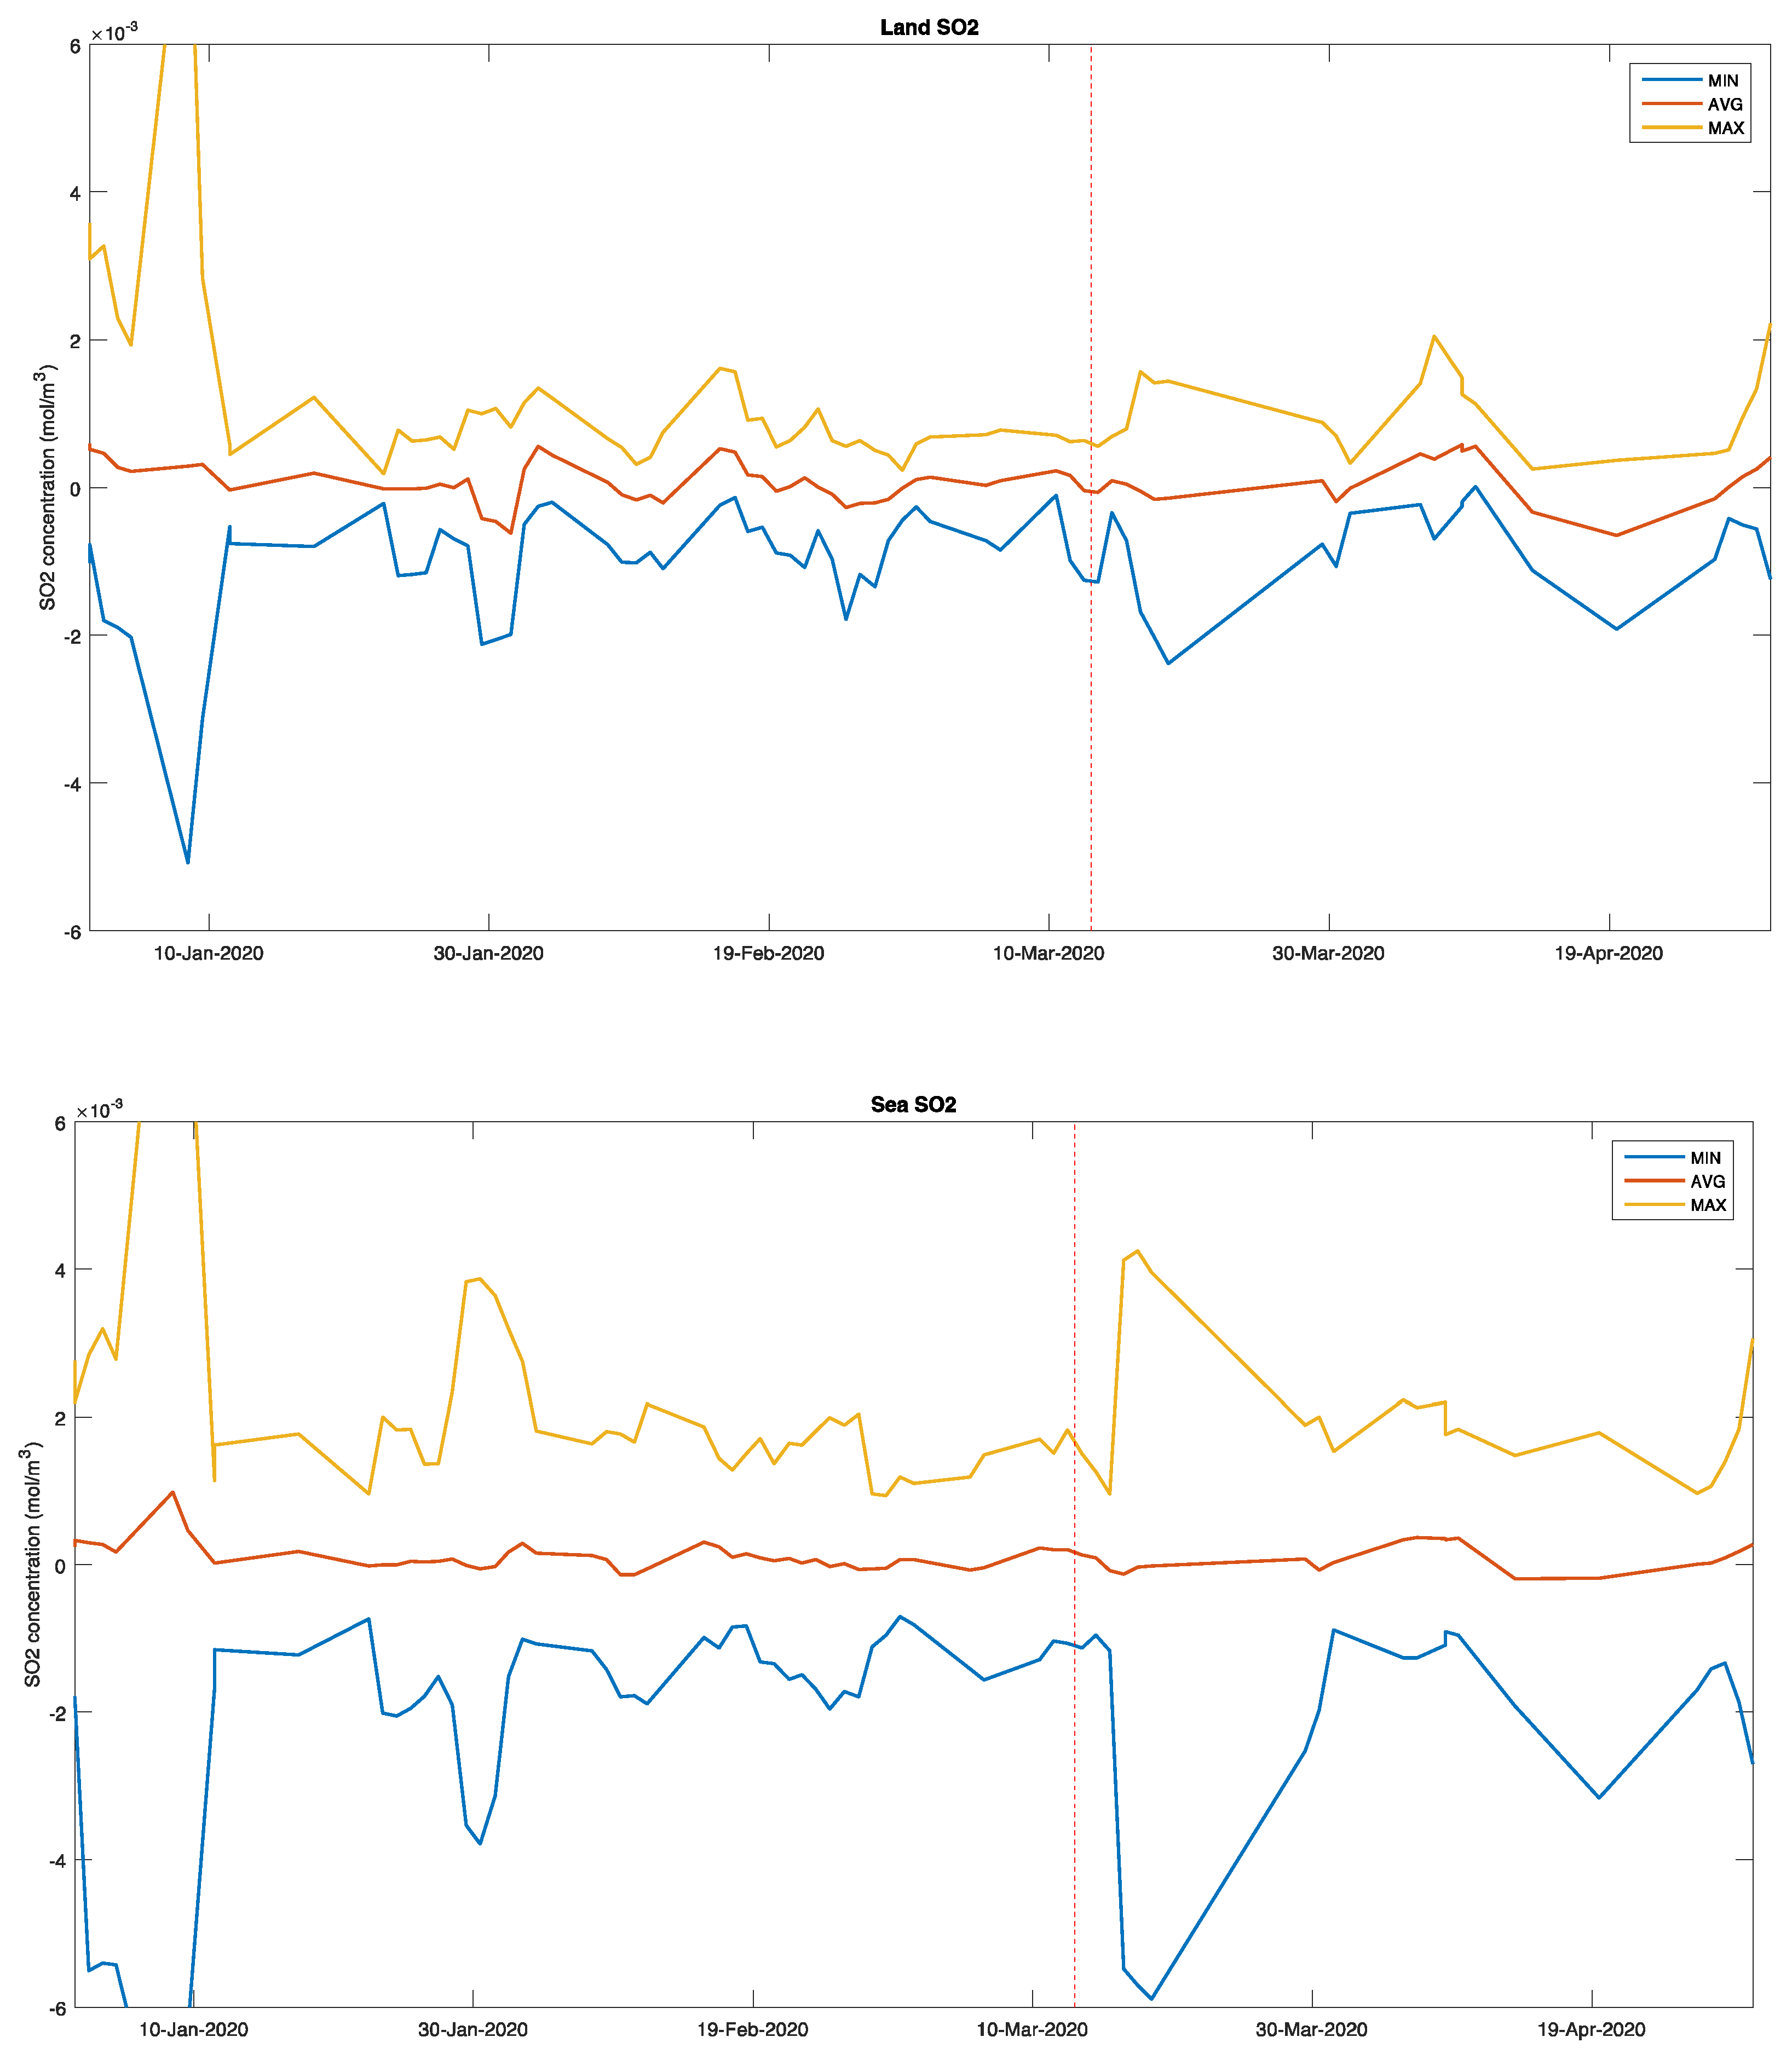
4.2. Air Quality over the Malta Channel

Air quality data over the Malta Channel was obtained from the SENTINEL-5 Precursor satellite. The mission was part of the European Earth Observation Programme, which was financed by the European Space Agency (ESA). The satellite was part of the Copernicus Atmospheric Monitoring Services (CAMS) and was equipped with a TROPO spheric Monitoring Instrument (TROPOMI) spectrometer that provides seven bands between the ultraviolet (UV) and shortwave infrared (SWIR). This had the capability of measuring radiation between 270–300 nm and 200–370 nm (in the UV range), between 370 and 500 nm (in the visible band), between 685 and 710 nm and 756–773 nm (in the near-IR), and between 1590 and 1675 nm and 2305–2385 nm (in the short wave IR). This allowed for the derivation of different data products, including O3, NO2, SO2, HCHO, CHOCHO, CO, CH4, and aerosol products [46]. The swath width of TROPOMI covered approximately 2600 km on the ground and allowed for a full daily surface coverage over the central Mediterranean region.
In this work, CO and SO2, which are available for the total atmospheric column, as well as NO2 over the total and tropospheric columns, were considered.
TROPOMI CO retrieval was done using an algorithm concept based on the further development of the retrieval method of Vidot et al. [47]. The retrieval algorithm of the TROPOMI SO2 was based on the DOAS technique [20]. The TROPOMI NO2 processing system was based on the algorithm developments for the DOMINO-2 product [48,49] and for the EU QA4ECV NO2 [50] reprocessed dataset for OMI and was adapted for TROPOMI.
Both CO and NO2 were produced via the combustion of fossil fuels. Although SO2 can be produced from natural sources, most of the concentrations in the atmosphere are generated through anthropogenic activities. Data that was made available in an offline mode between 1 January 2020 and 30April 2020 was downloaded from the ESA Data Hub. By using a 3-, 5, and 7-day window, the raw files were averaged and merged to create relatively gap-free products over the central Mediterranean. Through the use of the ‘Harp’ toolbox [51], the averaged pollution concentrations were projected over a regular grid, which was set to extend from 33° N to 40° N in latitude and between 11° E to 18° E in longitude. The resolution was set to 0.05 degrees, corresponding to the original resolution of the instrument. This resulted in a grid of 142 × 142 cells. Figure 12, Figure 13 and Figure 14 show the CO, NO2, and SO2 maps computed over the domain of interest for the first available day in January, February, March, and April 2020. The figures also show zoomed-in plots over the Malta Channel. In particular, this extended from 35.44° N to 36.80° N in latitude and from 13.43° E to 14.08° E in longitude. Such a domain corresponded to the coverage over which AIS ship records were available.
The minimum, mean, and maximum values of grid cells within the Malta Channel over land, as well as over water, were extracted. Land points included all of Malta, Comino, and Gozo, as well as the southern tip of Sicily. Figure 15, Figure 16 and Figure 17 show the results produced from the daily averaged files when a 3-day window was considered. While the CO and SO2 values were for the entire air column, the presented NO2 results were for the tropospheric region. The short-term variation in the trend results were due to differences between weekends and weekdays. Sharp changes were softened by the multi-day averaging that was applied. 13 March 2020, which coincided with Malta’s partial lock-down, is marked by a vertical red dotted line. Less activity on land clearly resulted in a decrease of NO2 concentrations. This agrees with what other local studies have shown. Although a slight decrease over the marine area can also be seen, this was not as significant as the trend over land. No changes were evident in the CO and SO2 concentrations.

4.3. Ship Traffic within the Malta Channel

To better interpret the air quality results presented above, the volume of marine traffic in the Malta Channel during the same time frame was analyzed. Available local AIS records detected by the station of the Physical Oceanography Research Group of the University of Malta, between January and April, for 2017, 2018, and 2020, were initially grouped according to the corresponding ship type code, as per methodology delineated in Deidun et al. [52]. In particular, the geo-location information for fishing vessels, wing-in-ground vessels, sailing, pleasure, and high-speed vessels, passenger vessels, cargo, and tankers, as well as special and reserved vessels, was extracted. The ship type codes considered for each of these categories are shown in Table 2. Given that the corresponding 2019 dataset featured a number of data gaps, this dataset was not used within the analysis.
Throughout their journey, vessels periodically broadcast AIS. As a result, the total number of available AIS records do not necessarily correspond to the number of ships present or to their duration in the Malta Channel. Initially, ship density plots were generated on a monthly basis by counting the number of ships present in every cell of a regular grid. This was defined so as to correspond exactly to the spatial resolution used for the projection of the satellite air pollution data. Figure 18 shows the resulting density maps for January, February, March, and April 2020. A log-scale was deployed in these maps, given the sheer breadth of the range of values, with higher ship counts being depicted by a yellow color.
The MMSI code for each recorded vessel was then used to extract individual trajectories for every ship on a daily basis. The results for 6 March 2020 and 19 April 2020, just before and during the local COVID-imposed lockdown, are visualized in Figure 19. Here, trajectories of different colors illustrate tracks taken by different ship types. Moreover, the starting and ending timestamps of every trajectory were used to compute the amount of time (in hours) that every ship spent in the spatial domain of interest.
During the pandemic health emergency, a strong activity from sailing, pleasure, and high-speed craft was still recorded. However, the number of passenger ships declined around the end of March. This remained low throughout the month of April. Due to the closure of international ports, the number of hours spent by cargo and tanker ships in Maltese waters was considerably lower than in previous years. However, despite the partial lockdown measures, the total number of vessels, as well as the total time spent by vessels across all categories in the Malta Channel, remained more or less the same.

5. Conclusions

This paper represents a long-term study on ship emissions obtained from trace gases and aerosol background measurements at Giordan Lighthouse. From this study, it was concluded that ship traffic exhaust emissions and Mt. Etna-originating emissions are the primary source of emissions; however, this paper focuses on ship emissions to identify shipping contribution to local air pollution. From the actual trace gas measurements, it was concluded that SOx and NOx emissions are slowly decreasing over time. Moreover, with the global agreement [8], which was put into effect on 1 January 2020, sulfur emissions from ships are expected to start decreasing in the coming years.
This study also concentrated on the effects, if any, of the COVID-19 outbreak on the shipping patterns within the area. In fact, from the results acquired from a comparative analysis of the retrieved shipping traffic satellite, the AIS data for the COVID-19 pandemic (February–May period for 2020), and for the previous years, one can infer that no significant change occurred. This means that, during the COVID-19 episode, the shipping volumes, despite the partial lockdown measures, more or less remained the same (which is contrary to the intuitive expectations), given the persistence of international seaborne trade between nations. This conclusion might explain the relatively constant levels of air pollution over the Malta Channel region.

Author Contributions

Conceptualization, A.D. and R.E., methodology, M.S., F.A., R.M., M.G., A.S., J.-P.J., L.J., A.D., A.G., C.G. and R.E., software, M.S., F.A., R.M., M.G. and A.G., validation, M.S., F.A., R.M., M.G. and A.G., formal analysis, M.S., F.A., R.M., M.G., A.D., A.G., C.G. and R.E., investigation, M.S., F.A., R.M., M.G., A.D., A.G., C.G. and R.E., resources, M.S., F.A., R.M., M.G., A.S., J.-P.J., L.J., A.D., A.G., C.G., T.C. and R.E., data curation, M.S., F.A., R.M., M.G. and A.G., writing—original draft preparation, M.S., F.A., R.M., M.G., A.S., J.-P.J., L.J., A.D., A.G., C.G. and R.E., writing—review and editing, A.D., C.G. and R.E., visualization, M.S., F.A., R.M., M.G. and A.G., supervision, A.D., C.G. and R.E. All authors have read and agreed to the published version of the manuscript.

Funding

This research received no external funding.

Institutional Review Board Statement

Not applicable.

Informed Consent Statement

Not applicable.

Data Availability Statement

Data and codes used in this work are available upon request.

Conflicts of Interest

The authors declare no conflict of interest.

References

  1. Nolle, M.; Ellul, R.; Heinrich, G.; Güsten, H. A long-term study of background ozone concentrations in the central Mediterra-nean—Diurnal and seasonal variations on the island of Gozo. Atmos. Environ. 2002, 36, 1391–1402. [Google Scholar] [CrossRef]
  2. Azzopardi, F.; Ellul, R.; Prestefilippo, M.; Scollo, S.; Coltelli, M. The effect of Etna volcanic Ash clouds on the Maltese islands. J. Volcanol. Geotherm. Res. 2013, 260, 13–26. [Google Scholar] [CrossRef]
  3. Jalkanen, J.; Johansson, L.; Kukkonen, J. A comprehensive inventory of ship traffic exhaust emissions in the European sea areas in 2011. Atmos. Chem. Phys. 2016, 16, 71–84. [Google Scholar] [CrossRef] [Green Version]
  4. European Parliament. DIRECTIVE (EU) 2016/802 Reduction in the Sulphur Content of Certain Liquid Fuels; The European Commission: Brussels, Belgium, 2016. [Google Scholar]
  5. Cofala, J.; Amann, M.; Borken-Kleefeld, J.; Gomez-Sanabria, A.; Heyes, C.; Kiesewetter, G.; Sander, R.; Schoepp, W.; Holland, M.; Fagerli, H.; et al. The Potential for Cost-Effective Air Emission Reductions from International Shipping through Designation of Further Emission Control Areas in EU Waters with Focus on the Mediterranean Sea, Laxenburg, Austria, 2018. Available online: https://iiasa.ac.at/web/home/research/researchPrograms/air/Shipping_emissions_reductions_main.pdf (accessed on 4 July 2021).
  6. Corbett, J.; Carr, E.; Winebrake, J.; Jalkanen, J.-P.; Johansson, L.; Palamarchuk, Y.; Sofiev, M. REM-PEC/WG.45/INF.9—Technical and Feasibility Study to Examine the Possibility of Designating the Mediterranean Sea, or Pars Thereof, as SOx ECA(s) under MARPOL Annex VI, 2019. Available online: https://www.rempec.org/en/knowledge-centre/online-catalogue/2019/rempec-wg-45-inf-9-technical-and-feasibility-study-to-examine-the-possibility-of-designating-the-mediterranean-sea-or-parts-thereof-as-sox-eca-s-under-marpol-annex-vi-english-only (accessed on 7 July 2021).
  7. Rouïl, L.; Ratsivalaka, C.; André, J.-M.; Allemand, N. ECAMED: A Technical Feasibility Study for the Implementation of an Emission Control Area (ECA) in the Mediterranean Sea. 2019. Available online: https://www.ecologie.gouv.fr/sites/default/files/R_DRC-19-168862-00408A_ECAMED_final_Report_V5.pdf (accessed on 7 July 2021).
  8. IMO: Effective Date of Implementation of the Fuel Oil Standard in Regulation 14.1.3 of MARPOL Annex VI, IMO MEPC70, UK.; 2016. Available online: https://wwwcdn.imo.org/localresources/en/OurWork/Environment/Documents/280(70).pdf (accessed on 7 July 2021).
  9. Sofiev, M.; Winebrake, J.J.; Johansson, L.; Carr, E.W.; Prank, M.; Soares, J.; Vira, J.; Kouznetsov, R.; Jalkanen, J.-P.; Corbett, J.J. Cleaner fuels for ships provide public health benefits with climate tradeoffs. Nat. Commun. 2018, 9. [Google Scholar] [CrossRef] [PubMed] [Green Version]
  10. Corbett, J.J.; Fischbeck, P.S.; Pandis, S.N. Global nitrogen and sulfur inventories for oceangoing ships. J. Geophys. Res. Atmos. 1999, 104, 3457–3470. [Google Scholar] [CrossRef]
  11. Viana, M.; Hammingh, P.; Colette, A.; Querol, X.; Degraeuwe, B.; de Vlieger, I.; Van Aardenne, J. Impact of maritime transport emissions on coastal air quality in Europe. Atmos. Environ. 2014, 90, 96–105. [Google Scholar] [CrossRef]
  12. Corbett, J.J.; Winebrake, J.J.; Green, E.H.; Kasibhatla, P.; Eyring, V.; Lauer, A. Mortality from ship emissions: A Global As-sessment. Environ. Sci. Technol. 2007, 41, 8512–8518. [Google Scholar] [CrossRef]
  13. Schembari, C.; Cavalli, F.; Cuccia, E.; Hjorth, J.; Calzolai, G.; Pérez, N.; Raes, F. Impact of a European directive on ship emis-sions on air quality in Mediterranean harbours. Atmos. Environ. 2012, 61, 661–669. [Google Scholar] [CrossRef]
  14. Ledoux, F.; Roche, C.; Cazier, F.; Beaugard, C.; Courcot, D. Influence of Ship Emissions on NOx, SO2, O3 and PM Concentrations in a North-Sea Harbor in France. 2018. Available online: https://0-www-sciencedirect-com.brum.beds.ac.uk/science/article/pii/S1001074217317709 (accessed on 7 July 2021).
  15. Merico, E.; Dinoi, A.; Contini, D. Development of an Integrated Modelling-Measurement System for Near-Real-Time Estimates of Harbour Activity Impact to Atmospheric Pollution in Coastal Cities. 2019. Available online: https://0-www-sciencedirect-com.brum.beds.ac.uk/science/article/pii/S1361920919305358 (accessed on 7 July 2021).
  16. Merico, E.; Donateo, A.; Gambaro, A.; Cesari, D.; Gregoris, E.; Barbaro, E.; Contini, D. Influence of In-Port Ships Emissions to Gaseous Atmospheric Pollutants and to Particulate Matter of Different Sizes in a Mediterranean Harbour in Italy. 2016. Available online: https://0-www-sciencedirect-com.brum.beds.ac.uk/science/article/pii/S135223101630365X (accessed on 7 July 2021).
  17. Progiou, A.G.; Bakeas, E.; Evangelidou, E.; Kontogiorgi, C.; Lagkadinou, E.; Sebos, I. Air pollutant emissions from Piraeus port: External costs and air quality levels. Transp. Res. Part D Transp. Environ. 2021, 91, 102586. [Google Scholar] [CrossRef]
  18. CLRTAP 2019. Available online: https://www.ceip.at/ms/ceip_home1/ceip_home/status_reporting/2019_submissions (accessed on 11 May 2020).
  19. EEA, 2019a. European Environmental Agency, 2019, Annual European Union Greenhouse Gas Inventory 1990-2017 and Inventory Report 2019- Submission under United Nations Framework Convention on Climate Change and Kyoto Protocol EU28 GR. Available online: https://www.eea.europa.eu/publications/european-union-greenhouse-gas-inventory-2019 (accessed on 7 July 2021).
  20. Theys, N.; de Smedt, I.; Yu, H.; Danckaert, T.; van Gent, J.; Hörmann, C.; Wagner, T.; Hedelt, P.; Bauer, H.; Romahn, F.; et al. Sulfur dioxide retrievals from TROPOMI onboard Sentinel-5 Precursor: Algorithm theoretical basis. Atmos. Meas. Tech. 2017, 10, 119–153. [Google Scholar] [CrossRef] [Green Version]
  21. Jonson, J.E.; Gauss, M.; Schulz, M.; Jalkanen, J.; Fagerli, H. Effects of global ship emissions on European air pollution levels. Atmos. Chem. Phys. 2020, 20, 11399–11422. [Google Scholar] [CrossRef]
  22. Jalkanen, J.-P.P.; Brink, A.; Kalli, J.; Pettersson, H.; Kukkonen, J.; Stipa, T. A modelling system for the exhaust emissions of ma-rine traffic and its application in the Baltic Sea area. Atmos. Chem. Phys. 2009, 9, 9209–9223. [Google Scholar] [CrossRef] [Green Version]
  23. Jalkanen, J.-P.; Johansson, L.; Kukkonen, J.; Brink, A.; Kalli, J.; Stipa, T.; Kerminen, V.M. Extension of an assessment model of ship traffic exhaust emissions for particulate matter and carbon monoxide. Atmos. Chem. Phys. 2012, 12. [Google Scholar] [CrossRef] [Green Version]
  24. Johansson, L.; Jalkanen, J.; Kalli, J.; Kukkonen, J. The evolution of shipping emissions and the costs of regulation changes in the northern EU area. Atmos. Chem. Phys. 2013, 13, 11375–11389. [Google Scholar] [CrossRef] [Green Version]
  25. Johansson, L.; Jalkanen, J.; Kukkonen, J. Global assessment of shipping emissions in 2015 on a high spatial and temporal res-olution. Atmos. Environ. 2017, 167, 403–415. [Google Scholar] [CrossRef]
  26. Hänel, G. Radiation budget of the boundary layer: Part II, Simultaneous measurement of mean solar volume absorption and extinction coefficients of particles. Beitr. Phys. Atmosph. 1987, 60, 241–247. [Google Scholar]
  27. Hyvärinen, A.P.; Vakkari, V.; Laakso, L.; Hooda, R.K.; Sharma, V.P.; Panwar, T.S.; Beukes, J.P.; Van Zyl, P.G.; Josipovic, M.; Garland, R.M.; et al. Correction for a measurement artifact of the Multi-Angle Absorption Photometer (MAAP) at high black carbon mass concentration levels. Atmos. Meas. Tech. 2013, 6, 81–90. [Google Scholar] [CrossRef] [Green Version]
  28. Müller, T.; Henzing, J.S.; de Leeuw, G.; Wiedensohler, A.; Alastuey, A.; Angelov, H.; Bizjak, M.; Collaud Coen, M.; Engström, J.E.; Gruening, C.; et al. Characterization and intercomparison of aerosol absorption photometers: Result of two intercom-parison workshops. Atmos. Meas. Tech. 2011, 4, 245–268. [Google Scholar] [CrossRef] [Green Version]
  29. Petzold, A.; Schloesser, H.; Sheridan, P.J.; Arnott, W.P.; Ogren, J.A.; Virkkula, A. Evaluation of Multiangle Absorption Pho-tometry for Measuring Aerosol Light Absorption. Aerosol Sci. Technol. 2005, 39, 40–51. [Google Scholar] [CrossRef] [Green Version]
  30. Scientific, T. Model 5012 Instruction Manual Multi Angle Absorption Photometer (MAAP); Thermo Fisher Scientific: Madison, WI, USA, 2007. [Google Scholar]
  31. Dutt, U.; Jiang, N.; Ross, G.; Gunaratnam, G. Application of the Aethalometer for Black Carbon Source Analysis. Air Qual. Clim. Chang. 2018, 52, 6. [Google Scholar]
  32. Scientific, M. Aethalometer® Model AE33 User Manual—Version 1.54; Aerosol doo: Ljubljana, Slovenia, 2016. [Google Scholar]
  33. Burkart, J.; Steiner, G.; Reischl, G.; Moshammer, H.; Neuberger, M.; Hitzenberger, R. Characterizing the performance of two optical particle counters (Grimm OPC 1. 108 and OPC 1. 109) under urban conditions. J. Aerosol Sci. 2010, 41, 953–962. [Google Scholar] [CrossRef] [Green Version]
  34. Heim, M.; Mullins, B.J.; Umhauer, H.; Kasper, G. Performance evaluation of three optical particle counters with an efficient “multimodal” calibration method. J. Aerosol Sci. 2008, 39, 1019–1031. [Google Scholar] [CrossRef]
  35. Mordas, G.; Manninen, H.E.; Petäjä, T.; Aalto, P.P.; Hämeri, K.; Kulmala, M. On operation of the ultra-fine water-based CPC TSI 3786 and comparison with other TSI models (TSI 3776, TSI 3772, TSI 3025, TSI 3010, TSI 3007). Aerosol Sci. Technol. 2008, 42, 152–158. [Google Scholar] [CrossRef]
  36. TSI Inc. Model 3772/3771 Condensation Particle Counter: Operation and Service Manual, 2007. Available online: http://dustmonitors.ru/f/manual_cpc-3772-3771-part_1.pdf (accessed on 7 July 2021).
  37. Wiedensohler, A.; Birmili, W.; Nowak, A.; Sonntag, A.; Weinhold, K.; Merkel, M.; Wehner, B.; Tuch, T.; Pfeifer, S.; Fiebig, M.; et al. Particle mobility size spectrometers: Harmonization of technical standards and data structure to facilitate high quality long-term observations of atmospheric particle number size distributions. Atmos. Meas. Tech. Discuss 2010, 3, 5521–5587. [Google Scholar]
  38. TROPOS. User manual TROPOS-SMPS—Version H1S4.6.8; Leibniz Institute for Tropospheric Research: Leipzig, Germany, 2012. [Google Scholar]
  39. Viana, M.; Amato, F.; Alastuey, A.; Querol, X.; Moreno, T.; Garcia Dos Santos, S.; Fernández-Patier, R. Chemical Tracers of Particulate Emissions from Commercial Shipping. Environ. Sci. Technol. 2009, 43, 7472–7477. [Google Scholar] [CrossRef] [PubMed]
  40. Lelieveld, J.; Dentener, F.J. What controls tropospheric ozone? J. Geophys. Res. Atmos. 2000, 105, 3531–3551. [Google Scholar] [CrossRef]
  41. Ausmeel, S.; Eriksson, A.; Ahlberg, E.; Kristensson, A. Methods for identifying aged ship plumes and estimating contribution to aerosol exposure downwind of shipping lanes. Atmos. Meas. Tech. 2019, 12, 4479–4493. [Google Scholar] [CrossRef] [Green Version]
  42. World Health Organisation. Statement on the Second Meeting of the International Health Regulations. Emergency Committee Regarding the Outbreak of Novel Coronavirus (2019-nCoV),” World Health Organization 2005. Available online: https://www.who.int/news-room/detail/30-01-2020-statement-on-the-second-meeting-of-the-international-health-regulations-(2005)-emergency-committee-regarding-the-outbreak-of-novel-coronavirus-(2019-ncov) (accessed on 21 June 2020).
  43. Center for Systems Science and Engineering, COVID-19 Dashboard by the Center for Systems Science and Engineering (CSSE) at Johns Hopkins University (JHU), 2020. Available online: https://gisanddata.maps.arcgis.com/apps/opsdashboard/index.html#/bda7594740fd40299423467b48e9ecf6 (accessed on 21 June 2020).
  44. University of Malta. COVID-19 Updates, Advice & Information. University of Malta, 2020. Available online: https://www.um.edu.mt/newspoint/covid19 (accessed on 21 June 2020).
  45. Thomson Reuters Malta Announces Gradual Lifting of COVID-19 Restrictions. Thomson Reuters Foundation News, 01-May-2020. Available online: https://news.trust.org/item/20200501101624-n1ip4 (accessed on 21 June 2020).
  46. European Space Agency (ESA), Sentinel-5P Mission—Instrumental Payload, 2020. Available online: https://sentinel.esa.int/web/sentinel/missions/sentinel-5p/instrumental-payload (accessed on 21 June 2020).
  47. Vidot, J.; Landgraf, J.; Hasekamp, O.P.; Butz, A.; Galli, A.; Tol, P.; Aben, I. Carbon monoxide from shortwave infrared re-flectance measurements: A new retrieval approach for clear sky and partially cloudy atmospheres. Remote Sens. Environ. 2012, 120, 255–266. [Google Scholar] [CrossRef]
  48. Boersma, K.F.; Eskes, H.J.; Veefkind, J.P.; Brinksma, E.J.; vander A, R.J.; Sneep, M.; van den Oord, G.H.J.; Levelt, P.F.; Stammes, P.; Gleason, J.F.; et al. Near-real time retrieval of tropospheric NO2 from OMI. Atmos. Chem. Phys. 2007, 7, 2103–2118. [Google Scholar] [CrossRef] [Green Version]
  49. Boersma, K.F.; Eskes, H.J.; Dirksen, R.J.; van der A, R.J.; Veefkind, J.P.; Stammes, P.; Huijnen, V.; Kleipool, Q.L.; Sneep, M.; Claas, J.; et al. An improved tropospheric NO2column retrieval algorithm forthe Ozone Monitoring Instrument. Atmos. Meas. Tech. 2011, 4, 1905–1928. [Google Scholar] [CrossRef] [Green Version]
  50. Boersma, K.F.; Eskes, H.J.; Brinksma, E.J. Error Analysis for Tropospheric NO2 Retrieval from Space. J. Geophys. Res. 2004, 109, D04311. [Google Scholar] [CrossRef]
  51. Atmospheric Toolbox. HARP—Data Harmonization Toolset for Scientific Earth Observation Data, 2020. Available online: https://atmospherictoolbox.org/harp/ (accessed on 21 June 2020).
  52. Deidun, A.; Gauci, A.; Azzopardi, J.; Camilleri, C.; Cutajar, D.; Chalabreysse, M.; Trinquard, F. Development of a Novel Tool for the Monitoring of Shipping Traffic Within the Strait of Sicily (Central Mediterranean): The BIODIVALUE AIS Vessel Tracker. J. Coast. Res. 2018, 85, 1356–1360. [Google Scholar] [CrossRef]
Figure 1. SOx emissions from ships in various sea areas of Europe during 2006–2018 according to the European Monitoring and Evaluation Program (EMEP). BLA = Black Sea, NOS = North Sea and the English Channel, BAS = Baltic Sea, ATL = Remaining Atlantic, MED = Mediterranean Sea. Note that SOx is calculated as SO2. Note the reduction of SOx emissions, which are connected to regulatory changes during 2006, 2007, 2010, and 2015.
Jmse 09 00762 g001
Figure 2. The vessels’ activity data as collected for the specified domain enclosed by the yellow line.
Jmse 09 00762 g002
Figure 3. Total daily distinct moving vessels per month for the year 2015. (Source: MarineTraffic.com (accessed on 15 June 2021)).
Jmse 09 00762 g003
Figure 4. Peaks in nss-SO4, EC, and BC(IR).
Jmse 09 00762 g004
Figure 5. BC Concentrations from the MAAP (black line) and AE33 Aethalometer (blue line) instruments compared to the SO2 concentrations (red line), as measured at Giordan Lighthouse, Gozo, Malta. Figures (ad) show several peaks for different months in the year of 2019, which could possibly be related to ship emissions.
Jmse 09 00762 g005
Figure 6. SO2 mixing ratios (left) and NOx mixing ratios (right); 2011–2020 as measured at Giordan Lighthouse, Gozo, Malta.
Jmse 09 00762 g006
Figure 7. Variation of ozone, nitrogen oxides, and sulfur dioxide with wind direction.
Jmse 09 00762 g007
Figure 8. CO mixing ratios (a), H2O (b), CH4 mixing ratios (c) and CO2 mixing ratios (d), 2012–2020 as measured at Giordan Lighthouse, Gozo, Malta.
Jmse 09 00762 g008aJmse 09 00762 g008b
Figure 9. CO2 (a), CO (b), NOx (c), SOx (d), and PM2.5 (e) emissions for all vessel types.
Jmse 09 00762 g009
Figure 10. Geographical distribution of SOx emissions from ships in European sea areas during 2015.
Jmse 09 00762 g010
Figure 11. Emissions as predicted by STEAM for the year 2015. The blue bars represent chemical species, which are plotted on the primary axis, while the orange bar shows the CO2 emissions plotted on the secondary axis.
Jmse 09 00762 g011
Figure 12. CO maps generated with a 7-day window for 1 January (a), 1 February (b), 1 March (c), and 1 April 2020 (d).
Jmse 09 00762 g012
Figure 13. NO2 maps generated with a 7-day window for 1 January (a), 1 February (b), 1 March (c), and 1 April 2020 (d).
Jmse 09 00762 g013
Figure 14. SO2 maps generated with a seven-day window for 1 January (a), 1 February (b), 1 March (c), and 1 April 2020 (d).
Jmse 09 00762 g014
Figure 15. Min, mean, and max CO over land (top) and over sea (bottom) in the Malta Channel domain.
Jmse 09 00762 g015
Figure 16. Min, mean, and max NO2 over land (top) and over sea (bottom) in the Malta Channel domain.
Jmse 09 00762 g016
Figure 17. Min, mean, and max SO2 over land (top) and over sea (bottom) in the Malta Channel domain.
Jmse 09 00762 g017
Figure 18. Density of ships over the Malta Channel in the first four months of 2020.
Jmse 09 00762 g018
Figure 19. Vessel tracks for different categories recorded on 6 March 2020 (left) and on 19 April 2020 (right).
Jmse 09 00762 g019
Table 1. The relative share of each chemical species.
SpeciesEmissions [kg]Share of Total
NOx [kg]5.09 × 1072.34%
SOx [kg]3.03 × 1071.40%
PM2.5 [kg]3.99 × 1060.18%
CO [kg]3.27 × 1060.15%
CO2 [kg]2.08 × 10995.75%
OC [kg]7.74 × 1050.04%
EC [kg]3.10 × 1050.01%
Ash [kg]2.27 × 1050.01%
SO4 [kg]2.68 × 1060.12%
Total2.17 × 109100.00%
Table 2. Range of ship type codes considered for each category.
Category Ship Type
Code Range
Fishing30
Wing-In-Ground2–29, 51
Sailing, pleasure, and high speed36–37
40–49
Passenger60–69
Cargo and tankers70–79
80–89
Special31–35
50, 52–59
Reserved and other10–19
38–39
90–91
Publisher’s Note: MDPI stays neutral with regard to jurisdictional claims in published maps and institutional affiliations.

